




The GATE 2026 Ecology and Evolution (EY) question paper is now available with detailed solutions for free download. GATE 2026 was conducted by IIT Guwahati on February 8, 2026, and the EY paper carried 65 questions, 10 from General Aptitude and 55 from the core subject, for a total of 3 hours.
| GATE 2026 Ecology and Evolution Question Paper with Solutions | Download PDF | Check Solutions |
GATE 2026 Ecology and Evolution Questions with Solutions
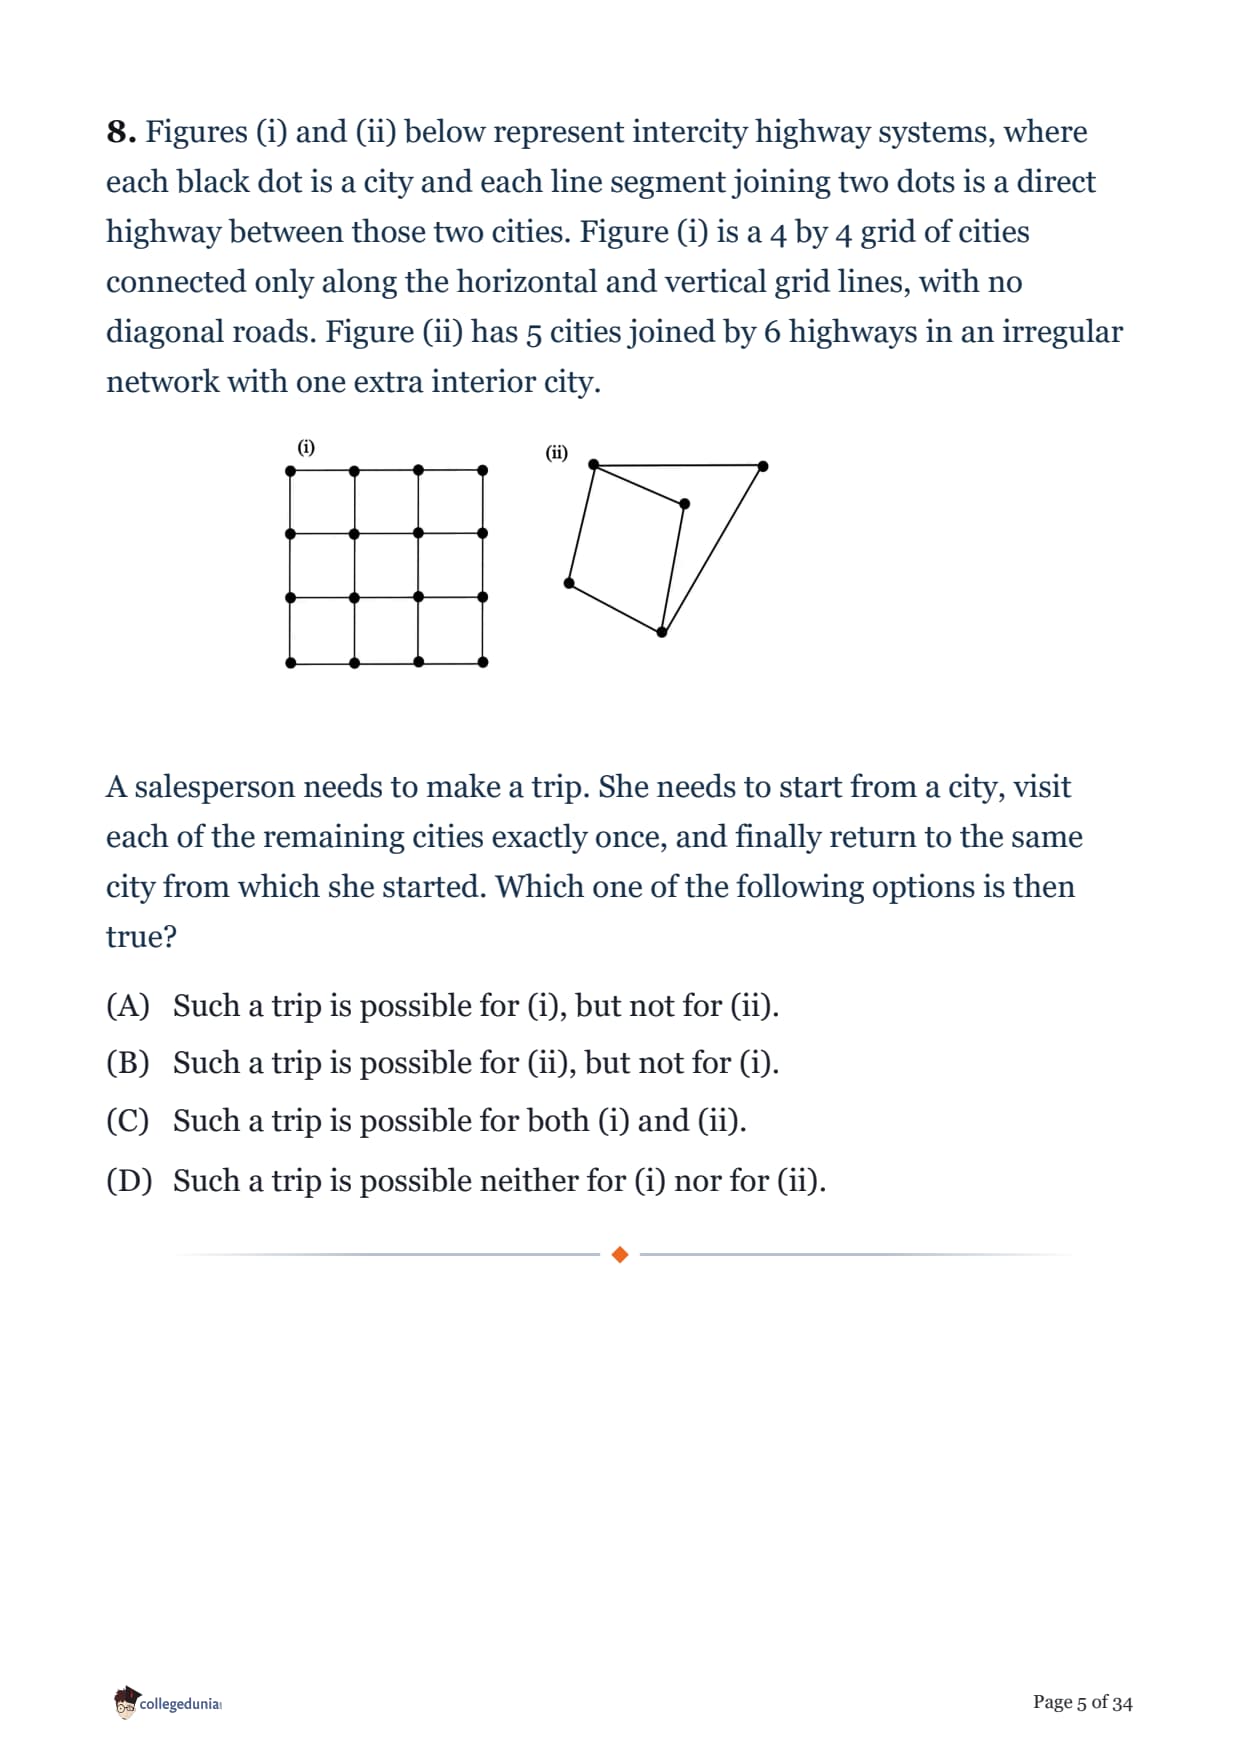
Expedite, Hasten, Hurry, __________
Fill the blank by choosing a word with a meaning similar to that of the words given above.
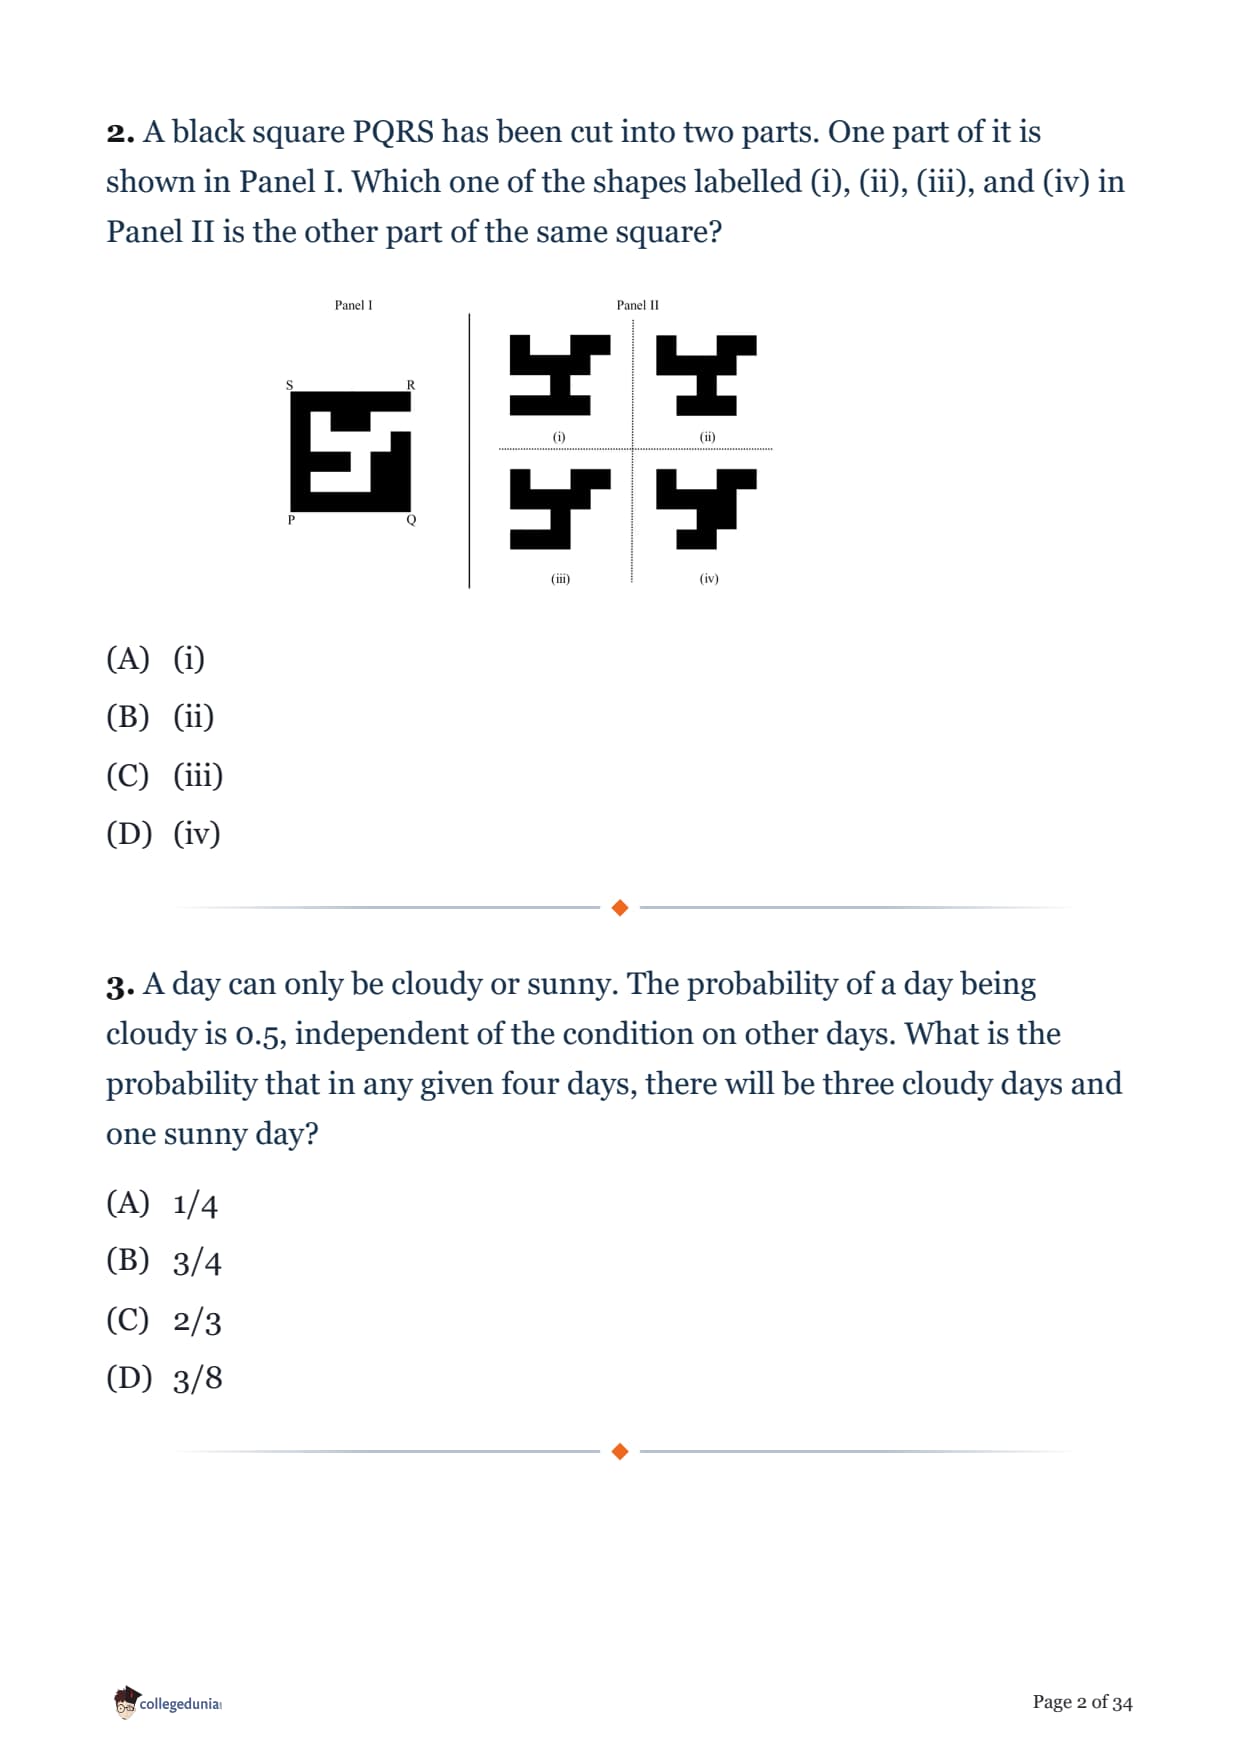
A black square PQRS has been cut into two parts. One part of it is shown in Panel I. Which one of the shapes labelled (i), (ii), (iii), and (iv) in Panel II is the other part of the same square?

A day can only be cloudy or sunny. The probability of a day being cloudy is 0.5, independent of the condition on other days. What is the probability that in any given four days, there will be three cloudy days and one sunny day?
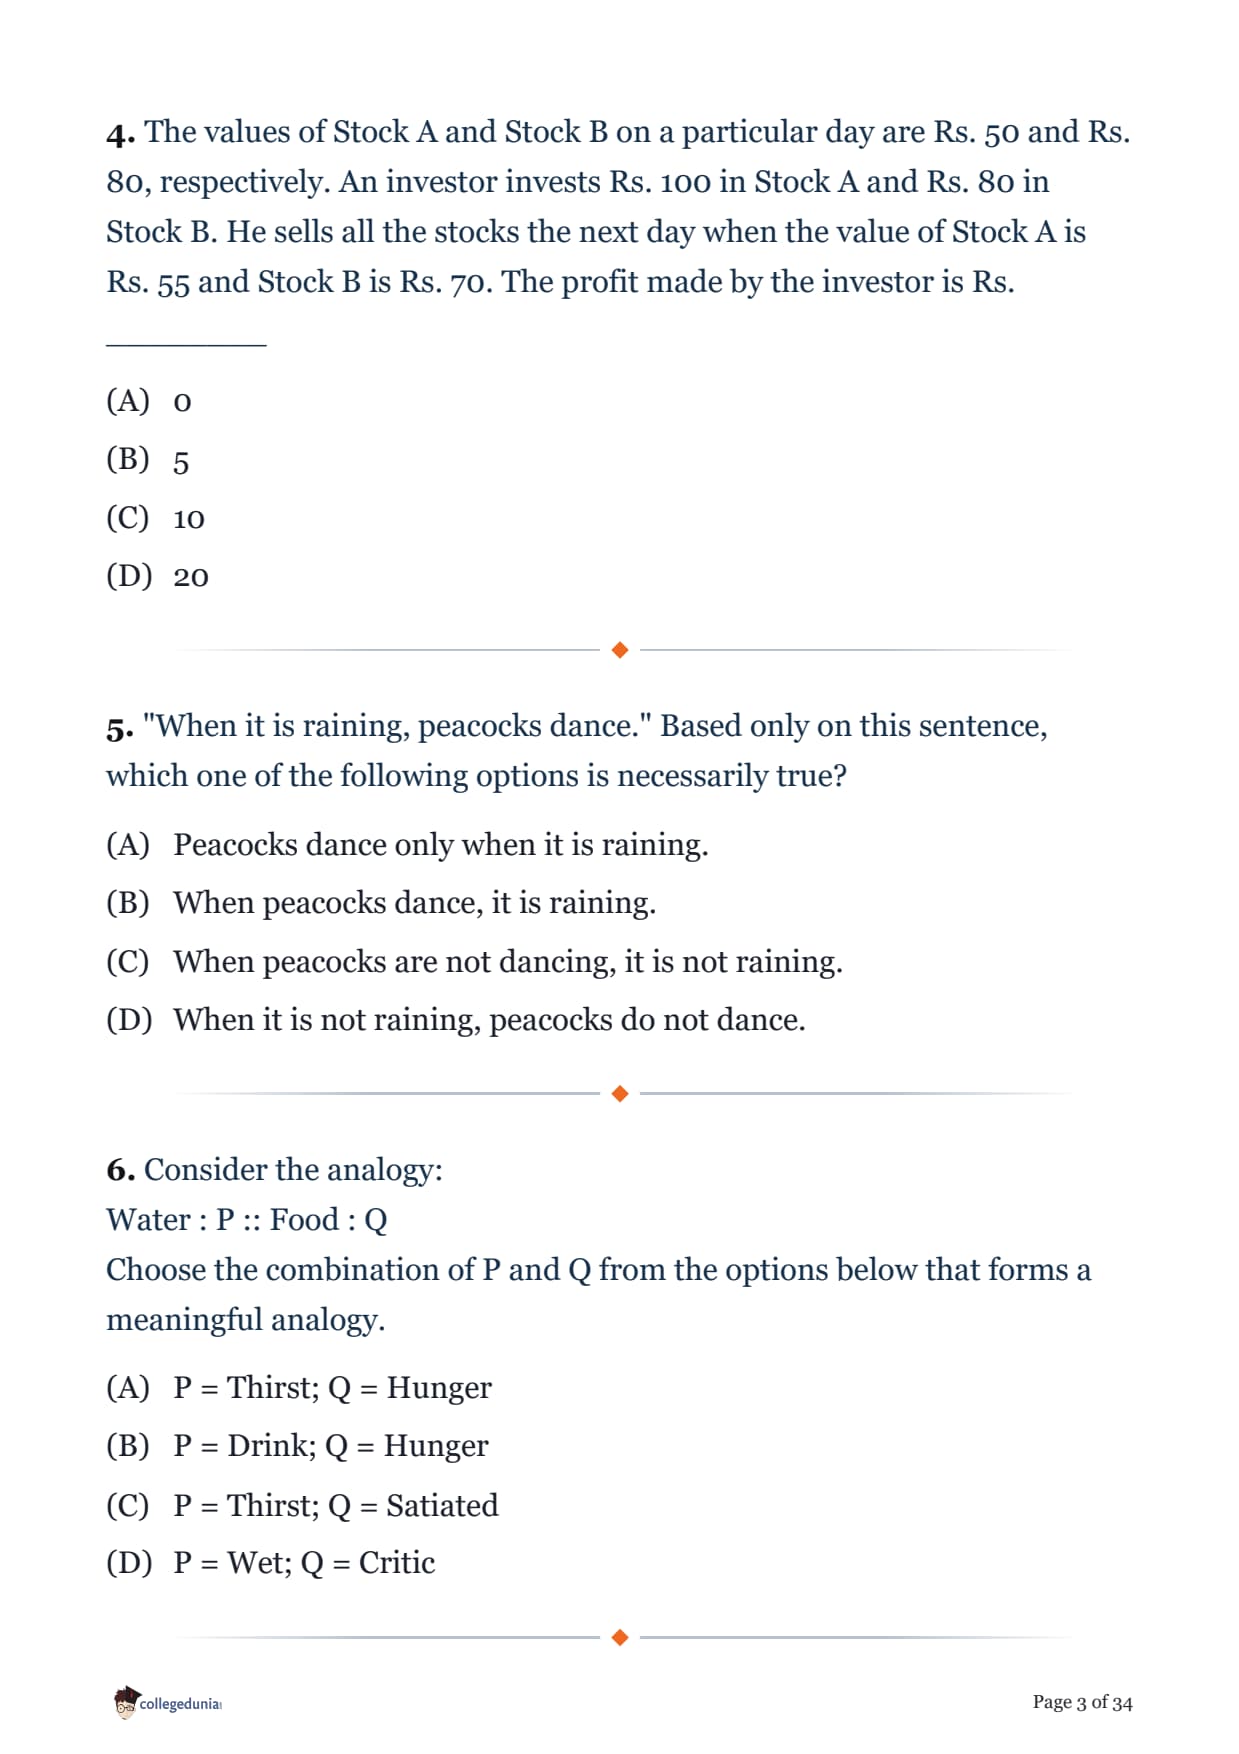
The values of Stock A and Stock B on a particular day are Rs. 50 and Rs. 80, respectively. An investor invests Rs. 100 in Stock A and Rs. 80 in Stock B. He sells all the stocks the next day when the value of Stock A is Rs. 55 and Stock B is Rs. 70. The profit made by the investor is Rs. ________
"When it is raining, peacocks dance." Based only on this sentence, which one of the following options is necessarily true?
Consider the analogy:
Water : P :: Food : Q
Choose the combination of P and Q from the options below that forms a meaningful analogy.
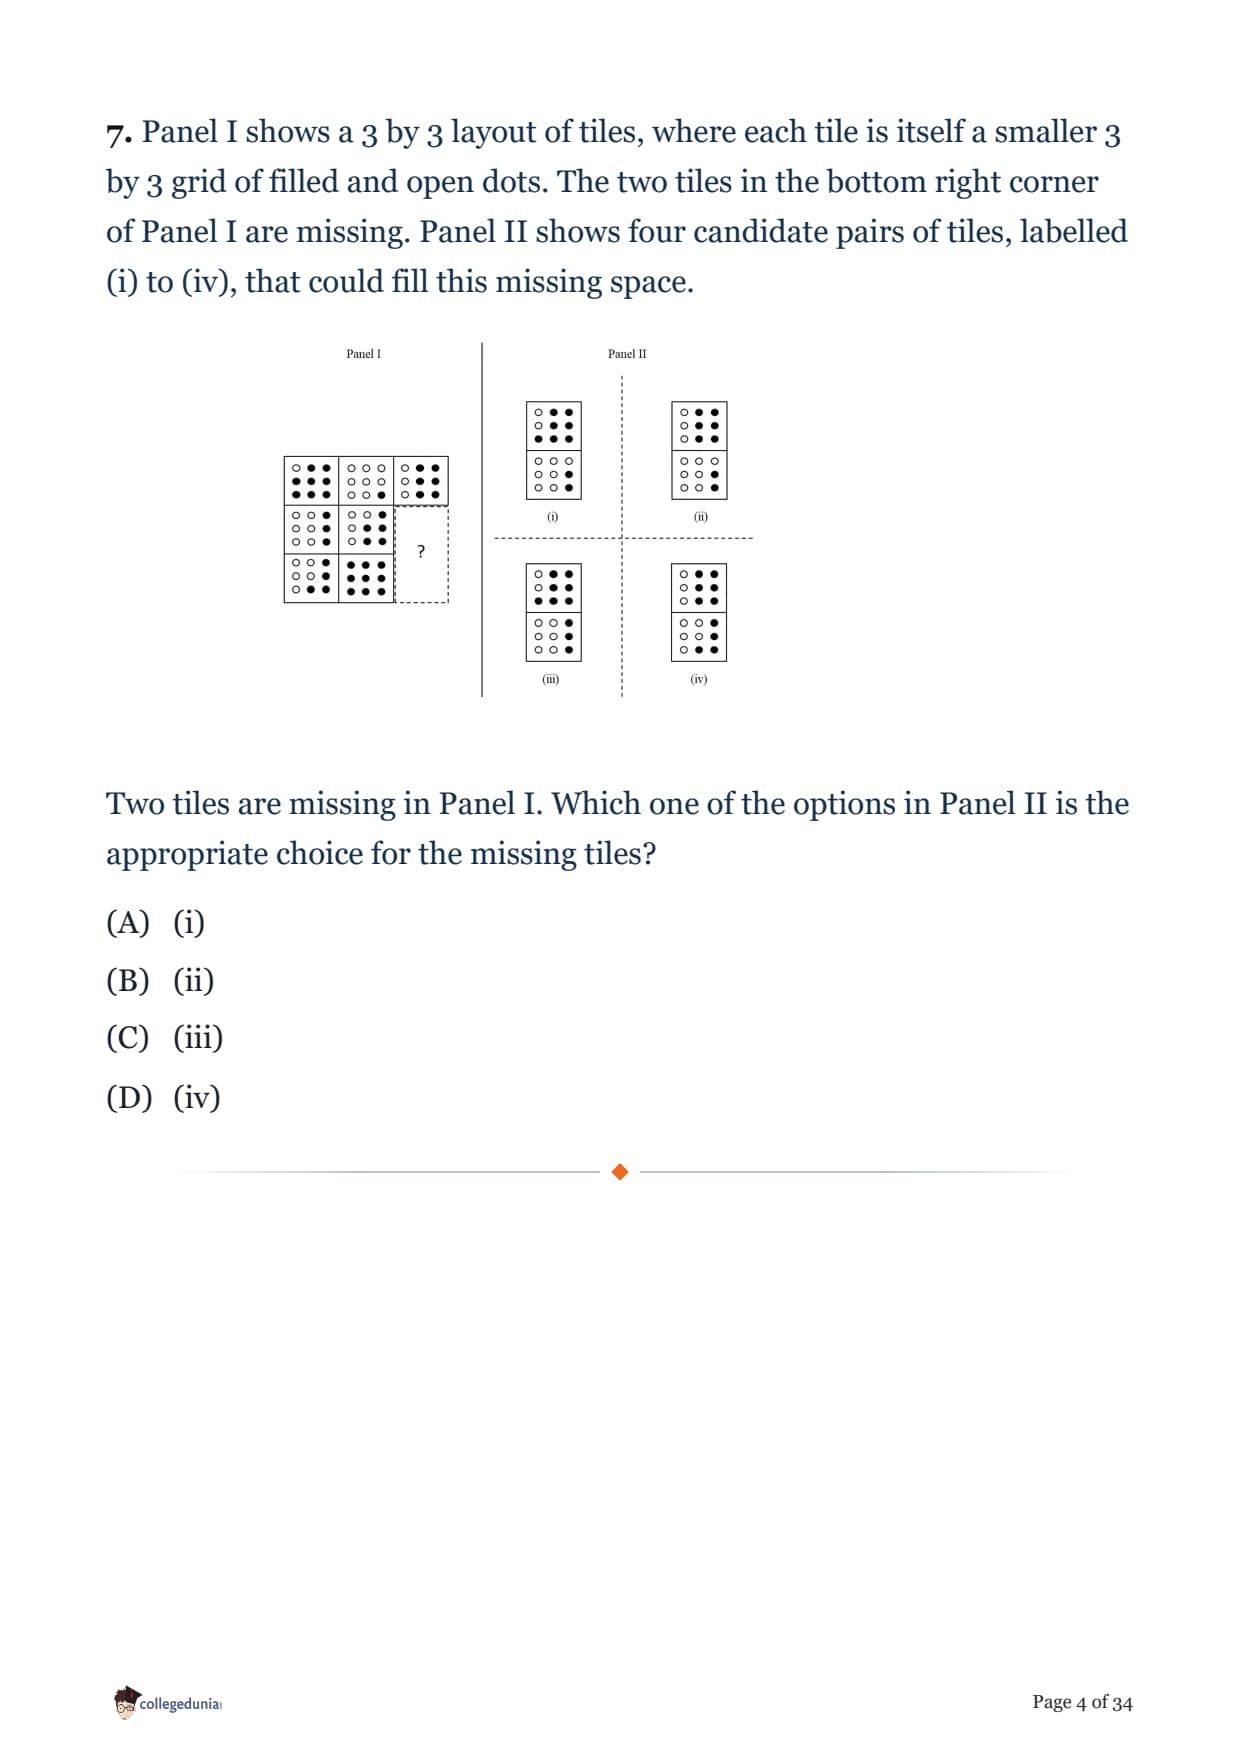
Panel I shows a 3 by 3 layout of tiles, where each tile is itself a smaller 3 by 3 grid of filled and open dots. The two tiles in the bottom right corner of Panel I are missing. Panel II shows four candidate pairs of tiles, labelled (i) to (iv), that could fill this missing space.

Two tiles are missing in Panel I. Which one of the options in Panel II is the appropriate choice for the missing tiles?
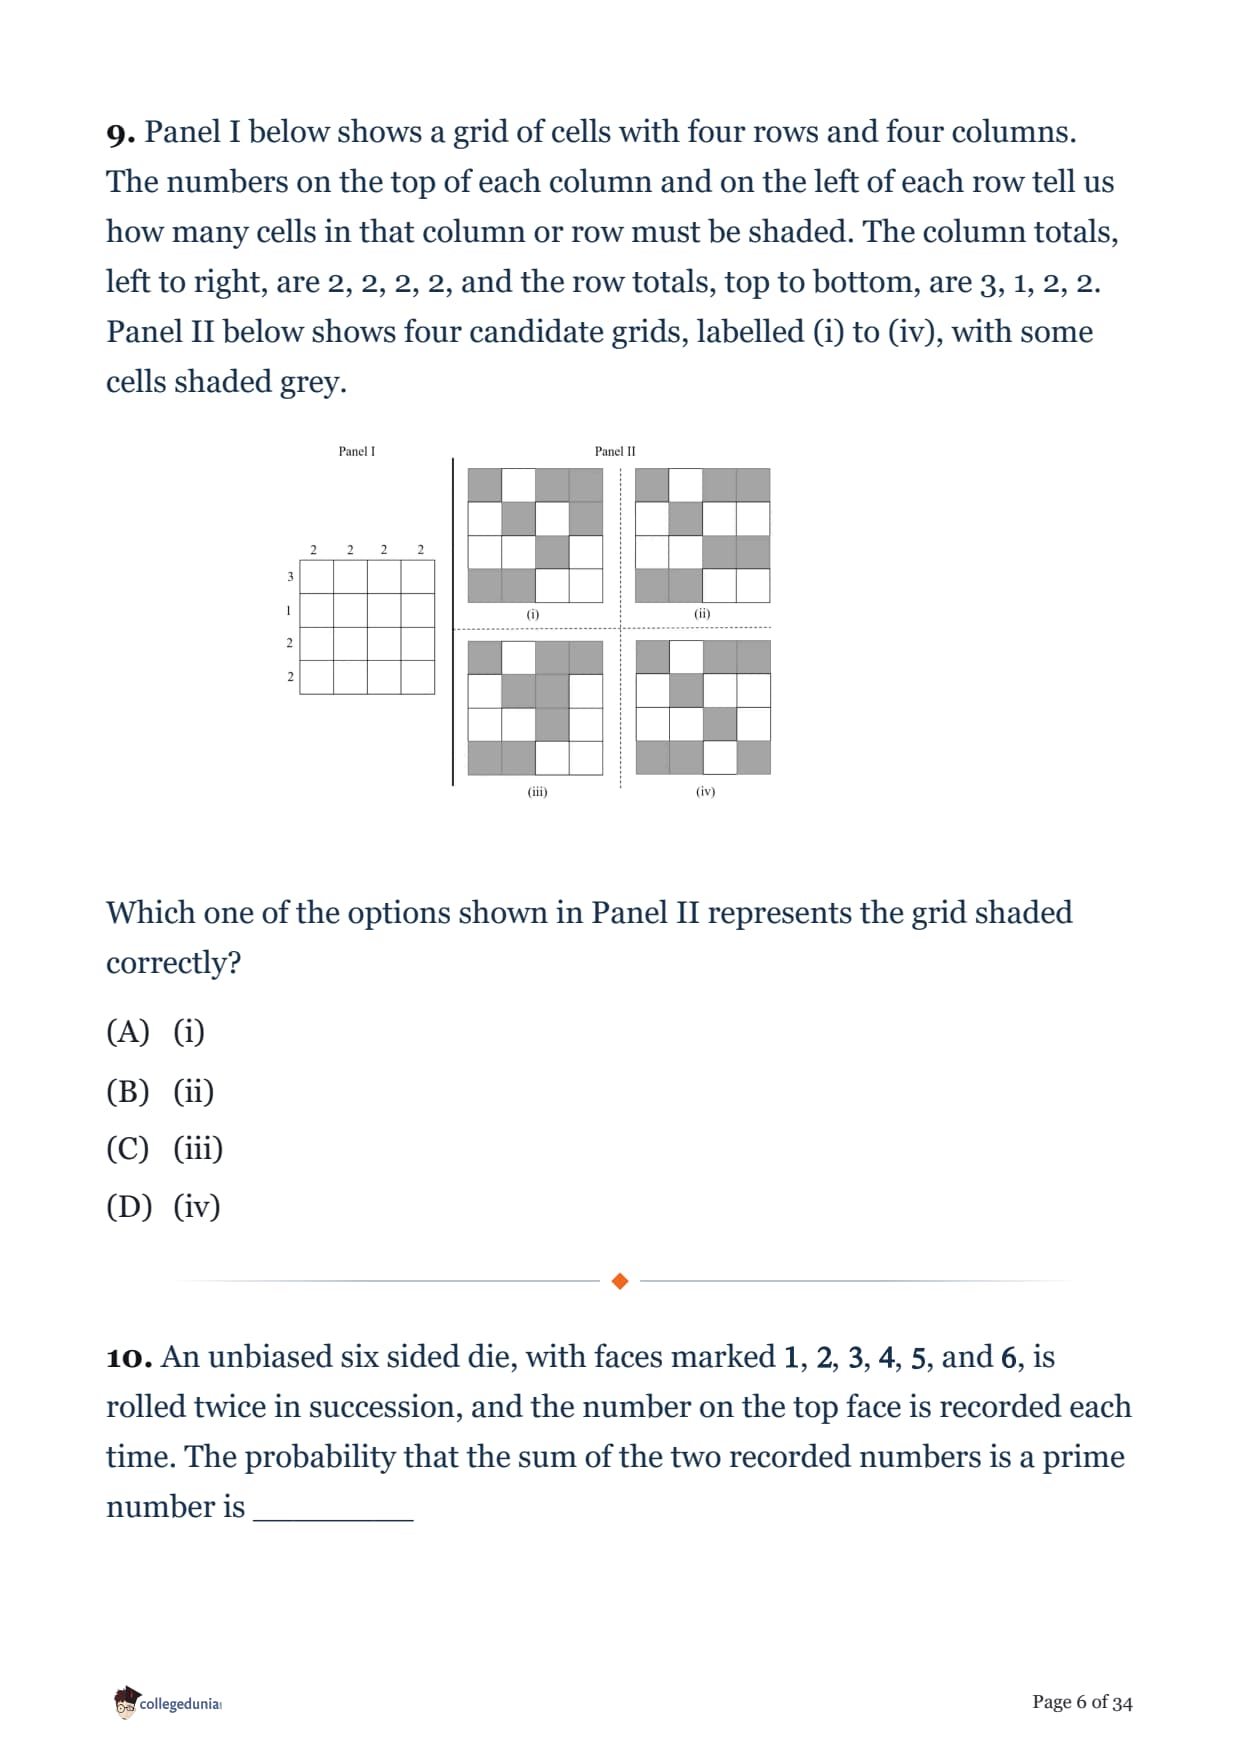
Figures (i) and (ii) below represent intercity highway systems, where each black dot is a city and each line segment joining two dots is a direct highway between those two cities. Figure (i) is a 4 by 4 grid of cities connected only along the horizontal and vertical grid lines, with no diagonal roads. Figure (ii) has 5 cities joined by 6 highways in an irregular network with one extra interior city.

A salesperson needs to make a trip. She needs to start from a city, visit each of the remaining cities exactly once, and finally return to the same city from which she started. Which one of the following options is then true?
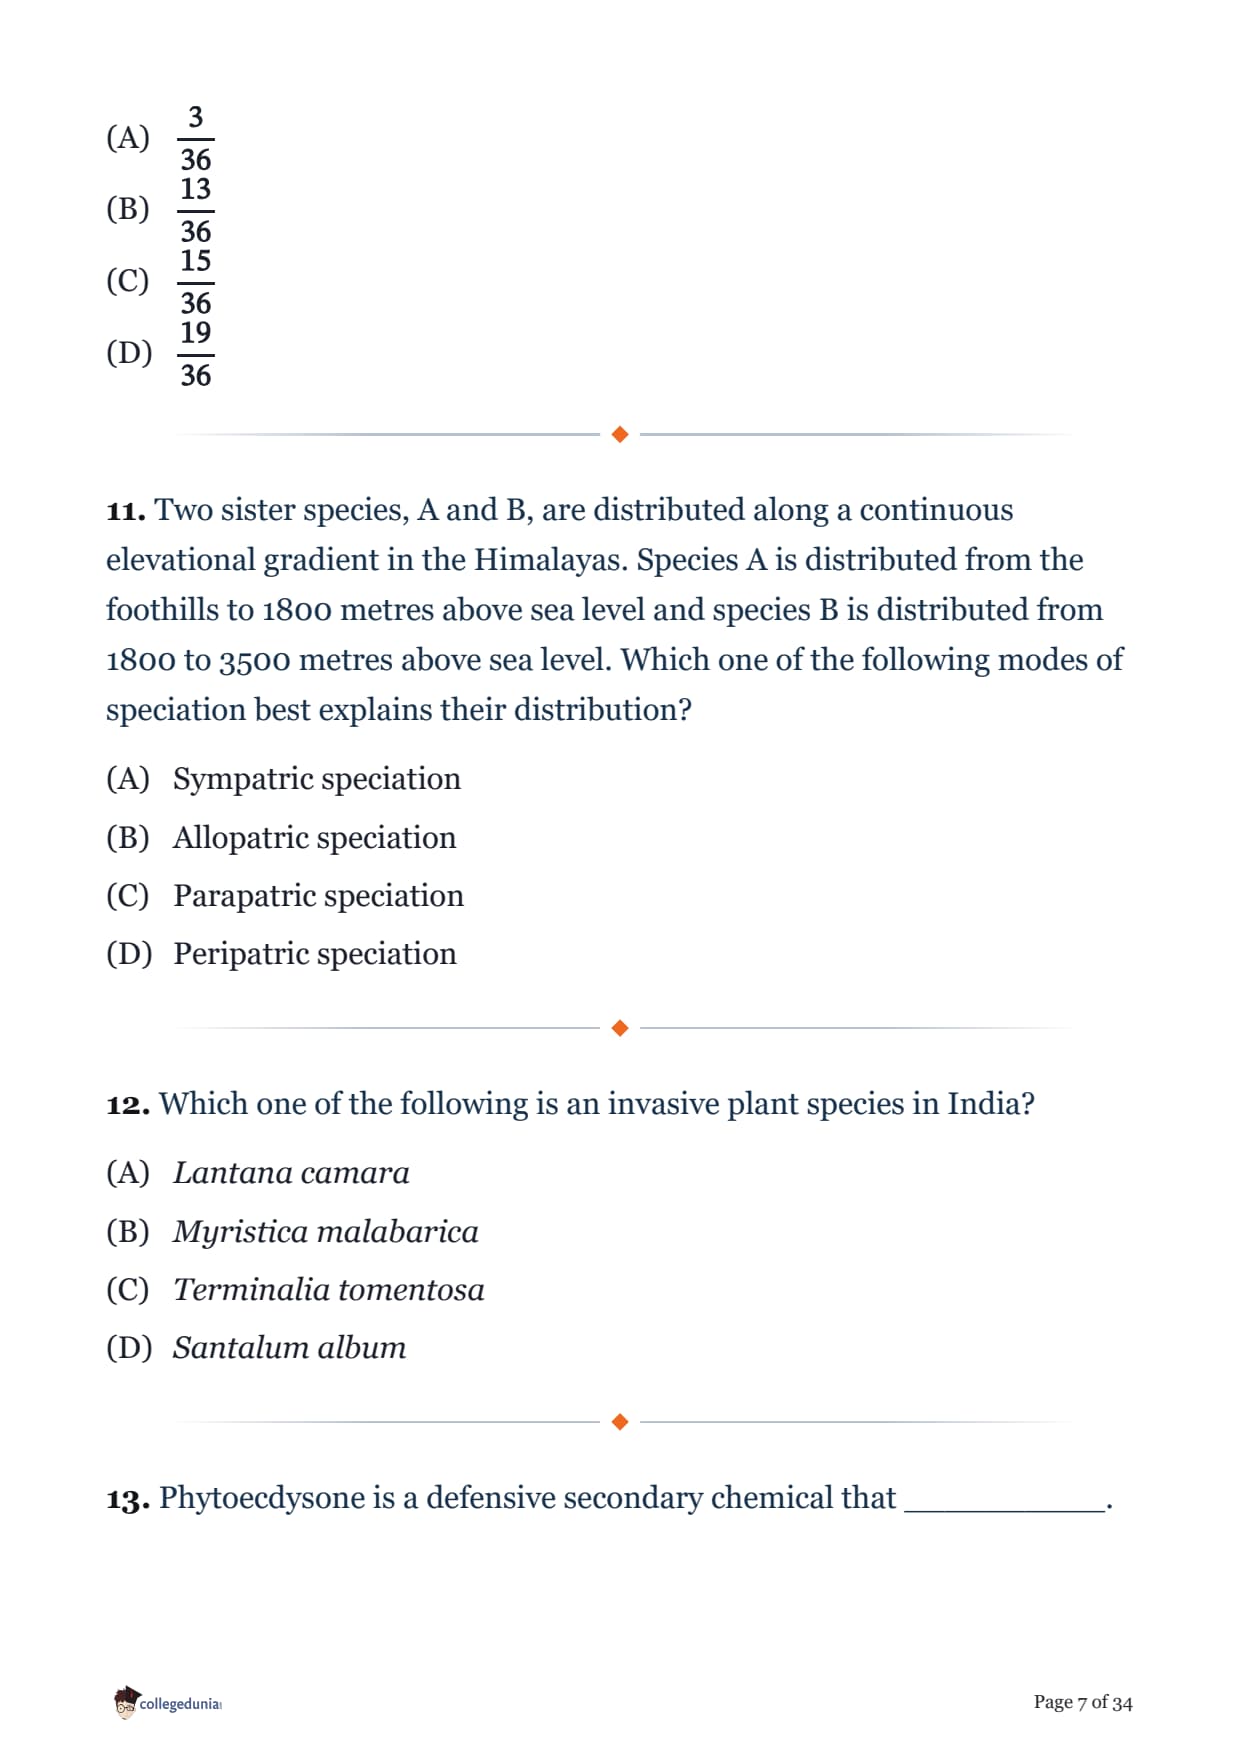
Panel I below shows a grid of cells with four rows and four columns. The numbers on the top of each column and on the left of each row tell us how many cells in that column or row must be shaded. The column totals, left to right, are 2, 2, 2, 2, and the row totals, top to bottom, are 3, 1, 2, 2. Panel II below shows four candidate grids, labelled (i) to (iv), with some cells shaded grey.

Which one of the options shown in Panel II represents the grid shaded correctly?
An unbiased six sided die, with faces marked \(1\), \(2\), \(3\), \(4\), \(5\), and \(6\), is rolled twice in succession, and the number on the top face is recorded each time. The probability that the sum of the two recorded numbers is a prime number is ________
Two sister species, A and B, are distributed along a continuous elevational gradient in the Himalayas. Species A is distributed from the foothills to 1800 metres above sea level and species B is distributed from 1800 to 3500 metres above sea level. Which one of the following modes of speciation best explains their distribution?
Which one of the following is an invasive plant species in India?
Phytoecdysone is a defensive secondary chemical that __________.
The physiologist Ivan Pavlov conducted an experiment on dogs, in which a bell was sounded every time food was provided. In this experiment, dogs eventually showed the salivary reflex (a response to food) when the bell was sounded, even if food was not provided. This is an example of ________.
Ecologists have studied the distributions of birds on archipelagos. Some studies found an interesting "checkerboard" pattern within island groups. Sister species were never present on the same island, even when the islands were very close to each other. Which one of the following processes best explains this checkerboard pattern?
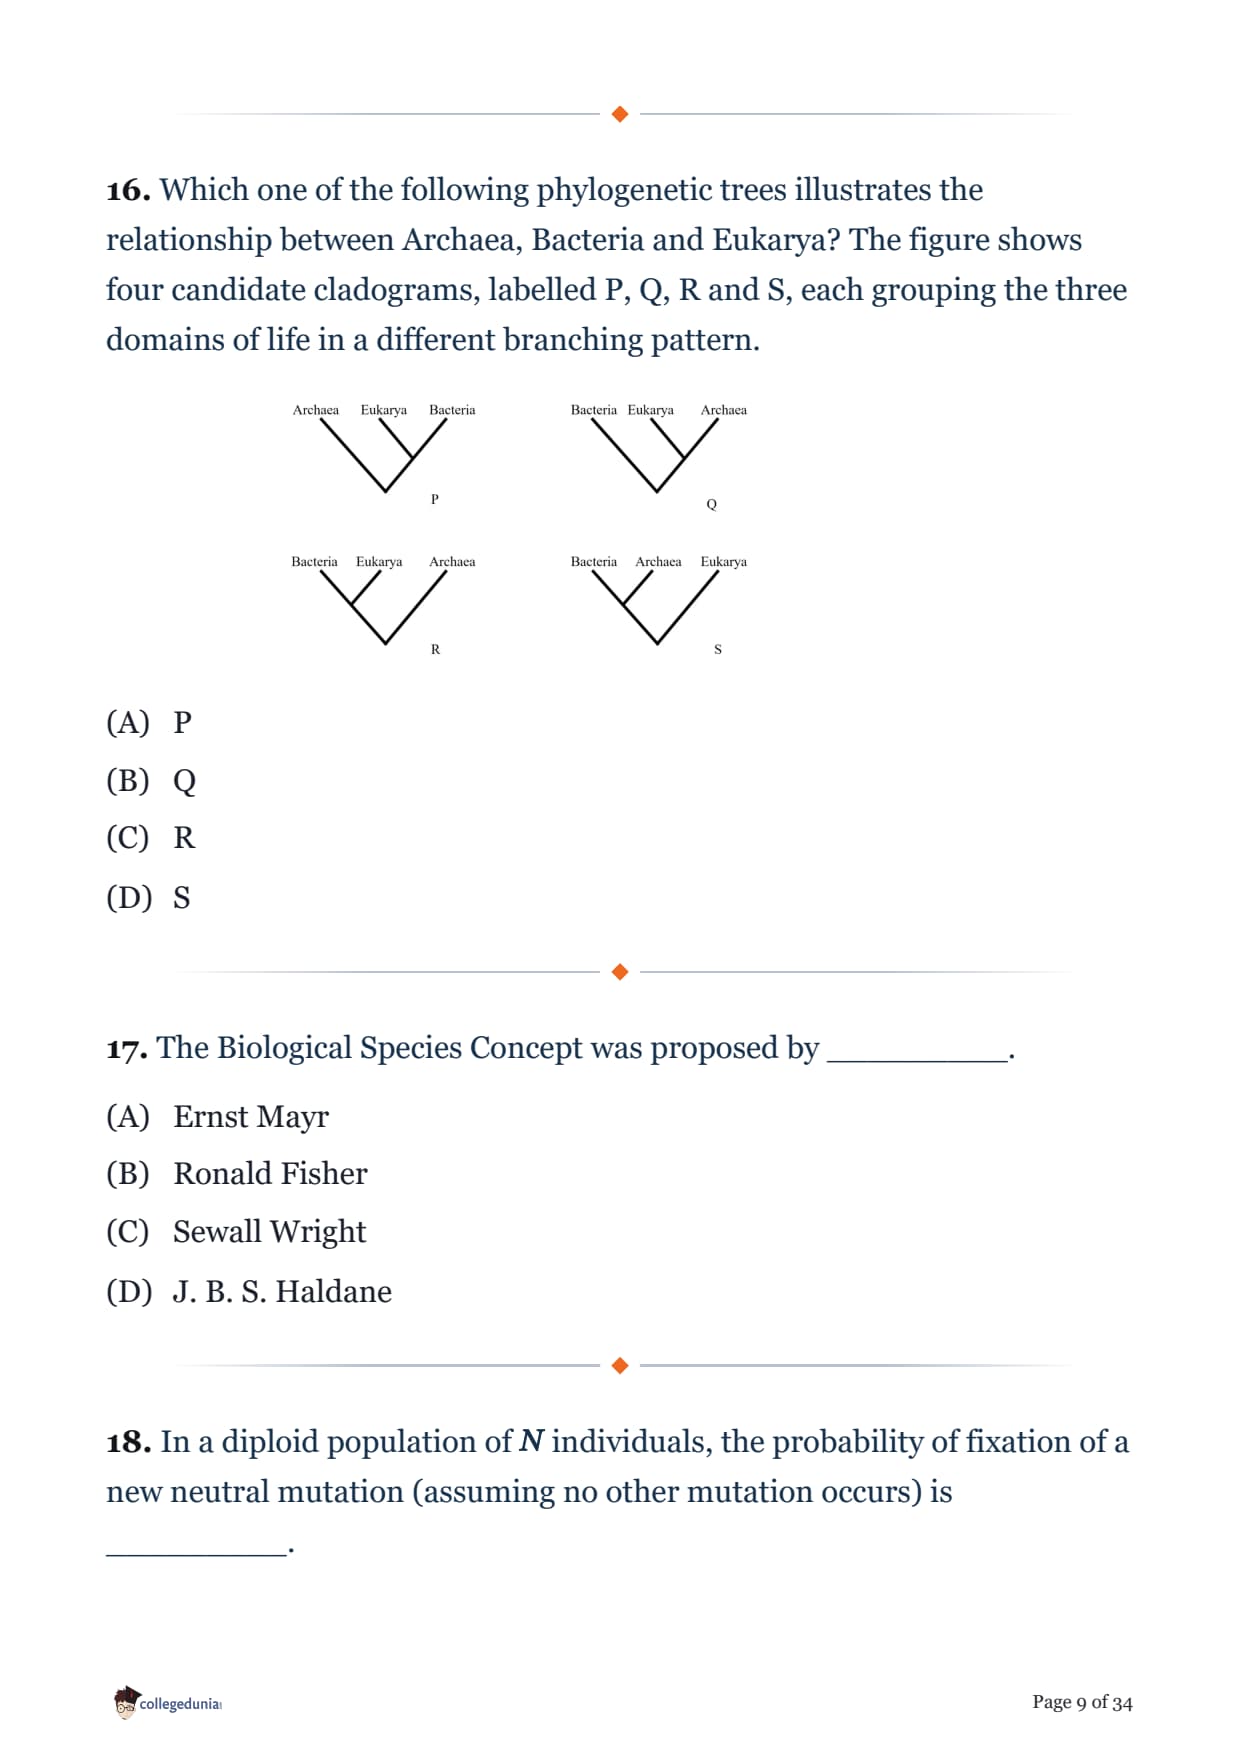
Which one of the following phylogenetic trees illustrates the relationship between Archaea, Bacteria and Eukarya? The figure shows four candidate cladograms, labelled P, Q, R and S, each grouping the three domains of life in a different branching pattern.

The Biological Species Concept was proposed by _________.
In a diploid population of \(N\) individuals, the probability of fixation of a new neutral mutation (assuming no other mutation occurs) is _________.
Species that co-occur in space and time tend to be similar to each other in traits such as tolerance to heat or to drought. This is most likely because of _________.
Which one of the following statements is true for most ants and bees?
Which one of the following concepts describes a co-evolutionary arms race between a pathogen and its host?
A flask containing nutrient-rich media is seeded with 100 isogenic bacteria. Assuming that no bacteria die in the flask, after approximately how many generations will the population reach a size of \(10^5\)?
The field of allometry assesses how species traits scale with each other. Given the relationship between metabolic rate and body mass, which one of the following statements is true?
According to life history theory, when parents can only provide limited nutrients and care to their offspring, the number and size of the offspring are expected to be ___________.
Which one of the following elements cycles the LEAST (mass per year) through the atmosphere?
The colour and markings of the eggs of the common cuckoo (Cuculus canorus) are similar to those of the eggs of the great reed warbler (Acrocephalus arundinaceus). Which one or more of the following options explain(s) this similarity?
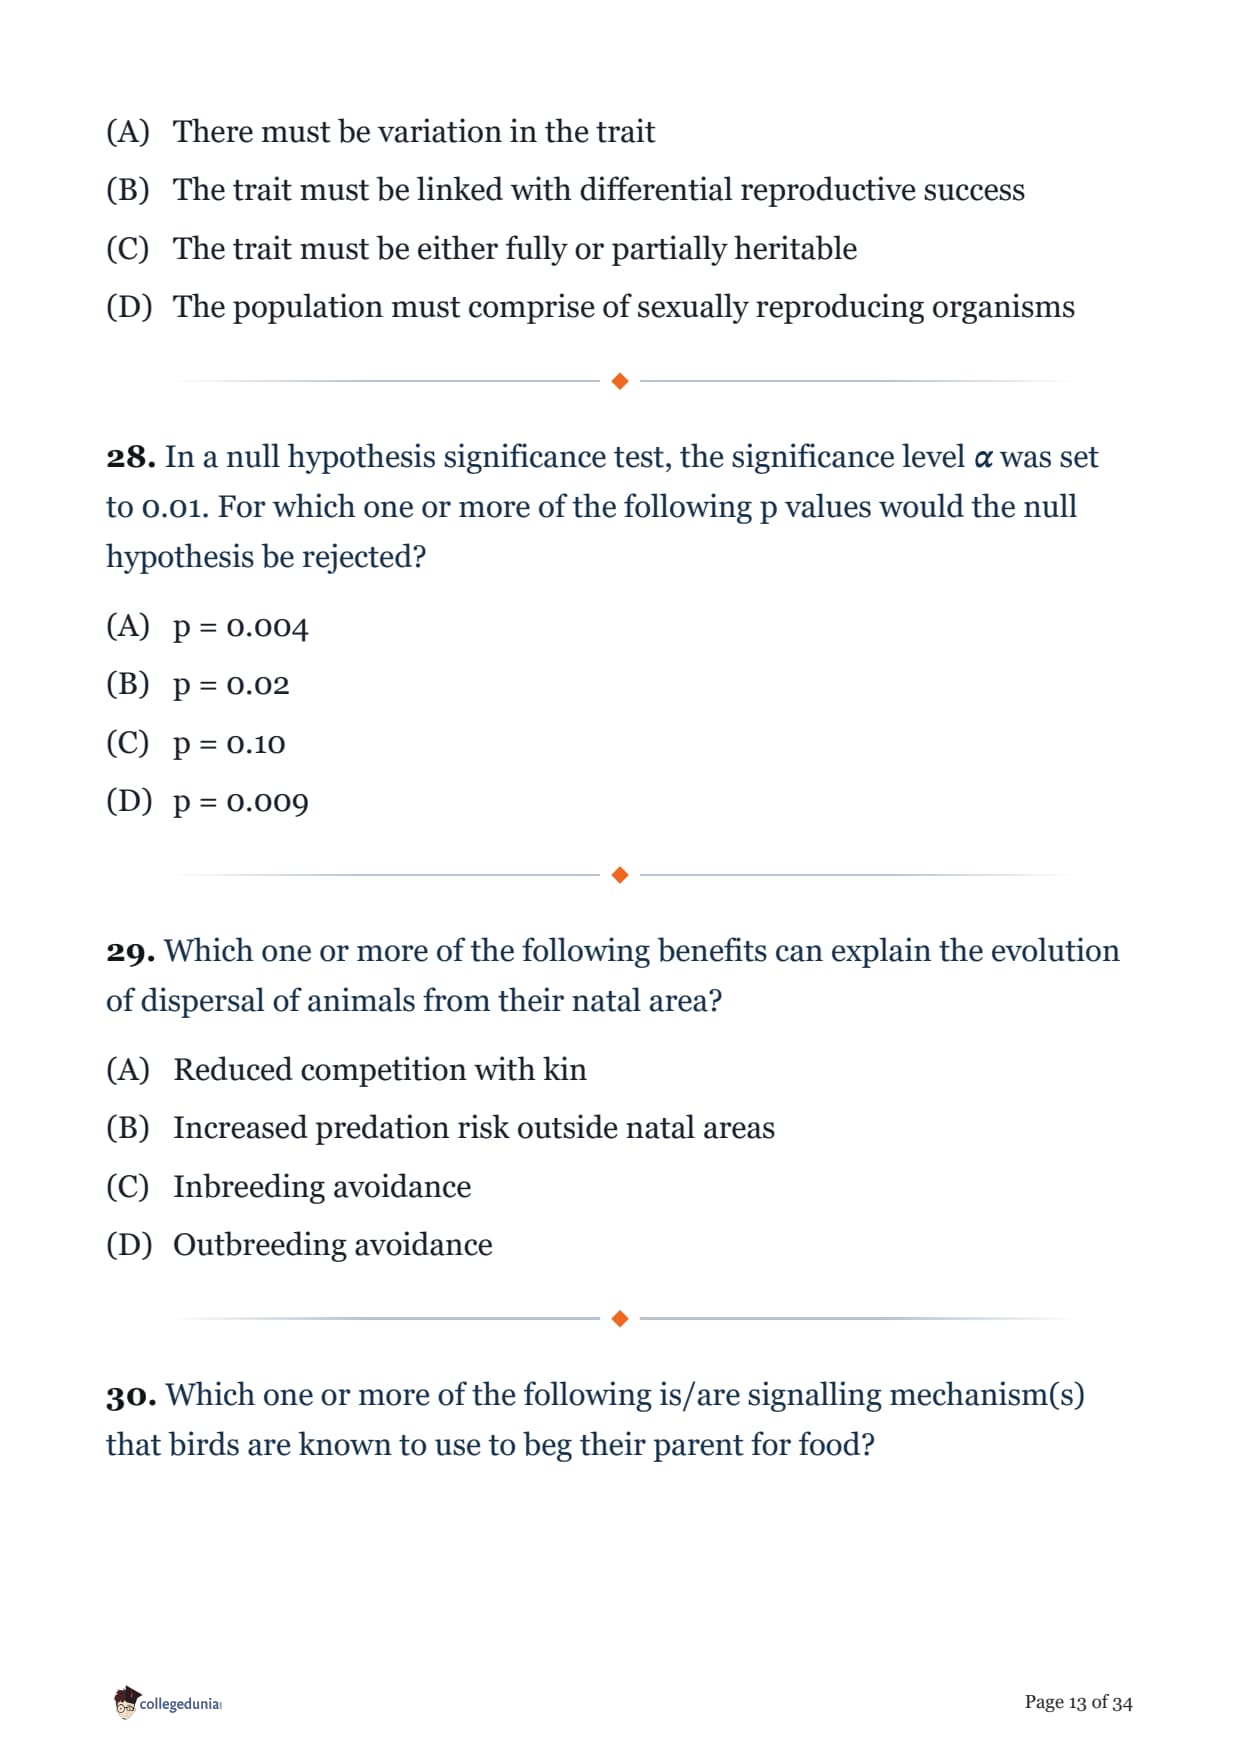
Which one or more of the following is/are NOT essential for evolution by natural selection to take place in a population?
In a null hypothesis significance test, the significance level \(\alpha\) was set to 0.01. For which one or more of the following p values would the null hypothesis be rejected?
Which one or more of the following benefits can explain the evolution of dispersal of animals from their natal area?
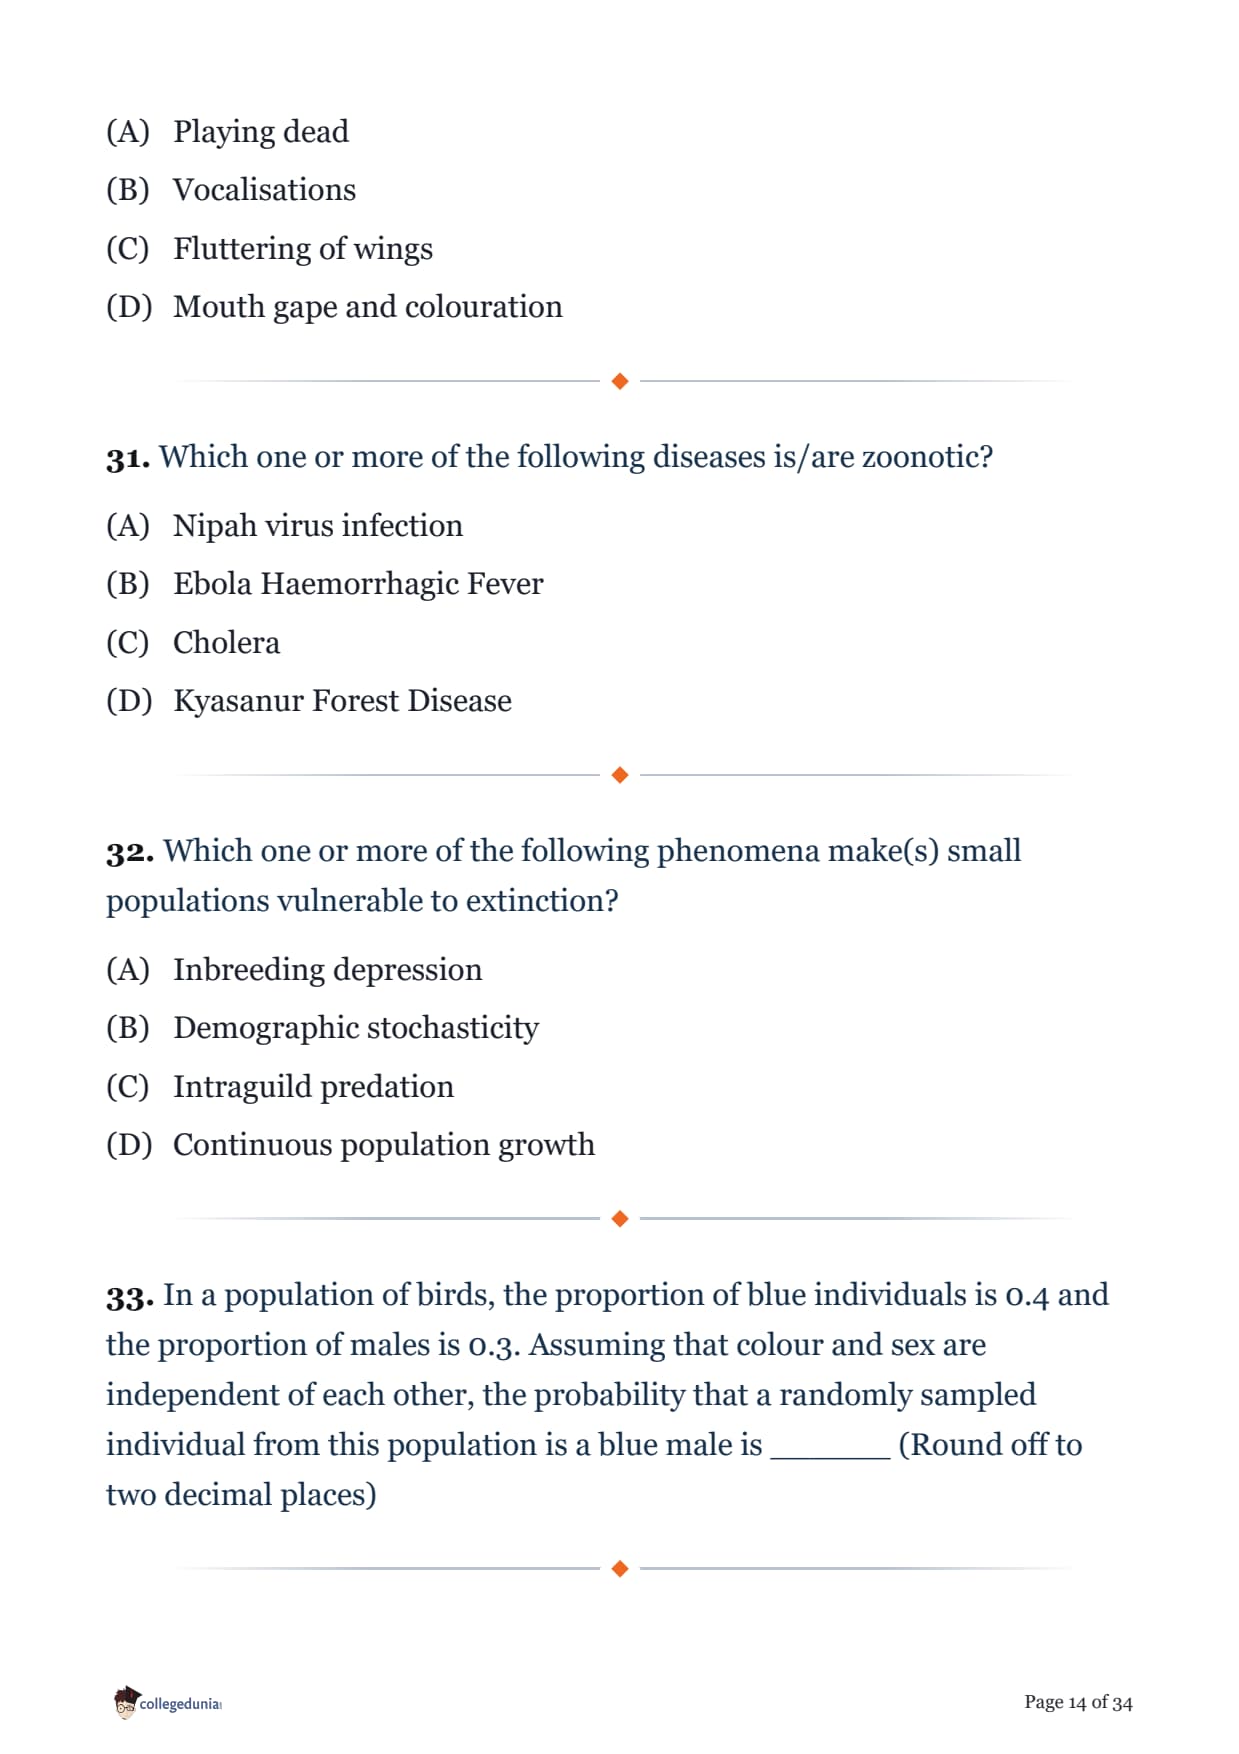
Which one or more of the following is/are signalling mechanism(s) that birds are known to use to beg their parent for food?
Which one or more of the following diseases is/are zoonotic?
Which one or more of the following phenomena make(s) small populations vulnerable to extinction?
In a population of birds, the proportion of blue individuals is 0.4 and the proportion of males is 0.3. Assuming that colour and sex are independent of each other, the probability that a randomly sampled individual from this population is a blue male is ______ (Round off to two decimal places)
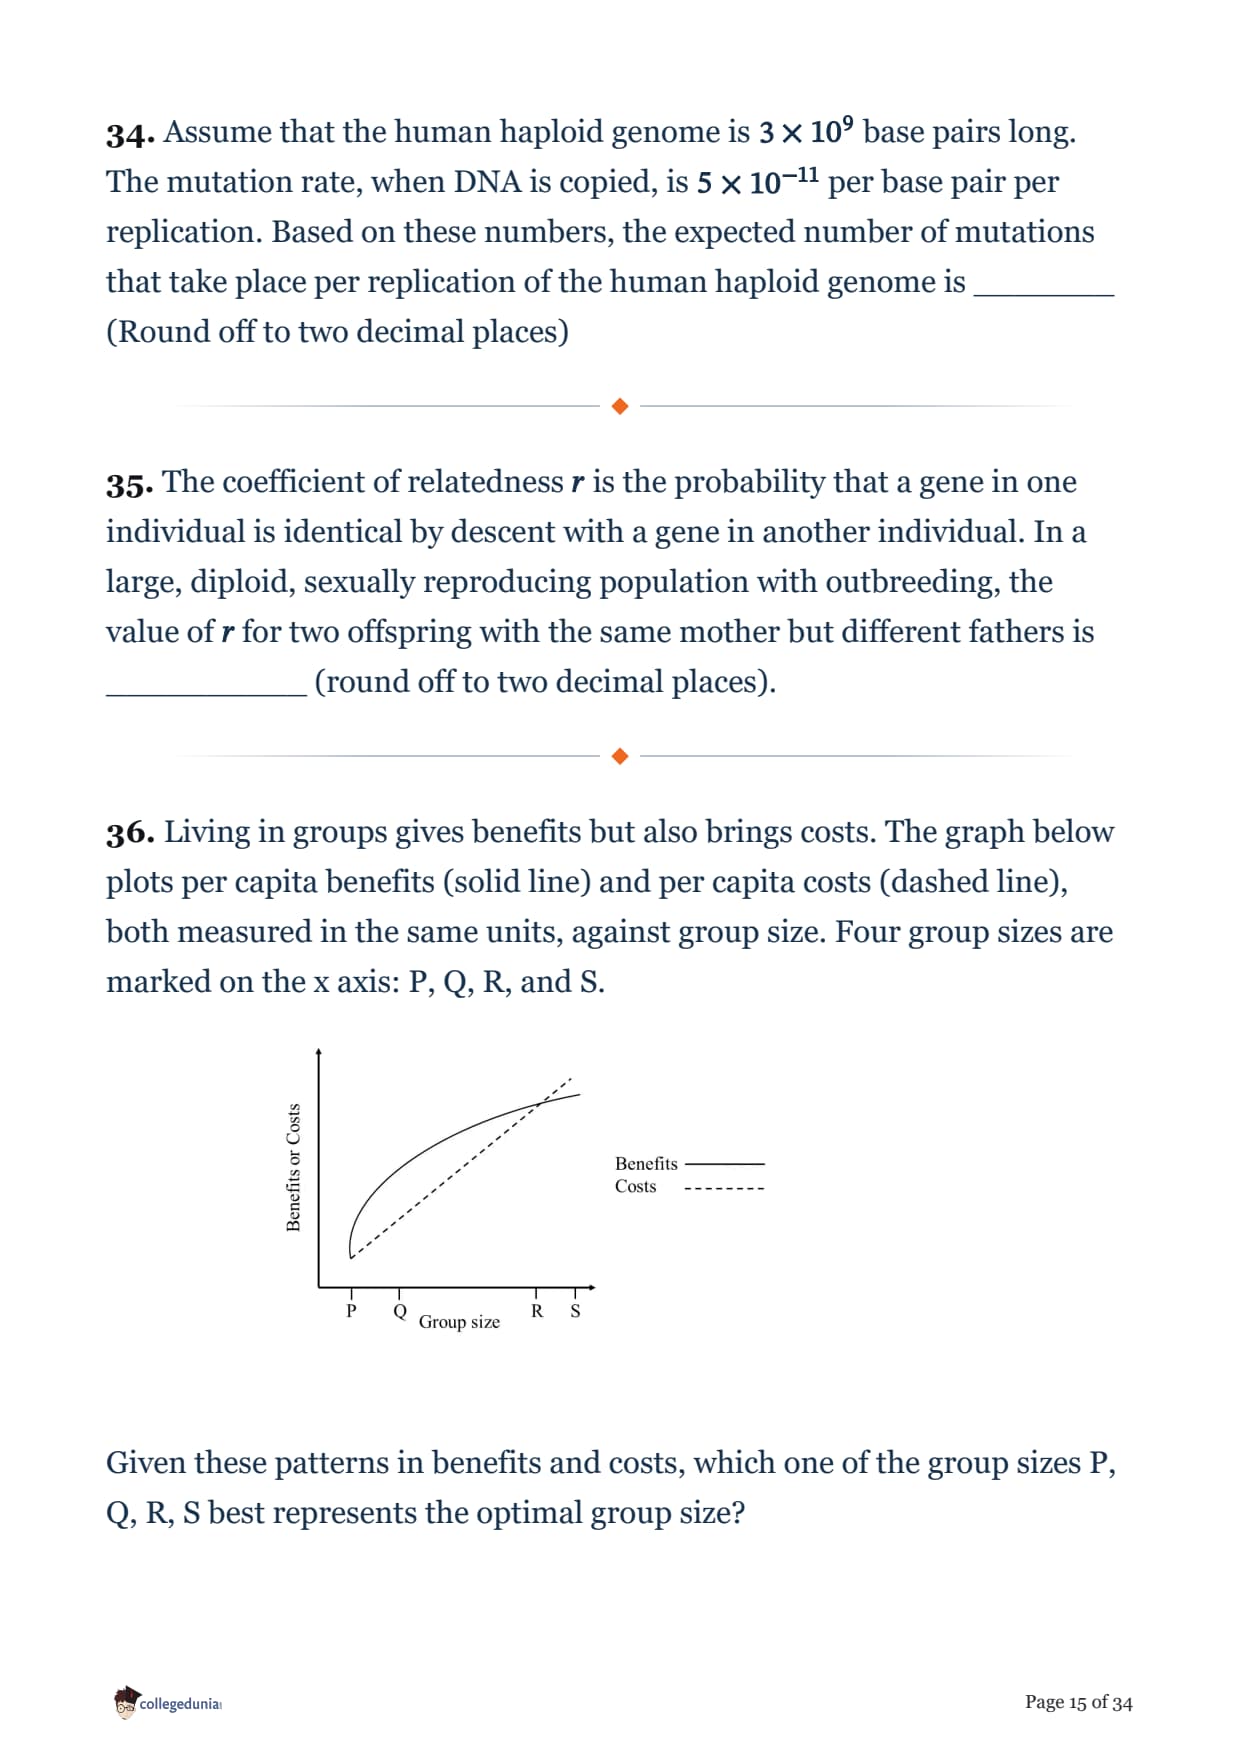
Assume that the human haploid genome is \(3 \times 10^{9}\) base pairs long. The mutation rate, when DNA is copied, is \(5 \times 10^{-11}\) per base pair per replication. Based on these numbers, the expected number of mutations that take place per replication of the human haploid genome is _______ (Round off to two decimal places)
The coefficient of relatedness \(r\) is the probability that a gene in one individual is identical by descent with a gene in another individual. In a large, diploid, sexually reproducing population with outbreeding, the value of \(r\) for two offspring with the same mother but different fathers is __________ (round off to two decimal places).
Living in groups gives benefits but also brings costs. The graph below plots per capita benefits (solid line) and per capita costs (dashed line), both measured in the same units, against group size. Four group sizes are marked on the x axis: P, Q, R, and S.

Given these patterns in benefits and costs, which one of the group sizes P, Q, R, S best represents the optimal group size?
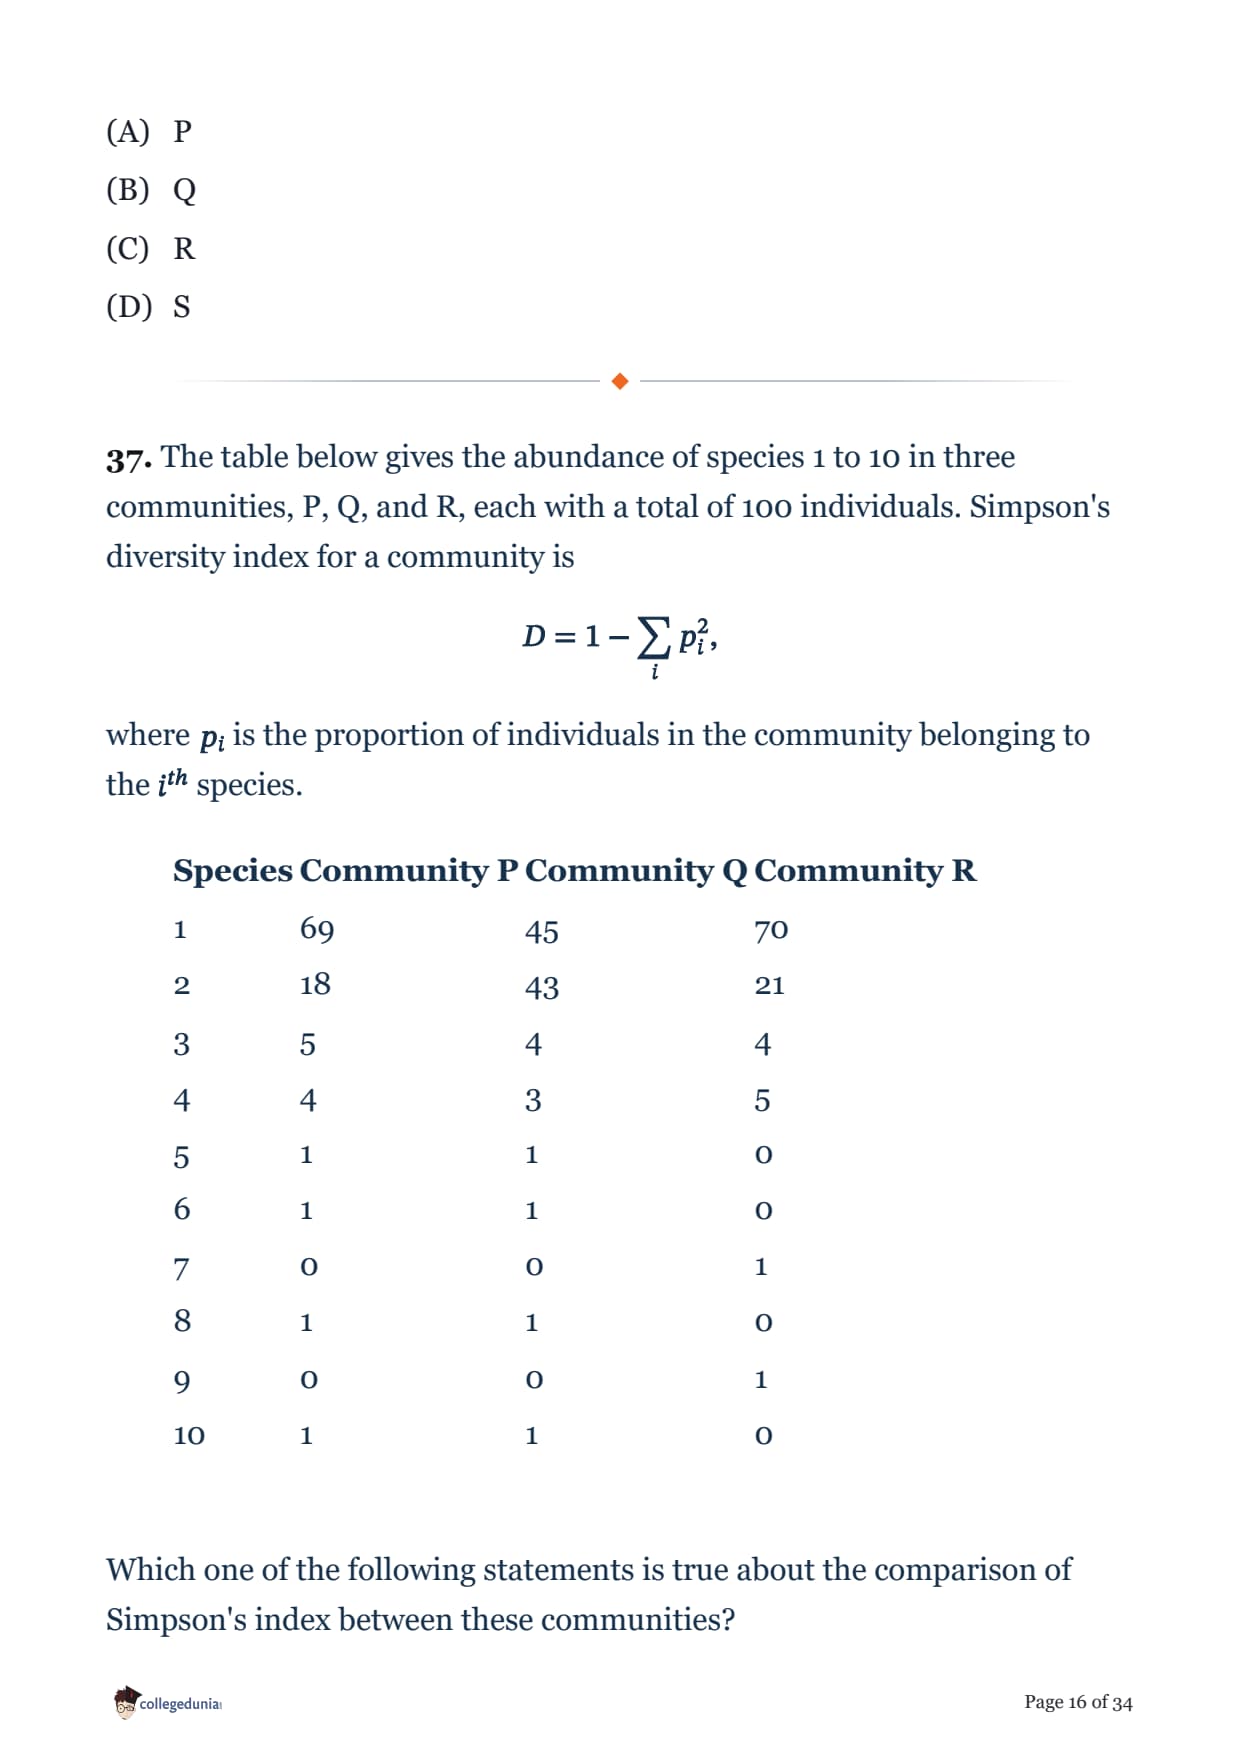
The table below gives the abundance of species 1 to 10 in three communities, P, Q, and R, each with a total of 100 individuals. Simpson's diversity index for a community is
\[
D = 1 - \sum_i p_i^2,
\]
where \(p_i\) is the proportion of individuals in the community belonging to the \(i^{th}\) species.
| Species | Community P | Community Q | Community R |
|---|---|---|---|
| 1 | 69 | 45 | 70 |
| 2 | 18 | 43 | 21 |
| 3 | 5 | 4 | 4 |
| 4 | 4 | 3 | 5 |
| 5 | 1 | 1 | 0 |
| 6 | 1 | 1 | 0 |
| 7 | 0 | 0 | 1 |
| 8 | 1 | 1 | 0 |
| 9 | 0 | 0 | 1 |
| 10 | 1 | 1 | 0 |
Which one of the following statements is true about the comparison of Simpson's index between these communities?
Many species of reef fish change sex once during the course of their lives. In these fish, a bigger body size increases an individual's competitive ability. When strong male-male competition creates high variance in fitness among males, which one of the following scenarios is most likely?
When comparing life-history traits across animal species, which one of the following relationships is LEAST expected under r-selection and K-selection theory?
Two isolated populations M and N have population sizes of \(100\) and \(1000\) individuals, respectively. The starting allele frequencies \(p\) and \(q\) are \(0.5\) in both populations. Assuming no selection, which one of the following is expected after \(100\) generations?
Two bacterial variants are growing together in the same flask. At any relative frequency of the two variants, the population growth rate of the rarer variant is higher. This is an example of ________.
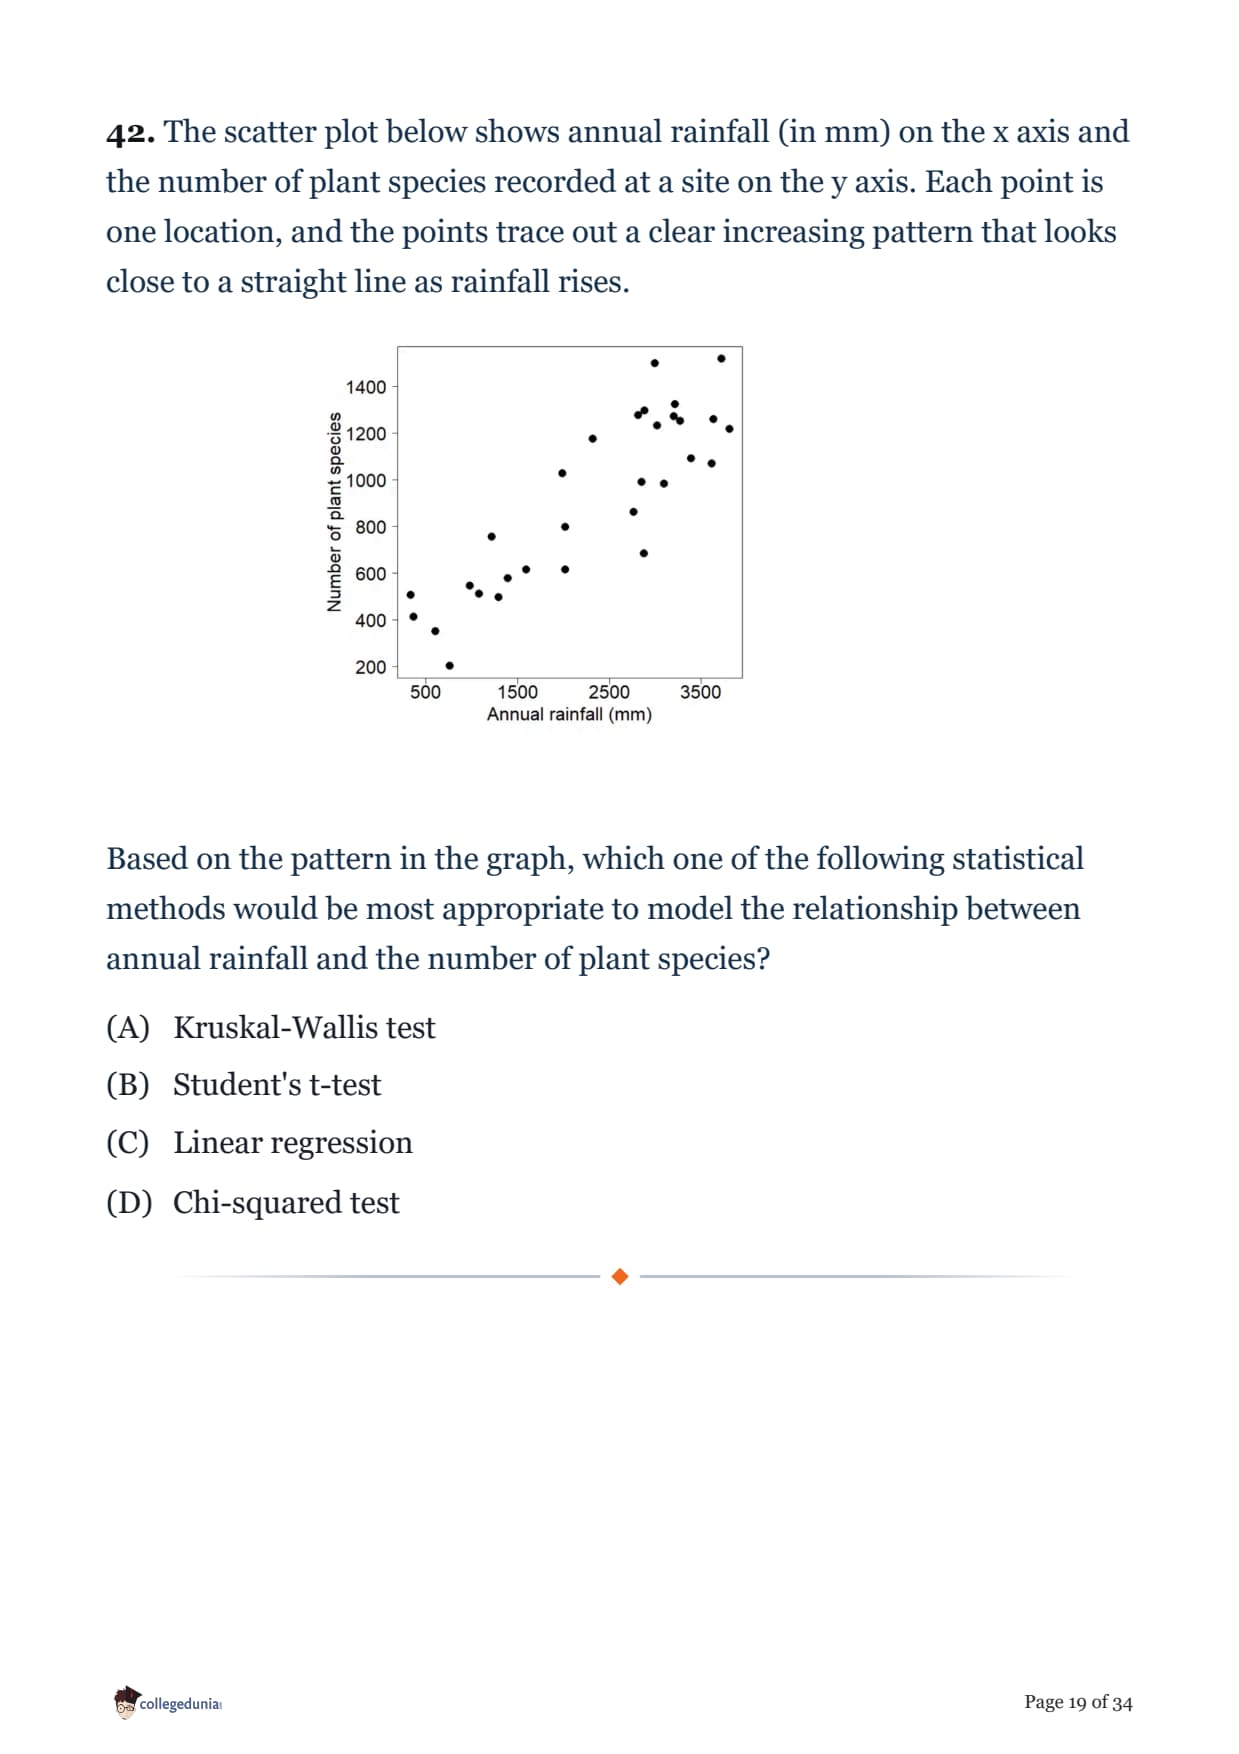
The scatter plot below shows annual rainfall (in mm) on the x axis and the number of plant species recorded at a site on the y axis. Each point is one location, and the points trace out a clear increasing pattern that looks close to a straight line as rainfall rises.

Based on the pattern in the graph, which one of the following statistical methods would be most appropriate to model the relationship between annual rainfall and the number of plant species?
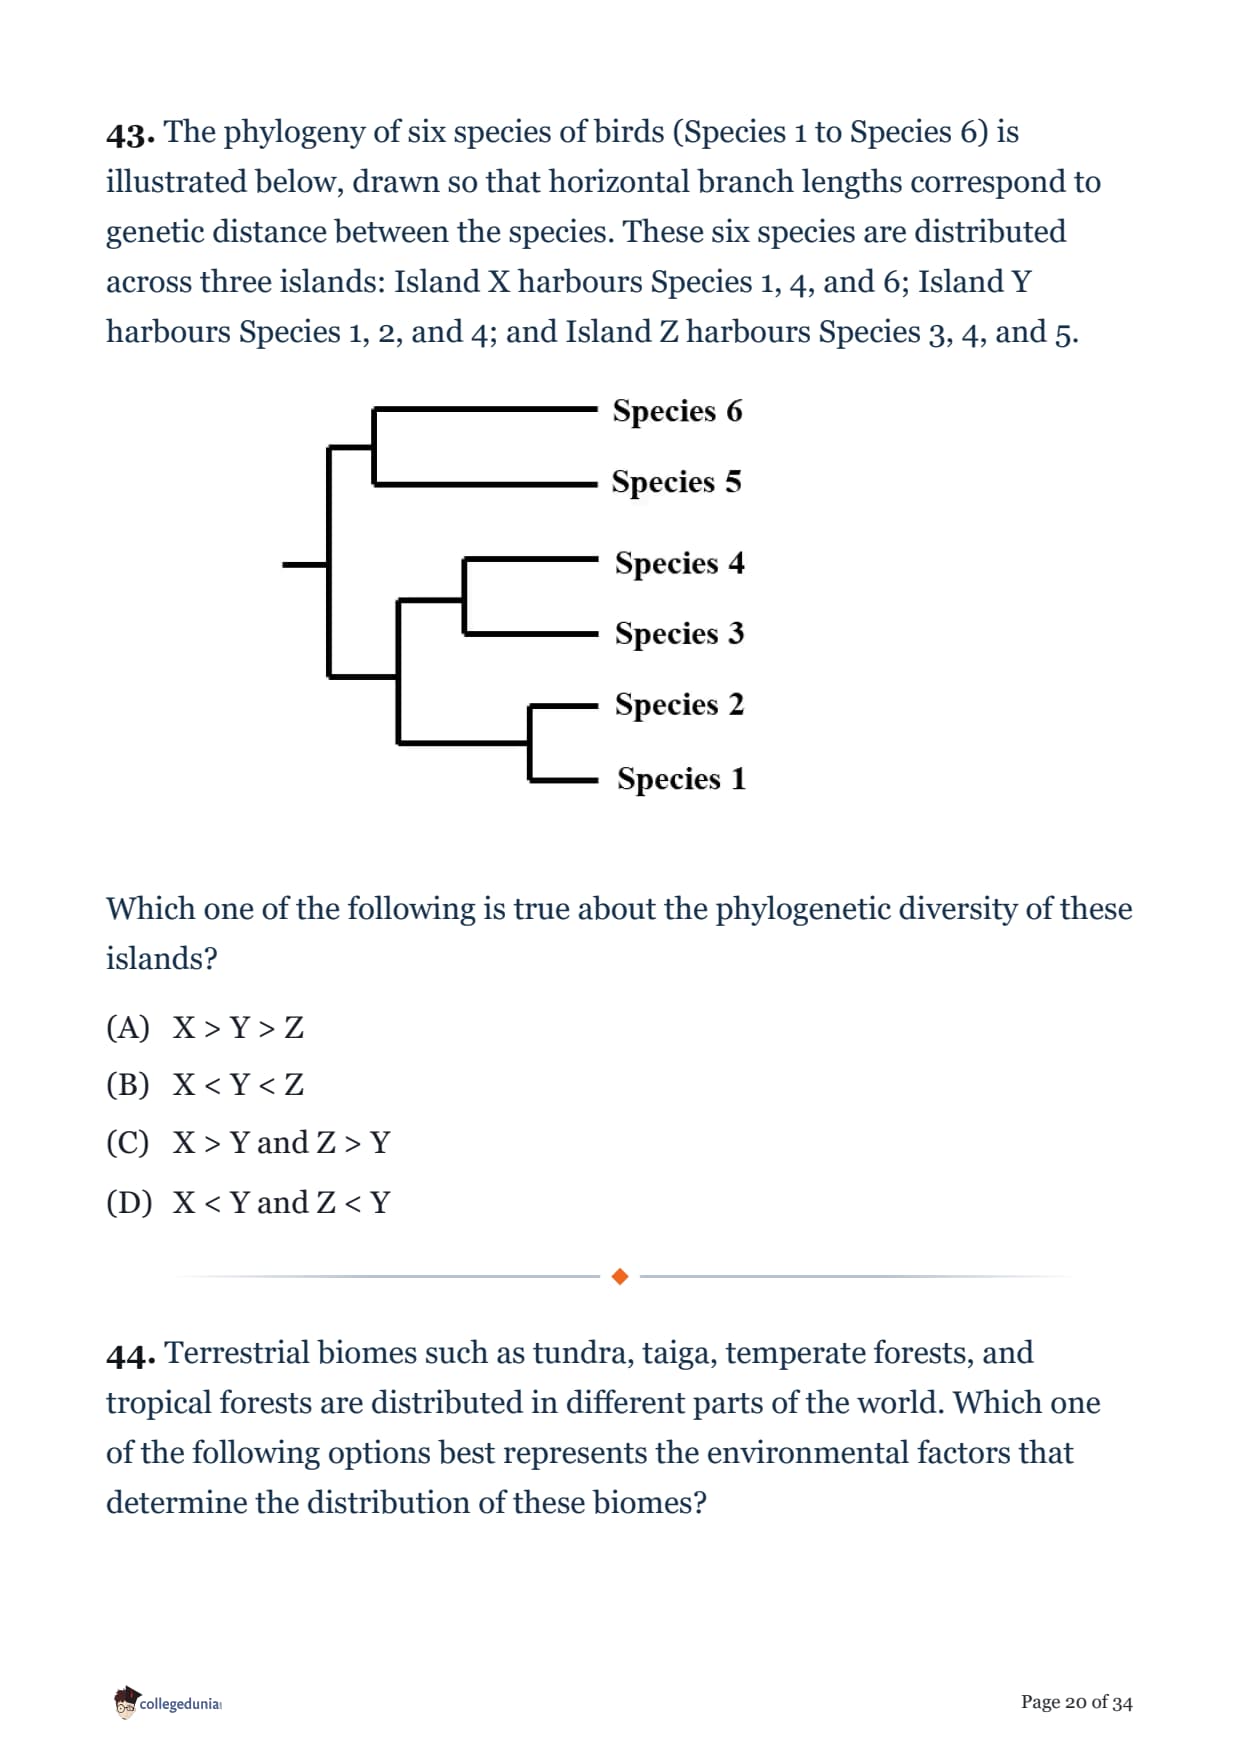
The phylogeny of six species of birds (Species 1 to Species 6) is illustrated below, drawn so that horizontal branch lengths correspond to genetic distance between the species. These six species are distributed across three islands: Island X harbours Species 1, 4, and 6; Island Y harbours Species 1, 2, and 4; and Island Z harbours Species 3, 4, and 5.

Which one of the following is true about the phylogenetic diversity of these islands?
Terrestrial biomes such as tundra, taiga, temperate forests, and tropical forests are distributed in different parts of the world. Which one of the following options best represents the environmental factors that determine the distribution of these biomes?
In a population, the frequency of an allele changes with time as shown in the table below.
| Year (x) | 0 | 10 | 20 | 30 | 40 |
|---|---|---|---|---|---|
| Allele frequency (y) | 0.1 | 0.2 | 0.3 | 0.4 | 0.5 |
Despite their striking morphological similarity to each other, Old World and New World vultures are not phylogenetically related. Old World vultures are most closely related to eagles, while New World vultures are most closely related to storks. The morphological similarity between Old World and New World vultures is an example of ____________.
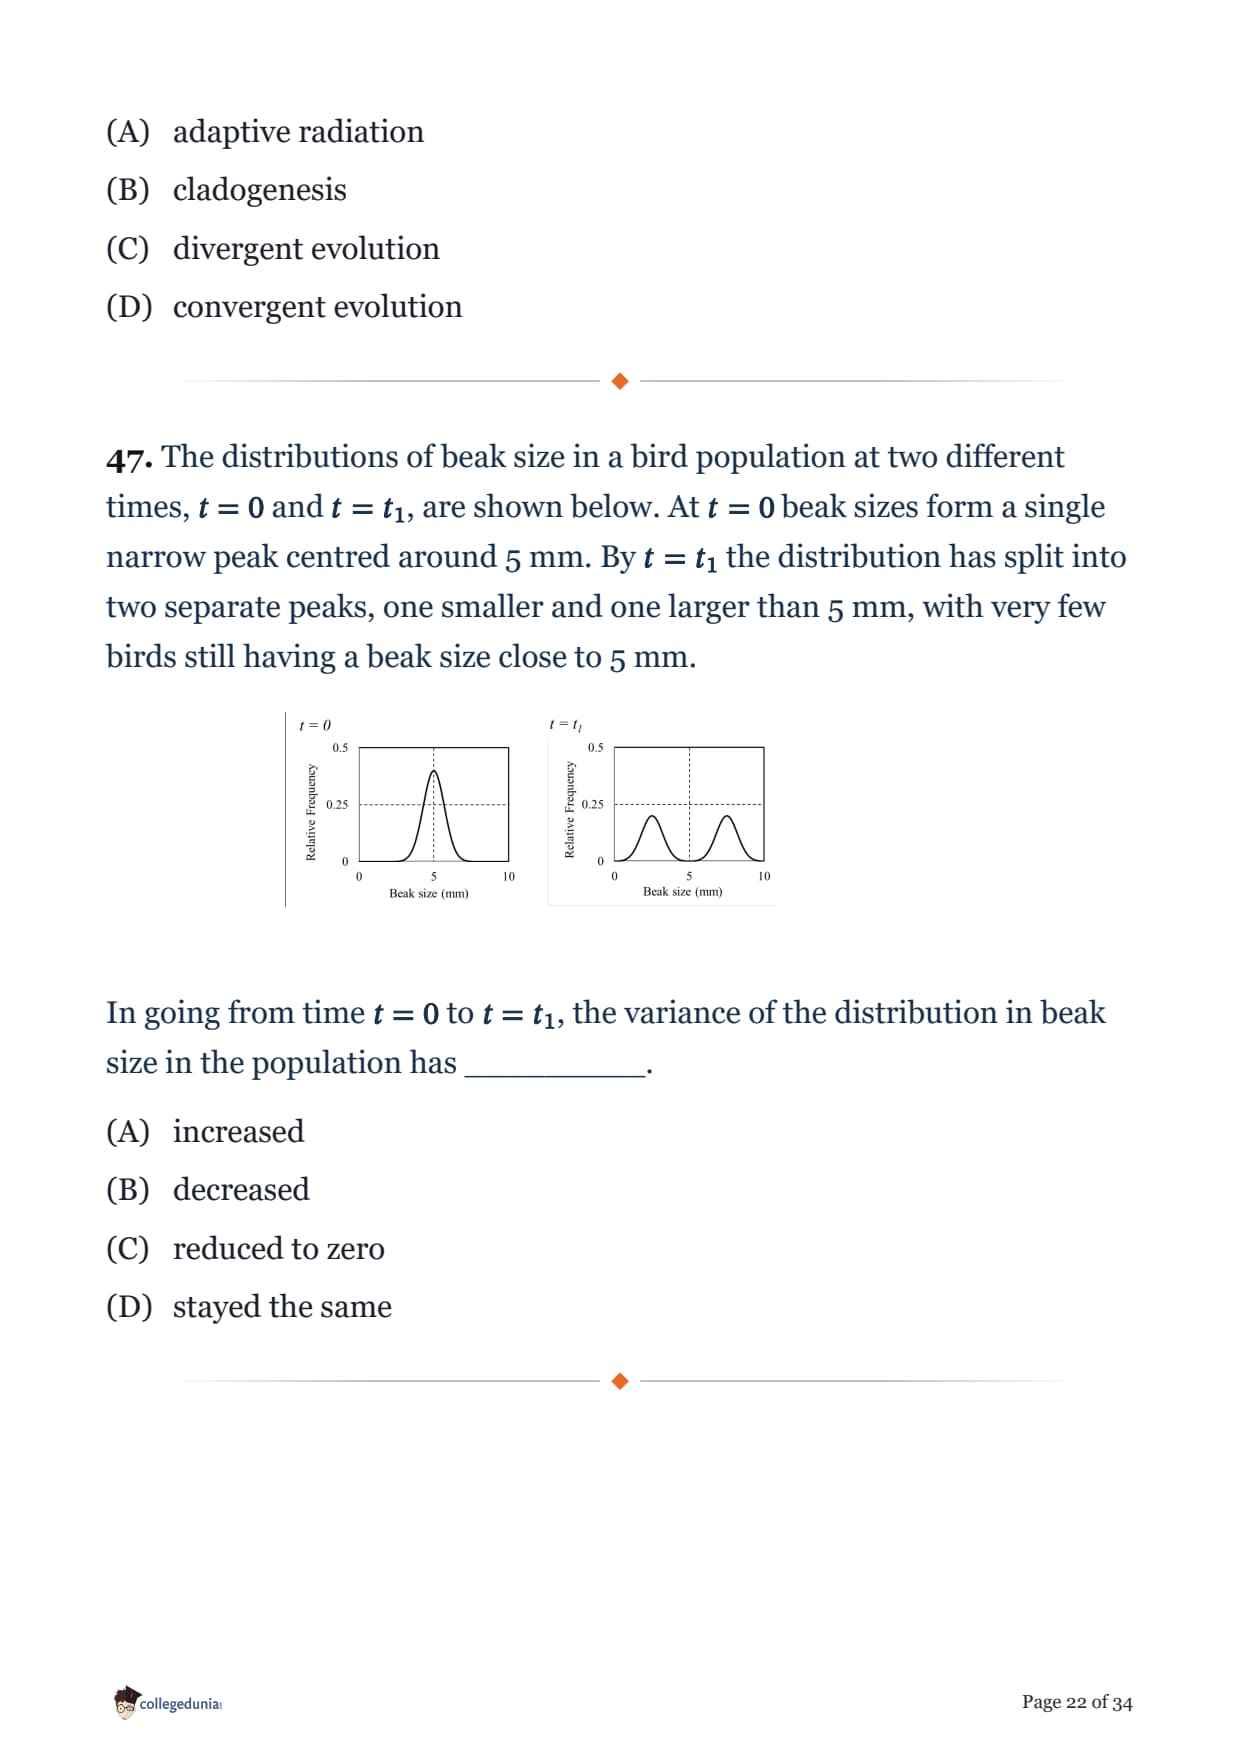
The distributions of beak size in a bird population at two different times, \(t=0\) and \(t=t_1\), are shown below. At \(t=0\) beak sizes form a single narrow peak centred around 5 mm. By \(t=t_1\) the distribution has split into two separate peaks, one smaller and one larger than 5 mm, with very few birds still having a beak size close to 5 mm.

In going from time \(t=0\) to \(t=t_1\), the variance of the distribution in beak size in the population has _________.
Percent sequence divergences between two sister species were calculated for an exon (E), an intron (I), and the flanking neutral (N) region of a gene that is under purifying selection. Which one of the following options best describes the expected divergence in E, I, and N between the sister species?
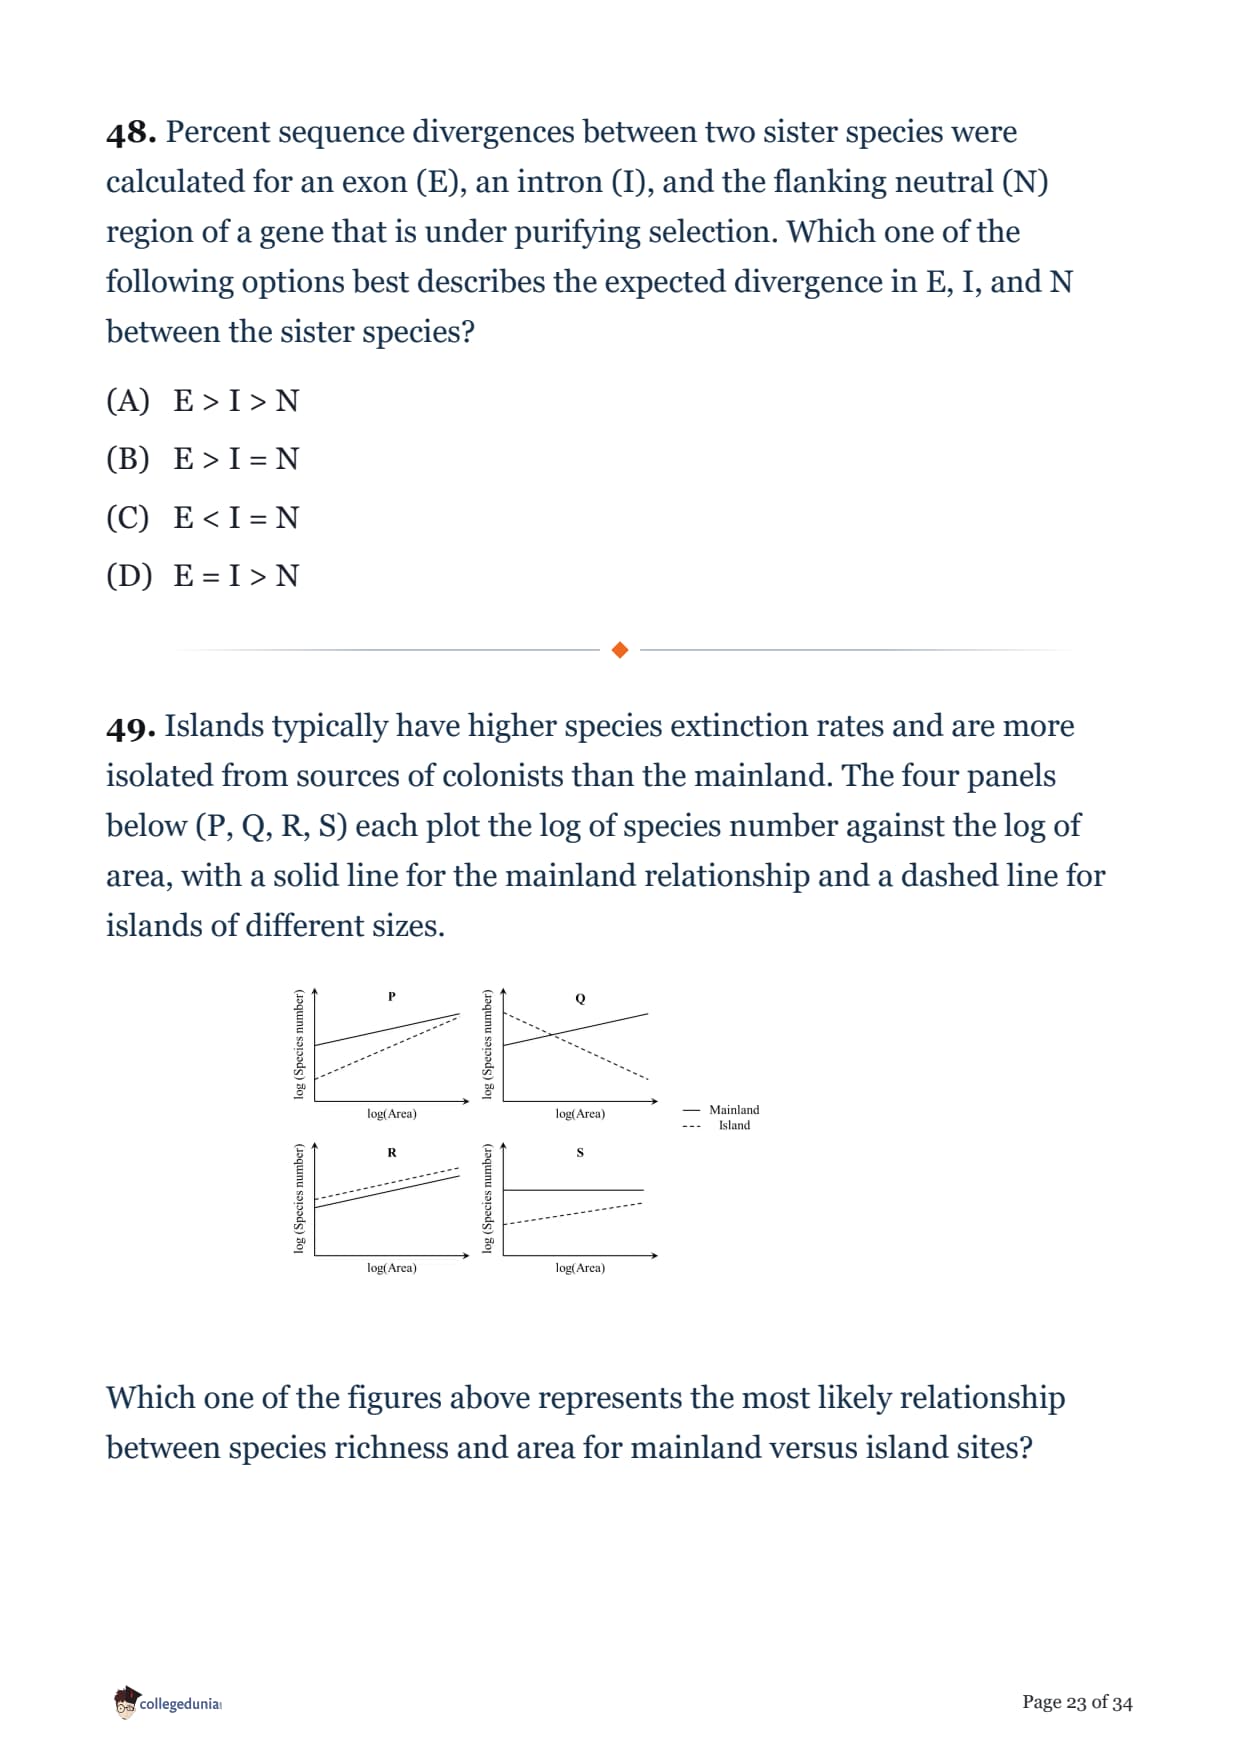
Islands typically have higher species extinction rates and are more isolated from sources of colonists than the mainland. The four panels below (P, Q, R, S) each plot the log of species number against the log of area, with a solid line for the mainland relationship and a dashed line for islands of different sizes.

Which one of the figures above represents the most likely relationship between species richness and area for mainland versus island sites?
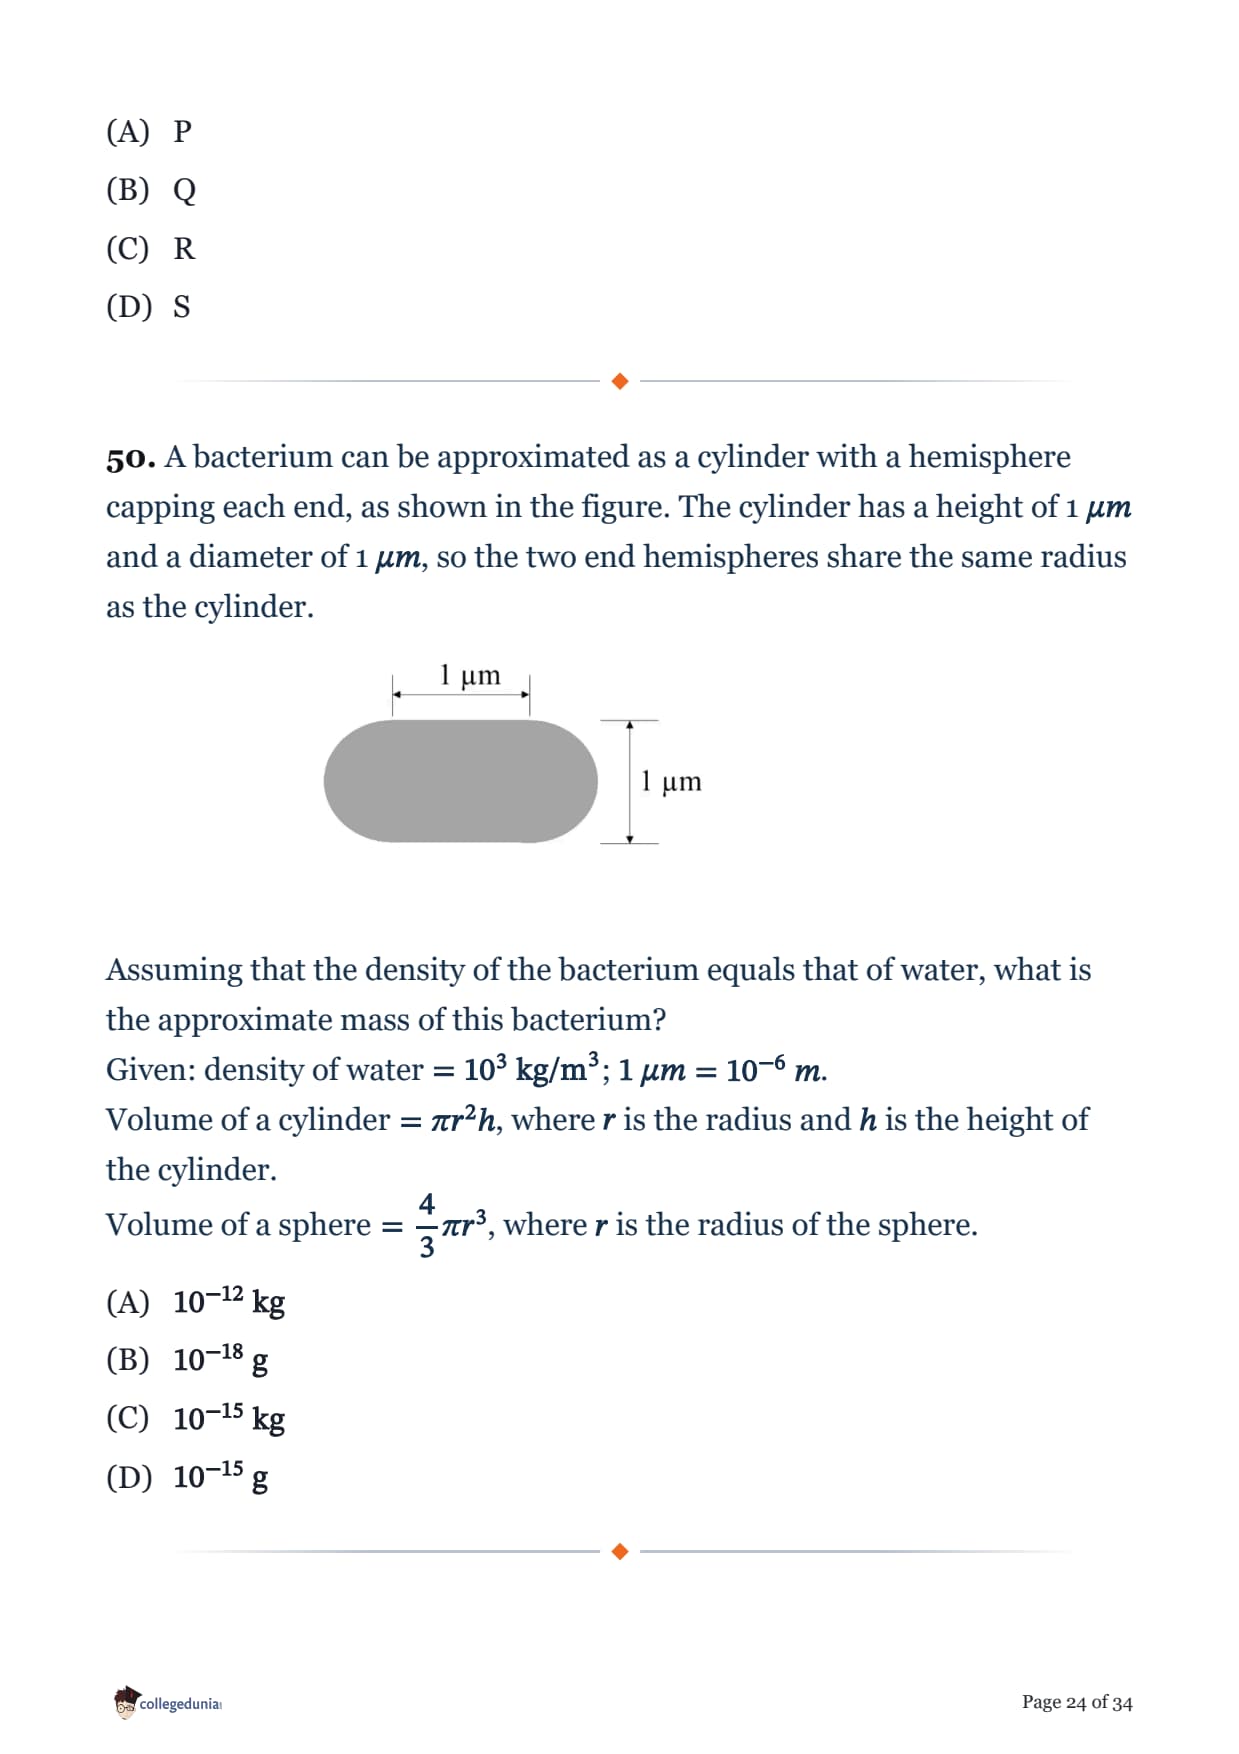
A bacterium can be approximated as a cylinder with a hemisphere capping each end, as shown in the figure. The cylinder has a height of 1 \(\mu m\) and a diameter of 1 \(\mu m\), so the two end hemispheres share the same radius as the cylinder.

Assuming that the density of the bacterium equals that of water, what is the approximate mass of this bacterium?
Given: density of water \(=10^3\ \text{kg/m}^3\); \(1\ \mu m = 10^{-6}\ m\).
Volume of a cylinder \(= \pi r^2 h\), where \(r\) is the radius and \(h\) is the height of the cylinder.
Volume of a sphere \(= \dfrac{4}{3}\pi r^3\), where \(r\) is the radius of the sphere.
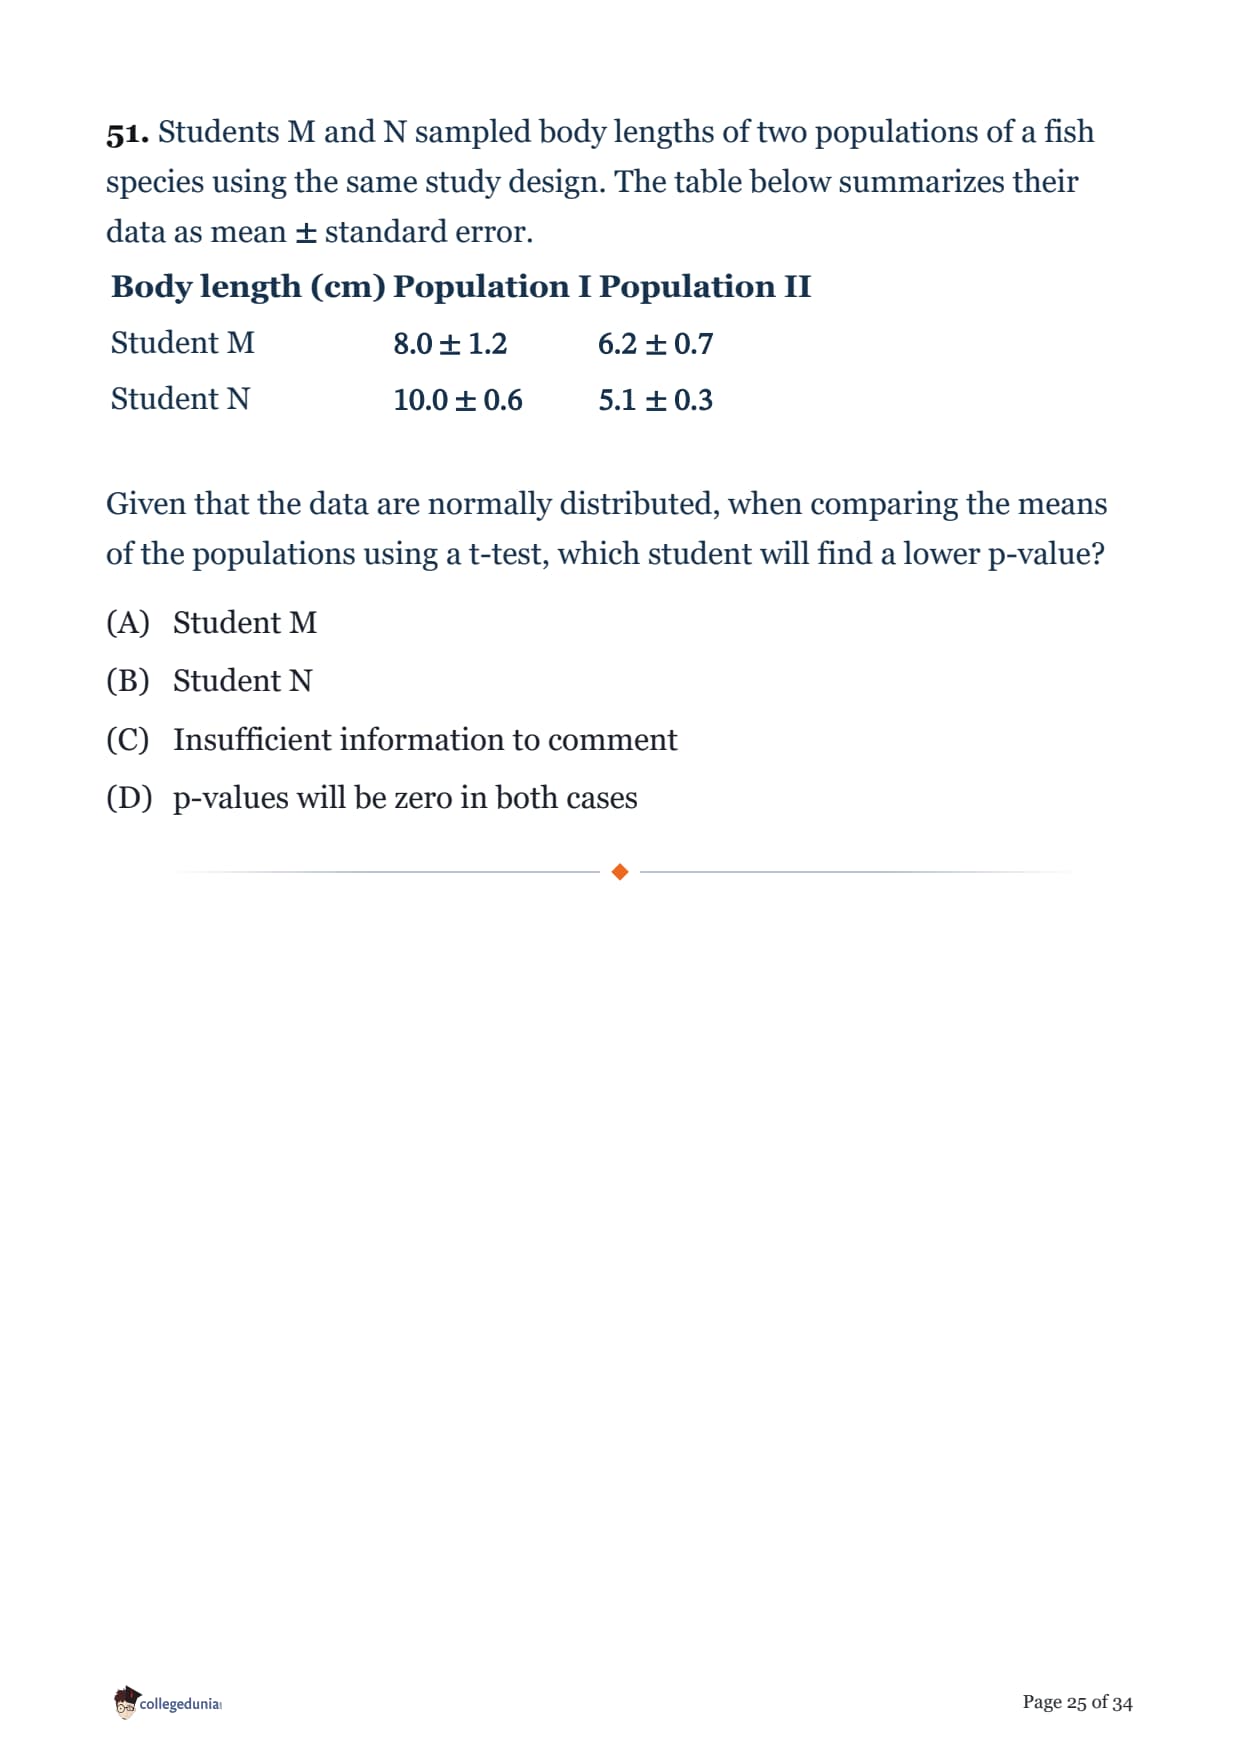
Students M and N sampled body lengths of two populations of a fish species using the same study design. The table below summarizes their data as mean \(\pm\) standard error.
| Body length (cm) | Population I | Population II |
|---|---|---|
| Student M | \(8.0 \pm 1.2\) | \(6.2 \pm 0.7\) |
| Student N | \(10.0 \pm 0.6\) | \(5.1 \pm 0.3\) |
Given that the data are normally distributed, when comparing the means of the populations using a t-test, which student will find a lower p-value?
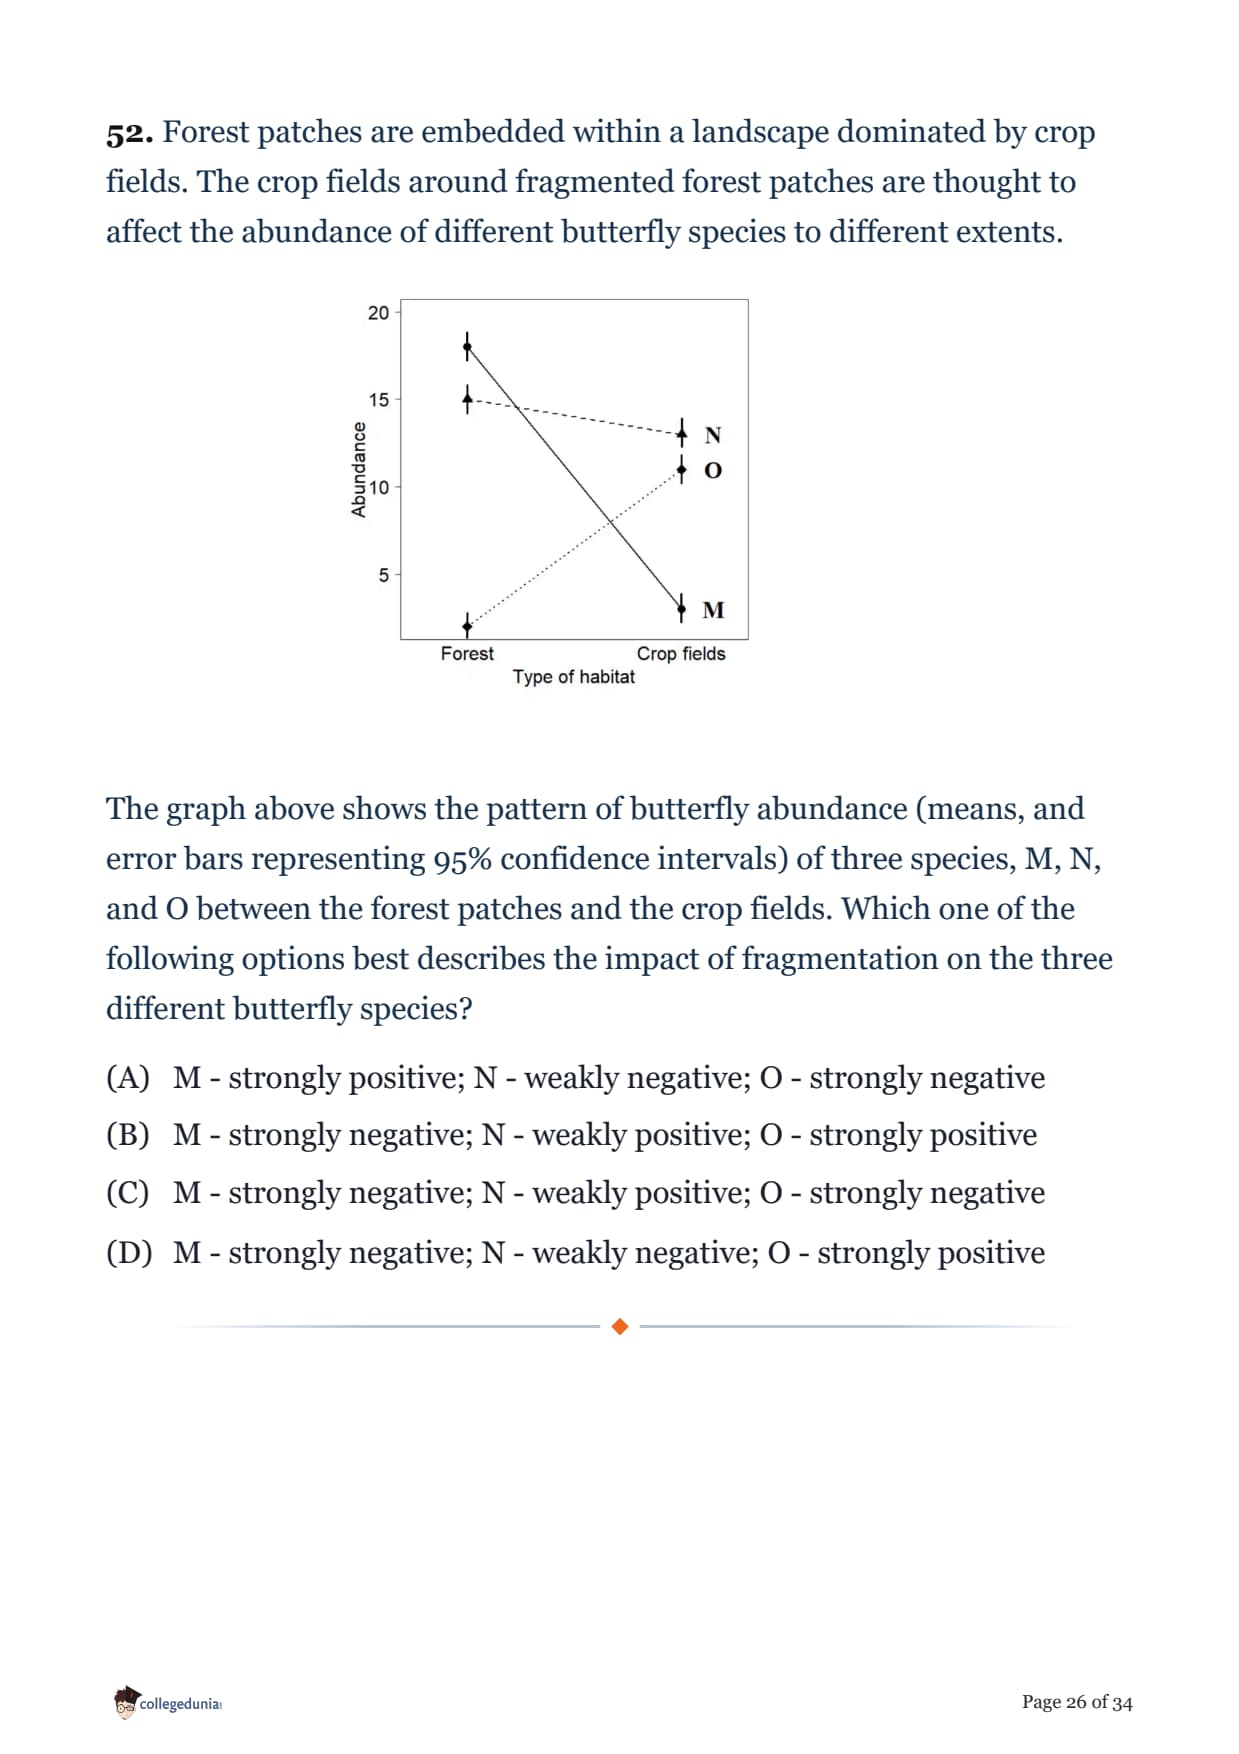
Forest patches are embedded within a landscape dominated by crop fields. The crop fields around fragmented forest patches are thought to affect the abundance of different butterfly species to different extents.

The graph above shows the pattern of butterfly abundance (means, and error bars representing 95% confidence intervals) of three species, M, N, and O between the forest patches and the crop fields. Which one of the following options best describes the impact of fragmentation on the three different butterfly species?
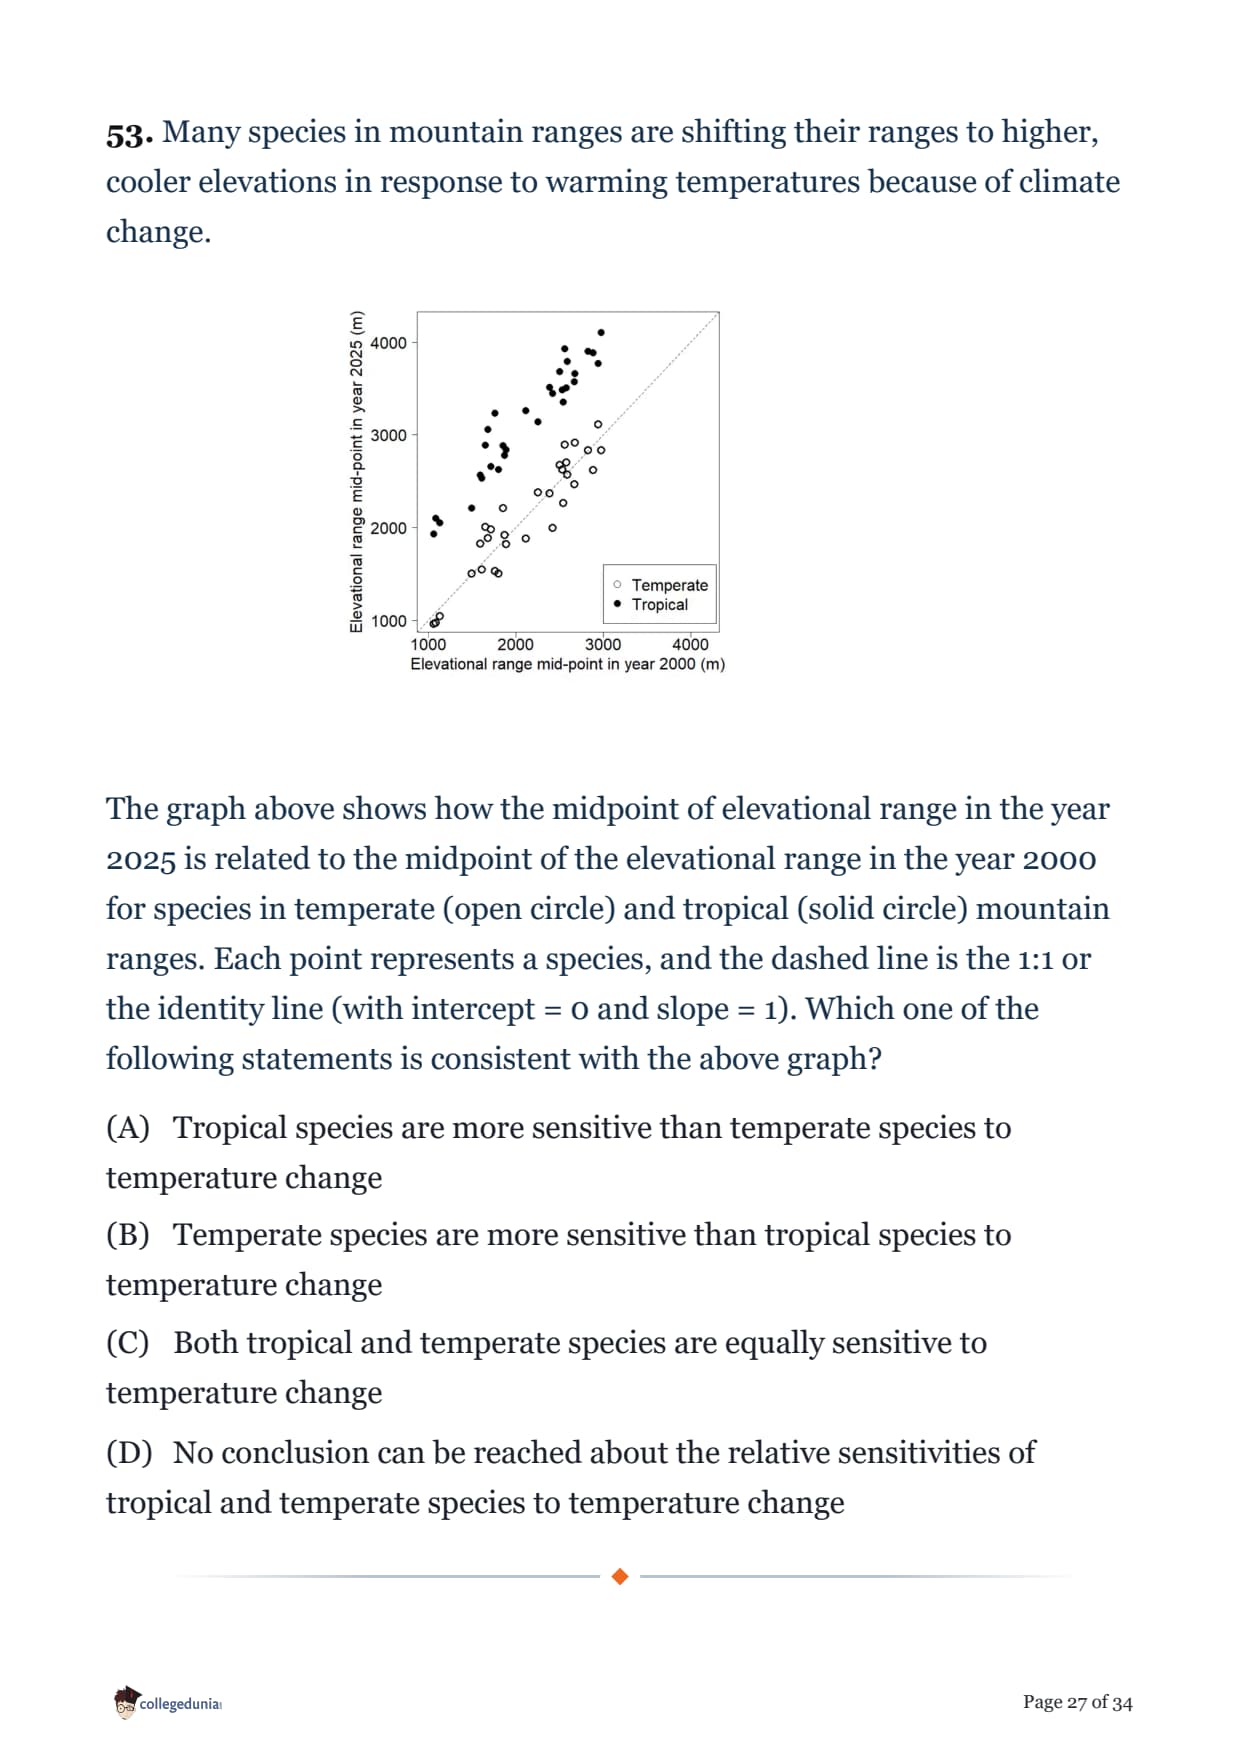
Many species in mountain ranges are shifting their ranges to higher, cooler elevations in response to warming temperatures because of climate change.

The graph above shows how the midpoint of elevational range in the year 2025 is related to the midpoint of the elevational range in the year 2000 for species in temperate (open circle) and tropical (solid circle) mountain ranges. Each point represents a species, and the dashed line is the 1:1 or the identity line (with intercept = 0 and slope = 1). Which one of the following statements is consistent with the above graph?
Two species of butterflies are equally toxic to their main potential predator. Their morphological similarity helps to reduce predation rates on both species. This phenomenon is known as _________.
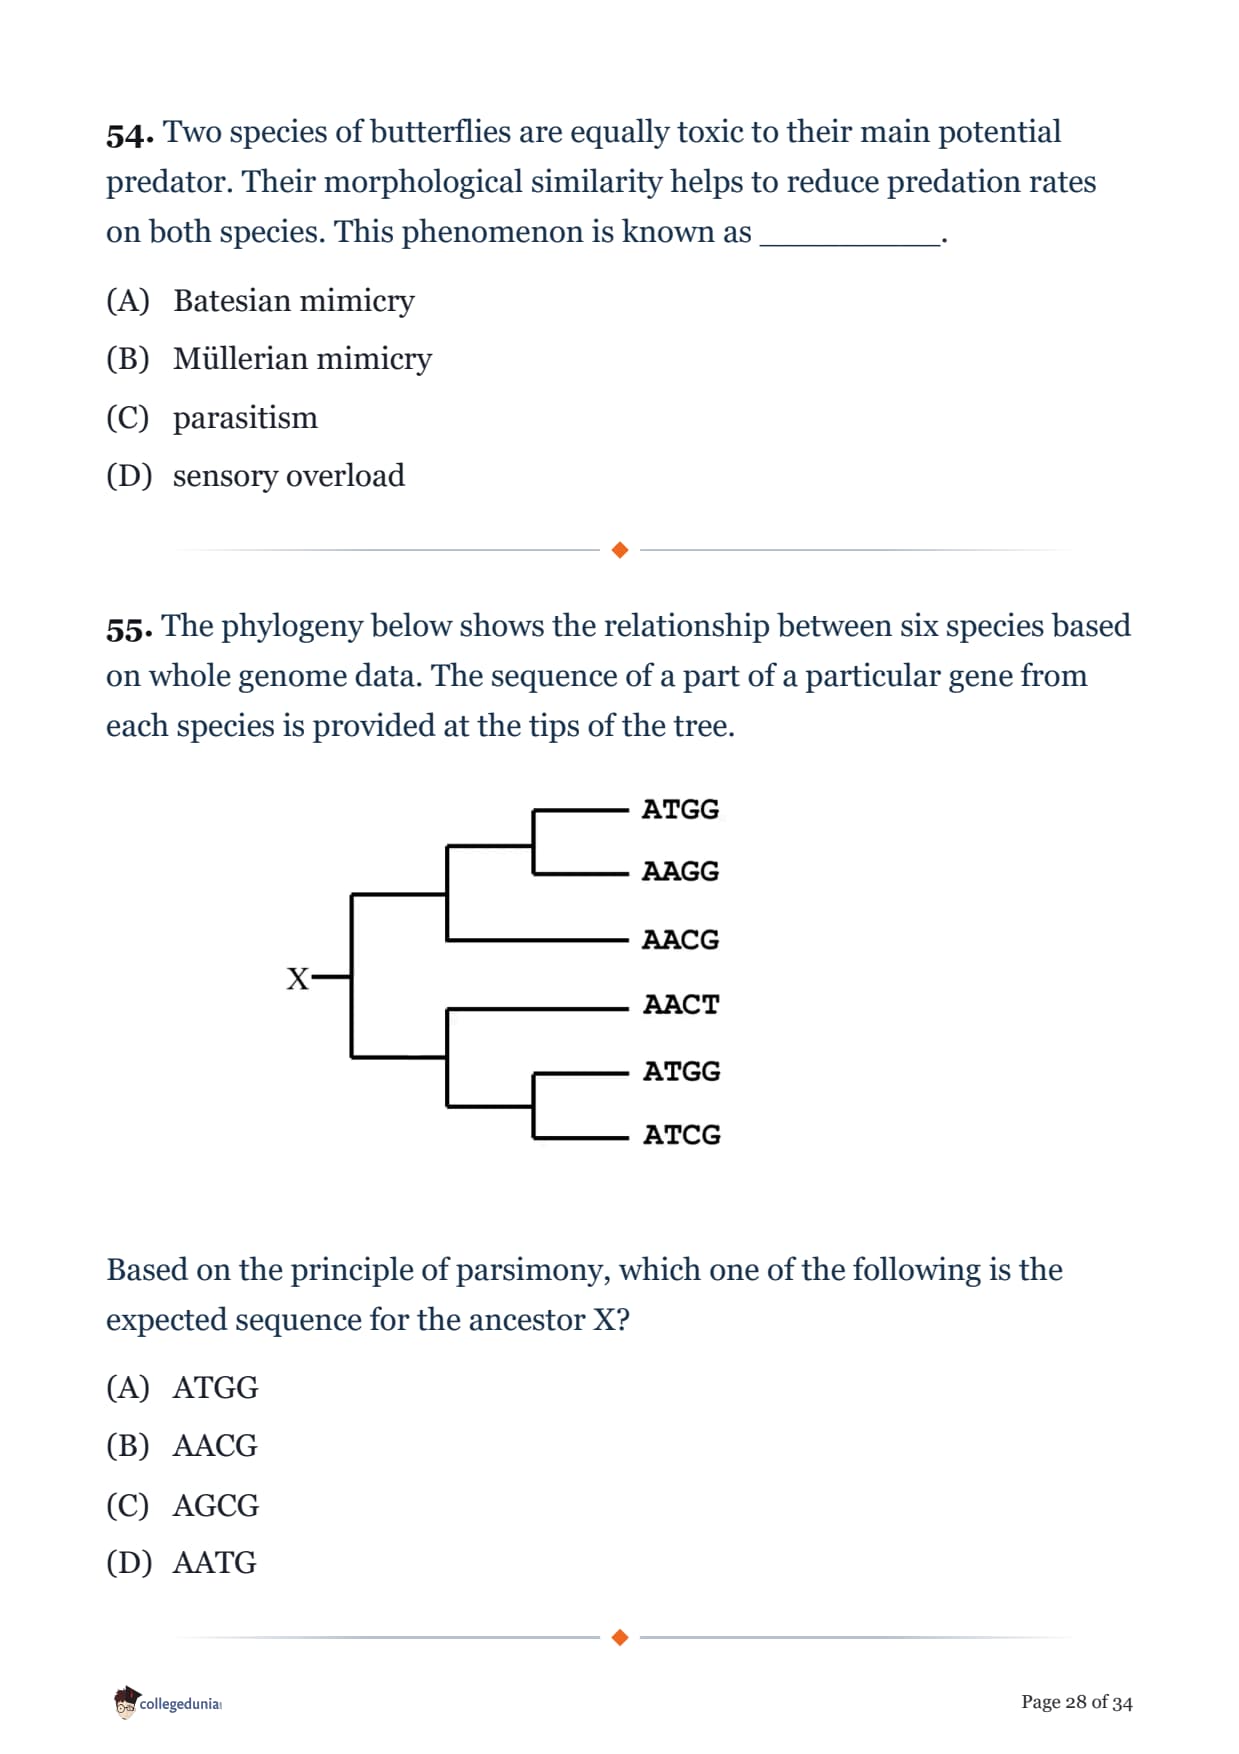
The phylogeny below shows the relationship between six species based on whole genome data. The sequence of a part of a particular gene from each species is provided at the tips of the tree.

Based on the principle of parsimony, which one of the following is the expected sequence for the ancestor X?
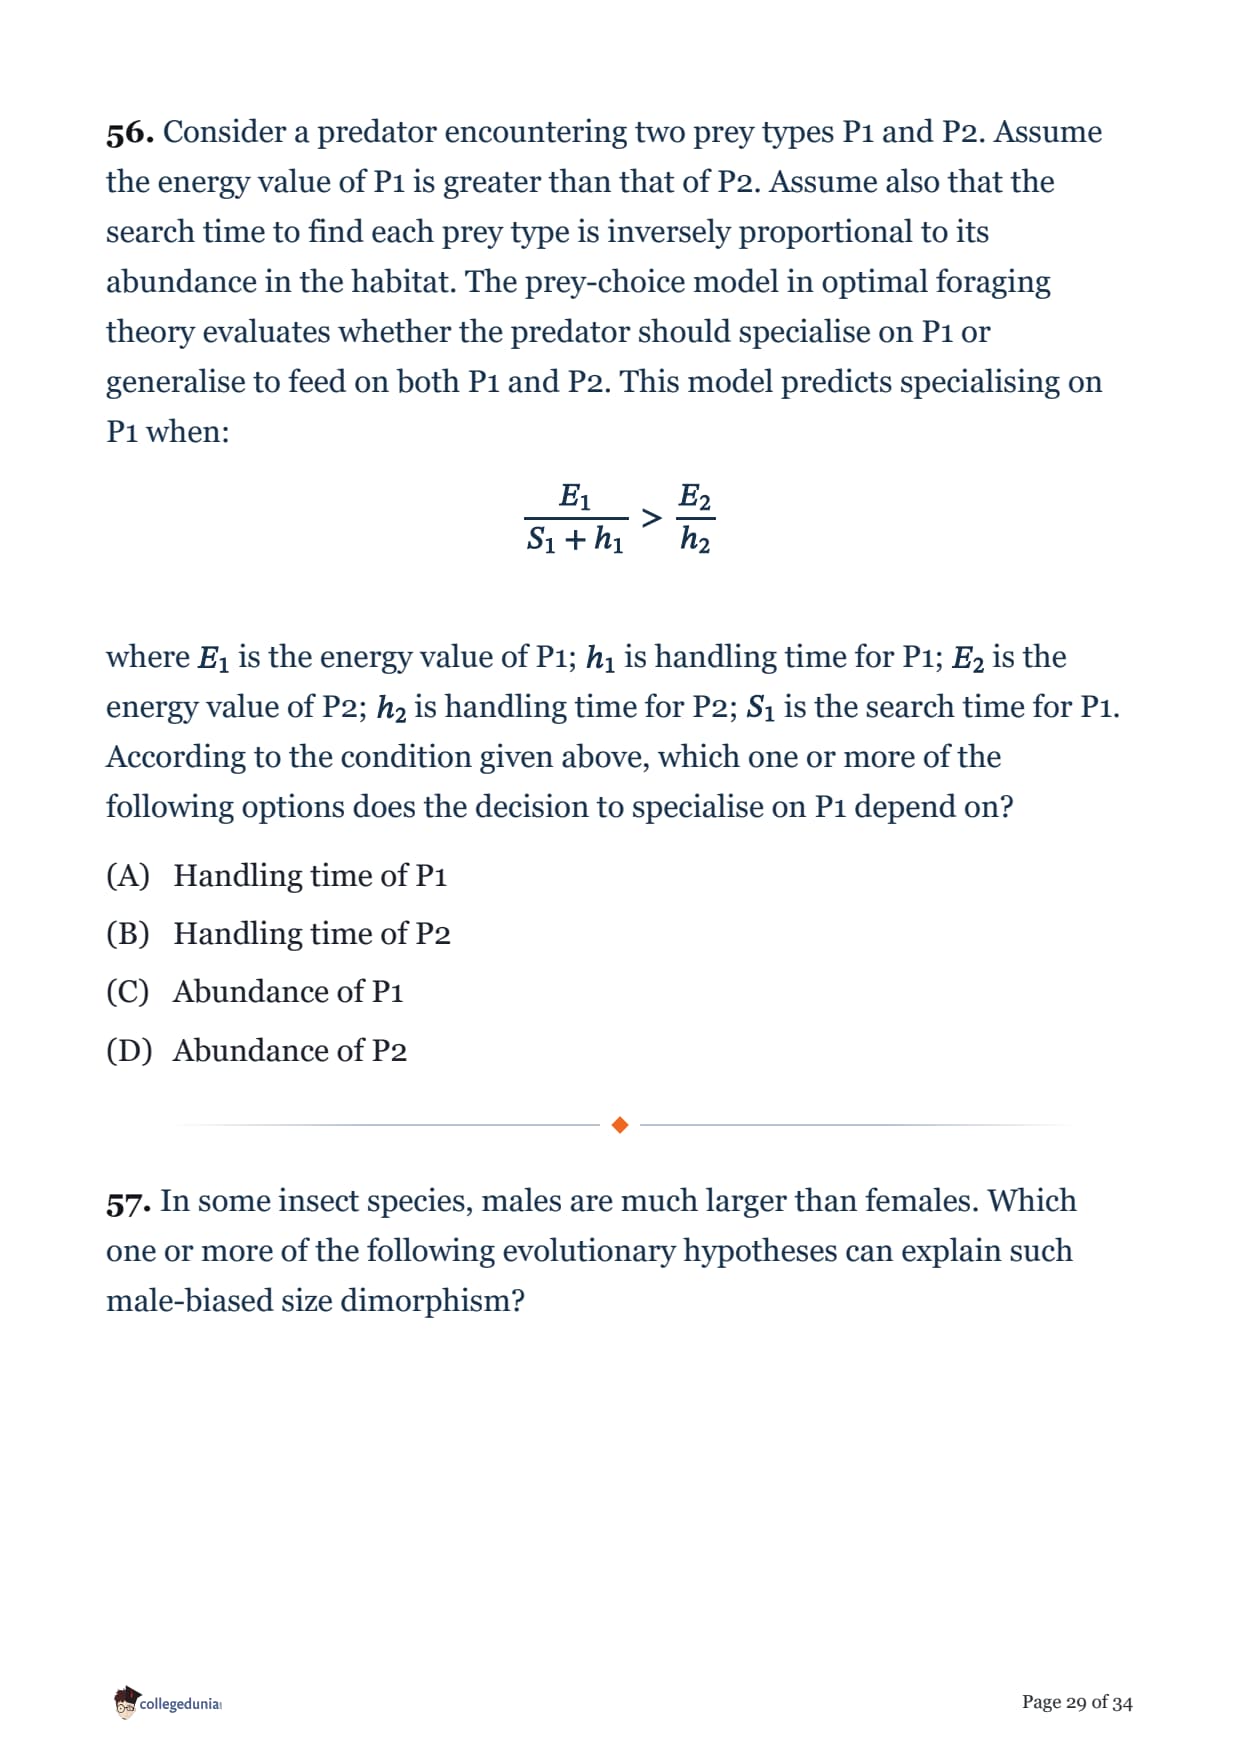
Consider a predator encountering two prey types P1 and P2. Assume the energy value of P1 is greater than that of P2. Assume also that the search time to find each prey type is inversely proportional to its abundance in the habitat. The prey-choice model in optimal foraging theory evaluates whether the predator should specialise on P1 or generalise to feed on both P1 and P2. This model predicts specialising on P1 when:
\[
\frac{E_1}{S_1+h_1} > \frac{E_2}{h_2}
\]
where \(E_1\) is the energy value of P1; \(h_1\) is handling time for P1; \(E_2\) is the energy value of P2; \(h_2\) is handling time for P2; \(S_1\) is the search time for P1. According to the condition given above, which one or more of the following options does the decision to specialise on P1 depend on?
In some insect species, males are much larger than females. Which one or more of the following evolutionary hypotheses can explain such male-biased size dimorphism?
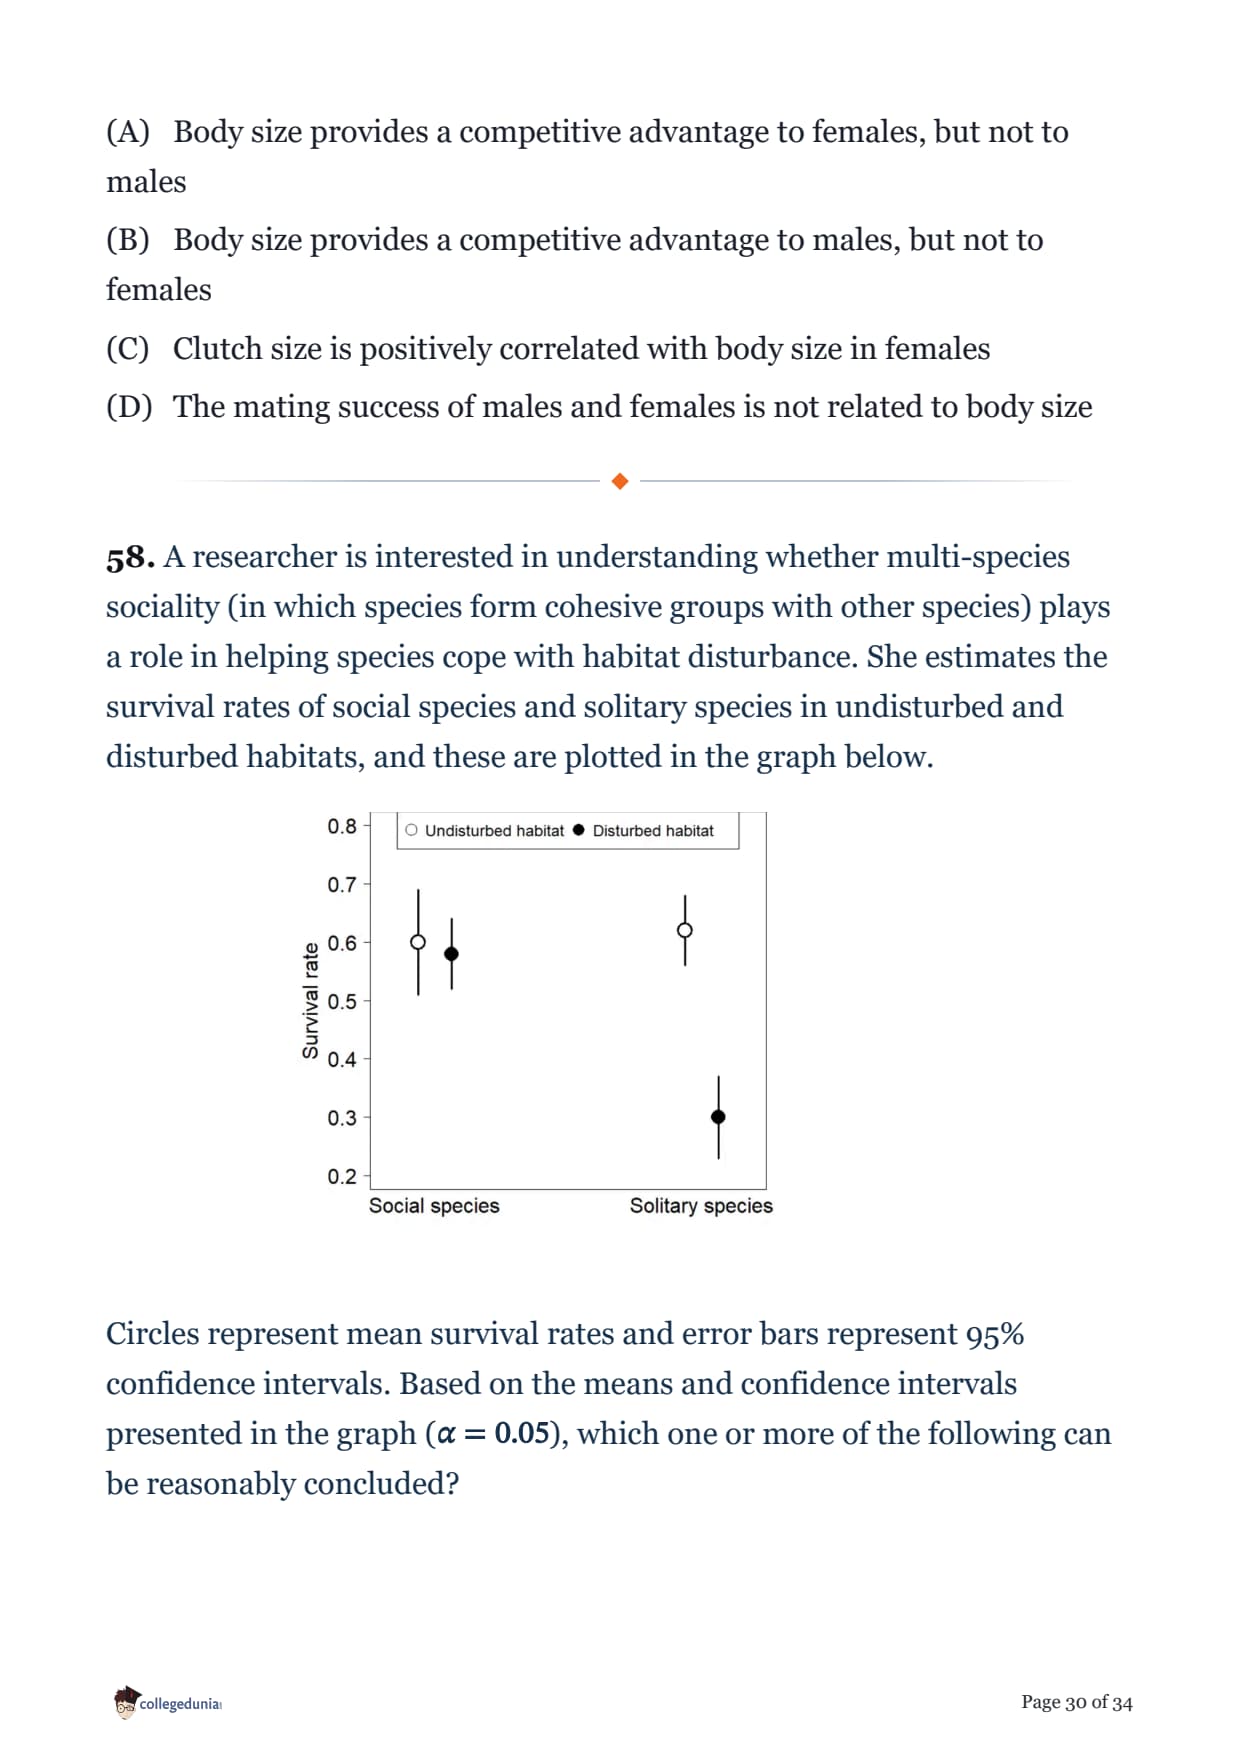
A researcher is interested in understanding whether multi-species sociality (in which species form cohesive groups with other species) plays a role in helping species cope with habitat disturbance. She estimates the survival rates of social species and solitary species in undisturbed and disturbed habitats, and these are plotted in the graph below.

Circles represent mean survival rates and error bars represent 95% confidence intervals. Based on the means and confidence intervals presented in the graph (\(\alpha = 0.05\)), which one or more of the following can be reasonably concluded?
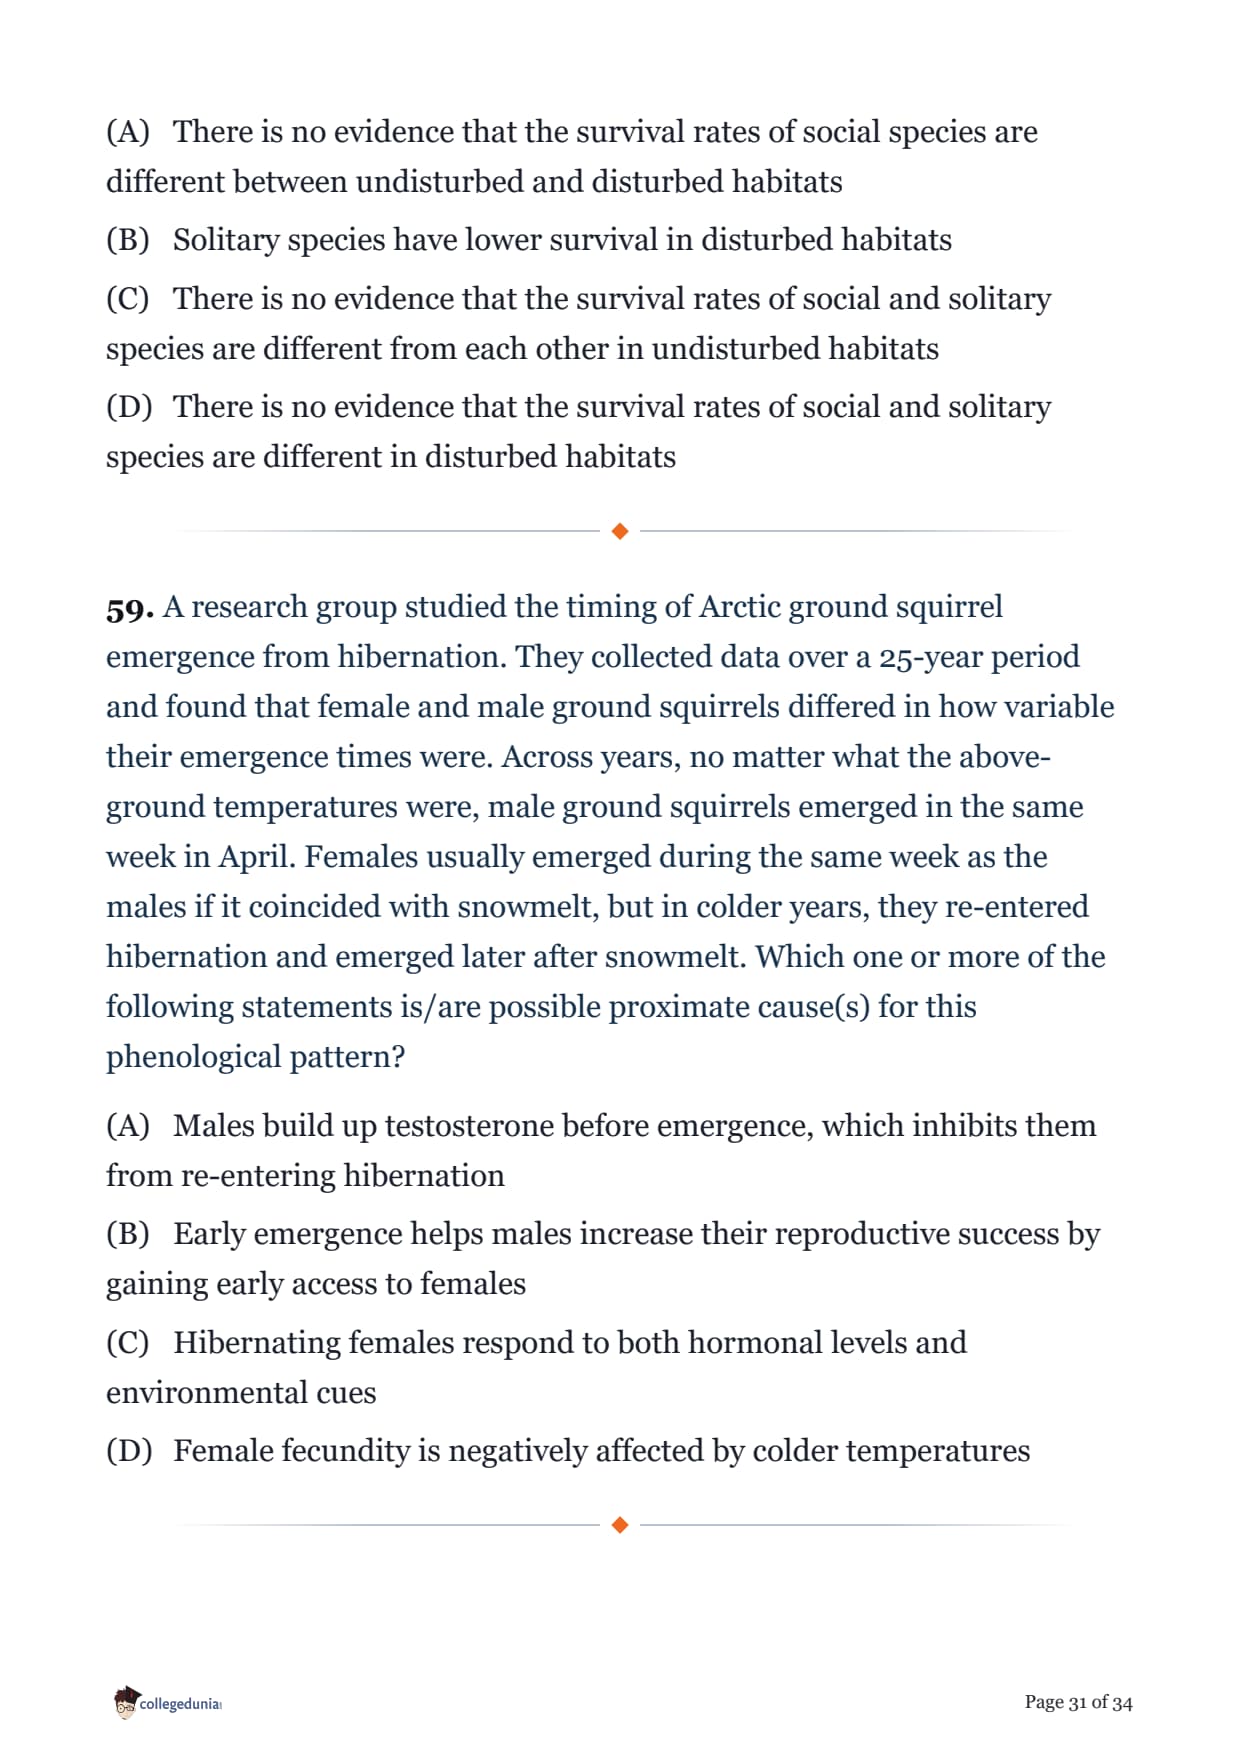
A research group studied the timing of Arctic ground squirrel emergence from hibernation. They collected data over a 25-year period and found that female and male ground squirrels differed in how variable their emergence times were. Across years, no matter what the above-ground temperatures were, male ground squirrels emerged in the same week in April. Females usually emerged during the same week as the males if it coincided with snowmelt, but in colder years, they re-entered hibernation and emerged later after snowmelt. Which one or more of the following statements is/are possible proximate cause(s) for this phenological pattern?
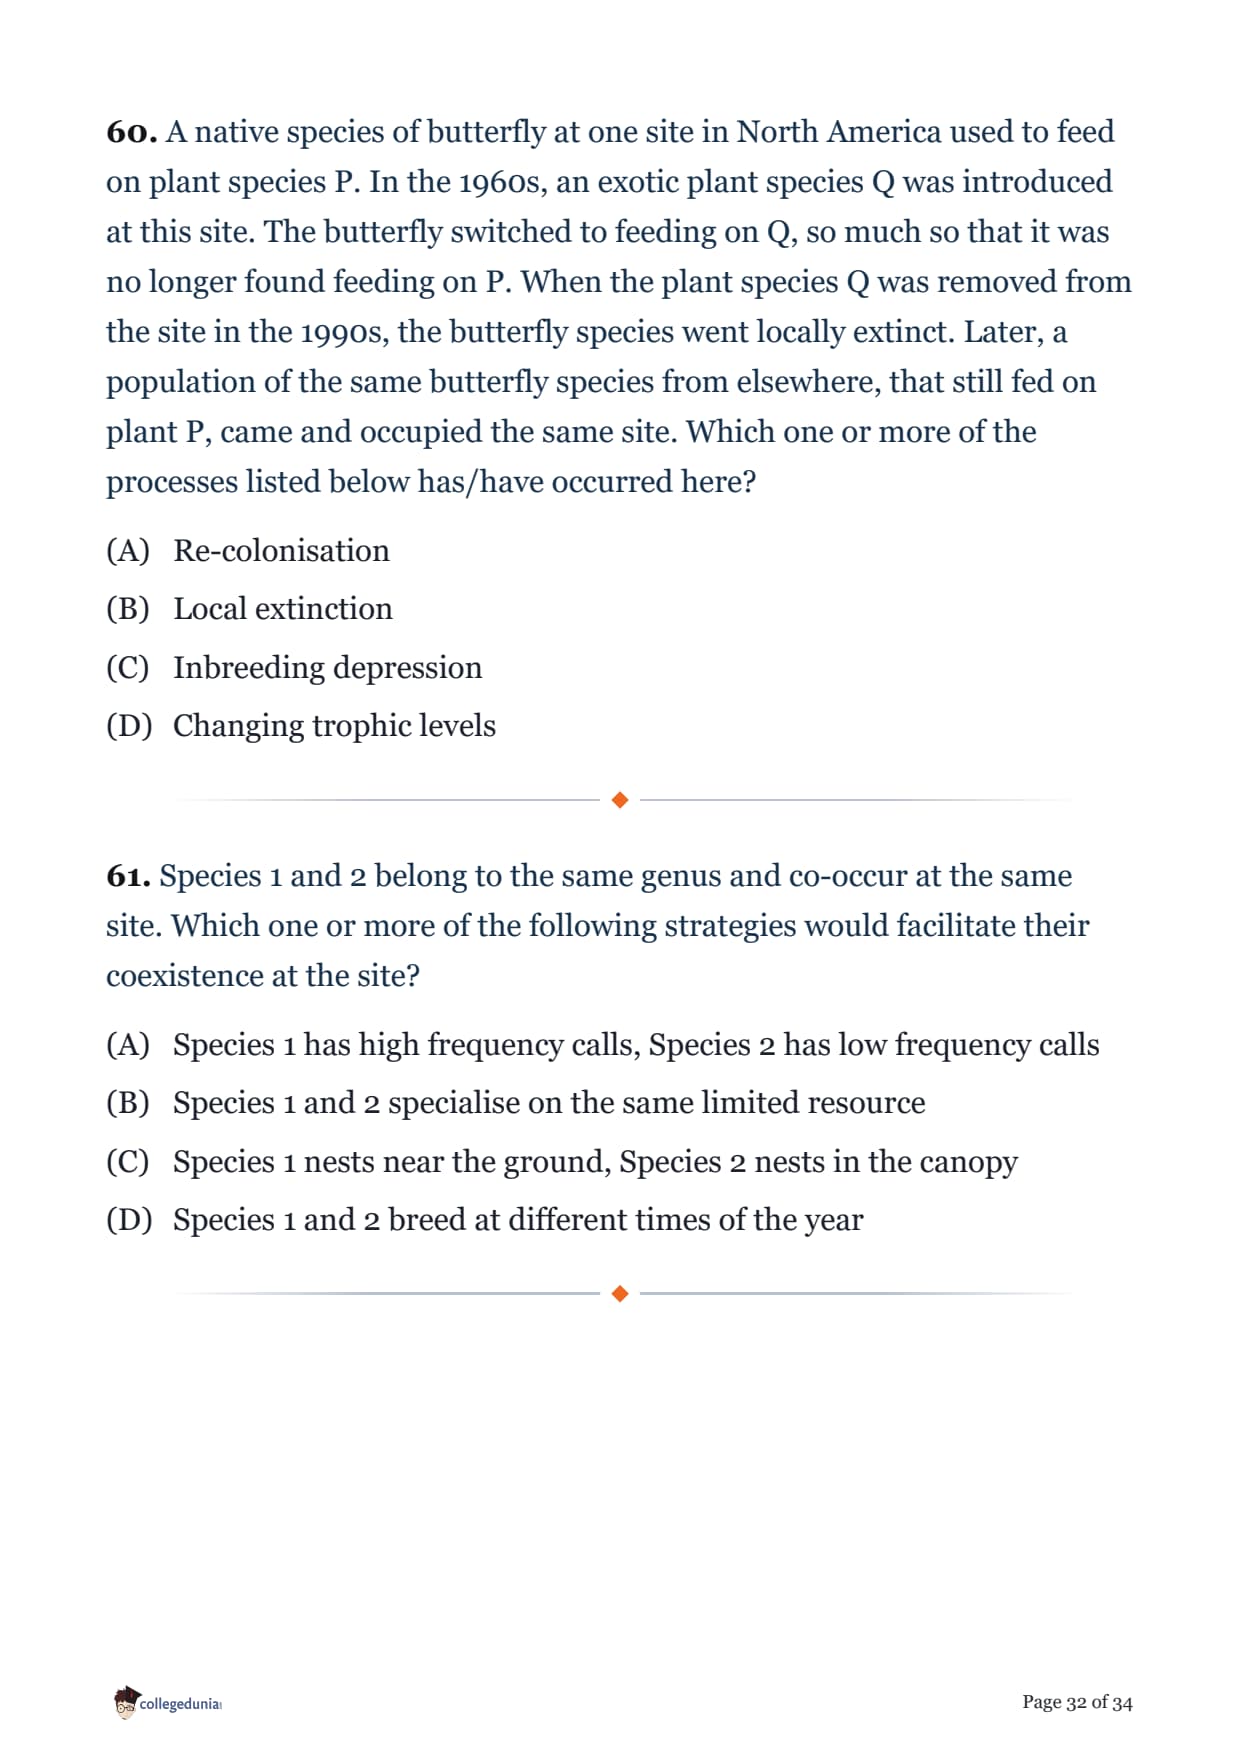
A native species of butterfly at one site in North America used to feed on plant species P. In the 1960s, an exotic plant species Q was introduced at this site. The butterfly switched to feeding on Q, so much so that it was no longer found feeding on P. When the plant species Q was removed from the site in the 1990s, the butterfly species went locally extinct. Later, a population of the same butterfly species from elsewhere, that still fed on plant P, came and occupied the same site. Which one or more of the processes listed below has/have occurred here?
Species 1 and 2 belong to the same genus and co-occur at the same site. Which one or more of the following strategies would facilitate their coexistence at the site?
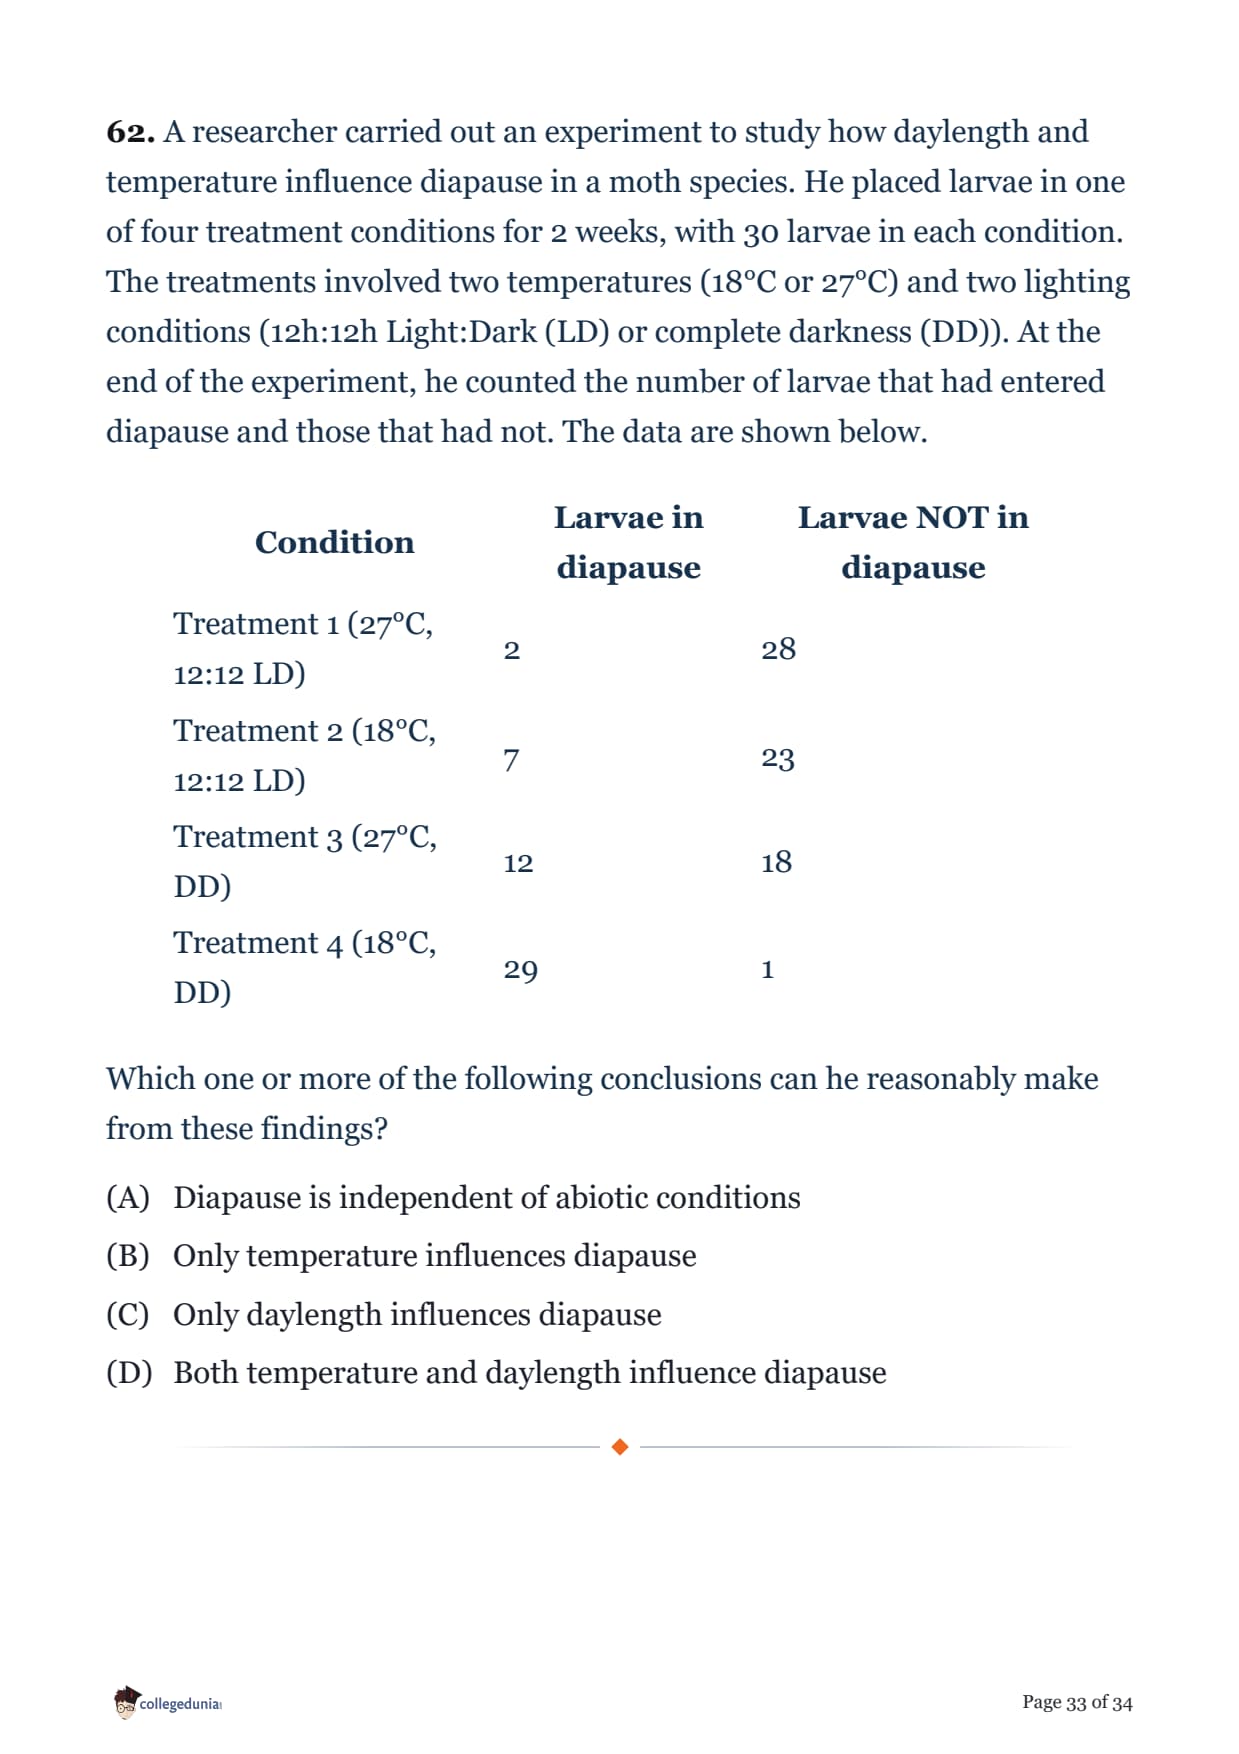
A researcher carried out an experiment to study how daylength and temperature influence diapause in a moth species. He placed larvae in one of four treatment conditions for 2 weeks, with 30 larvae in each condition. The treatments involved two temperatures (18°C or 27°C) and two lighting conditions (12h:12h Light:Dark (LD) or complete darkness (DD)). At the end of the experiment, he counted the number of larvae that had entered diapause and those that had not. The data are shown below.
| Condition | Larvae in diapause | Larvae NOT in diapause |
|---|---|---|
| Treatment 1 (27°C, 12:12 LD) | 2 | 28 |
| Treatment 2 (18°C, 12:12 LD) | 7 | 23 |
| Treatment 3 (27°C, DD) | 12 | 18 |
| Treatment 4 (18°C, DD) | 29 | 1 |
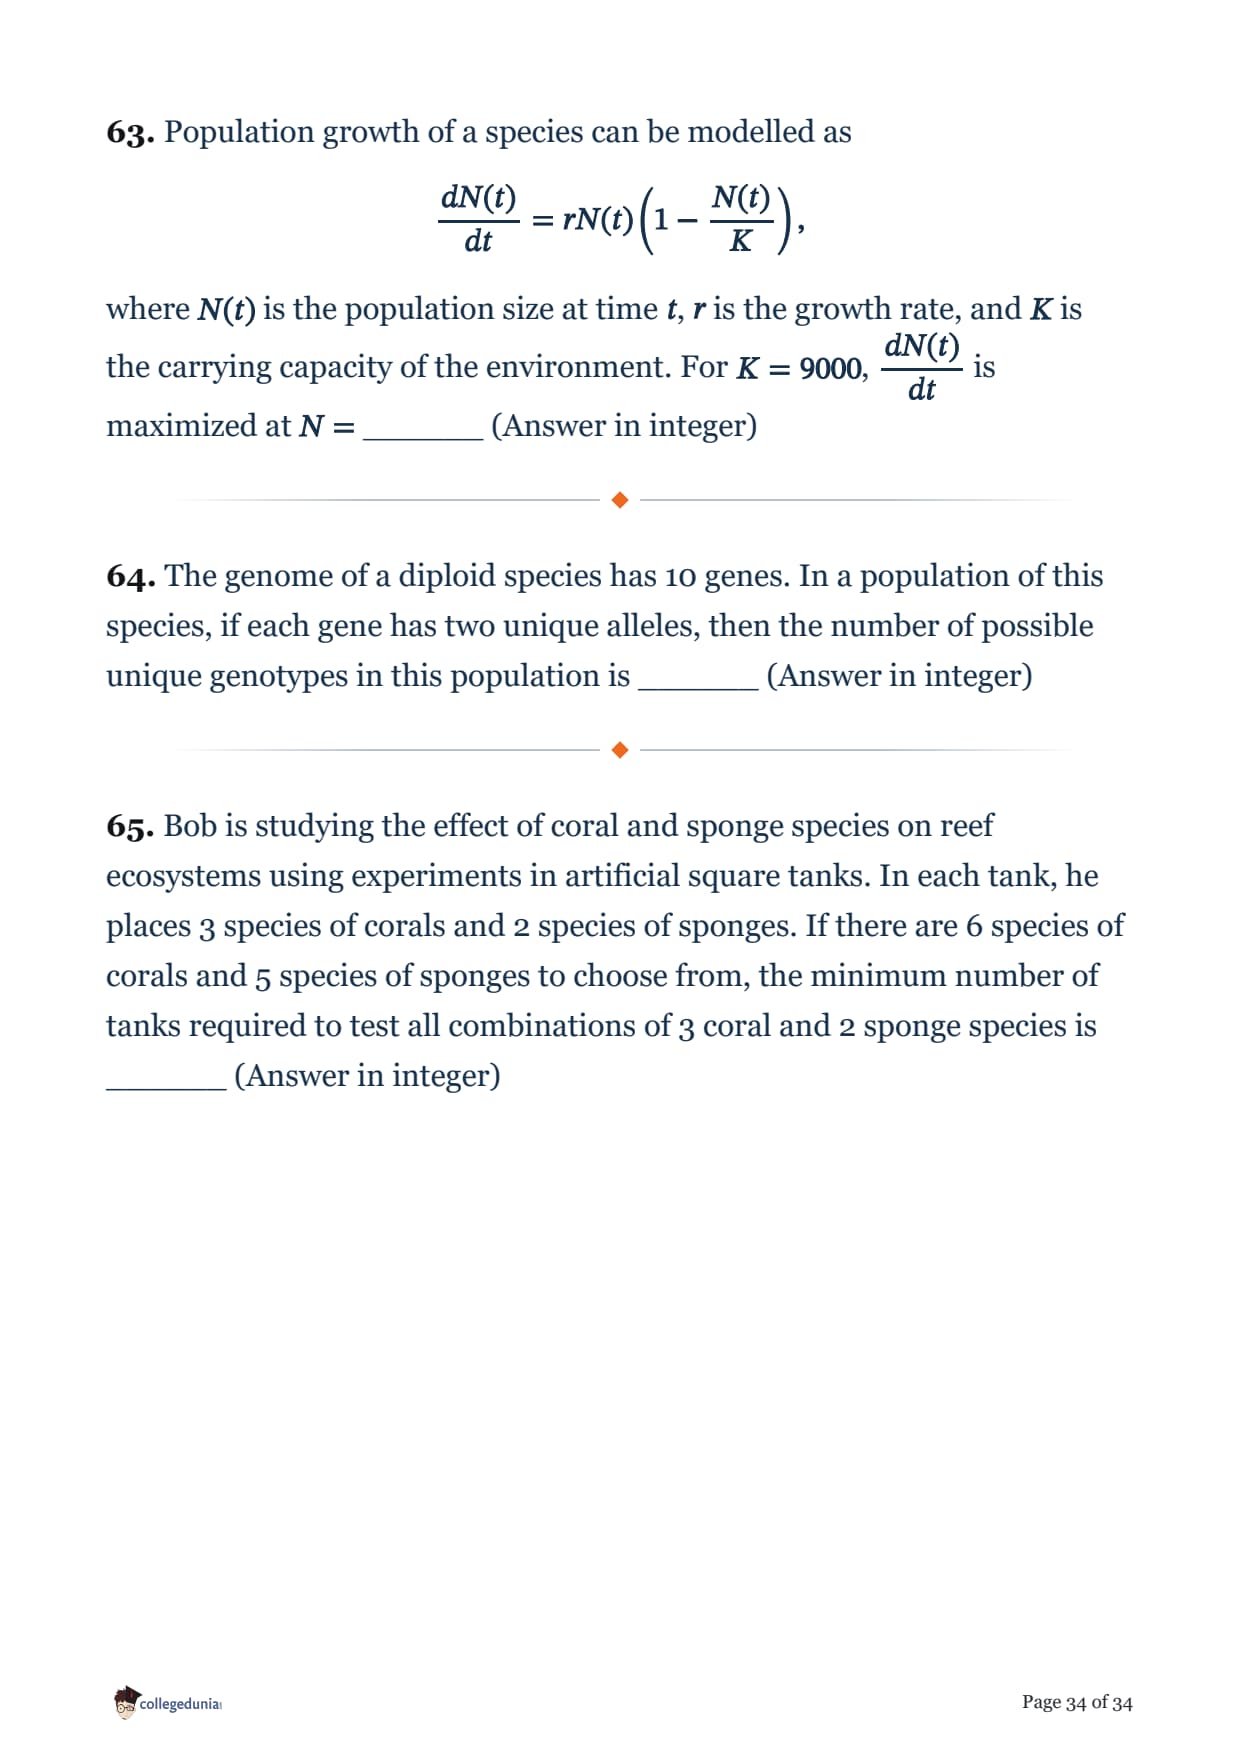
Population growth of a species can be modelled as \[ \frac{dN(t)}{dt}=rN(t)\left(1-\frac{N(t)}{K}\right), \] where \(N(t)\) is the population size at time \(t\), \(r\) is the growth rate, and \(K\) is the carrying capacity of the environment. For \(K=9000\), \(\dfrac{dN(t)}{dt}\) is maximized at \(N=\) ______ (Answer in integer)
The genome of a diploid species has 10 genes. In a population of this species, if each gene has two unique alleles, then the number of possible unique genotypes in this population is ______ (Answer in integer)
Bob is studying the effect of coral and sponge species on reef ecosystems using experiments in artificial square tanks. In each tank, he places 3 species of corals and 2 species of sponges. If there are 6 species of corals and 5 species of sponges to choose from, the minimum number of tanks required to test all combinations of 3 coral and 2 sponge species is ______ (Answer in integer)
GATE 2026 Ecology and Evolution Exam Pattern and Marking Scheme Explained
As per the information published on the official GATE 2026 website (gate2026.iitg.ac.in), EY is a computer-based test mixing three question formats in one paper.
- Total questions: 65, split into 10 General Aptitude (GA) and 55 core Ecology and Evolution questions
- Duration: 3 hours
- Total marks: 100, with GA worth 15 marks and the core subject worth 85 marks
- Marking scheme: 1-mark MCQs lose 1/3 mark for a wrong answer, 2-mark MCQs lose 2/3 mark; MSQ and NAT questions carry no negative marking
- Question types: Multiple Choice Questions (MCQ), Multiple Select Questions (MSQ), and Numerical Answer Type (NAT) questions
High-Weightage Topics in GATE 2026 Ecology and Evolution to Focus On First
Going through the solved paper, the 55 core questions leaned heavily on a few recurring areas rather than spreading evenly across the syllabus.
- Population and community ecology: questions on species richness, Simpson's diversity index, competitive exclusion, and niche partitioning showed up repeatedly
- Evolutionary biology and genetics: Hardy-Weinberg calculations, coefficient of relatedness, fixation probability of neutral mutations, and phylogenetic tree reconstruction using parsimony
- Behavioural ecology: kin selection, optimal foraging theory, sexual dimorphism, and mimicry (Batesian and Mullerian) each had a dedicated question
- Conservation biology: small-population extinction risk, inbreeding depression, and island biogeography (species-area relationships)
- Quantitative ecology: a noticeable chunk of the 2-mark questions were calculation-based - logistic growth rate, Simpson's index from a raw abundance table, and combinatorics/probability problems
GATE 2026 Ecology and Evolution Question Paper Analysis Video
Source: GATE & SET IFAS: Biotechnology, Life Science & EY
How to Use the GATE Ecology and Evolution Question Paper for Practice
EY draws a small number of test-takers each year compared to the engineering papers, so treat this solved paper as your main practice benchmark rather than searching for a large bank of mock tests.
- Attempt the questions PDF first as a timed 3-hour mock, without looking at the solutions
- Go through the solutions PDF question by question and note which topic area cost you the most marks
- Redo the quantitative ecology questions separately - the logistic growth, Simpson's index, and probability questions follow patterns you can drill
- Cross-check your answers against the official GATE 2026 answer key once IIT Guwahati releases it, since a few MSQ and NAT keys can carry challenge-window revisions
GATE 2026 Ecology and Evolution Question Paper FAQs
Ques. Is GATE Ecology and Evolution (EY) a new paper introduced in GATE 2026?
Ans. No. EY has been a standalone GATE paper since at least 2014, and it is not part of the combined Life Sciences (XL) paper. It has consistently tested population and community ecology, evolutionary biology, behavioural ecology, and quantitative ecology.
Ques. How many questions were there in GATE 2026 Ecology and Evolution and how are the marks split?
Ans. The paper had 65 questions in total - 10 General Aptitude questions worth 15 marks and 55 core Ecology and Evolution questions worth 85 marks, adding up to 100 marks across MCQ, MSQ, and NAT formats.
Ques. Which topics had the highest weightage in GATE 2026 Ecology and Evolution?
Ans. Population and community ecology, evolutionary genetics (Hardy-Weinberg, relatedness, fixation probability), behavioural ecology (kin selection, foraging theory, mimicry), and conservation biology carried the most questions, alongside several calculation-heavy quantitative ecology questions.
Ques. When will GATE 2026 Ecology and Evolution cutoffs and results be released?
Ans. GATE 2026 results and category-wise qualifying cutoffs are released by IIT Guwahati on the official website, gate2026.iitg.ac.in, roughly three weeks after the exam - check that page directly since EY-specific cutoffs are not published anywhere else in advance.
Ques. Is there negative marking in the MSQ and NAT questions of GATE Ecology and Evolution?
Ans. No. Negative marking in EY applies only to MCQs (1/3 mark deducted for a 1-mark question, 2/3 mark for a 2-mark question). MSQ and NAT questions carry zero negative marking, so it is always worth attempting them if you have a partial idea of the answer.
Ques. Where can I download the GATE 2026 Ecology and Evolution question paper with solutions PDF for free?
Ans. You can download both the question paper and the fully solved solutions PDF for free from the table at the top of this page on Collegedunia. The official, unsolved question paper and answer key are also available on gate2026.iitg.ac.in.



Comments