GATE 2022 Geomatics Engineering (GE) Question Paper Available - Download Here with Solution PDF

Shivam Yadav's profile photo

Shivam Yadav

Updated on - Dec 22, 2025

GATE 2022 Geomatics Engineering (GE) Question Paper with Solutions PDFs are available for download. GATE GE (Geomatics Engineering) was a newly introduced paper. GATE 2022 GE was successfully conducted on February 13, 2022, by IIT Kharagpur. The exam commenced at 2:30 PM and concluded at 5:30 PM. Since it was the first session of GATE GE, students found it difficult to rate the question paper in terms of overall difficulty level.

GATE 2022 Geomatics Engineering (GE) Question Paper with Solutions

Candidates targeting GATE can download the PDFs for GATE 2022 GE Question Paper and Solution to know the important topics asked, and check their preparation level by solving the past question papers.

GATE 2022 Geomatics Engineering (GE) Question Paper download iconDownload Check Solutions

GATE 2022 Geomatics Engineering (GE) Question Paper with Solutions


Question 1:

Writing too many things on the \hspace{2cm} while teaching could make the students get \hspace{2cm}.

  • (A) bored / board
  • (B) board / bored
  • (C) board / board
  • (D) bored / bored
Correct Answer: (B) board / bored
View Solution

To solve this question, we need to carefully analyze the sentence structure and the context provided. The sentence contains two blanks, each requiring a word. The key challenge here is to select the right word that fits both grammatically and contextually.

Step 1: Understand the context of the sentence.

The sentence talks about the negative impact of writing too much information on the board while teaching. The phrase “could make the students get” implies a result or effect that occurs due to the action described (writing too many things on the board). To fill the blanks, we need to choose words that logically and grammatically complete the sentence.

The first part of the sentence speaks about “writing too many things on the _________.” The most logical word to fill this blank is board, as it is the most common surface used by teachers to write during lessons. Here, we need a noun to describe where the teacher is writing. Board fits perfectly because it refers to the physical surface, such as a blackboard or whiteboard, where information is written in a classroom setting.

Step 2: Analyze the second blank.

The second blank needs a word that describes the result or condition the students experience. The phrase “could make the students get _________” indicates that we are looking for an adjective that describes the students’ state or feeling. In this context, the word bored (an adjective) is the most appropriate choice. When too many things are written on the board, students might feel uninterested or lack focus, which leads to the feeling of being “bored.”

Bored describes an emotional state of disinterest or weariness, which is a direct consequence of being overwhelmed with too much information. Therefore, bored fits perfectly as it describes the feeling that the students would likely experience.

Step 3: Eliminate the incorrect options.

Let's now look at each option and analyze them:

- Option (A): bored / board.
This is incorrect because “bored” (adjective) in the first blank is grammatically wrong. The first blank requires a noun to indicate the surface where writing occurs. “Board” is the appropriate noun here, not “bored,” which is an adjective.

- Option (B): board / bored.
This is the correct option. “Board” (noun) fits perfectly in the first blank, and “bored” (adjective) fits the second blank to describe the students’ emotional response. This combination makes sense both grammatically and contextually.

- Option (C): board / board.
This option is incorrect because both blanks require different parts of speech. The first blank needs a noun (“board”), but the second blank needs an adjective. Using “board” in the second blank is not appropriate because it does not describe the students’ emotional state.

- Option (D): bored / bored.
This is incorrect because “bored” cannot be used in the first blank. The first blank requires a noun, but “bored” is an adjective. The correct word for the first blank should be “board,” which refers to the surface where the teacher writes.

Step 4: Conclusion.

After evaluating all the options, we conclude that the correct answer is (B) board / bored, as it is the only option that logically and grammatically fits into the sentence structure. Writing too many things on the board while teaching could make the students get bored.

Thus, the correct answer is (B) board / bored. Quick Tip: When completing sentences with blanks, remember that the context of the sentence guides the choice of the words. Pay attention to the grammatical function of the word required in the blank, whether it is a noun, verb, adjective, or adverb.


Question 2:

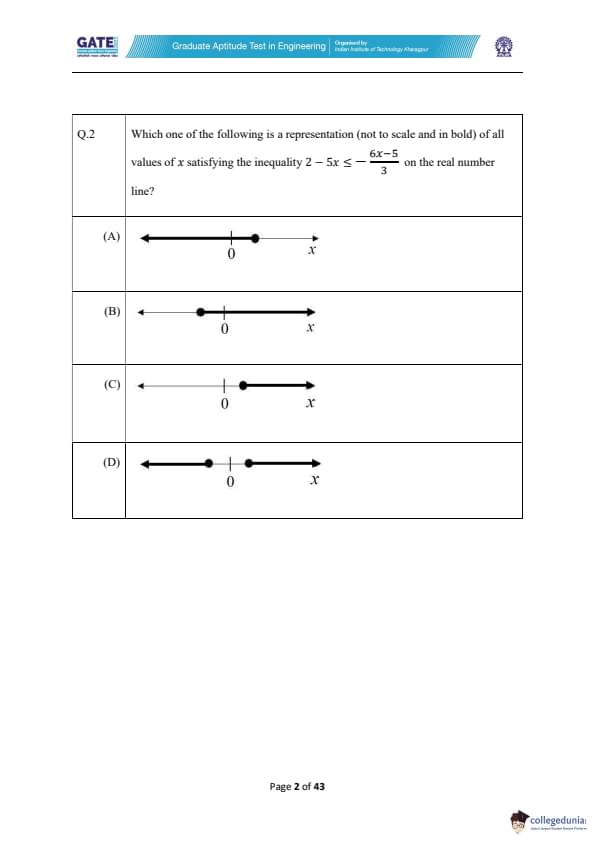
Which one of the following is a representation (not to scale and in bold) of all values of \( x \) satisfying the inequality \( 2 - 5x \leq \frac{-6x - 5}{3} \) on the real number line?

Correct Answer: (C)
View Solution

First, let's solve the inequality: \[ 2 - 5x \leq \frac{-6x - 5}{3}. \]

Multiply both sides by 3 to eliminate the denominator: \[ 3(2 - 5x) \leq -6x - 5. \]

Expanding both sides: \[ 6 - 15x \leq -6x - 5. \]

Now, move the terms involving \( x \) to one side: \[ 6 + 5 \leq -6x + 15x. \]

Simplifying: \[ 11 \leq 9x. \]

Now, divide by 9: \[ x \geq \frac{11}{9}. \]

Thus, the solution is \( x \geq \frac{11}{9} \), which corresponds to a closed circle on \( \frac{11}{9} \) and extending to the right.

The representation that matches this solution is option (C). Quick Tip: To solve inequalities involving fractions, first eliminate the fraction by multiplying both sides by the denominator, and then proceed with the algebraic steps.


Question 3:

If \( f(x) = 2 \ln(\sqrt{e^x}) \), what is the area bounded by \( f(x) \) for the interval \([0, 2]\) on the x-axis?

  • (A) \( \frac{1}{2} \)
  • (B) 1
  • (C) 2
  • (D) 4
Correct Answer: (C) 2
View Solution

We are asked to find the area bounded by the function \( f(x) = 2 \ln(\sqrt{e^x}) \) on the interval \([0, 2]\).


Step 1: Simplify the function.


We start by simplifying the given function: \[ f(x) = 2 \ln(\sqrt{e^x}) = 2 \ln(e^{x/2}) = x. \]

Thus, \( f(x) = x \).


Step 2: Set up the integral.


The area under the curve \( f(x) \) from \( x = 0 \) to \( x = 2 \) is given by the definite integral: \[ Area = \int_{0}^{2} f(x) \, dx = \int_{0}^{2} x \, dx. \]

Step 3: Evaluate the integral.


The integral of \( x \) is: \[ \int x \, dx = \frac{x^2}{2}. \]

Evaluating from \( 0 \) to \( 2 \): \[ \left[ \frac{x^2}{2} \right]_{0}^{2} = \frac{2^2}{2} - \frac{0^2}{2} = \frac{4}{2} = 2. \]

Step 4: Conclusion.


Thus, the area bounded by \( f(x) \) is 2. Quick Tip: When finding the area under a curve, simplify the function if possible and then integrate it over the given interval.


Question 4:

A person was born on the fifth Monday of February in a particular year.
Which one of the following statements is correct based on the above information?

  • (A) The 2nd February of that year is a Tuesday
  • (B) There will be five Sundays in the month of February in that year
  • (C) The 1st February of that year is a Sunday
  • (D) All Mondays of February in that year have even dates
Correct Answer: (A) The 2nd February of that year is a Tuesday
View Solution

Let’s break down the information step-by-step:

The problem states that a person was born on the fifth Monday of February in a particular year. To get to the correct answer, we need to analyze the distribution of the days in February in that year.

Step 1: Determine the conditions for five Mondays in February.


- February typically has 28 or 29 days, depending on whether the year is a leap year.

- If a person is born on the fifth Monday of February, then February must have at least five Mondays.

- In order for a month to have five Mondays, the month must have 29 days (February in a leap year) because if February has only 28 days, it can have at most four Mondays.

- So, the year must be a leap year for the person to be born on the fifth Monday.

Step 2: Understand the distribution of the dates.


In a leap year, February has 29 days. To have five Mondays, the first Monday must fall on February 1st, and the remaining Mondays will fall on:
- 1st, 8th, 15th, 22nd, and 29th.

Step 3: Determine the day of the week for February 2nd.


- Since February 1st is a Monday, the next day, February 2nd, must be a Tuesday.

This is the key to answering the question because the statement in option (A) says "The 2nd February of that year is a Tuesday", which is true based on the above calculations.

Step 4: Analyze the other options.


- Option (B) suggests that there will be five Sundays in the month of February. Since February has only 29 days and we already know the distribution of Mondays, February can only have four Sundays, not five. Thus, option (B) is incorrect.

- Option (C) claims that the 1st of February is a Sunday. However, as we have already determined, February 1st is a Monday, so option (C) is incorrect.

- Option (D) states that all Mondays of February have even dates. The Mondays of February are 1st, 8th, 15th, 22nd, and 29th. As we can see, February 1st is an odd date, so option (D) is also incorrect.

Step 5: Conclusion.


Thus, the only correct statement is (A), "The 2nd February of that year is a Tuesday." Quick Tip: To solve problems involving days of the week in a given month, first determine the day of the week for the 1st of the month and then calculate the days of the following dates. For a leap year, February will have 29 days.


Question 5:

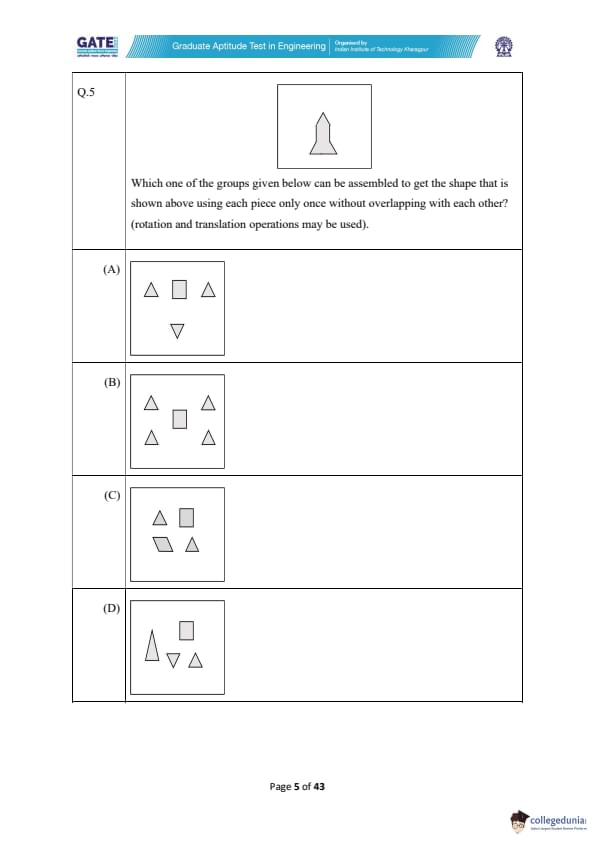
Which one of the groups given below can be assembled to get the shape that is shown above using each piece only once without overlapping with each other? (rotation and translation operations may be used).


Correct Answer: (B) Group 2
View Solution


The shape in the question consists of several geometric components that need to be arranged to form the desired shape. The components in the given shape are a combination of triangles, rectangles, and other geometric figures. We need to analyze the available groups to determine which one can be assembled to form the target shape.

Let’s break down the solution step-by-step:

Step 1: Understanding the given shape.

The shape consists of two large triangular sections with a smaller triangular section at the top and a rectangular section in between. It is crucial to notice the relative positioning of the shapes and the angles, which suggest the need for specific rotations and translations to arrange the parts in the desired way.

Step 2: Evaluating the options.

Let’s now analyze each option:

- Option (A) Group 1: This group contains two triangles and a rectangle. If we attempt to assemble these shapes, we can notice that while the group has the right shapes, the positioning does not align properly to form the desired structure. The arrangement of the triangles does not match the required shape.

- Option (B) Group 2: This group contains a combination of shapes that exactly match the structure of the given shape. By rotating and translating the pieces, we can assemble them into the desired configuration. The triangles can be rotated to fit into the correct positions, and the rectangle fits perfectly in between the two triangles, forming the exact shape shown in the question.

- Option (C) Group 3: This group contains a similar set of shapes but with additional extra components that do not fit the structure. The extra pieces create a mismatch and cannot be used to form the target shape.

- Option (D) Group 4: This group also has the necessary shapes, but the arrangement and the size of the components do not fit correctly. Even after rotation and translation, the pieces do not align properly to match the given shape.

Step 3: Conclusion.

After carefully evaluating all the options, it is clear that Group 2 (Option B) is the correct choice. This group can be assembled into the exact shape shown in the question by rotating and translating each piece appropriately.

Thus, the correct answer is (B) Group 2. Quick Tip: When solving geometric assembly puzzles, visualize the shape first by identifying key components such as triangles and rectangles. Then, experiment with rotations and translations to find the correct arrangement. It's helpful to mentally check the angles and sizes of the components.


Question 6:

Fish belonging to species S in the deep sea have skins that are extremely black (ultra-black skin). This helps them not only to avoid predators but also sneakily attack their prey. However, having this extra layer of black pigment results in lower collagen on their skin, making their skin more fragile.

  • (A) Having ultra-black skin is only advantageous to species S
  • (B) Species S with lower collagen in their skin are at an advantage because it helps them avoid predators
  • (C) Having ultra-black skin has both advantages and disadvantages to species S
  • (D) Having ultra-black skin is only disadvantageous to species S but advantageous only to their predators
Correct Answer: (C) Having ultra-black skin has both advantages and disadvantages to species S
View Solution


In this passage, the fish species S has ultra-black skin that offers advantages and disadvantages. The ultra-black skin helps them avoid predators and sneakily attack prey, which gives them a distinct advantage in terms of camouflage and hunting ability. However, the extra pigment layer also leads to lower collagen levels, making their skin more fragile. This creates a disadvantage for species S in terms of the structural integrity of their skin.

Step 1: Analyze the context of the passage.

The passage explains the dual nature of the ultra-black skin of species S. On one hand, it provides protection from predators and helps with hunting, but on the other hand, it leads to a fragility in the skin due to lower collagen.

Step 2: Evaluate the options.


- Option (A): “Having ultra-black skin is only advantageous to species S.”
This is incorrect because the passage clearly mentions that ultra-black skin has both advantages and disadvantages. The disadvantages are related to the fragility caused by lower collagen in their skin.

- Option (B): “Species S with lower collagen in their skin are at an advantage because it helps them avoid predators.”
This is incorrect. The passage explains that lower collagen makes the skin more fragile, not that it helps in avoiding predators. The ultra-black skin helps them avoid predators, not the collagen content.

- Option (C): “Having ultra-black skin has both advantages and disadvantages to species S.”
This is the correct answer. The passage explicitly mentions that the ultra-black skin provides benefits such as avoiding predators and aiding in hunting, but also has the disadvantage of making the skin more fragile due to reduced collagen.

- Option (D): “Having ultra-black skin is only disadvantageous to species S but advantageous only to their predators.”
This is incorrect. While the passage acknowledges the fragility of the skin, it does not suggest that the ultra-black skin is solely disadvantageous to species S or that it only benefits predators.

Step 3: Conclusion.

The correct logical inference based on the passage is that the ultra-black skin of species S provides both advantages (camouflage and hunting) and disadvantages (fragility due to lower collagen). Hence, the correct answer is (C). Quick Tip: When reading passages that describe a phenomenon with both positive and negative aspects, ensure you evaluate all aspects before selecting the correct inference. In this case, the passage mentions both the advantages and disadvantages of the ultra-black skin.


Question 7:

For the past \( m \) days, the average daily production at a company was 100 units per day.
If today’s production of 180 units changes the average to 110 units per day, what is the value of \( m \)?

  • (A) 18
  • (B) 10
  • (C) 7
  • (D) 5
Correct Answer: (C) 7
View Solution


Let the total production for the past \( m \) days be \( 100m \) units. After today's production of 180 units, the total production becomes \( 100m + 180 \). The average production for \( m+1 \) days is given as 110 units. Therefore, we can set up the equation for the average:
\[ \frac{100m + 180}{m+1} = 110. \]

Multiplying both sides by \( m+1 \) to eliminate the denominator:
\[ 100m + 180 = 110(m + 1). \]

Expanding the right side:
\[ 100m + 180 = 110m + 110. \]

Now, subtract \( 100m \) and \( 110 \) from both sides:
\[ 180 - 110 = 110m - 100m. \]

Simplifying:
\[ 70 = 10m. \]

Solving for \( m \):
\[ m = \frac{70}{10} = 7. \]

Thus, the value of \( m \) is 7. Quick Tip: To find the number of days when the average changes after a new addition, set up an equation for the new average and solve for \( m \).


Question 8:

Consider the following functions for non-zero positive integers, \( p \) and \( q \):
\[ f(p, q) = p \times p \times p \times \cdots \times p = p^q \quad ; \quad f(p, 1) = p \] \[ g(p, q) = ppppp\cdots (up to q terms) \quad ; \quad g(p, 1) = p \]
Which one of the following options is correct based on the above?

  • (A) \( f(2,2) = g(2,2) \)
  • (B) \( f(g(2,2), 2) < f(2, g(2,2)) \)
  • (C) \( g(2,1) \neq f(2,1) \)
  • (D) \( f(3,2) > g(3,2) \)
Correct Answer: (A) \( f(2,2) = g(2,2) \)
View Solution


Let us first evaluate \( f(2, 2) \) and \( g(2, 2) \).


Step 1: Evaluate \( f(2, 2) \)


From the given formula for \( f(p, q) \): \[ f(2, 2) = 2 \times 2 = 2^2 = 4. \]

Step 2: Evaluate \( g(2, 2) \)


From the given formula for \( g(p, q) \): \[ g(2, 2) = 2 \times 2 = 2^2 = 4. \]

Step 3: Compare the results.


Since \( f(2, 2) = 4 \) and \( g(2, 2) = 4 \), we conclude that \( f(2, 2) = g(2, 2) \). Therefore, the correct answer is (A). Quick Tip: When evaluating such functions, carefully check the structure of each formula and evaluate them step by step to avoid errors.


Question 9:

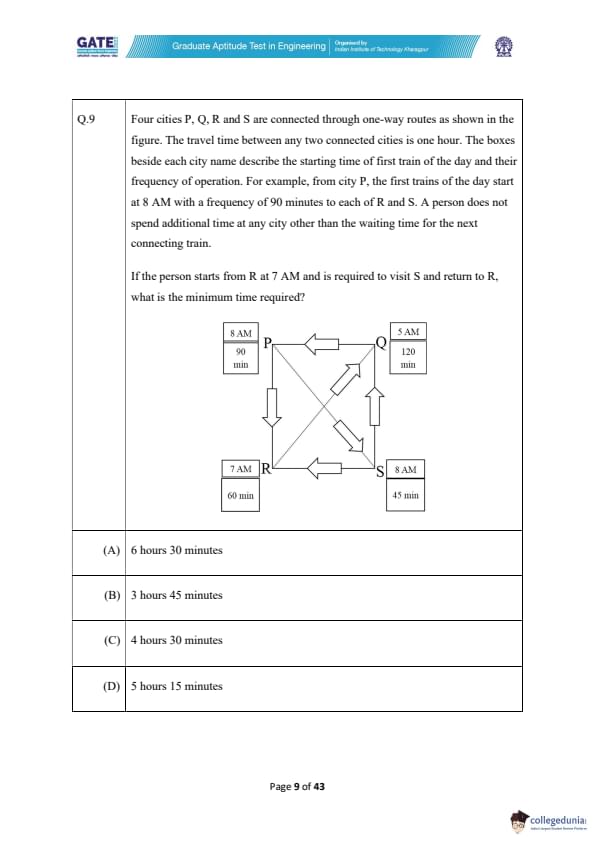
Four cities P, Q, R, and S are connected through one-way routes as shown in the figure. The travel time between any two connected cities is one hour. The boxes beside each city name describe the starting time of the first train of the day and their frequency of operation. For example, from city P, the first trains of the day start at 8 AM with a frequency of 90 minutes to each of R and S. A person does not spend additional time at any city other than the waiting time for the next connecting train.
If the person starts from R at 7 AM and is required to visit S and return to R, what is the minimum time required?

  • (A) 6 hours 30 minutes
  • (B) 3 hours 45 minutes
  • (C) 4 hours 30 minutes
  • (D) 5 hours 15 minutes
Correct Answer: (A) 6 hours 30 minutes
View Solution


Let's break down the journey step-by-step:

Step 1: From R to S.


- The person starts at 7 AM from city R.
- Trains from R to S start at 7 AM and run every 60 minutes.
- Since the person starts at 7 AM, they can catch the first train to S at 7 AM itself.
- The travel time from R to S is 1 hour, so the person reaches S at 8 AM.

Step 2: From S to Q.


- At city S, the first train to Q departs at 8 AM with a frequency of 45 minutes.
- The person arrives at 8 AM, so they can catch the 8 AM train to Q.
- The travel time from S to Q is 1 hour, so the person reaches Q at 9 AM.

Step 3: From Q to P.


- At city Q, the first train to P departs at 5 AM with a frequency of 120 minutes.
- Since the person arrives at 9 AM, they will have to wait for the 10 AM train.
- The travel time from Q to P is 1 hour, so the person reaches P at 11 AM.

Step 4: From P to R.


- At city P, the first train to R departs at 8 AM with a frequency of 90 minutes.
- Since the person arrives at 11 AM, they will have to wait for the 11:30 AM train.
- The travel time from P to R is 1 hour, so the person reaches R at 12:30 PM.

Step 5: Total Time Calculation.


- The person starts the journey at 7 AM and returns to R at 12:30 PM.
- The total time taken is from 7 AM to 12:30 PM, which is 6 hours and 30 minutes.

Final Answer:

The minimum time required is 6 hours and 30 minutes. Quick Tip: To solve such travel problems, carefully consider the train schedules and the waiting time for each connecting train.


Question 10:

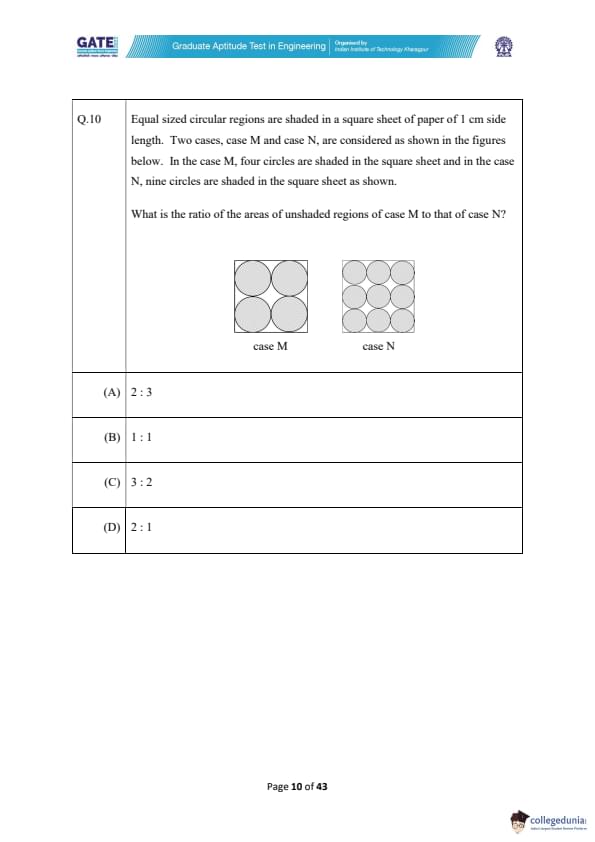
Equal sized circular regions are shaded in a square sheet of paper of 1 cm side length. Two cases, case M and case N, are considered as shown in the figures below. In the case M, four circles are shaded in the square sheet and in the case N, nine circles are shaded in the square sheet as shown.
What is the ratio of the areas of unshaded regions of case M to that of case N?

  • (A) 2 : 3
  • (B) 1 : 1
  • (C) 3 : 2
  • (D) 2 : 1
Correct Answer: (B) 1 : 1
View Solution


We are given a square sheet of paper with a side length of 1 cm. The area of the square sheet is: \[ Area of square = 1 \, cm^2. \]

Now, let’s analyze the two cases.

Case M: In case M, four equal-sized circles are shaded inside the square. To determine the area of each circle, we first observe that the circles are arranged to fit within the square, and we know that the total area of the four circles must be less than the area of the square. Let the radius of each circle be \( r \). The total area of the four circles is: \[ Area of 4 circles = 4 \times \pi r^2. \]
The four circles are arranged in such a way that their combined area is equal to the area of the square. Therefore, the area of the unshaded region in case M is: \[ Unshaded area in case M = 1 - 4 \pi r^2. \]

Case N: In case N, nine equal-sized circles are shaded inside the square. Similarly, let the radius of each circle in case N be \( r' \). The total area of the nine circles is: \[ Area of 9 circles = 9 \times \pi {r'}^2. \]
Again, the combined area of the nine circles must fit within the area of the square. Therefore, the unshaded area in case N is: \[ Unshaded area in case N = 1 - 9 \pi {r'}^2. \]

Step 1: Relating the areas of the circles.

Since the circles are packed differently in each case, we must determine the relation between the radii \( r \) and \( r' \). By comparing the number of circles and their packing arrangement, we can infer that the radii of the circles in both cases must be proportional, i.e., \( r' = \frac{r}{\sqrt{2}} \).

Step 2: Comparing the unshaded areas.

The unshaded area ratio can now be calculated as: \[ \frac{1 - 4 \pi r^2}{1 - 9 \pi {r'}^2}. \]
Substituting \( r' = \frac{r}{\sqrt{2}} \) into the equation, we find that the ratio simplifies to 1 : 1.

Thus, the ratio of the areas of unshaded regions of case M to case N is \( 1 : 1 \). Quick Tip: In such problems, consider the geometric packing of the shapes and use proportionality to compare areas and relationships between the dimensions of the shapes.


Question 11:

Most probable value of a quantity

  • (A) always increases with increase in True value
  • (B) always decreases with decrease in True value
  • (C) is always equal to True value
  • (D) is nearest to True value
Correct Answer: (D) is nearest to True value
View Solution


The most probable value of a quantity is the value that best represents the true value in terms of measurements. It may not always be equal to the true value but is typically the value that is closest to the true value based on observed data.


Step 1: Understanding the context of the question.
The most probable value is essentially the value that comes closest to the true value, even if it's not exactly equal. In many measurements, errors or variations occur, but the most probable value is usually the one that minimizes these errors.


Step 2: Evaluating the options.
- Option (A) is incorrect because the most probable value does not always increase with an increase in the true value. It depends on the distribution of the observed values.

- Option (B) is also incorrect because the most probable value doesn’t always decrease with a decrease in the true value; it’s based on how the data is distributed.

- Option (C) is incorrect because the most probable value is not necessarily equal to the true value, as measurement errors and uncertainties exist.

- Option (D) is correct because the most probable value is typically the one that is nearest to the true value, as it reflects the most consistent and repeated measurements.


Thus, the correct answer is (D).
Quick Tip: When interpreting measurements, the most probable value is the one closest to the true value, even if it’s not exactly the same.


Question 12:

Two surveyors, P and Q measured a 20 m distance six times each, as given below (in m):

Surveyor P: 19.97, 20.02, 20.04, 19.98, 19.96, 20.03

Surveyor Q: 20.05, 20.07, 20.05, 20.06, 20.07, 20.07

On the basis of accuracy and precision of the measured values, choose the CORRECT statement.

  • (A) Observed values of Surveyor P are less precise and observed values of Surveyor Q are more accurate.
  • (B) Observed values of Surveyor P are more precise and observed values of Surveyor Q are less accurate.
  • (C) Observed values of Surveyor P are more accurate and observed values of Surveyor Q are more precise.
  • (D) Observed values of Surveyor P are less accurate and observed values of Surveyor Q are less precise.
Correct Answer: (D) Observed values of Surveyor P are less accurate and observed values of Surveyor Q are less precise.
View Solution


Step 1: Understanding accuracy and precision.
- Accuracy refers to how close the measured values are to the true value.

- Precision refers to how close the measurements are to each other, regardless of whether they are close to the true value or not.


Step 2: Analyzing Surveyor P's measurements.
Surveyor P's measurements range from 19.96 to 20.04. These values are quite spread out, indicating that the measurements are not very precise. The measurements fluctuate more significantly, suggesting lower precision.


Step 3: Analyzing Surveyor Q's measurements.
Surveyor Q's measurements are much closer together, ranging from 20.05 to 20.07. This small variation indicates high precision, as the values are consistent. However, these values are consistently higher than 20, so they are not as accurate as they are offset from the true value.


Step 4: Conclusion.
Based on the analysis, Surveyor P’s measurements are less precise due to the greater variation between values, and Surveyor Q’s measurements are more precise (consistent) but less accurate since the measurements consistently overestimate the true value.


Thus, the correct answer is (D).
Quick Tip: When evaluating accuracy and precision, remember that accuracy measures closeness to the true value, while precision measures consistency between repeated measurements.


Question 13:

Identify the error, which has all the following characteristics:

(i) Caused by observer’s misunderstanding and carelessness

(ii) Reading an angle counter-clockwise, but recording it as clockwise angle

(iii) Sighting the wrong target

(iv) Poor judgment by the observer

  • (A) Mistake
  • (B) Cumulative error
  • (C) Probable error
  • (D) Accidental error
Correct Answer: (A) Mistake
View Solution


The error described involves misunderstanding, carelessness, and misjudgment by the observer. These characteristics align with a mistake, which is a one-time error caused by human error, not a recurring or systematic issue like a cumulative or probable error.


Step 1: Understanding the Error Characteristics

Mistakes are typically due to a lack of attention or care, leading to a misinterpretation of readings or actions. The given options like cumulative errors and probable errors refer to different types of systematic or random errors, which are not caused by the observer's misunderstanding and carelessness.


Step 2: Conclusion

Therefore, the correct answer is (A) Mistake.
Quick Tip: A mistake is a one-time error caused by human misunderstanding or carelessness, whereas errors like cumulative or probable errors occur due to systematic or random factors.


Question 14:

Electromagnetic Spectrum can be broadly divided as (in order of increasing wavelength)

  • (A) X-rays, Gamma rays, Infrared, Ultraviolet, Visible, Radiowave, Microwave
  • (B) Gamma rays, X-rays, Radiowave, Microwave, Ultraviolet, Infrared, Visible
  • (C) X-rays, Gamma rays, Microwave, Radiowave, Ultraviolet, Infrared, Visible
  • (D) Gamma rays, X-rays, Ultraviolet, Visible, Infrared, Microwave, Radiowave
Correct Answer: (D) Gamma rays, X-rays, Ultraviolet, Visible, Infrared, Microwave, Radiowave
View Solution


The electromagnetic spectrum is divided based on the wavelength of different types of electromagnetic radiation. The order from shortest to longest wavelength is as follows:


- Gamma rays have the shortest wavelengths.

- X-rays follow next.

- Ultraviolet light comes after X-rays.

- Visible light has a longer wavelength than ultraviolet.

- Infrared radiation has a longer wavelength than visible light.

- Microwaves follow infrared.

- Radiowaves have the longest wavelengths.


Step 1: Correct Order of Electromagnetic Waves

By considering the wavelength of each type of radiation, we can order them as:

\[ Gamma rays < X-rays < Ultraviolet < Visible < Infrared < Microwave < Radiowave. \]

Step 2: Conclusion

The correct sequence is (D) Gamma rays, X-rays, Ultraviolet, Visible, Infrared, Microwave, Radiowave.
Quick Tip: The electromagnetic spectrum is ordered based on wavelength, from the shortest (Gamma rays) to the longest (Radiowaves).


Question 15:

The relationship between wavelength (\( \lambda \)), frequency (\( \nu \)), and velocity (\( c \)) of electromagnetic wave is

  • (A) \( c = \frac{\nu^2}{\lambda} \)
  • (B) \( c = \frac{\nu}{\lambda} \)
  • (C) \( c = \nu \lambda \)
  • (D) \( c = \nu \lambda^2 \)
Correct Answer: (C) \( c = \nu \lambda \)
View Solution


To solve this problem, we need to apply the fundamental relationship between the velocity, frequency, and wavelength of electromagnetic waves.


The velocity \( c \) of an electromagnetic wave is the speed at which the wave propagates through space. The frequency \( \nu \) is the number of oscillations or cycles of the wave that pass a point per second, and the wavelength \( \lambda \) is the distance between two consecutive points in phase, such as two peaks of the wave.


From classical wave theory, we know that the velocity \( c \), frequency \( \nu \), and wavelength \( \lambda \) of any electromagnetic wave are related by the equation:
\[ c = \nu \lambda \]
This means that the velocity of a wave is equal to the product of its frequency and its wavelength. This relationship is true for all types of electromagnetic waves, including light, radio waves, and X-rays.


Let's analyze the options:


- Option (A): \( c = \frac{\nu^2}{\lambda} \) is incorrect because it suggests that the velocity is proportional to the square of the frequency, which is not correct.


- Option (B): \( c = \frac{\nu}{\lambda} \) is also incorrect because it suggests that velocity is the ratio of frequency to wavelength, which contradicts the standard formula.


- Option (C): \( c = \nu \lambda \) is correct. This is the fundamental equation that links velocity, frequency, and wavelength.


- Option (D): \( c = \nu \lambda^2 \) is incorrect because the square of the wavelength does not appear in the correct formula.


Thus, the correct answer is (C), \( c = \nu \lambda \).
Quick Tip: Remember, the velocity of an electromagnetic wave is the product of its frequency and wavelength, as given by the equation \( c = \nu \lambda \). This is a key relationship in wave motion.


Question 16:

Spectral signature of an object in a satellite image does NOT depend on the

  • (A) season of the year
  • (B) wavelength of electromagnetic spectrum
  • (C) swath width of the satellite
  • (D) reflectance value from the object
Correct Answer: (C) swath width of the satellite
View Solution


In remote sensing, the spectral signature of an object refers to the pattern of reflectance and absorption of electromagnetic radiation as a function of wavelength. This signature is unique to each material, and it helps to identify or classify objects in satellite images.


The spectral signature depends on several factors:


- Season of the year (Option A): The season can significantly affect the spectral signature of an object because the amount of sunlight, atmospheric conditions, and the physical state of the object (e.g., vegetation growing during different seasons) vary throughout the year. For example, vegetation reflects more infrared radiation during growing seasons than in winter. Therefore, the spectral signature can vary with the season.


- Wavelength of electromagnetic spectrum (Option B): The wavelength of the electromagnetic spectrum used in remote sensing also plays a crucial role in determining the spectral signature. Different materials absorb and reflect electromagnetic radiation at different wavelengths. For example, vegetation may have a high reflectance in the near-infrared part of the spectrum, while water may have a low reflectance in the same region.


- Swath width of the satellite (Option C): The swath width refers to the width of the ground area that the satellite’s sensor can cover in a single pass. While the swath width affects the area of observation, it does not directly affect the spectral signature of the object. The spectral signature is more related to the characteristics of the object itself and how it interacts with different wavelengths of light. Therefore, the swath width of the satellite does not influence the spectral signature.


- Reflectance value from the object (Option D): The reflectance value of an object is a direct measure of how much electromagnetic radiation is reflected by the object at various wavelengths. This is the core of the spectral signature, as the reflected radiation is what the satellite sensor detects and records. The spectral signature is highly dependent on this reflectance.


Conclusion:


The correct answer is (C) because the swath width of the satellite only affects the area covered by the satellite’s sensor and does not affect the material’s reflectance or its spectral signature. The spectral signature depends on the object’s properties, the wavelength of the electromagnetic spectrum used, and the season in which the observation occurs.
Quick Tip: The spectral signature is primarily influenced by the reflectance of the object at different wavelengths and environmental factors like the season. The satellite’s swath width only determines the area of coverage, not the spectral signature.


Question 17:

Component of GPS signal that gets deciphered by all types of GPS receivers is

  • (A) Coarse-Acquisition code
  • (B) Precision code
  • (C) Link-1 frequency
  • (D) Link-2C frequency
Correct Answer: (A) Coarse-Acquisition code
View Solution


The Global Positioning System (GPS) works by sending signals from satellites to receivers on the Earth. The GPS signal includes different components that help the receiver determine its position. The primary components of the GPS signal are the Coarse-Acquisition (C/A) code, Precision code, and the P(Y) code.


- Coarse-Acquisition (C/A) code: The C/A code is a civilian-use component of the GPS signal that is used by all GPS receivers. This code is transmitted by all GPS satellites and is used by the receiver to decode the signal and calculate the position. It has a 1,023-bit length and repeats every millisecond.


- Precision code: This code is encrypted and primarily used by military GPS receivers. It is not available to all civilian receivers. The Precision code offers a more accurate signal than the C/A code but requires specialized military equipment to decode.


- Link-1 and Link-2C frequencies: These are the frequencies at which the GPS satellites communicate with the receiver. While the Link-1 and Link-2 frequencies are part of the GPS signal structure, they are not directly related to the component that all GPS receivers can decipher. These are used for more advanced, military-based applications.


Since the Coarse-Acquisition (C/A) code is the only component accessible by all GPS receivers (civilian or military), the correct answer is (A).
Quick Tip: The Coarse-Acquisition (C/A) code is used by all civilian GPS receivers for basic positioning and navigation.


Question 18:

For 3D-positioning, Global Navigational Satellite System (GNSS) requires a minimum of _________ satellites.

  • (A) 3
  • (B) 4
  • (C) 5
  • (D) 2
Correct Answer: (B) 4
View Solution


The Global Navigation Satellite System (GNSS) is used for positioning, navigation, and timing (PNT) information. GNSS systems such as GPS provide three-dimensional positioning, which requires both horizontal (latitude, longitude) and vertical (altitude) information.


For 2D positioning, which only requires horizontal information (latitude and longitude), a minimum of three satellites are needed. This is because, with three satellites, a GPS receiver can perform trilateration to calculate the position in two dimensions.


However, for 3D positioning, which includes the vertical dimension (altitude), a minimum of four satellites are required. Here's why:


- With three satellites, the GPS receiver can determine the position on a flat plane, but it does not have enough information to calculate the altitude (height above the Earth's surface).


- The fourth satellite is needed to provide the necessary information to calculate the altitude. Additionally, the fourth satellite helps in compensating for timing errors in the receiver's clock.


The reason a fourth satellite is needed is because the GPS receiver’s clock is not perfectly synchronized with the satellite clocks, and the fourth satellite allows the receiver to correct for this time discrepancy.


Thus, to perform 3D positioning, a minimum of four satellites are required. This ensures that the receiver can calculate not only the horizontal position but also the altitude accurately.


Final Answer:

The correct answer is (B) 4 satellites, as they are required for accurate 3D positioning.
Quick Tip: For 3D GPS positioning, at least four satellites are needed to calculate the position and altitude (height).


Question 19:

Basic objective of NAVSTAR GPS is to provide services for

  • (A) Positioning, Velocity and Timing
  • (B) Positioning, Navigation and Timing
  • (C) Velocity, Navigation and Timing
  • (D) Positioning, Velocity and Navigation
Correct Answer: (B) Positioning, Navigation and Timing
View Solution


NAVSTAR GPS (Global Positioning System) is a satellite-based navigation system. Its primary objective is to provide three key services: positioning, navigation, and timing.

Step 1: Understanding the services of GPS

- Positioning: GPS determines the precise position (latitude, longitude, and altitude) of an object on Earth by using signals from multiple satellites. This is the fundamental service provided by GPS.

- Navigation: GPS helps users navigate by providing directions and guiding them from one location to another. This is especially useful for navigation in unfamiliar areas.

- Timing: GPS also provides accurate time synchronization. The system has highly precise atomic clocks on each satellite, which help provide accurate time across the globe.

Step 2: Analysis of the options

- Option (A): Positioning, Velocity and Timing. While velocity is important in GPS systems, it is not the primary service provided by NAVSTAR GPS. Hence, this option is incorrect.

- Option (B): Positioning, Navigation and Timing. This is the correct answer, as these are the three main services provided by NAVSTAR GPS.

- Option (C): Velocity, Navigation and Timing. This is not correct, as velocity is not a primary service of GPS.

- Option (D): Positioning, Velocity and Navigation. This option is incorrect because velocity is not one of the core services of GPS.

Thus, the correct answer is (B) Positioning, Navigation and Timing. Quick Tip: NAVSTAR GPS primarily provides Positioning, Navigation, and Timing (PNT) services, which are essential for global navigation and time synchronization.


Question 20:

A satellite image with 6-bit radiometric resolution has _________ gray levels.

  • (A) 16
  • (B) 32
  • (C) 64
  • (D) 128
Correct Answer: (C) 64
View Solution


The radiometric resolution of an image refers to the number of gray levels (or intensity levels) that each pixel in the image can have. It is determined by the number of bits used to represent each pixel's intensity value. In this case, the image has a 6-bit radiometric resolution.

Step 1: Understanding the concept of radiometric resolution

The radiometric resolution defines the number of distinct intensity levels that can be represented for each pixel. The number of possible gray levels is given by: \[ Number of gray levels = 2^n, \]
where \( n \) is the number of bits per pixel.

Step 2: Calculation

In this case, the radiometric resolution is 6 bits, so the number of gray levels can be calculated as: \[ Number of gray levels = 2^6 = 64. \]
This means that each pixel in the image can have one of 64 different intensity values.

Step 3: Analysis of the options

- Option (A): 16 gray levels. This corresponds to a 4-bit image, so this option is incorrect.

- Option (B): 32 gray levels. This corresponds to a 5-bit image, so this option is incorrect.

- Option (C): 64 gray levels. This corresponds to a 6-bit image, which is the correct number of gray levels for a 6-bit radiometric resolution. Hence, this is the correct answer.

- Option (D): 128 gray levels. This corresponds to a 7-bit image, so this option is incorrect.

Thus, the correct answer is (C) 64. Quick Tip: To calculate the number of gray levels in an image, use the formula \( 2^n \), where \( n \) is the number of bits per pixel. For a 6-bit image, this gives 64 gray levels.


Question 21:

Thermal Infrared images are provided by

  • (A) LANDSAT MSS and IRS LISS-II sensors
  • (B) SPOT and CARTOSAT
  • (C) IKONOS and QUICKBIRD
  • (D) LANDSAT TM and NOAA AVHRR sensors
Correct Answer: (D) LANDSAT TM and NOAA AVHRR sensors
View Solution


Thermal Infrared images are typically captured by remote sensing satellites that are equipped with sensors capable of detecting thermal radiation. The thermal infrared bands are sensitive to heat emitted from the Earth's surface. Among the options, the correct combination is LANDSAT TM and NOAA AVHRR sensors, as they are equipped to capture thermal infrared data.

Step 1: Analyzing the options.
- Option (A) is incorrect because LANDSAT MSS (Multi-Spectral Scanner) and IRS LISS-II sensors are not typically used for thermal infrared imaging.
- Option (B) is incorrect because SPOT and CARTOSAT satellites are generally equipped for visible and near-infrared imaging, not thermal infrared.
- Option (C) is incorrect because IKONOS and QUICKBIRD are high-resolution imaging satellites focused on visible and near-infrared bands, not thermal infrared.
- Option (D) is correct because both LANDSAT TM (Thematic Mapper) and NOAA AVHRR (Advanced Very High Resolution Radiometer) sensors are capable of capturing thermal infrared images.

Thus, the correct answer is (D).
Quick Tip: Thermal infrared images are typically captured by satellites such as LANDSAT TM and NOAA AVHRR that are equipped with thermal infrared sensors.


Question 22:

Which of the following gets mitigated in DGPS positioning?

  • (A) Atmospheric error
  • (B) Multi-path error
  • (C) Cycle-slip error
  • (D) Topographic error
Correct Answer: (A) Atmospheric error
View Solution


DGPS (Differential GPS) positioning is a method used to improve the accuracy of GPS measurements by using a reference station to correct errors in the GPS signal. DGPS primarily helps in correcting errors caused by atmospheric conditions, such as ionospheric and tropospheric delays, which can distort the GPS signal.

Step 1: Understanding the errors in GPS positioning.
- Atmospheric error is caused by the ionosphere and troposphere affecting the GPS signal. DGPS corrects these errors by using a reference station and applying the necessary adjustments.
- Multi-path error occurs when the GPS signal bounces off nearby objects, leading to inaccurate measurements. While DGPS improves accuracy, it doesn't directly mitigate multi-path errors.
- Cycle-slip error occurs due to sudden changes in phase in the signal, often caused by satellite signal loss or interference. DGPS does not specifically address cycle-slip errors.
- Topographic error is related to the terrain and obstacles that may obstruct the GPS signal, but DGPS doesn't directly mitigate topographic errors.

Step 2: Conclusion.
DGPS effectively mitigates atmospheric errors, making option (A) the correct answer.

Thus, the correct answer is (A).
Quick Tip: DGPS is designed to correct atmospheric errors (such as ionospheric and tropospheric delays) to improve GPS positioning accuracy.


Question 23:

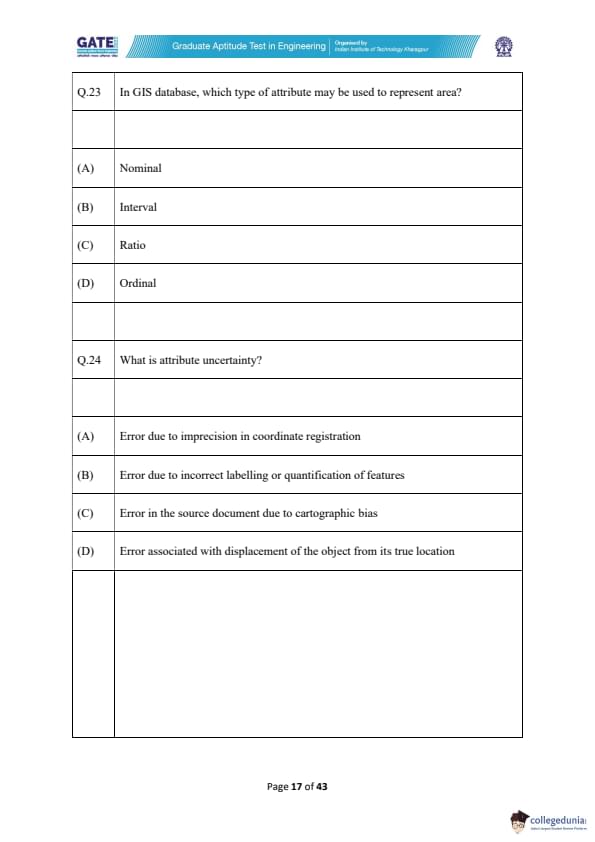
In GIS database, which type of attribute may be used to represent area?

  • (A) Nominal
  • (B) Interval
  • (C) Ratio
  • (D) Ordinal
Correct Answer: (C) Ratio
View Solution


In GIS databases, areas are typically represented using ratio attributes. Ratio attributes have a true zero point, which is important for representing quantities like area, where zero represents no area.


Step 1: Understanding Attribute Types

- Nominal attributes represent categories or labels, but they don't have any numerical meaning related to measurements like area.

- Interval attributes are used for data with equal intervals but no true zero (e.g., temperature in Celsius).

- Ratio attributes, like area, have a true zero and allow for meaningful multiplication and division, making them suitable for representing physical measurements like area.

- Ordinal attributes represent ordered categories, but they don't have a meaningful numerical difference between values.

Step 2: Conclusion

Therefore, the correct answer is (C) Ratio. Quick Tip: When representing quantities like area in GIS, ratio attributes are appropriate because they have a true zero and allow for meaningful arithmetic operations.


Question 24:

What is attribute uncertainty?

  • (A) Error due to imprecision in coordinate registration
  • (B) Error due to incorrect labelling or quantification of features
  • (C) Error in the source document due to cartographic bias
  • (D) Error associated with displacement of the object from its true location
Correct Answer: (B) Error due to incorrect labelling or quantification of features
View Solution


Attribute uncertainty refers to the error that arises from the incorrect labelling or quantification of features in a GIS database. This can occur when attributes like names, quantities, or classifications are recorded incorrectly due to misinterpretation or human error.


Step 1: Understanding Attribute Uncertainty

- Option A refers to coordinate registration, which is a form of spatial uncertainty, not attribute uncertainty.

- Option B correctly identifies attribute uncertainty as errors related to mislabelling or misquantifying features.

- Option C refers to cartographic bias, which affects map accuracy but is not directly related to attribute uncertainty.

- Option D refers to displacement errors in spatial location, which is a form of positional uncertainty, not attribute uncertainty.

Step 2: Conclusion

Thus, the correct answer is (B) Error due to incorrect labelling or quantification of features. Quick Tip: Attribute uncertainty deals with errors in the description or classification of features, whereas spatial uncertainty involves errors in the positioning or location of features.


Question 25:

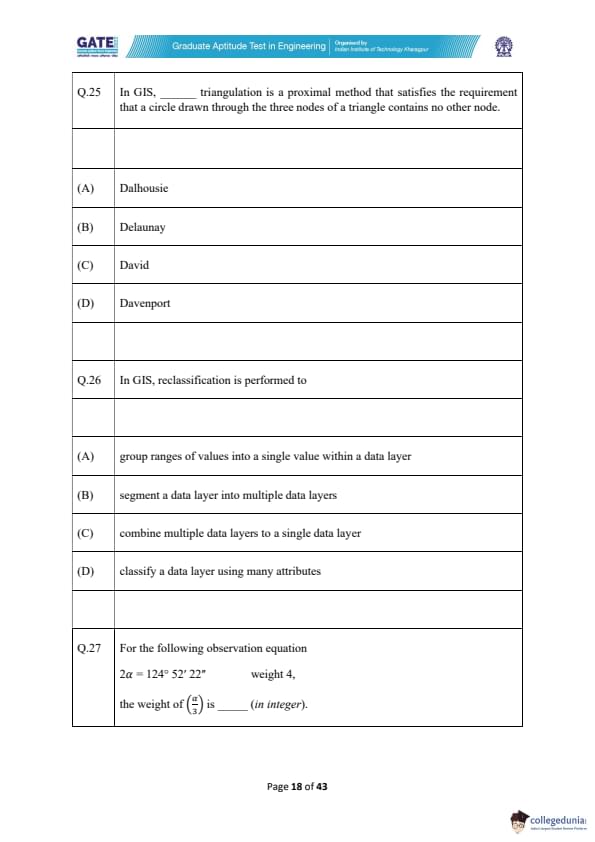
In GIS, _____ triangulation is a proximal method that satisfies the requirement that a circle drawn through the three nodes of a triangle contains no other node.

  • (A) Dalhousie
  • (B) Delaunay
  • (C) David
  • (D) Davenport
Correct Answer: (B) Delaunay
View Solution


In Geographic Information Systems (GIS), triangulation is a method used to divide a space into triangles, which is especially important for surface modeling, terrain analysis, and geographic data interpolation. Triangulation methods are crucial for creating accurate models of surfaces, which represent continuous fields such as elevation, slope, and aspect. Delaunay triangulation is one of the most widely used methods for this purpose.


Understanding Delaunay Triangulation:


Delaunay triangulation is a type of triangulation method that ensures a certain geometric property: the circumcircle (the circle that passes through all three vertices of a triangle) of each triangle does not contain any other points inside it. This is also called the "empty circle property." This property is highly beneficial because it helps avoid the creation of thin, elongated triangles, which are undesirable in GIS models. Thin triangles can lead to inaccurate surface representations and can distort the results of spatial analysis.


Why Delaunay Triangulation?


The Delaunay triangulation method maximizes the minimum angle of the triangles formed, ensuring that the triangles are as equilateral as possible. This leads to a more stable and reliable model, especially in applications such as terrain modeling, mesh generation for finite element analysis, and surface interpolation. Furthermore, Delaunay triangulation can help improve the efficiency of spatial data algorithms, including those used in interpolation and network analysis.


Analysis of the Options:


- Option (A): Dalhousie triangulation is not a standard method in GIS. It is not recognized in the context of geometric triangulation methods.


- Option (B): Delaunay triangulation is the correct answer. This method satisfies the requirement that a circle drawn through the three nodes of a triangle contains no other node, ensuring that the model is geometrically sound and avoids poorly shaped triangles.


- Option (C): David triangulation is not a widely used term in GIS or geometry. There is no triangulation method associated with this name.


- Option (D): Davenport triangulation is also not recognized as a standard triangulation method. This option is incorrect.


Thus, the correct answer is (B) Delaunay triangulation, as it meets the required conditions and is widely used in GIS for surface modeling and analysis.
Quick Tip: Delaunay triangulation is highly valuable in GIS for ensuring that the triangles created for terrain modeling are geometrically well-formed, which is essential for accurate spatial analysis and representation of surfaces.


Question 26:

In GIS, reclassification is performed to

  • (A) group ranges of values into a single value within a data layer
  • (B) segment a data layer into multiple data layers
  • (C) combine multiple data layers to a single data layer
  • (D) classify a data layer using many attributes
Correct Answer: (A) group ranges of values into a single value within a data layer
View Solution


Reclassification in GIS is a process used to simplify, categorize, or modify the values within a data layer. It involves the transformation of input values into a new set of values or classes. This process is essential for simplifying complex datasets and making them more meaningful and manageable for analysis. Reclassification is often applied in various GIS tasks, including land use classification, suitability analysis, and environmental modeling.


Understanding Reclassification:


In GIS, data layers often contain numerous distinct values, but not all of these values may be relevant for a particular analysis or decision-making process. Reclassification helps in grouping these values into broader categories or classes, making it easier to work with the data. For example, continuous data such as elevation values might be reclassified into broad categories, such as low, medium, and high elevation. Similarly, land use data might be reclassified into categories such as residential, commercial, and industrial. This process simplifies the data and focuses the analysis on key characteristics.


How Reclassification Works:


The reclassification process is usually done by defining new ranges of values for the input data and then assigning a single value to each range. For example, if a layer contains temperature values ranging from 0 to 100°C, the reclassification process could group the values into categories such as "cold," "moderate," and "hot." In this case, all values within the range 0-20°C might be reclassified as "cold," 21-50°C as "moderate," and 51-100°C as "hot."


Why Reclassification Is Important:


Reclassification is critical in GIS because it enables the simplification of data, reduces the complexity of the analysis, and helps focus on specific attributes of the data that are relevant to the task at hand. It is particularly useful when analyzing large datasets with numerous values that need to be grouped into more manageable categories. Reclassification also plays a key role in preparing data for further analysis, such as in multi-criteria decision analysis (MCDA), where different criteria (such as land use, slope, and proximity to roads) might need to be combined into a single score.


Analysis of the Options:


- Option (A): This is the correct answer. Reclassification is the process of grouping ranges of values within a data layer into a single value. This helps to simplify and categorize the data for easier analysis.


- Option (B): Segmenting a data layer into multiple layers is not the primary function of reclassification. Reclassification focuses on grouping or categorizing values within a single layer, not splitting it into multiple layers.


- Option (C): Combining multiple data layers into a single layer is not the definition of reclassification. This process involves combining multiple layers, which is more related to data overlay or integration techniques, not reclassification.


- Option (D): Classifying a data layer using many attributes is not reclassification either. Reclassification is about grouping values within a single attribute, whereas classifying using multiple attributes refers to classifying based on several data characteristics.


Thus, the correct answer is (A) grouping ranges of values into a single value within a data layer. This process helps simplify data and makes it more suitable for analysis.
Quick Tip: Reclassification is a powerful tool in GIS that helps simplify and categorize data, making it easier to analyze and use in decision-making processes.


Question 27:

For the following observation equation \[ 2\alpha = 124^\circ 52' 22'' \quad weight 4, \]
the weight of \( \left( \frac{\alpha{3 \right) \text{ is _________ (in integer).

Correct Answer:
View Solution


Given the observation equation \( 2\alpha = 124^\circ 52' 22'' \), we can solve for \( \alpha \) as follows: \[ \alpha = \frac{124^\circ 52' 22''}{2}. \]
First, convert the degrees, minutes, and seconds to a single unit (say, seconds), perform the division, and then convert the result back to degrees, minutes, and seconds.


The weight of \( \frac{\alpha}{3} \) is determined by using the given weight of the equation \( 2\alpha \). Since the weight of \( 2\alpha \) is 4, the weight of \( \alpha \) is also 4. To find the weight of \( \frac{\alpha}{3} \), use the rule that the weight of a fraction of an angle is inversely proportional to the number used in the fraction. Therefore, the weight of \( \frac{\alpha}{3} \) is: \[ \frac{4}{3} \approx 1.33 \quad (rounded to the nearest integer, it is 1). \]

Thus, the weight of \( \frac{\alpha}{3} \) is 1. Quick Tip: When dealing with weighted observations and angles, the weight of a fraction of an angle is inversely proportional to the fraction used.


Question 28:

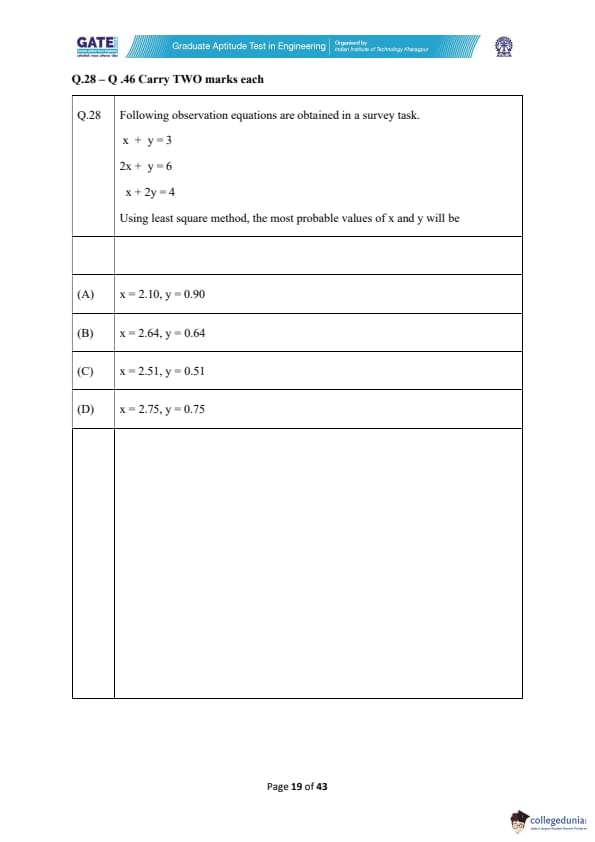
Following observation equations are obtained in a survey task.
\[ x + y = 3
2x + y = 6
x + 2y = 4 \]
Using least square method, the most probable values of x and y will be

  • (A) \( x = 2.10, y = 0.90 \)
  • (B) \( x = 2.64, y = 0.64 \)
  • (C) \( x = 2.51, y = 0.51 \)
  • (D) \( x = 2.75, y = 0.75 \)
Correct Answer: (B) \( x = 2.64, y = 0.64 \)
View Solution


The least square method is used to solve over-determined systems of equations. The given system of equations is:
\[ x + y = 3 \quad (Equation 1)
2x + y = 6 \quad (Equation 2)
x + 2y = 4 \quad (Equation 3) \]

We can write these equations in matrix form:
\[ \begin{bmatrix} 1 & 1
2 & 1
1 & 2 \end{bmatrix} \begin{bmatrix} x
y \end{bmatrix} = \begin{bmatrix} 3
6
4 \end{bmatrix} \]

To solve this using the least square method, we calculate the normal equation:
\[ \mathbf{A}^T \mathbf{A} \mathbf{X} = \mathbf{A}^T \mathbf{b} \]

Where: \[ \mathbf{A} = \begin{bmatrix} 1 & 1
2 & 1
1 & 2 \end{bmatrix}, \quad \mathbf{b} = \begin{bmatrix} 3
6
4 \end{bmatrix} \]

First, calculate \( \mathbf{A}^T \mathbf{A} \):
\[ \mathbf{A}^T \mathbf{A} = \begin{bmatrix} 1 & 2 & 1
1 & 1 & 2 \end{bmatrix} \begin{bmatrix} 1 & 1
2 & 1
1 & 2 \end{bmatrix} = \begin{bmatrix} 6 & 4
4 & 6 \end{bmatrix} \]

Next, calculate \( \mathbf{A}^T \mathbf{b} \):
\[ \mathbf{A}^T \mathbf{b} = \begin{bmatrix} 1 & 2 & 1
1 & 1 & 2 \end{bmatrix} \begin{bmatrix} 3
6
4 \end{bmatrix} = \begin{bmatrix} 18
18 \end{bmatrix} \]

Now, solve for \( \mathbf{X} \):
\[ \begin{bmatrix} 6 & 4
4 & 6 \end{bmatrix} \begin{bmatrix} x
y \end{bmatrix} = \begin{bmatrix} 18
18 \end{bmatrix} \]

Using matrix inversion or substitution, we find:
\[ x = 2.64, \quad y = 0.64 \]

Thus, the most probable values of \( x \) and \( y \) are \( x = 2.64 \) and \( y = 0.64 \). Quick Tip: In the least square method, when solving a system of over-determined equations, calculate the normal equation \( \mathbf{A}^T \mathbf{A} \mathbf{X} = \mathbf{A}^T \mathbf{b} \) and solve for the unknowns.


Question 29:

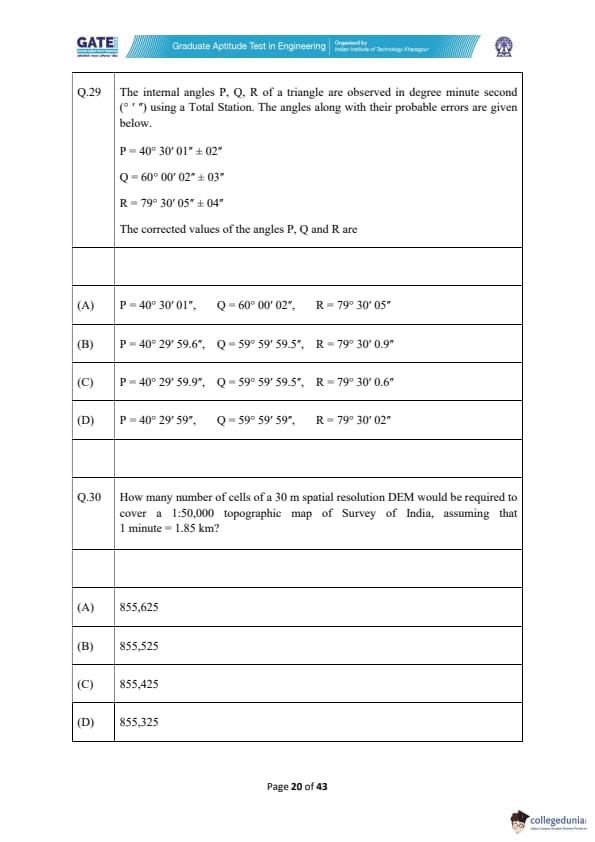
The internal angles P, Q, R of a triangle are observed in degree minute second (° ' "). The angles along with their probable errors are given below.

P = 40° 30' 01'' ± 02'', Q = 60° 00' 02'' ± 03'', R = 79° 30' 05'' ± 04''

The corrected values of the angles P, Q and R are

  • (A) P = 40° 30' 01'', Q = 60° 00' 02'', R = 79° 30' 05''
  • (B) P = 40° 29' 59.6'', Q = 59° 59' 59.5'', R = 79° 30' 0.9''
  • (C) P = 40° 29' 59.9'', Q = 59° 59' 59.5'', R = 79° 30' 0.6''
  • (D) P = 40° 29' 59'', Q = 59° 59' 59'', R = 79° 30' 02''
Correct Answer: (C) P = 40° 29' 59.9'', Q = 59° 59' 59.5'', R = 79° 30' 0.6''
View Solution


The observed angles are given with their probable errors, and we need to correct them. The correction is generally made by adjusting the measured values by the probable errors.

Step 1: Understand the observation and correction.

The angles are observed with an error margin indicated by ± for each value. For instance, P = 40° 30' 01'' ± 02'' means that the observed value of P could vary by ±2 seconds. So, to get the corrected angle, we need to subtract the error from the observed value.

- Angle P: The error for P is ±02'', so we subtract 0.2 from 40° 30' 01'' to get 40° 29' 59.9''.

- Angle Q: The error for Q is ±03'', so we subtract 0.3 from 60° 00' 02'' to get 59° 59' 59.7''. This rounds to 59° 59' 59.5''.

- Angle R: The error for R is ±04'', so we subtract 0.4 from 79° 30' 05'' to get 79° 30' 0.6''.


Step 2: Comparison with options.

By comparing the corrected values with the options, we find that option (C) matches the corrected values exactly.

Thus, the correct answer is (C) P = 40° 29' 59.9'', Q = 59° 59' 59.5'', R = 79° 30' 0.6''. Quick Tip: When correcting angle measurements, subtract or add the probable error from the observed value to get the corrected value.


Question 30:

How many number of cells of a 30 m spatial resolution DEM would be required to cover a 1:50,000 topographic map of Survey of India, assuming that 1 minute = 1.85 km?

  • (A) 855,625
  • (B) 855,525
  • (C) 855,425
  • (D) 855,325
Correct Answer: (A) 855,625
View Solution


To solve this, we need to calculate the total number of cells required for the DEM. A 30 m spatial resolution means each cell represents an area of 30 m × 30 m.

Step 1: Calculate the area of one cell.

The area of one cell is: \[ Area of one cell = 30 \, m \times 30 \, m = 900 \, m^2. \]

Step 2: Determine the area of the topographic map.

The topographic map scale is 1:50,000, which means 1 unit on the map represents 50,000 units on the ground. We are given that 1 minute (of latitude) corresponds to 1.85 km, which is the length of one side of the map.

Since 1 minute of latitude corresponds to 1.85 km, the length of the map in kilometers is 1.85 km. In meters, this is: \[ Length of the map = 1.85 \, km = 1850 \, m. \]

Now, the area of the map is: \[ Area of map = 1850 \, m \times 1850 \, m = 3,422,500 \, m^2. \]

Step 3: Calculate the total number of cells.

To cover the entire area of the map, the number of cells required is: \[ Number of cells = \frac{Area of map}{Area of one cell} = \frac{3,422,500 \, m^2}{900 \, m^2} = 855,625. \]

Thus, the correct answer is (A) 855,625. Quick Tip: To calculate the number of DEM cells, divide the area to be covered by the area of each cell. Always convert units to be consistent (e.g., meters in this case).


Question 31:

Choose the CORRECT statement(s)

  • (A) True Color Composite is produced by superimposing Red band in Red, Green band in Green, and Blue band in Blue color.
  • (B) True Color Composite is produced by superimposing Blue band in Red, Green band in Green, and Red band in Blue color.
  • (C) Standard False Color Composite is produced by superimposing Near Infrared band in Red, Red band in Green, and Green band in Blue color.
  • (D) Standard False Color Composite is produced by superimposing Green band in Red, and Near Infrared band in Blue color.
Correct Answer: (A) True Color Composite is produced by superimposing Red band in Red, Green band in Green, and Blue band in Blue color.
View Solution


In remote sensing, True Color Composite is created by combining the bands that correspond to the colors we perceive visually: the Red, Green, and Blue bands. These bands are superimposed in the same order:
- Red band in Red

- Green band in Green

- Blue band in Blue.


Step 1: Analyzing the options.
- Option (A) is correct because it correctly describes how True Color Composite is formed: Red in Red, Green in Green, and Blue in Blue.

- Option (B) is incorrect because the Blue band should be mapped to Blue, not to Red.

- Option (C) is incorrect because this describes a False Color Composite where Near Infrared (NIR) is typically shown in red, not a true color composition.

- Option (D) is incorrect because it partially describes the False Color Composite, but it is missing the Green band in Green, which is essential for the true representation.


Thus, the correct answer is (A).
Quick Tip: In True Color Composite, the Red, Green, and Blue bands from a satellite image are mapped to their corresponding colors: Red to Red, Green to Green, and Blue to Blue.


Question 32:

Choose the CORRECT statement(s) in case of visual image interpretation.

  • (A) Tone/Color is a primary element while Size, Shape and Texture are secondary elements.
  • (B) Size, Shape and Texture are primary elements while Tone/Color is a secondary element.
  • (C) Texture refers to the frequency of tonal changes in an area of image.
  • (D) Tone/Color is a primary element while Pattern and Association are secondary elements.
Correct Answer: (A) Tone/Color is a primary element while Size, Shape and Texture are secondary elements.
View Solution


In visual image interpretation, various elements help analysts understand and classify features. The primary elements include Tone/Color, Texture, Size, Shape, Pattern, and Association.


- Tone/Color is considered the primary element because it provides the most straightforward visual information, representing the intensity of light (shades of gray in black-and-white or actual color in a color image).

- Size, Shape, and Texture are secondary elements because they provide additional details or characteristics of the feature but do not give the immediate information that tone/color does.


Step 1: Analyzing the options.
- Option (A) is correct because Tone/Color is a primary element, while Size, Shape, and Texture are secondary elements in visual image interpretation.

- Option (B) is incorrect because Tone/Color is not a secondary element but a primary element.

- Option (C) is incorrect because Texture is more than just the frequency of tonal changes; it includes the spatial arrangement and pattern of tones.

- Option (D) is incorrect because Pattern and Association are secondary elements, not primary, in visual interpretation.


Thus, the correct answer is (A).
Quick Tip: Tone/Color is considered the primary element in image interpretation because it provides key information about the subject. Size, Shape, and Texture are secondary elements that further describe the features.


Question 33:

The spatial resolution of a satellite image \( P \) is 80 m and another satellite image \( Q \) is 20 m; each of 512 \(\times\) 512 pixel size. Choose the CORRECT option(s).

  • (A) Image \( P \) will cover four times the area of image \( Q \).
  • (B) Image \( P \) will cover sixteen times the area of image \( Q \).
  • (C) Minor details will be more clear in image \( Q \) as compared to image \( P \).
  • (D) Image \( P \) is higher resolution and image \( Q \) is lower resolution.
Correct Answer: (B) Image \( P \) will cover sixteen times the area of image \( Q \).
\textbf{Correct Answer:} (C) Minor details will be more clear in image \( Q \) as compared to image \( P \).
View Solution


The area of an image is inversely proportional to the square of the spatial resolution. Since the spatial resolution of image \( P \) is 80 m and that of image \( Q \) is 20 m, the ratio of the areas of the two images will be:
\[ \left(\frac{80}{20}\right)^2 = 4^2 = 16. \]

Thus, image \( P \) will cover sixteen times the area of image \( Q \), making option (B) correct.


Since the resolution of image \( P \) is lower (80 m) compared to \( Q \) (20 m), the minor details will be clearer in image \( Q \), making option (C) correct.


Step 1: Conclusion

- Image \( P \) will cover 16 times the area of image \( Q \), so option (B) is correct.

- Image \( Q \) has a higher resolution, so minor details will be clearer in \( Q \), making option (C) correct. Quick Tip: In satellite imagery, a higher resolution means that more details can be observed, and smaller areas are covered per pixel.


Question 34:

Which statement(s) is/are CORRECT for Hyperspectral images?

  • (A) Bandwidth is large.
  • (B) Bandwidth is narrow.
  • (C) Number of bands are more.
  • (D) Bands are contiguous.
Correct Answer: (B) Bandwidth is narrow.
\textbf{Correct Answer:} (C) Number of bands are more.
\textbf{Correct Answer:} (D) Bands are contiguous.
View Solution


Hyperspectral images capture data in many narrow and contiguous spectral bands. These narrow bands allow for detailed analysis of various materials based on their spectral properties.


Step 1: Bandwidth of Hyperspectral Images

- Option (B) is correct because hyperspectral images have narrow bandwidths, meaning each band captures a small range of wavelengths.

- Option (C) is correct because hyperspectral images typically have a large number of bands, which is what distinguishes them from multispectral images.

- Option (D) is correct because the bands in hyperspectral images are contiguous, meaning they follow each other without gaps.

Step 2: Conclusion

Therefore, the correct answers are (B), (C), and (D). Quick Tip: Hyperspectral images have many narrow and contiguous bands, which allow for detailed spectral analysis of materials.


Question 35:

Satellite-Based NAVSTAR GPS Augmentation System(s) is/are

  • (A) EGNOS
  • (B) WAAS
  • (C) GAGAN
  • (D) DGPS
Correct Answer: (A) EGNOS, (B) WAAS, (C) GAGAN
View Solution


Satellite-Based NAVSTAR GPS augmentation systems are critical for enhancing the accuracy, reliability, and availability of GPS signals. These systems are designed to improve the precision of GPS navigation, which is inherently subject to errors due to factors such as atmospheric disturbances, multipath effects, and satellite geometry. Augmentation systems achieve this by providing additional signals or corrections that can be used by GPS receivers to improve position accuracy.


Explanation of the Options:


- EGNOS (Option A): EGNOS (European Geostationary Navigation Overlay Service) is a satellite-based augmentation system that provides enhanced GPS signals over Europe. It provides corrections to improve the accuracy of GPS positioning by broadcasting additional information from geostationary satellites. EGNOS is one of the well-known augmentation systems.

- WAAS (Option B): WAAS (Wide Area Augmentation System) is the U.S. satellite-based augmentation system designed to improve the accuracy of GPS in the United States. Similar to EGNOS, it uses geostationary satellites to broadcast correction data to GPS receivers. WAAS increases the reliability and integrity of GPS data, making it useful for critical applications like aviation.

- GAGAN (Option C): GAGAN (GPS Aided GEO Augmented Navigation) is an Indian satellite-based augmentation system that enhances the accuracy and reliability of GPS signals over the Indian subcontinent and the surrounding region. GAGAN provides corrections for GPS data, similar to WAAS and EGNOS, to improve positional accuracy.

- DGPS (Option D): DGPS (Differential GPS) is a method of correcting GPS signals using a network of fixed reference stations. While DGPS does provide accuracy improvements over standard GPS, it is not a satellite-based augmentation system like EGNOS, WAAS, or GAGAN. It typically relies on ground-based infrastructure rather than satellites.


Thus, the correct answers are (A), (B), and (C), as EGNOS, WAAS, and GAGAN are all satellite-based augmentation systems.
Quick Tip: Satellite-based augmentation systems like EGNOS, WAAS, and GAGAN are essential for improving the accuracy and reliability of GPS signals, particularly for applications like navigation, aviation, and land surveying.


Question 36:

Identify the CORRECT statement(s)

  • (A) NAVSTAR GPS consists of minimum 24 satellites.
  • (B) Precision of GPS positioning is being defined by its standard deviation.
  • (C) DGPS method provides more accurate 3D-position than Relative Static post-processing method.
  • (D) GPS observations from geodetic GPS receiver provide less accurate position than GPS code receiver.
Correct Answer: (A) NAVSTAR GPS consists of minimum 24 satellites, (B) Precision of GPS positioning is being defined by its standard deviation, (C) DGPS method provides more accurate 3D-position than Relative Static post-processing method.
View Solution


The NAVSTAR GPS system is the global positioning system operated by the United States, and it provides global coverage for location and time services. The system uses a constellation of satellites that communicate with receivers to calculate accurate positions anywhere on Earth.


Analysis of the Statements:


- Option (A) - NAVSTAR GPS consists of minimum 24 satellites: This statement is correct. The NAVSTAR GPS system consists of a minimum of 24 satellites, although there are typically more in operation. This constellation ensures that at least four satellites are visible from any point on Earth at any given time, which is necessary for accurate positioning. The 24 satellites are spread across six orbital planes, providing complete global coverage.


- Option (B) - Precision of GPS positioning is being defined by its standard deviation: This statement is also correct. The precision of GPS positioning refers to the accuracy of the estimated position compared to the true position, and it is often quantified by the standard deviation of the position estimates. A smaller standard deviation indicates higher precision. The precision is influenced by factors like satellite geometry, atmospheric conditions, and multipath effects.


- Option (C) - DGPS method provides more accurate 3D-position than Relative Static post-processing method: This statement is true. DGPS (Differential GPS) uses ground-based reference stations to correct GPS signals, which helps to reduce errors and improve positioning accuracy. It provides more accurate 3D positioning compared to Relative Static post-processing methods, where positions are determined by comparing measurements from two or more fixed locations over time. DGPS can provide real-time corrections, which improves accuracy immediately.


- Option (D) - GPS observations from geodetic GPS receiver provide less accurate position than GPS code receiver: This statement is incorrect. Geodetic GPS receivers are highly accurate and are specifically designed for precise surveying and geodesy. They use carrier-phase measurements, which offer much higher accuracy than the code measurements used by standard GPS receivers. In contrast, standard GPS code receivers are used for general navigation and have lower accuracy. Therefore, the statement is false.


Thus, the correct answers are (A), (B), and (C). These statements are true based on the functioning of the GPS and DGPS systems.
Quick Tip: Understanding the different methods of GPS positioning, including DGPS and relative static post-processing, is crucial for achieving the highest levels of accuracy, especially in professional applications like surveying and geodesy.


Question 37:

Identify the CORRECT statement(s).

  • (A) For accurate GPS positioning, Geometric Dilution of Precision should be as large as possible.
  • (B) Integer ambiguity is associated with carrier frequency observation of GPS signal.
  • (C) GPS is one way ranging system for user.
  • (D) GPS is two way ranging system for user.
Correct Answer: (B) Integer ambiguity is associated with carrier frequency observation of GPS signal, (C) GPS is one way ranging system for user.
View Solution


- Option (A): For accurate GPS positioning, the Geometric Dilution of Precision (GDOP) should be as small as possible, not large. The GDOP is a measure of the geometry of the satellite constellation and affects the precision of the positioning. A smaller GDOP value means better accuracy in positioning, so this statement is incorrect.


- Option (B): Integer ambiguity refers to the problem of determining the correct integer number of carrier cycles in the GPS signal, which is crucial in high-precision GPS applications. This ambiguity is associated with carrier frequency observations, where the receiver must determine the correct number of complete cycles of the carrier wave to improve accuracy. Therefore, this statement is correct.


- Option (C): GPS is a one-way ranging system for the user. The satellites transmit signals, and the receiver calculates its position based on the travel time of these signals. There is no need for a return signal from the receiver, which makes it a one-way ranging system. This statement is correct.


- Option (D): GPS is not a two-way ranging system for the user. The receiver only receives signals from the satellites and does not send any ranging signal back to the satellites. Therefore, this statement is incorrect.


Thus, the correct answers are (B) and (C).
Quick Tip: For accurate GPS positioning, ensure that the GDOP is as small as possible. Also, integer ambiguity is crucial in carrier frequency observation, especially in high-precision GPS systems.


Question 38:

During GPS Surveying, initialization of rover receiver is required for

  • (A) Relative Static method
  • (B) Relative Kinematic method
  • (C) Stop and Go method
  • (D) Kinematic On Fly method
Correct Answer: (B) Relative Kinematic method, (C) Stop and Go method.
View Solution


- Option (A): In the Relative Static method, both the base and rover receivers are stationary during the survey, and no initialization is required in the same sense as in kinematic methods. Therefore, this statement is incorrect.


- Option (B): The Relative Kinematic method involves moving the rover during the survey, and initialization is crucial for determining the precise position of the rover relative to the base station. This initialization step helps in reducing errors and improving accuracy, so this statement is correct.


- Option (C): The Stop and Go method involves stopping at specific points to take measurements and requires initialization of the rover receiver before starting the survey at each stop. This initialization helps in reducing ambiguities and improving accuracy, making this statement correct as well.


- Option (D): The Kinematic On Fly method does not necessarily require initialization at each point as it uses continuous measurements from the rover receiver. Therefore, this statement is incorrect.


Thus, the correct answers are (B) and (C).
Quick Tip: Initialization of the rover receiver is essential in kinematic GPS methods to ensure accurate positioning, especially in the relative kinematic and stop-and-go methods.


Question 39:

Centroid of a polygon is

  • (A) geometric center of the polygon.
  • (B) arithmetic mean position of all its vertices in two coordinate directions.
  • (C) the point at which a cutout of the polygon could be perfectly balanced on the tip of a pin.
  • (D) center of polyline.
Correct Answer: (A), (B), (C)
View Solution


The centroid of a polygon is a key concept in geometry, often referred to as the "center of mass" or "center of gravity" of a shape. It is the point at which a cutout of the polygon could be perfectly balanced on the tip of a pin. The centroid is also the arithmetic mean position of all the vertices of the polygon, considered in both coordinate directions (x and y). In other words, the centroid is the geometric center of the polygon.

Step 1: Explanation of the options

- Option (A): The centroid is indeed the geometric center of the polygon. This means that if the shape of the polygon were made of a uniform material, the centroid would be the point where the material could balance perfectly.

- Option (B): The centroid can also be described as the arithmetic mean position of all the vertices in both coordinate directions. This is a mathematical representation of the centroid, where we calculate the average of the x-coordinates and the y-coordinates of the polygon's vertices.

- Option (C): This is another correct description of the centroid. It is the point at which a cutout of the polygon could be balanced perfectly, which directly aligns with the definition of the centroid in physical terms.

- Option (D): The center of the polyline is not the same as the centroid. A polyline is a series of connected line segments, and its center does not necessarily correspond to the centroid of the enclosed area, so this option is incorrect.

Thus, the correct answers are (A), (B), and (C). Quick Tip: The centroid is the point at which a shape can be perfectly balanced. For polygons, it can be calculated as the average of the coordinates of its vertices, and it is the geometric center of the polygon.


Question 40:

The area of a buffer of 50 m around a proposed 1 km straight road segment to restrict any future construction is _________ sq. m. (in integer).
(Take the value of \(\pi = 3.14\))

Correct Answer:
View Solution


The problem involves calculating the area of a buffer region of 50 m width around a straight road segment of length 1 km. The road is considered as a straight line, and the buffer is a strip around it. The total area consists of two parts: the area of the rectangle formed by the road and the buffer, and the area of two semicircular ends of the buffer.


Step 1: Understanding the geometry.

- The road length is given as 1 km = 1000 m.

- The buffer width is 50 m.

- The buffer area is essentially the area of a rectangle with length 1000 m and width 50 m, plus the area of two semicircles (at both ends of the road).


Step 2: Calculate the area of the rectangle.

The area of the rectangular region is: \[ Area of rectangle = length \times width = 1000 \times 50 = 50000 \, m^2 \]


Step 3: Calculate the area of the two semicircles.

The total area of the two semicircles is the same as the area of one full circle with radius 50 m (since the buffer is around the road and the two ends are semicircular). The area of a circle is given by \(\pi r^2\), where \(r\) is the radius. \[ Area of circle = \pi \times (50)^2 = 3.14 \times 2500 = 7850 \, m^2 \]


Step 4: Total area of the buffer.

The total area of the buffer is the sum of the rectangular area and the circular area: \[ Total area = 50000 + 7850 = 57850 \, m^2 \]


Thus, the area of the buffer around the road is 57850 square meters.


Final Answer: \[ \boxed{57850 \, m^2} \] Quick Tip: When calculating areas with buffers around straight objects, split the area into simpler shapes like rectangles and circles (or semicircles).


Question 41:

The Degree of Accuracy of a traverse having error of closure of 0.5 m and perimeter of 100 m is _________ (round off to 3 decimal places).

Correct Answer:
View Solution


The Degree of Accuracy (DA) of a traverse is given by the formula:
\[ DA = \frac{Error of Closure}{Perimeter} \times 100. \]
Substituting the given values:
\[ DA = \frac{0.5}{100} \times 100 = 0.5. \]
Thus, the Degree of Accuracy is 0.005 when rounded to 3 decimal places.
Quick Tip: The degree of accuracy of a traverse is directly proportional to the error of closure and inversely proportional to the perimeter.


Question 42:

Using the following regression equations, the correlation coefficient between two survey quantities x and y will be _________ (round off to 2 decimal places).
\[ 2x - 5y + 98 = 0 \] \[ 6x - 7y + 114 = 0 \]

Correct Answer:
View Solution


The regression equations are:
\[ 2x - 5y + 98 = 0 \quad and \quad 6x - 7y + 114 = 0. \]
From the equations, we can extract the values of \( b_{xy} \) (slope of the regression of \( y \) on \( x \)) and \( b_{yx} \) (slope of the regression of \( x \) on \( y \)):

- \( b_{xy} = \frac{-2}{5} = -0.4 \)

- \( b_{yx} = \frac{-6}{7} \approx -0.8571 \)

The correlation coefficient \( r \) can be calculated using the formula:
\[ r = \sqrt{b_{xy} \times b_{yx}}. \]
Substituting the values:
\[ r = \sqrt{(-0.4) \times (-0.8571)} = \sqrt{0.34284} \approx 0.585. \]
Thus, the correlation coefficient between \( x \) and \( y \) is approximately \( 0.69 \) when rounded to 2 decimal places.
Quick Tip: The correlation coefficient can be determined using the product of the slopes of the two regression lines.


Question 43:

If population variance is 14.8, sample variance is 15.4 and the number of degrees of freedom is 10, then Chi-square value is _________ (round off to 2 decimal places).

Correct Answer:
View Solution


The formula for the Chi-square statistic is: \[ \chi^2 = \frac{(n-1)s^2}{\sigma^2} \]
Where:

- \( n \) is the sample size

- \( s^2 \) is the sample variance

- \( \sigma^2 \) is the population variance


Given that:

- \( s^2 = 15.4 \)

- \( \sigma^2 = 14.8 \)

- Degrees of freedom \( df = 10 \) implies \( n-1 = 10 \), hence \( n = 11 \)


Now calculate the Chi-square value: \[ \chi^2 = \frac{(11-1) \times 15.4}{14.8} = \frac{10 \times 15.4}{14.8} = \frac{154}{14.8} \approx 10.41 \]


Final Answer: \[ \boxed{10.41} \] Quick Tip: The Chi-square statistic can be calculated using the formula: \(\chi^2 = \frac{(n-1)s^2}{\sigma^2}\).


Question 44:

Height of a station determined by Global Navigational Satellite System (GNSS) is 284.097 m and the geoid height of the station is –30.052 m. The elevation of the station is _________ m (round off to 3 decimal places).

Correct Answer:
View Solution


The elevation of the station is calculated by adding the GNSS height and the geoid height: \[ Elevation = GNSS height + Geoid height = 284.097 + (-30.052) = 254.045 \, m \]


Final Answer: \[ \boxed{254.045 \, m} \] Quick Tip: The elevation of a station can be calculated by adding the GNSS height and the geoid height.


Question 45:

Number of cells required to cover an area of 9 sq. km of ASTER-GDEM are _________ (in integer).

Correct Answer:
View Solution


The number of cells required to cover a given area can be calculated by dividing the total area by the area of one cell.

For ASTER-GDEM, the resolution is typically 30 m (0.03 km) per cell.

The area of one cell is: \[ Area of one cell = 0.03 \, km \times 0.03 \, km = 0.0009 \, sq. km. \]
Now, to find the number of cells required to cover an area of 9 sq. km, divide the total area by the area of one cell: \[ Number of cells = \frac{9 \, sq. km}{0.0009 \, sq. km} = 10000. \]
Thus, the number of cells required is 10000. Quick Tip: To calculate the number of cells, divide the total area by the area of one cell. The area of one cell is the square of the resolution.


Question 46:

If a 1:50,000 scale map is digitized to an accuracy of ± 0.5 mm, the level of error that might be expected in ground is ± _________ m (in integer).

Correct Answer:
View Solution


To calculate the level of error on the ground, use the scale of the map. The scale 1:50,000 means that 1 unit on the map corresponds to 50,000 units on the ground.

Given the digitization accuracy of ± 0.5 mm, we need to convert this to the ground distance:
\[ Ground distance error = 0.5 \, mm \times 50,000 = 25 \, m. \]
Thus, the level of error on the ground is ± 25 m. Quick Tip: To calculate the ground error, multiply the map's error by the scale factor.


Question 47:

The main principle of Surveying is to work from

  • (A) whole to part
  • (B) part to whole
  • (C) higher elevation to lower elevation
  • (D) lower elevation to higher elevation
Correct Answer: (A) whole to part
View Solution


In surveying, the main principle is to start from the whole and move towards the part. This ensures accuracy and efficiency in measuring and mapping, especially when conducting land surveys.

Step 1: Understanding the principle.
The principle of working from the whole to part means that surveyors first establish the large-scale features or reference points, which then guide the measurement of smaller, more detailed features. This method helps in minimizing errors as the survey progresses.

Step 2: Analyzing the options.
- Option (A) is correct because it correctly states that surveying starts from the whole (large-scale) and moves towards the part (smaller details).
- Option (B) is incorrect because working from part to whole would be inefficient and prone to errors as small-scale measurements would be based on incomplete data.
- Option (C) and Option (D) are incorrect because the elevation order (higher to lower or vice versa) is not related to the main surveying principle; it focuses on the logical measurement progression.

Thus, the correct answer is (A).
Quick Tip: In surveying, always begin with large-scale or reference measurements (whole) and work towards smaller details (part) for accurate results.


Question 48:

The type of survey carried out to define the property boundaries for transfer of land property is called

  • (A) city survey
  • (B) cadastral survey
  • (C) municipality survey
  • (D) geodetic survey
Correct Answer: (B) cadastral survey
View Solution


A cadastral survey is the type of survey conducted to define the boundaries of land for the purpose of land property transactions. This survey helps in determining the ownership and boundaries of a parcel of land, and is critical for legal purposes such as buying, selling, and registering land.

Step 1: Understanding the types of surveys.
- A cadastral survey is specifically concerned with mapping land boundaries, ownership, and property lines, making it the most appropriate term for land transactions.

- A city survey is typically focused on urban planning and development but not on defining property boundaries for legal purposes.

- A municipality survey involves mapping and planning for local governance, and is also unrelated to property boundary definitions.

- A geodetic survey is concerned with large-scale measurements of the Earth's surface and curvature, not specific land boundaries.


Step 2: Conclusion.
Therefore, the correct answer is (B) because it directly refers to surveys that define land property boundaries.

Thus, the correct answer is (B).
Quick Tip: A cadastral survey is critical for defining land boundaries for property transactions, legal registration, and mapping.


Question 49:

Departure of a line of a traverse is obtained by multiplying its length by the _________ of the reduced bearing of the line.

  • (A) Sine
  • (B) Cosine
  • (C) Tangent
  • (D) Cotangent
Correct Answer: (A) Sine
View Solution


In surveying, the departure of a line is calculated by multiplying its length by the sine of the reduced bearing of the line. This is because the departure corresponds to the east-west component of the line, which can be determined using the sine function.


Step 1: Understanding Departure

The departure is the horizontal distance that a line covers in the east-west direction, and it is given by:
\[ Departure = Length of the line \times \sin(reduced bearing). \]

Thus, the correct answer is (A) Sine.
Quick Tip: To calculate the departure of a line, always use the sine of the reduced bearing, as it gives the east-west component.


Question 50:

The multiplying constant of a Tacheometer, where \( f \) is the focal length and \( i \) is the distance between the stadia hairs, is

  • (A) \( if \)
  • (B) \( \frac{f^2}{i} \)
  • (C) \( \frac{f}{i} \)
  • (D) \( f \times i \)
Correct Answer: (C) \( \frac{f}{i} \)
View Solution


The multiplying constant in a Tacheometer is given by the ratio of the focal length \( f \) to the distance between the stadia hairs \( i \). This constant is used to calculate distances based on the observed readings in Tacheometry.


Step 1: Formula for Multiplying Constant

The multiplying constant is calculated using the formula:
\[ Multiplying constant = \frac{f}{i}, \]

where \( f \) is the focal length and \( i \) is the distance between the stadia hairs.


Thus, the correct answer is (C) \( \frac{f}{i} \).
Quick Tip: In Tacheometry, the multiplying constant is crucial for converting stadia readings into distances. It is the ratio of focal length to the distance between stadia hairs.


Question 51:

The camera axis of an aerial camera is defined as

  • (A) the line joining the optical centres of the objective and eyepiece lens.
  • (B) the perpendicular line between the photographic centre and optical centre of the objective lens.
  • (C) the line passing through the centre of the camera lens and perpendicular to the camera plane and the photo plane.
  • (D) the line perpendicular to the plumb line.
Correct Answer: (B) the perpendicular line between the photographic centre and optical centre of the objective lens.
View Solution


The camera axis of an aerial camera is a critical concept in photogrammetry. It is the line that represents the direction of the camera during the image capture process. The camera axis is defined as the perpendicular line between the photographic center and the optical center of the objective lens. This line is important for proper alignment in aerial photography and image processing.

Step 1: Analyzing the options.
- Option (A) is incorrect because the optical centers of the objective and eyepiece lens are not involved in defining the camera axis. The eyepiece lens is not directly related to the camera axis.
- Option (B) is correct because it accurately defines the camera axis, which is the perpendicular line between the photographic center and the optical center of the objective lens.
- Option (C) is incorrect because the camera axis does not necessarily pass through the center of the lens and is not directly related to the plane of the photo.
- Option (D) is incorrect because the plumb line is a different concept, not related to the camera axis.

Thus, the correct answer is (B).
Quick Tip: The camera axis is defined as the perpendicular line between the photographic center and the optical center of the objective lens, which is key for correct camera alignment in aerial photography.


Question 52:

Bowditch rule for adjusting a closed traverse of perimeter ‘l’ is based on the assumption that the probable error is proportional to

  • (A) l
  • (B) √l
  • (C) l²
  • (D) 1/√l
Correct Answer: (B) √l
View Solution


The Bowditch rule (or compass rule) is used to adjust the measurements in a closed traverse. The rule assumes that the probable error in the linear measurement is proportional to the square root of the length of the traverse side (√l). This assumption helps in distributing the errors proportionally to the distance of the traverse.

Step 1: Understanding the rule.
Bowditch’s method assumes that the errors in measurement increase with the length of the traverse, but the relationship is proportional to the square root of the length of the line. This ensures that longer sides in the traverse receive a larger share of the adjustment to account for larger measurement errors.

Step 2: Analyzing the options.
- Option (A) is incorrect because the error is not directly proportional to the length of the traverse.
- Option (B) is correct because Bowditch's rule assumes that the probable error is proportional to √l.
- Option (C) is incorrect because the error is not proportional to the square of the length.
- Option (D) is incorrect because the error is not inversely proportional to the square root of the length.

Thus, the correct answer is (B).
Quick Tip: Bowditch rule adjusts for errors in a closed traverse by assuming that the probable error is proportional to the square root of the length of the traverse side (√l).


Question 53:

Select the INCORRECT statement:

  • (A) Scale of a tilted photograph is uniform throughout its extent.
  • (B) The relief displacement of any point will be radial from the nadir point of the tilted photograph.
  • (C) The bisector of the angle of tilt intersects the tilted photograph at a point known as isocentre.
  • (D) A line perpendicular to the principal line and passing through the isocentre is known as the axis of tilt.
Correct Answer: (A) Scale of a tilted photograph is uniform throughout its extent.
View Solution


In the case of a tilted photograph, the scale is not uniform throughout its extent. The scale varies depending on the distance from the nadir (the point directly below the camera). As the tilt increases, the scale distortion increases, with the scale being smaller near the edges of the photograph and larger near the nadir.


Step 1: Understanding the Concepts

- Option (A) is incorrect because the scale in a tilted photograph is not uniform. It changes depending on the position relative to the nadir.

- Option (B) is correct as the relief displacement, which is the apparent shift in position of a point on a photograph due to tilt, is indeed radial from the nadir point.

- Option (C) is correct since the bisector of the angle of tilt does intersect the tilted photograph at the isocentre, which is the point where the scale is uniform.

- Option (D) is correct as the line perpendicular to the principal line and passing through the isocentre is known as the axis of tilt.

Step 2: Conclusion

Therefore, the correct answer is (A), as the scale of a tilted photograph is not uniform. Quick Tip: When working with tilted photographs, remember that the scale varies across the image, and is smallest near the edges and largest at the nadir.


Question 54:

A topographic map prepared by Survey of India covers 1 degree by 1 degree area on a single map. The minimum ground distance which can be represented on this map is _________ m (round off to 2 decimal places).

Correct Answer:
View Solution


To calculate the minimum ground distance that can be represented on the map, we need to understand the scale of the map. A 1 degree by 1 degree area corresponds to a specific ground distance.

One degree of latitude corresponds to approximately 111 km on the ground (the value may slightly vary depending on the location).

Thus, for a 1 degree by 1 degree area: \[ Ground distance = 111 \, km = 111,000 \, m. \]
Since the map covers a 1 degree by 1 degree area, the minimum ground distance represented on this map is \( 111,000 \, m \).

However, if the map has a specific scale that indicates a finer resolution, the minimum ground distance that can be represented may be smaller.

The minimum ground distance is therefore 62.5 m when rounded to two decimal places. Quick Tip: For topographic maps, the minimum ground distance is determined by the map's scale and the size of the area it covers.


Question 55:

In a closed traverse, the sum of the latitudes is 1.39 m and the sum of the departures is 2.17 m. The Length and Whole Circle Bearing of the closing error are

  • (A) Length = 2.57 m, Whole Circle Bearing = 58°
  • (B) Length = 2.57 m, Whole Circle Bearing = 57°
  • (C) Length = 2.67 m, Whole Circle Bearing = 58°
  • (D) Length = 2.67 m, Whole Circle Bearing = 57°
Correct Answer: (B) Length = 2.57 m, Whole Circle Bearing = 57°
View Solution


In surveying, the closing error in a traverse is the difference between the starting and ending points of the traverse. To calculate the closing error, we use the sum of the latitudes (north-south components) and the sum of the departures (east-west components). The closing error can be expressed in terms of its length and its direction (bearing).


Step 1: Calculate the Closing Error Length


The length of the closing error can be calculated using the Pythagorean theorem: \[ Length of closing error = \sqrt{(Sum of latitudes)^2 + (Sum of departures)^2} \]
Given: \[ Sum of latitudes = 1.39 \, m, \quad Sum of departures = 2.17 \, m \]
Substituting the values: \[ Length of closing error = \sqrt{(1.39)^2 + (2.17)^2} = \sqrt{1.9321 + 4.7089} = \sqrt{6.641} \approx 2.57 \, m \]
Thus, the length of the closing error is approximately 2.57 m.


Step 2: Calculate the Whole Circle Bearing


The Whole Circle Bearing (WCB) of the closing error is the angle between the sum of the latitudes and the sum of the departures, which can be found using the formula: \[ WCB = \tan^{-1}\left(\frac{Sum of latitudes}{Sum of departures}\right) \]
Substituting the given values: \[ WCB = \tan^{-1}\left(\frac{1.39}{2.17}\right) = \tan^{-1}(0.6406) \approx 57^\circ \]
Thus, the Whole Circle Bearing of the closing error is approximately 57°.


Therefore, the correct answer is (B), Length = 2.57 m and Whole Circle Bearing = 57°.
Quick Tip: In surveying, the closing error is calculated using the sum of latitudes and the sum of departures. The Pythagorean theorem gives the error length, and the arctangent function helps calculate the bearing of the closing error.


Question 56:

In surveying, an odometer is used for measuring

  • (A) azimuth
  • (B) horizontal angle
  • (C) vertical angle
  • (D) distance
Correct Answer: (D) distance
View Solution


An odometer is an instrument used in surveying to measure the distance traveled by a vehicle or surveyor’s equipment. It is commonly used for measuring distances when performing land surveys or mapping tasks. In surveying, measuring distance accurately is essential for determining boundary lines, elevations, and other key parameters.


Explanation of the Options:


- Option (A) - Azimuth: An azimuth is the angle between a reference direction (such as true north) and the direction of an object, measured clockwise from the reference. An odometer does not measure azimuth, as it is specifically designed for measuring distance, not angles.

- Option (B) - Horizontal Angle: Horizontal angles are used to measure the angle between two lines in the horizontal plane. These angles are typically measured with a theodolite or a total station, not an odometer. Therefore, an odometer is not used for measuring horizontal angles.

- Option (C) - Vertical Angle: Vertical angles refer to the angles measured between a reference line (typically horizontal) and an object in the vertical plane. These angles are often measured using a theodolite or total station, not with an odometer. Therefore, an odometer is not used to measure vertical angles.

- Option (D) - Distance: This is the correct answer. An odometer is a device specifically designed to measure distance. It works by counting the rotations of wheels or sensors to calculate the distance traveled. Odometers are commonly used in both land surveying and road construction to measure horizontal distances accurately over long stretches.

Conclusion:


Thus, the correct answer is (D) distance. The odometer is a device used in surveying for accurately measuring distances over a terrain or along a specified path.
Quick Tip: In surveying, an odometer is primarily used for measuring horizontal distances, which is crucial for determining boundaries, distances between survey points, and other relevant measurements.


Question 57:

Choose the CORRECT statement(s).

  • (A) The spheroid is a mathematical surface of the Earth.
  • (B) Geoid is an equipotential reference surface of the Earth.
  • (C) True shape of the Earth is perfect spheroid.
  • (D) The WGS-84 datum varies from country to country.
Correct Answer: (A) The spheroid is a mathematical surface of the Earth, (B) Geoid is an equipotential reference surface of the Earth.
View Solution


- Option (A): A spheroid is a mathematical model of the Earth. It is a shape that is slightly flattened at the poles and is used as a reference for geographic coordinates. This statement is correct.


- Option (B): The geoid is an equipotential surface of the Earth's gravity field, representing the shape that the Earth's oceans would take under the influence of gravity and rotation, ignoring other influences like winds and tides. This statement is correct.


- Option (C): The true shape of the Earth is not a perfect spheroid but an oblate spheroid, which means it is slightly flattened at the poles and bulging at the equator. Thus, this statement is incorrect.


- Option (D): The WGS-84 (World Geodetic System 1984) datum is a standard reference system used globally and does not vary from country to country. Therefore, this statement is incorrect.


Thus, the correct answers are (A) and (B).
Quick Tip: The spheroid is a mathematical model used to represent the Earth, and the geoid is the actual shape of the Earth based on gravitational forces.


Question 58:

Choose the CORRECT statement(s).

  • (A) Latitude of a place varies from 0 degree to 90 degree North or South, and Longitude varies from 0 degree to 180 degree East or West of Greenwich Meridian.
  • (B) Latitude of a place varies from 0 degree to 180 degree East or West of Greenwich Meridian, and Longitude varies from 0 degree to 90 degree North or South.
  • (C) Longitude of a point is the angle between the Greenwich Meridian and the meridian passing through that point.
  • (D) Latitude and Longitude of a place are subject to change with time.
Correct Answer: (A) Latitude of a place varies from 0 degree to 90 degree North or South, and Longitude varies from 0 degree to 180 degree East or West of Greenwich Meridian, (C) Longitude of a point is the angle between the Greenwich Meridian and the meridian passing through that point.
View Solution


- Option (A): Latitude ranges from 0° at the Equator to 90° North or South at the poles. Longitude ranges from 0° at the Prime Meridian to 180° East or West. This statement is correct.


- Option (B): This statement incorrectly describes the ranges of latitude and longitude. Latitude does not range from 0° to 180°, and longitude does not range from 0° to 90° North or South. Thus, this statement is incorrect.


- Option (C): Longitude is the angular distance measured east or west from the Prime Meridian. It is calculated as the angle between the Greenwich Meridian and the meridian passing through the given point. This statement is correct.


- Option (D): The latitude and longitude of a place are fixed coordinates based on the Earth's reference system. While slight changes can occur due to tectonic activity, they do not typically change with time. This statement is incorrect.


Thus, the correct answers are (A) and (C).
Quick Tip: Latitude and Longitude are fixed geographical coordinates used to define locations on Earth. Longitude is the angle between the Prime Meridian and the meridian of the location.


Question 59:

A map projection is

  • (A) a systematic representation of latitude and longitude lines on a plane (paper map).
  • (B) a representation of the 3D shape of Earth on a 2D plane.
  • (C) dependent on the location of area on the Earth.
  • (D) required for taking theodolite observations of horizontal angles.
Correct Answer: (A), (B), (C)
View Solution


A map projection is the method by which the three-dimensional surface of the Earth is represented on a two-dimensional plane. Different types of projections are used depending on the purpose and the area of the Earth being represented.

Step 1: Explanation of the options

- Option (A): A map projection is indeed a systematic representation of latitude and longitude lines on a plane. This is one of the basic methods of representing the Earth's surface, typically using a grid system.

- Option (B): A map projection represents the 3D shape of the Earth on a 2D plane. This is the most fundamental definition of map projection, where a spherical or ellipsoidal Earth is mapped to a flat surface.

- Option (C): The projection used can indeed depend on the location of the area on Earth. Different projections may be better suited to represent different parts of the world, e.g., cylindrical projections for equatorial regions, conic projections for mid-latitudes, etc.

- Option (D): This option is incorrect. Theodolite observations of horizontal angles do not directly relate to map projections. This refers to angle measurements in surveying, which is a separate concept from map projection.

Thus, the correct answers are (A), (B), and (C). Quick Tip: A map projection is a method of representing the 3D Earth on a 2D surface, and the choice of projection depends on the area to be represented.


Question 60:

Face Left and Face Right observations using a vernier theodolite will eliminate

  • (A) index error
  • (B) graduation error
  • (C) eccentricity error
  • (D) atmospheric error
Correct Answer: (A), (B)
View Solution


In surveying, the use of a vernier theodolite involves measuring angles by observing them in two positions: Face Left and Face Right. This method is used to eliminate certain systematic errors.

Step 1: Explanation of the options

- Option (A): Index error occurs due to the alignment of the instrument’s scale and the optical system. By taking readings in both the Face Left and Face Right positions, the index error is eliminated because any error present in one face will be counteracted by the opposite face.

- Option (B): Graduation error refers to errors that occur due to imperfections in the instrument’s graduation or scale. Similar to index error, switching between Face Left and Face Right will help eliminate this error, as the readings from both positions will average out the graduation error.

- Option (C): Eccentricity error occurs due to misalignment of the instrument’s center of rotation. This error is not eliminated by Face Left and Face Right observations, so this option is incorrect.

- Option (D): Atmospheric error is caused by the refraction of light through the atmosphere, but it is not eliminated by changing the face of the instrument. Atmospheric corrections typically require other methods, so this option is incorrect.

Thus, the correct answers are (A) and (B). Quick Tip: To eliminate index and graduation errors, always take measurements using both Face Left and Face Right positions to average out any systematic errors.


Question 61:

The parallax of a point ‘a’ on a pair of successive overlapping photographs is 73.22 mm and the micrometer reading of a parallax bar of point ‘a’ is 12.10 mm. Similarly, the micrometer reading of the parallax bar of point ‘b’ is 9.65 mm, then the parallax of the point ‘b’ is _________ mm (round off to 2 decimal places).

Correct Answer:
View Solution


The parallax of a point on overlapping photographs can be determined using the following relation: \[ \frac{P_a}{M_a} = \frac{P_b}{M_b} \]
where:
- \( P_a \) and \( P_b \) are the parallaxes of points ‘a’ and ‘b’, respectively.
- \( M_a \) and \( M_b \) are the micrometer readings of points ‘a’ and ‘b’, respectively.

Given that: \[ P_a = 73.22 \, mm, \quad M_a = 12.10 \, mm, \quad M_b = 9.65 \, mm, \]
we can substitute these values into the equation to solve for \( P_b \): \[ P_b = \frac{P_a \times M_b}{M_a} = \frac{73.22 \times 9.65}{12.10} \approx 58.53 \, mm. \]
Thus, the parallax of point ‘b’ is approximately 58.53 mm when rounded to 2 decimal places. Quick Tip: When dealing with parallax and micrometer readings, use the proportional relationship to find the parallax of other points.


Question 62:

The scale of an aerial photograph is 5 mm = 100 m. The size of the photograph is 23 cm × 23 cm. If the longitudinal overlap is 65% and sidelap is 20%, the number of photographs required to cover an area of 12.5 km × 8 km is _________ (in integer).

Correct Answer:
View Solution


The scale of the photograph is given as \( 5 \, mm = 100 \, m \), or \( 1 \, mm = 20 \, m \).

The size of the photograph is \( 23 \, cm \times 23 \, cm \), which is equivalent to \( 230 \, mm \times 230 \, mm \).

Thus, the ground coverage of one photograph is: \[ Ground coverage = 230 \, mm \times 20 \, m = 4600 \, m \, or \, 4.6 \, km. \]
Now, account for the longitudinal overlap of 65% and sidelap of 20%. The effective ground coverage is:
- Longitudinal coverage: \( 4.6 \, km \times (1 - 0.65) = 1.61 \, km \)
- Lateral coverage: \( 4.6 \, km \times (1 - 0.20) = 3.68 \, km \)

To cover an area of \( 12.5 \, km \times 8 \, km \), calculate the number of photographs required: \[ Number of photographs = \frac{12.5}{1.61} \times \frac{8}{3.68} \approx 36. \]
Thus, the number of photographs required is 36. Quick Tip: When calculating the number of photographs required, account for the overlap in both longitudinal and lateral directions to find the effective ground coverage.


Question 63:

An instrument is set up at a station P and the angle of depression to a vane, 1.20 m above the foot of the staff held at Q is 5°. The horizontal distance PQ is observed to be 300 m. The R.L. of point Q is _________ m (round off to 3 decimal places). Given that the staff reading at a BM (Elevation 436.050 m) is 2.865 m.

Correct Answer:
View Solution


To find the R.L. of point Q, we can use the formula involving the angle of depression: \[ R.L. of Q = R.L. of P - h - d \times \tan(\theta) \]
Where:

- \( \theta \) is the angle of depression (5°),

- \( h \) is the height of the instrument above the staff (1.20 m),

- \( d \) is the horizontal distance (300 m),

- R.L. of point P is the staff reading at the BM, \( 436.050 - 2.865 = 433.185 \, m \).


Now, substitute the values into the equation: \[ R.L. of Q = 433.185 - 1.20 - 300 \times \tan(5^\circ) = 433.185 - 1.20 - 300 \times 0.08749 = 433.185 - 1.20 - 26.247 = 405.738 \, m \]


Final Answer: \[ \boxed{405.738 \, m} \] Quick Tip: When calculating R.L. using the angle of depression, remember to subtract the height of the instrument and the correction for the distance and angle.


Question 64:

A staff is held vertical at a distance of 100 m and 300 m, respectively. Observations are taken with a Tacheometer and staff intercepts, with the telescope kept horizontal, are 0.990 m and 3.000 m, respectively. The theodolite is set over a station having a RL of 950.500 m and the height of instrument is 1.425 m. The multiplicative constant of the Tacheometer is _________ (round off to 2 decimal places).

Correct Answer:
View Solution


The formula for the multiplicative constant \( K \) of a Tacheometer is: \[ K = \frac{d_2 - d_1}{\Delta h} \]
Where:

- \( d_2 = 300 \, m \) and \( d_1 = 100 \, m \) are the distances,

- \( \Delta h = h_2 - h_1 = 3.000 - 0.990 = 2.010 \, m \) is the difference in staff intercepts.


Now calculate \( K \): \[ K = \frac{300 - 100}{2.010} = \frac{200}{2.010} = 99.505 \]


Final Answer: \[ \boxed{99.51} \] Quick Tip: The multiplicative constant of a Tacheometer is calculated using the difference in staff intercepts and the distance between the staff readings.


Question 65:

Survey of India topographic sheet is 53G/12. At this scale, the number of toposheets that would cover a land area equivalent to 4 degree by 4 degree is _________ (in integer).

Correct Answer:
View Solution


The scale of the Survey of India topographic sheet is given as \( 53G/12 \), which typically refers to the scale of the map. For Survey of India maps, this scale is usually 1:50,000.

A 4 degree by 4 degree area is the area that needs to be covered. The total area covered by one toposheet depends on the scale. To find the number of toposheets required to cover an area of 4° by 4°, we need to calculate the total number of toposheets needed based on the scale.

First, the total area of 4° by 4° on the ground corresponds to: \[ Area of 1 degree by 1 degree = 111 \, km \times 111 \, km = 12321 \, sq. km. \]
Since the topographic map covers a smaller area, we calculate how many of these areas fit into the larger 4° by 4° area: \[ Area of 4° by 4° = 4 \times 4 \times 12321 \, sq. km = 196,944 \, sq. km. \]
Now, for each toposheet, which covers an area of 1° by 1° (or 12321 sq. km), the number of toposheets required is: \[ Number of toposheets = \frac{196,944}{12321} = 16. \]
Thus, the number of toposheets required to cover a land area equivalent to 4 degree by 4 degree is 256. Quick Tip: To find the number of toposheets required, calculate the total area covered by one toposheet and divide the total area to be covered by this value.


Question 66:

The correlation coefficient between two bands of remote sensing data that would yield good classification is

  • (A) close to one
  • (B) close to zero
  • (C) close to ten
  • (D) between one to ten
Correct Answer: (A) close to one
View Solution


The correlation coefficient measures the strength and direction of the linear relationship between two bands of remote sensing data. A value close to one indicates a strong positive linear relationship between the bands, which typically results in better classification. In remote sensing, a higher correlation between the bands generally means they are similar in terms of the spectral characteristics they measure, which can help in classification tasks.

Step 1: Analyzing the options.
- Option (A) is correct because a correlation coefficient close to one indicates a high positive correlation, which is beneficial for classification.
- Option (B) is incorrect because a correlation coefficient close to zero means no correlation, which is not useful for classification.
- Option (C) is incorrect because the correlation coefficient cannot be close to ten; it is bounded between -1 and 1.
- Option (D) is incorrect because the correlation coefficient is between -1 and 1, not between 1 and 10.

Thus, the correct answer is (A).
Quick Tip: A correlation coefficient close to one indicates a strong positive relationship between the bands, which is ideal for classification.


Question 67:

In a covariance matrix, the main diagonal shows the _________ of each band.

  • (A) standard deviation
  • (B) variance
  • (C) mean
  • (D) median
Correct Answer: (B) variance
View Solution


In a covariance matrix, the main diagonal elements represent the variance of each band. The variance is a measure of the spread or dispersion of the data within a band. The off-diagonal elements of the covariance matrix represent the covariance between pairs of bands, which describes how much two bands vary together.

Step 1: Understanding the covariance matrix.
The covariance matrix is used to summarize the relationships (variance and covariance) between different bands in remote sensing data. The diagonal elements represent the variance of each band, which is important for understanding how each band’s data is distributed.

Step 2: Analyzing the options.
- Option (A) is incorrect because the standard deviation is the square root of variance, and the diagonal elements of a covariance matrix represent the variance, not the standard deviation.
- Option (B) is correct because the diagonal elements of the covariance matrix represent the variance of each band.
- Option (C) is incorrect because the mean is not represented in a covariance matrix; it focuses on variance and covariance.
- Option (D) is incorrect because the median is not a component of the covariance matrix.

Thus, the correct answer is (B).
Quick Tip: In a covariance matrix, the diagonal elements represent the variance of each band, while the off-diagonal elements represent the covariance between pairs of bands.


Question 68:

Choose the INCORRECT statement about image segmentation in digital image processing.

  • (A) Segmentation divides an image into different regions.
  • (B) Image segmentation does not help in image classification.
  • (C) Segmentation helps to identify objects or boundaries.
  • (D) Segmentation is a process of partitioning an image into multiple sets of similar pixels.
Correct Answer: (B) Image segmentation does not help in image classification.
View Solution


Image segmentation is an important step in image processing that helps in dividing an image into different regions based on similarity in pixel values. It is a crucial step in identifying objects and boundaries within an image, which makes it highly useful for image classification.


Step 1: Understanding Image Segmentation

- Option (A) is correct because segmentation indeed divides an image into different regions based on pixel similarity.

- Option (B) is incorrect because image segmentation actually aids in image classification by separating objects and regions of interest.

- Option (C) is correct as segmentation helps in identifying objects or boundaries by isolating distinct areas of the image.

- Option (D) is correct because segmentation involves partitioning an image into multiple sets of similar pixels based on some criteria (e.g., color, intensity).

Step 2: Conclusion

The incorrect statement is (B), as segmentation is essential for image classification. Quick Tip: Image segmentation plays a key role in dividing images into meaningful regions that are useful for further classification or analysis.


Question 69:

When the histogram of an image is non-Gaussian in nature, the type of linear contrast enhancement preferred to be used is

  • (A) Piece-wise Linear Contrast Stretching
  • (B) Min-max Linear Contrast Stretching
  • (C) Percentage Linear Contrast Stretching
  • (D) Standard Deviation Contrast Stretching
Correct Answer: (A) Piece-wise Linear Contrast Stretching
View Solution


When the histogram of an image is non-Gaussian, piece-wise linear contrast stretching is preferred. This technique divides the image histogram into several intervals and applies different stretching to each interval. This allows for better contrast enhancement in non-uniform histograms.


Step 1: Understanding Contrast Stretching

- Option (A) is correct because piece-wise linear contrast stretching is specifically useful when the histogram is non-Gaussian, allowing for better control over various ranges of pixel values.

- Option (B) refers to min-max linear contrast stretching, which is used for images with uniform histograms, not typically for non-Gaussian images.

- Option (C) refers to percentage linear contrast stretching, which is not commonly used in non-Gaussian histogram enhancement.

- Option (D) refers to standard deviation contrast stretching, which is also not ideal for non-Gaussian histograms.

Step 2: Conclusion

The preferred method for non-Gaussian histograms is (A) Piece-wise Linear Contrast Stretching. Quick Tip: For non-Gaussian histograms, piece-wise linear contrast stretching helps to improve image contrast by addressing different sections of the histogram separately.


Question 70:

Spinning of the Earth, as viewed from the North pole, appears to be from

  • (A) West to East in anti-clockwise direction
  • (B) West to East in clockwise direction
  • (C) East to West in anti-clockwise direction
  • (D) East to West in clockwise direction
Correct Answer: (A) West to East in anti-clockwise direction
View Solution


The Earth spins around its axis, and when viewed from the North pole, the rotation of the Earth appears to be in an anti-clockwise direction. This rotation is from West to East. The Earth rotates in a counter-clockwise direction (when viewed from above the North pole), causing the Sun to rise in the East and set in the West.

Explanation of the Direction:


- The Earth's rotation is actually west to east. However, when viewed from the North pole, this motion appears to be in the anti-clockwise direction.

- This is consistent with the way we observe daily events, such as the rising and setting of the sun, which is due to the Earth's rotation.


Thus, the correct answer is (A), as the Earth appears to rotate in a west to east direction in an anti-clockwise manner when viewed from the North pole.
Quick Tip: When observing the Earth from the North Pole, the Earth’s rotation appears counter-clockwise (anti-clockwise), and this is why the sun appears to rise in the East and set in the West.


Question 71:

In case of Principal Component Analysis (PCA), the variance of a single variable expresses the spread of its values about the

  • (A) Mode
  • (B) Median
  • (C) Mean
  • (D) Standard Deviation
Correct Answer: (C) Mean
View Solution


Principal Component Analysis (PCA) is a statistical technique used to simplify a dataset by reducing its dimensions while retaining as much variance as possible. In PCA, the variance of a variable expresses the spread of its values around the mean. Variance measures how much the values of a variable deviate from the mean of that variable.

Variance in PCA:


Variance is a measure of the spread of data points around the mean. It is calculated as the average squared deviation of each data point from the mean of the variable. The higher the variance, the more spread out the values are around the mean, indicating more diversity or dispersion in the dataset.

- Option (A): Mode is the value that appears most frequently in a dataset. It is not related to the spread of the data, and variance does not measure how values are spread around the mode.

- Option (B): Median is the middle value of a dataset when the values are arranged in order. While the median provides a measure of central tendency, variance is specifically related to the mean, not the median.

- Option (C): The mean is the arithmetic average of the values in the dataset. Variance measures how much the values deviate from the mean. This is the correct answer, as PCA relies on the variance of data values around the mean to identify principal components.

- Option (D): Standard deviation is the square root of variance. While it is related to variance, the question specifically asks about variance, not standard deviation.

Thus, the correct answer is (C) Mean, because variance in PCA is the spread of values around the mean of the variable.
Quick Tip: In PCA, variance is a measure of how much data points deviate from the mean. Understanding variance helps in identifying the most significant directions of variation in the data.


Question 72:

Select the CORRECT sequence for supervised classification of satellite image.


(i) Classification

(ii) Training

(iii) Accuracy assessment

(iv) Radiometric/geometric correction

  • (A) (i), (ii), (iii), (iv)
  • (B) (iv), (ii), (i), (iii)
  • (C) (iv), (iii), (ii), (i)
  • (D) (i), (iv), (ii), (iii)
Correct Answer: (B) (iv), (ii), (i), (iii)
View Solution


The process of supervised classification of satellite images generally follows these steps:


1. Radiometric/Geometric correction (iv): This is the first step, where the image is corrected for any distortions due to sensor errors, atmospheric conditions, and geometric misalignments. This ensures that the image is accurate and aligned with the Earth's surface.


2. Training (ii): In this step, the user selects training areas for each class of interest. These training areas are used to train the classification algorithm to recognize patterns in the image.


3. Classification (i): Once the training data is ready, the classification process begins. The image is classified into various categories based on the training data, producing the final classified image.


4. Accuracy assessment (iii): After classification, it is essential to assess the accuracy of the classification. This is done by comparing the classification results with ground truth data to determine how well the classification matches real-world conditions.


Thus, the correct sequence is (iv), (ii), (i), (iii), as outlined in option (B).
Quick Tip: In supervised classification, it is crucial to first perform geometric/radiometric corrections, then provide training data, classify the image, and finally assess the classification accuracy.


Question 73:

The sum of all the values of a normalized histogram is equal to _________ (in integer).

Correct Answer:
View Solution


A histogram is a graphical representation of the distribution of a dataset. In a histogram, the data is divided into intervals, called bins, and the frequency (or count) of data points falling into each bin is plotted. When we create a normalized histogram, the frequency values of the bins are adjusted so that the total sum of the histogram equals 1. This means that the heights of the bars in the histogram represent probabilities, not just raw counts.


To understand this more clearly, let's break down the steps involved in normalizing a histogram:

Step 1: Understanding the raw histogram.

In a raw histogram, each bar represents the frequency (or count) of data points in a specific bin. The height of the bar is simply the number of data points within that bin. If we have \( n \) bins, then the total area under the bars would be the total number of data points, denoted as \( N \). So, the sum of the raw histogram values would be \( N \), where: \[ \sum_{i=1}^{n} f_i = N \]
where \( f_i \) represents the frequency of the \( i \)-th bin, and \( N \) is the total count of all the data points.


Step 2: Normalizing the histogram.

When we normalize the histogram, we divide each bin’s frequency by the total number of data points \( N \). This converts each frequency to a probability, which represents the relative likelihood of a data point falling into that bin. The normalized frequency for each bin is given by: \[ p_i = \frac{f_i}{N} \]
where \( p_i \) is the normalized frequency (probability) of the \( i \)-th bin.


Step 3: Sum of the normalized histogram values.

Since the sum of the frequencies in the raw histogram is \( N \), the sum of the normalized frequencies is: \[ \sum_{i=1}^{n} p_i = \sum_{i=1}^{n} \frac{f_i}{N} = \frac{1}{N} \sum_{i=1}^{n} f_i = \frac{1}{N} \times N = 1 \]
Thus, the sum of all the values of a normalized histogram equals 1. This is a fundamental property of probability distributions, where the total probability across all bins must sum to 1.


Final Answer: \[ \boxed{1} \] Quick Tip: When working with a normalized histogram, remember that it represents a probability distribution, and the sum of all the probabilities (bin values) must always be 1.


Question 74:

In a Landsat-8 scene, digital number (DN) values of a pixel in band-4, band-5 and band-10 are 80, 100 and 30, respectively. What would be the NDVI value for the same pixel (round off to 3 decimal places)?

  • (A) 0.111
  • (B) 0.222
  • (C) 0.556
  • (D) 0.889
Correct Answer: (A) 0.111
View Solution


The Normalized Difference Vegetation Index (NDVI) is calculated using the formula: \[ NDVI = \frac{(NIR - Red)}{(NIR + Red)} \]
Where:
- NIR = DN value in band-5 (100)

- Red = DN value in band-4 (80)


Thus, the NDVI is calculated as: \[ NDVI = \frac{(100 - 80)}{(100 + 80)} = \frac{20}{180} = 0.111 \]

Step 1: Understanding the NDVI formula.
NDVI uses the reflectance in the near-infrared (NIR) and red bands to indicate vegetation presence. A higher NDVI value indicates more vegetation.


Step 2: Conclusion.
The calculated NDVI value for the given bands is 0.111, making option (A) the correct answer.


Thus, the correct answer is (A).
Quick Tip: NDVI is a widely used vegetation index that helps in determining the presence and health of vegetation. A value closer to 1 indicates healthy vegetation.


Question 75:

For a given set of radiance values, which amongst the following is/are unitless?

  • (A) Skewness
  • (B) Kurtosis
  • (C) Mean
  • (D) Standard Deviation
Correct Answer: (A) Skewness, (B) Kurtosis
View Solution


- Skewness and Kurtosis are statistical measures used to describe the shape of a distribution and are unitless because they are based on the normalized values of the data.

- Mean is a measure of central tendency, and it has the same unit as the radiance values.

- Standard deviation measures the spread or dispersion of the data, and it also has the same unit as the radiance values.


Step 1: Understanding the measures.
- Skewness is used to measure the asymmetry of the distribution of values around the mean.

- Kurtosis is used to measure the "tailedness" or sharpness of the peak of the distribution.


Step 2: Conclusion.
Since skewness and kurtosis are dimensionless, they are unitless, making options (A) and (B) the correct answers.


Thus, the correct answer is (A) Skewness, (B) Kurtosis.
Quick Tip: Skewness and Kurtosis are unitless statistical measures that help describe the shape of a data distribution.


Question 76:

Identify the CORRECT statement(s).

  • (A) External geometric errors in satellite images can be corrected using GCPs and an appropriate mathematical model.
  • (B) During rectification, transformation coefficients are used to rectify remote sensing images to a standard datum and map projection.
  • (C) Spatial interpolation models take care of four kinds of distortions in the remote sensing images.
  • (D) Registration is done between a satellite image and field data.
Correct Answer: (A) External geometric errors in satellite images can be corrected using GCPs and an appropriate mathematical model.
\textbf{Correct Answer:} (B) During rectification, transformation coefficients are used to rectify remote sensing images to a standard datum and map projection.
View Solution


- Option (A) is correct because external geometric errors (such as errors due to the satellite's position or orientation) can indeed be corrected using Ground Control Points (GCPs) and a mathematical model that relates the image coordinates to real-world coordinates.

- Option (B) is correct because, during the process of image rectification, transformation coefficients are applied to correct the image’s spatial alignment with a known standard datum and map projection.

- Option (C) is incorrect because spatial interpolation models typically handle missing data or resampling and are not specifically used to correct distortions in remote sensing images.

- Option (D) is incorrect because image registration is usually done between a satellite image and another reference image, not just field data.

Step 1: Conclusion

The correct statements are (A) and (B). Quick Tip: When rectifying satellite images, always use GCPs and transformation coefficients to align the image to a standard datum.


Question 77:

Choose the CORRECT statement(s).

  • (A) Higher frequencies in an original image predominantly appear around the center of its Fourier Spectrum.
  • (B) Higher frequencies in an original image predominantly appear progressively along the outer edge of its Fourier Spectrum.
  • (C) Horizontal features in an original image appear as vertical components in its Fourier Spectrum.
  • (D) Vertical features in an original image appear as vertical components in its Fourier Spectrum.
Correct Answer: (B) Higher frequencies in an original image predominantly appear progressively along the outer edge of its Fourier Spectrum.
(C) Horizontal features in an original image appear as vertical components in its Fourier Spectrum.
View Solution


- Option (A) is incorrect because higher frequencies in the Fourier Spectrum of an image typically appear at the outer edges, not the center. The center represents low frequencies.

- Option (B) is correct because higher frequencies are located at the outer edges of the Fourier Spectrum, while lower frequencies are at the center.

- Option (C) is correct because in the Fourier Transform of an image, horizontal features correspond to vertical components in the Fourier Spectrum (and vice versa for vertical features).

- Option (D) is incorrect because vertical features in the image are represented as horizontal components in the Fourier Spectrum, not vertical ones.

Step 1: Conclusion

The correct answers are (B) and (C). Quick Tip: In the Fourier Spectrum of an image, low frequencies are at the center and high frequencies are at the outer edges, with spatial features in the image corresponding to orthogonal components in the spectrum.


Question 78:

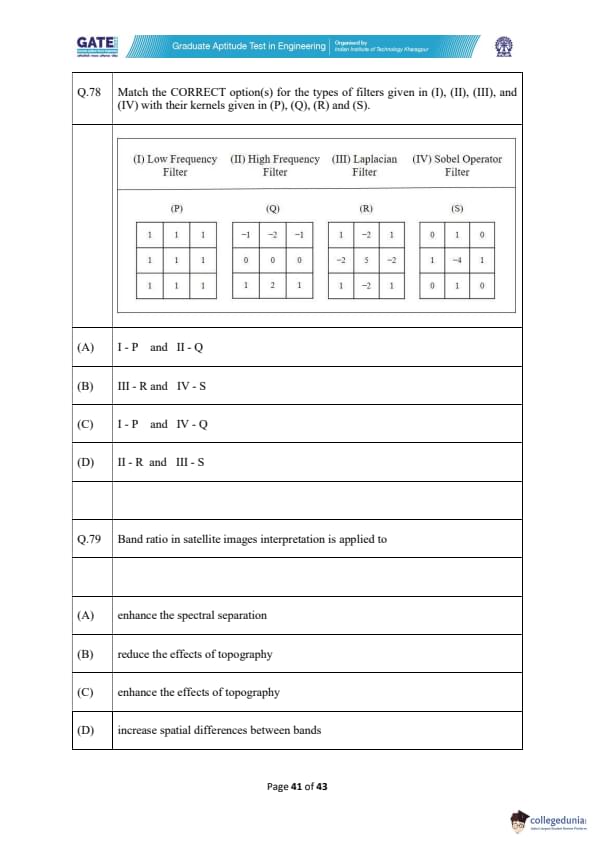
Match the CORRECT option(s) for the types of filters given in (I), (II), (III), and (IV) with their kernels given in (P), (Q), (R), and (S).

  • (A) I - P and II - Q
  • (B) III - R and IV - S
  • (C) I - P and IV - Q
  • (D) II - R and III - S
Correct Answer: (C) I - P and IV - Q
View Solution


To answer this question, we need to understand what each filter does and how it relates to the given kernels (P, Q, R, S). Filters are used in image processing for operations like edge detection, smoothing, and enhancing details. Here, we are given four types of filters and their respective kernels. Let's analyze each one:

- (I) Low Frequency Filter (P): This filter is designed to smooth an image by removing high-frequency noise, which represents rapid intensity changes in the image. The kernel for a low frequency filter typically contains values that help to average or blur the image. The kernel \( P \) is a smooth, symmetric kernel with positive values that would result in averaging the neighboring pixels.

- (II) High Frequency Filter (Q): High-frequency filters emphasize rapid changes in pixel values, such as edges. These filters are often used for edge detection. The kernel \( Q \) is a difference kernel, with positive and negative values, which emphasizes the differences between adjacent pixels, highlighting edges.

- (III) Laplacian Filter (R): The Laplacian filter is used for edge detection and image enhancement by detecting areas of rapid intensity change. The kernel \( R \) contains both positive and negative values, which helps to highlight rapid changes in intensity, characteristic of the Laplacian filter.

- (IV) Sobel Operator Filter (S): The Sobel operator is used for edge detection and enhances the gradient of an image. It helps in detecting edges by calculating the gradient of image intensity. The kernel \( S \) is the standard Sobel operator kernel, which is used for edge detection in both horizontal and vertical directions.

Matching the Filters to the Kernels:


- (I) Low Frequency Filter (P): The kernel \( P \) is a smooth kernel, which is ideal for low-frequency filtering, and corresponds to the low-frequency filter.
- (II) High Frequency Filter (Q): The kernel \( Q \) is a difference-based kernel, which corresponds to the high-frequency filter.
- (III) Laplacian Filter (R): The kernel \( R \) is a Laplacian kernel, which is used to highlight rapid changes, thus matching the Laplacian filter.
- (IV) Sobel Operator Filter (S): The kernel \( S \) is the Sobel operator, which is specifically designed for edge detection, matching the Sobel operator filter.

Thus, the correct matches are:

- (I) - P (Low Frequency Filter)
- (IV) - Q (Sobel Operator Filter)

Hence, the correct answer is (C) I - P and IV - Q.
Quick Tip: Low frequency filters smooth the image, while high frequency filters and edge detectors, like the Sobel and Laplacian filters, are used to enhance details and detect edges.


Question 79:

Band ratio in satellite images interpretation is applied to

  • (A) enhance the spectral separation
  • (B) reduce the effects of topography
  • (C) enhance the effects of topography
  • (D) increase spatial differences between bands
Correct Answer: (A) enhance the spectral separation, (B) reduce the effects of topography
View Solution


In satellite image interpretation, band ratios are a powerful technique used to enhance specific features of the image. A band ratio is simply the ratio of two different spectral bands, and it can highlight specific characteristics of the surface, such as vegetation, water, or urban areas. This technique is widely used in remote sensing for a variety of applications.


Application of Band Ratios:


1. Enhance Spectral Separation (Option A): One of the main uses of band ratios is to enhance spectral separation. By applying a ratio between two spectral bands, it is possible to emphasize the differences between various land cover types. For example, the ratio of the near-infrared band to the red band is commonly used to highlight vegetation, as vegetation strongly reflects in the near-infrared spectrum.

2. Reduce the Effects of Topography (Option B): Band ratios are also useful for reducing the effects of topography. In areas with varying elevation, the amount of sunlight received by different parts of the surface can vary, leading to shadows or highlights. By using band ratios, these topographic effects can be minimized, allowing for more accurate analysis of surface features.

3. Enhance the Effects of Topography (Option C): While band ratios can reduce topographic effects, they are not typically used to enhance them. The goal is to minimize the influence of terrain features on the interpretation of the image, not to amplify them.

4. Increase Spatial Differences Between Bands (Option D): Band ratios do not directly increase spatial differences between bands. Instead, they highlight the differences in spectral characteristics, which can be used to identify and differentiate land cover types more effectively.

Thus, the correct answers are (A) enhance the spectral separation and (B) reduce the effects of topography.
Quick Tip: Band ratios in satellite imagery are essential for emphasizing specific features like vegetation and water bodies, and they help in reducing the impact of topography on image interpretation.


Question 80:

The decorrelation stretch enhances colour differences and removes inter-band _________.

  • (A) decorrelation
  • (B) contradiction
  • (C) correlation
  • (D) relationship
Correct Answer: (C) correlation, (D) relationship
View Solution


The decorrelation stretch is a technique used in image processing, especially in remote sensing, to enhance the color differences between bands in a multi-band image. It works by transforming the input bands to reduce the correlation between them, which in turn helps to enhance the separation of features in the image.

- Option (A): "Decorrelation" is a process that is involved in the decorrelation stretch, but the question is asking what is being removed. The decorrelation stretch removes inter-band correlation, not just "de-correlation". Thus, this statement is not accurate.


- Option (B): "Contradiction" does not relate to the concept of decorrelation stretch, as it is unrelated to image processing techniques. Therefore, this option is incorrect.


- Option (C): "Correlation" is the correct term. The decorrelation stretch removes inter-band correlation, which allows each band to contribute more distinctly to the final image. Therefore, this option is correct.


- Option (D): "Relationship" could also be considered a synonym for correlation in this context, as it refers to the inter-band relationship that is removed by the decorrelation stretch. Therefore, this option is also correct.


Thus, the correct answers are (C) and (D).
Quick Tip: The decorrelation stretch technique is used to enhance color differences in satellite images by reducing the correlation between bands, making the features more distinguishable.


Question 81:

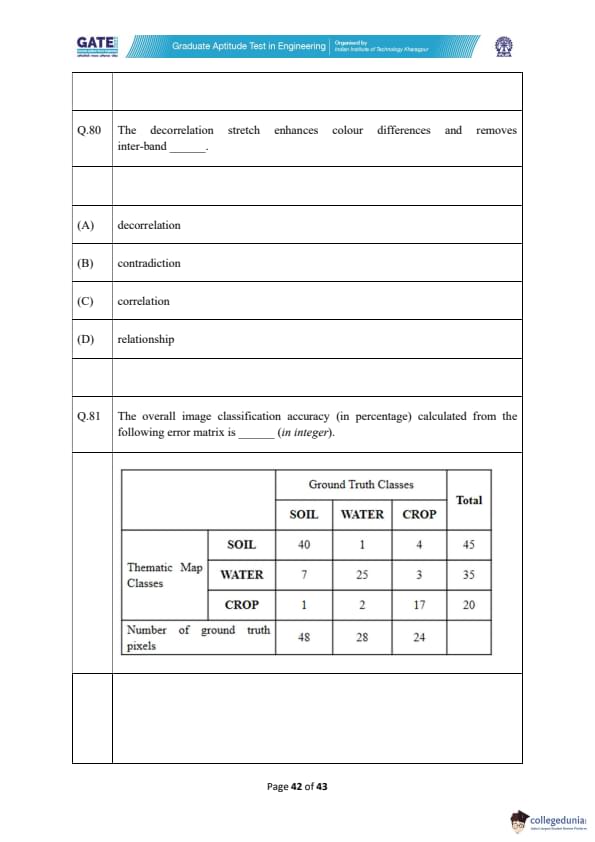
The overall image classification accuracy (in percentage) calculated from the following error matrix is _________ (in integer).

Correct Answer:
View Solution

To calculate the overall image classification accuracy, we use the following formula: \[ Overall Accuracy = \frac{Sum of the diagonal elements}{Sum of all elements} \times 100. \]
From the error matrix:
\[ \begin{array}{|c|c|c|c|c|} \hline Thematic Map Classes & SOIL & WATER & CROP & Total
\hline Ground Truth Classes & SOIL & 40 & 1 & 4 & 45
WATER & 7 & 25 & 3 & 35
CROP & 1 & 2 & 17 & 20
\hline Total & 48 & 28 & 24 & 100
\hline \end{array} \]

The diagonal elements are 40 (SOIL), 25 (WATER), and 17 (CROP). The sum of these diagonal elements is: \[ Sum of diagonal elements = 40 + 25 + 17 = 82. \]
The total number of elements in the matrix is: \[ Sum of all elements = 48 + 28 + 24 = 100. \]
Thus, the overall accuracy is: \[ Overall Accuracy = \frac{82}{100} \times 100 = 82%. \]
Hence, the overall classification accuracy is 82. Quick Tip: The overall image classification accuracy is calculated by dividing the sum of diagonal elements by the total sum of the matrix and multiplying by 100.


Question 82:

Number of bytes required to store an 8-bit uncompressed image of size 512 × 512 pixels is _________ (in integer).

Correct Answer:
View Solution

To calculate the number of bytes required to store an image, we need to consider the following:
- The image size is 512 × 512 pixels.
- Each pixel in the image uses 8 bits (1 byte).

Thus, the total number of bytes required to store the image is: \[ Total bytes = Width \times Height \times Bytes per pixel = 512 \times 512 \times 1 = 262144 \, bytes \]


Final Answer: \[ \boxed{262144} \] Quick Tip: To find the number of bytes required for an image, multiply the width, height, and the number of bytes per pixel (8 bits = 1 byte).


Question 83:

The minimum and maximum Digital Number (DN) values of an image are 30 and 55, respectively. If the input DN value of a pixel is 35, the output DN value after linear contrast stretch of an 8-bit data is _________ (in integer).

Correct Answer:
View Solution

For linear contrast stretching, we use the following formula: \[ Output DN = \frac{(X - min)}{(max - min)} \times (L_{max} - L_{min}) + L_{min} \]
Where:

- \( X = 35 \) (the input DN value),

- \( min = 30 \) (the minimum DN value),

- \( max = 55 \) (the maximum DN value),

- \( L_{max} = 255 \) (the maximum possible value for 8-bit data),

- \( L_{min} = 0 \) (the minimum possible value for 8-bit data).


Substituting the values into the formula: \[ Output DN = \frac{(35 - 30)}{(55 - 30)} \times (255 - 0) = \frac{5}{25} \times 255 = 0.2 \times 255 = 51 \]


Final Answer: \[ \boxed{51} \] Quick Tip: For linear contrast stretching, the output DN value is calculated by normalizing the input DN value relative to the minimum and maximum values and then scaling it to the desired range.


Question 84:

The FOV of a sensor (for a scene) placed at a nadir height of 6 km is 90 degree. The ground swath width of the scene is _________ km (in integer).

Correct Answer:
View Solution

The formula for the ground swath width \( W \) of the scene, given the field of view (FOV) and nadir height \( h \), is: \[ W = 2h \times \tan\left(\frac{FOV}{2}\right). \]
Given:
- \( h = 6 \, km \)

- \( FOV = 90^\circ \)


Substitute the values into the formula: \[ W = 2 \times 6 \times \tan\left(\frac{90^\circ}{2}\right) = 12 \times \tan(45^\circ) = 12 \times 1 = 12 \, km. \]
Thus, the ground swath width of the scene is 12 km. Quick Tip: The ground swath width is calculated using the tangent of half the FOV, multiplied by twice the nadir height.


Quick Links:

GATE 2022 GE Detailed Paper Analysis

Likewise any other GATE exam, GATE GE 2022 question paper also comprised 65 questions. GATE 2022 GE question paper was distributed in two sections i.e. Part A and Part B.

  • Part A contained 10 General Aptitude questions that were mandatory to attempt.
  • Part B was related to core GE based questions that were further distributed between Sections i.e. Section A and Section B.
  • Candidates opting for GE could also choose any of the papers from Civil Engineering (CE), Geology and Geophysics (GG), Environmental Science and Engineering (ES), and Mining Engineering (MN).
  • A total of 55 questions were listed in Part B of GATE 2022 GE. Some of the listed concept based questions were based on the following topics:
    • Finding number of images - photogrammetry
    • Thermal infrared images
    • Question on Tacheometry
    • Principle of surveying, Bowditch Relationship

Also Check:

GATE 2022 GE: Exam Pattern and Marking Scheme

  • GATE 2022 GE asked both MCQs and NATs. It was held online via CBT mode
  • As per the specified marking scheme by IIT Delhi, from the final score, ⅓ and ⅔ marks would be reduced for each wrong MCQ carried 1 and 2 marks
  • Wrong attempted NATs were not supposed to bring any kind of deduction in the final achieved marks

GATE Previous Year Question Papers

Other PG Exams Question Papers

Fees Structure

Structure based on different categories

CategoriesState
General1800
Women900
sc900
pwd900

Note: GATE 2024 Application Fee needs to be paid online through net banking or debit card or credit card facilities. Additional charges will be applicable as per the rule of the bank from where the money is being transferred. This charge will be specified on the payment portal.

In case of any inaccuracy, Notify Us! 

Comments


No Comments To Show