GATE 2022 Ecology and Evolution (EY) Question Paper with Solutions PDFs are now available on this page. IIT Kharagpur successfully concluded GATE 2022 EY on 12th February 2022 in the Forenoon Session (9:00 AM to 12:00 PM). The overall difficulty level of GATE 2022 EY was rated moderate. The question paper was distributed among two sections i.e General Aptitude and core Ecology and Evolution based questions. The General Aptitude section carried 10 questions, carrying 15% of the total weightage. The remaining 85% weightage was carried by the core EY section.
GATE 2022 Ecology and Evolution (EY) Question Paper with Solutions
| GATE 2022 Ecology and Evolution (EY) Question Paper | Check Solutions |
You should ______ when to say ______.
View Solution
In this sentence, the correct choice is (D) because the first blank requires a verb, and "know" is the appropriate verb for this context. The second blank requires the noun "no," which fits the context of the sentence.
- First part: "You should know when to say" implies that one should have the knowledge of when to say something.
- Second part: "no" fits the context as it is the word being referred to in the sentence.
Thus, the correct answer is (D) know / no. Quick Tip: Pay attention to the verb-noun agreement in sentences. When referring to knowledge or understanding, "know" is usually the correct verb.
Two straight lines pass through the origin \( (x_0, y_0) = (0, 0) \). One of them passes through the point \( (x_1, y_1) = (1, 3) \) and the other passes through the point \( (x_2, y_2) = (1, 2) \). What is the area enclosed between the straight lines in the interval \( [0, 1] \) on the x-axis?
View Solution
To solve this problem, we need to calculate the area between the two lines in the interval \( [0, 1] \) on the x-axis.
Step 1: Equation of the lines.
- Line 1 (through (0, 0) and (1, 3)): The slope of the line is:
\[ m_1 = \frac{3 - 0}{1 - 0} = 3. \]
The equation of the line is:
\[ y_1 = 3x. \]
- Line 2 (through (0, 0) and (1, 2)): The slope of the line is:
\[ m_2 = \frac{2 - 0}{1 - 0} = 2. \]
The equation of the line is:
\[ y_2 = 2x. \]
Step 2: Calculate the area between the lines.
The area between the lines is given by the integral of the difference in the y-values of the two lines over the interval \( [0, 1] \): \[ Area = \int_0^1 (y_1 - y_2) \, dx = \int_0^1 (3x - 2x) \, dx = \int_0^1 x \, dx. \]
The integral is: \[ \int_0^1 x \, dx = \frac{x^2}{2} \Big|_0^1 = \frac{1}{2}. \]
Thus, the area is \( 0.5 \). Therefore, the correct answer is (A).
Quick Tip: To calculate the area between two curves, subtract one curve's equation from the other and integrate over the given interval.
If \[ p : q = 1 : 2, \quad q : r = 4 : 3, \quad r : s = 4 : 5 \]
and \( u \) is 50% more than \( s \), what is the ratio \( p : u \)?
View Solution
Given the ratios:
\[ p : q = 1 : 2 \quad (i.e., p = \frac{q}{2} ) \] \[ q : r = 4 : 3 \quad (i.e., q = \frac{4r}{3} ) \] \[ r : s = 4 : 5 \quad (i.e., r = \frac{5s}{4} ) \]
We can write all terms in terms of \( s \). Start by expressing \( p \), \( q \), and \( r \) in terms of \( s \):
\[ r = \frac{5s}{4} \] \[ q = \frac{4r}{3} = \frac{4 \times \frac{5s}{4}}{3} = \frac{5s}{3} \] \[ p = \frac{q}{2} = \frac{\frac{5s}{3}}{2} = \frac{5s}{6} \]
Now, \( u \) is 50% more than \( s \), so: \[ u = 1.5s \]
Thus, the ratio \( p : u \) is: \[ \frac{p}{u} = \frac{\frac{5s}{6}}{1.5s} = \frac{5}{6 \times 1.5} = \frac{5}{9} = 1 : 5 \]
Step 1: Conclusion
The ratio \( p : u \) is \( 1 : 5 \), so the correct answer is (C). Quick Tip: When solving ratio problems, express all variables in terms of one common variable to simplify the calculations.
Given the statements:
P is the sister of Q.
Q is the husband of R.
R is the mother of S.
T is the husband of P.
Based on the above information, T is _________ of S.
View Solution
- P is the sister of Q, so P and Q are siblings.
- Q is the husband of R, so R is married to Q.
- R is the mother of S, so S is R's child.
- T is the husband of P, so T is married to P.
From this, T is the husband of P, who is the sister of Q. Therefore, T is the brother-in-law of Q. Since Q is S’s parent, T is the uncle of S.
Step 1: Conclusion
T is the uncle of S, so the correct answer is (B). Quick Tip: When solving family relation problems, carefully analyze the relationships to identify the roles each person plays.
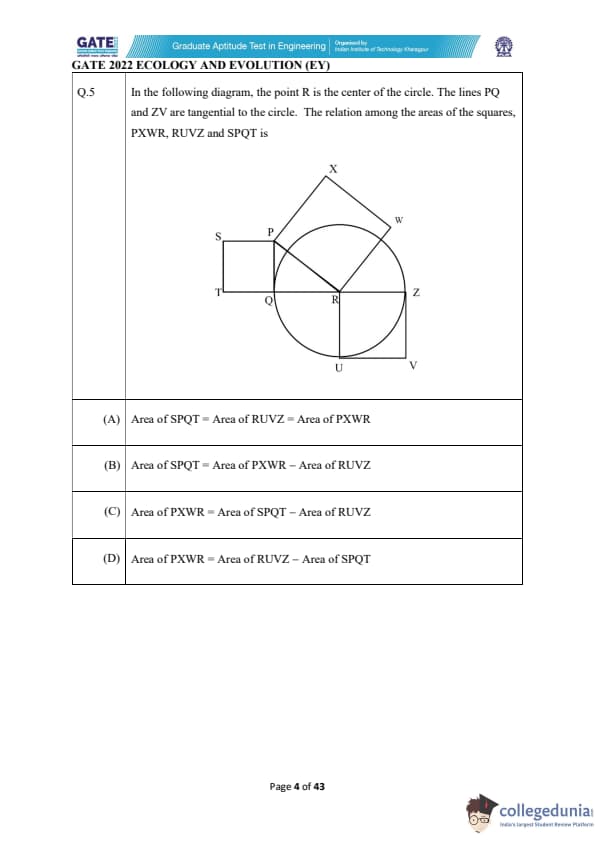
In the following diagram, the point R is the center of the circle. The lines PQ and ZV are tangential to the circle. The relation among the areas of the squares, PXWR, RUVZ and SPQT is

View Solution
In the given diagram, we are working with areas of squares inscribed in a circle. The points and lines are defined such that:
- The area of the square \( PXWR \) is the area enclosed by the tangent line \( PX \) and the radial line from the center \( R \).
- Similarly, the areas of the other squares \( RUVZ \) and \( SPQT \) are determined by the distances defined by the lines and the tangents.
By analyzing the geometric relationships and using the fact that the squares are inscribed, the correct relation between the areas of these squares is: \[ Area of SPQT = Area of PXWR - Area of RUVZ. \]
This is derived from the fact that the areas of the squares depend on the lengths of the sides, and the side lengths are related in such a way that this equation holds. Therefore, the correct answer is (B).
Quick Tip: In problems involving areas of squares inscribed within a circle, the relationships between the areas are often governed by the tangents and the distances between the center and the points of tangency.
Healthy eating is a critical component of healthy aging. When should one start eating healthy? It turns out that it is never too early. For example, babies who start eating healthy in the first year are more likely to have better overall health as they get older.
View Solution
The passage emphasizes that healthy eating is a crucial part of healthy aging, and it is important to start eating healthy as early as possible. It specifically mentions that babies who start eating healthy in the first year are more likely to maintain better overall health as they grow older. This implies that eating healthy can be beneficial at any age, but it is most effective when started early. Therefore, the correct inference based on the passage is that healthy eating can be started at any age, but the earlier, the better.
Thus, the correct answer is (B).
Quick Tip: Starting healthy eating habits early in life has long-term benefits for overall health. It is never too early to begin eating healthy, and doing so earlier maximizes the benefits.
P invested ₹ 5000 per month for 6 months of a year and Q invested ₹ x per month for 8 months of the year in a partnership business. The profit is shared in proportion to the total investment made in that year.
If at the end of that investment year, Q receives \( \frac{4}{9} \) of the total profit, what is the value of \( x \) (in ₹)?
View Solution
Let's calculate the total investment made by P and Q. P invests ₹5000 per month for 6 months, so P's total investment is: \[ 5000 \times 6 = 30,000 \, ₹. \]
Q invests ₹x per month for 8 months, so Q's total investment is: \[ x \times 8 = 8x \, ₹. \]
The total investment made by both P and Q is: \[ 30,000 + 8x \, ₹. \]
The total profit is shared in proportion to the total investment. We are given that Q receives \( \frac{4}{9} \) of the total profit. Therefore, the fraction of the total profit received by Q is the ratio of Q's investment to the total investment, i.e., \[ \frac{8x}{30,000 + 8x}. \]
Since Q receives \( \frac{4}{9} \) of the total profit, we can set up the equation: \[ \frac{8x}{30,000 + 8x} = \frac{4}{9}. \]
Cross-multiply to solve for \( x \): \[ 9 \times 8x = 4 \times (30,000 + 8x), \] \[ 72x = 120,000 + 32x, \] \[ 72x - 32x = 120,000, \] \[ 40x = 120,000, \] \[ x = \frac{120,000}{40} = 3000. \]
Thus, the value of \( x \) is ₹3000.
Quick Tip: To find the amount invested by each partner, use the ratio of their investments to the total investment. The share of profit is then directly proportional to this ratio.
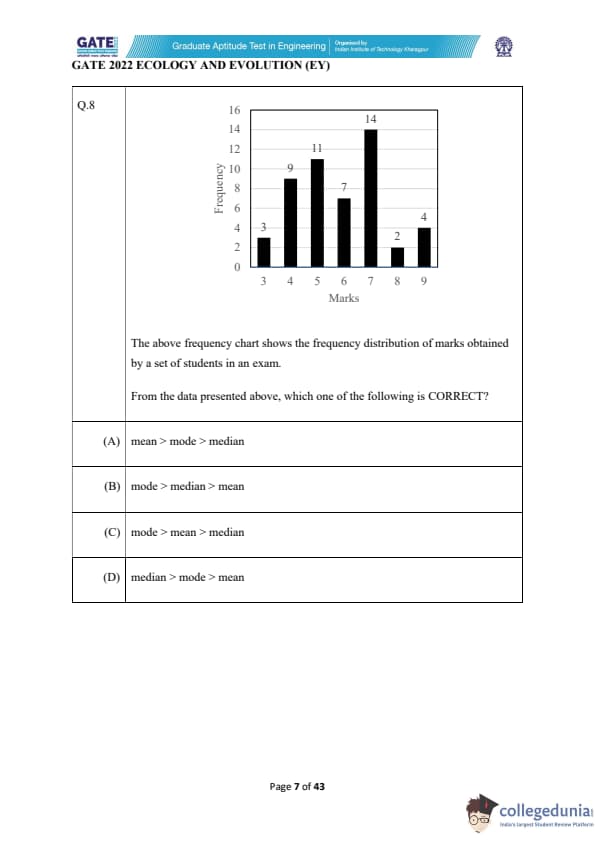
The above frequency chart shows the frequency distribution of marks obtained by a set of students in an exam.
From the data presented above, which one of the following is CORRECT?

View Solution
The given frequency distribution shows the number of students who scored different marks in an exam. We are asked to identify the correct relationship between the mean, mode, and median.
In a symmetric distribution, the mean, mode, and median are equal. From the given frequency distribution, we can observe that the distribution appears fairly symmetric with the highest frequency at the middle marks (5 and 6 marks), and it does not show extreme skewness. Therefore, for this distribution, the mean, median, and mode will be approximately equal.
Thus, the correct answer is (B) mean = mode = median.
Quick Tip: In a symmetric distribution, the mean, mode, and median are equal. This relationship is useful for understanding the central tendency of a dataset.
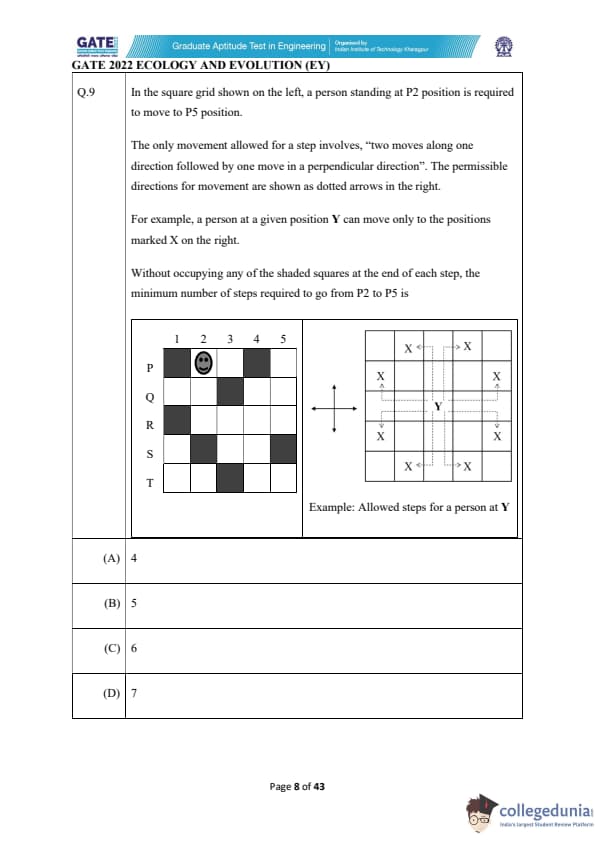
In the square grid shown on the left, a person standing at P2 position is required to move to P5 position.
The only movement allowed for a step involves, "two moves along one direction followed by one move in a perpendicular direction". The permissible directions for movement are shown as dotted arrows in the right.
For example, a person at a given position Y can move only to the positions marked X on the right.
Without occupying any of the shaded squares at the end of each step, the minimum number of steps required to go from P2 to P5 is:

View Solution
We need to determine the minimum number of steps to move from P2 to P5. The movement rule requires two steps in one direction followed by one step in a perpendicular direction.
By following the movement restrictions and considering the allowed moves, we can visualize the path taken across the grid. Here is how it works:
1. From P2, the person can move two squares to the right and then one square down.
2. From the new position, another two steps to the right followed by one step upwards.
3. From here, another similar move will get the person close to P5.
Counting all the steps, we see that it takes 5 moves to reach P5.
Thus, the correct answer is (B) 5. Quick Tip: To find the minimum number of steps, always plan the path in a way that minimizes backtracking and utilizes the allowed movement pattern efficiently.
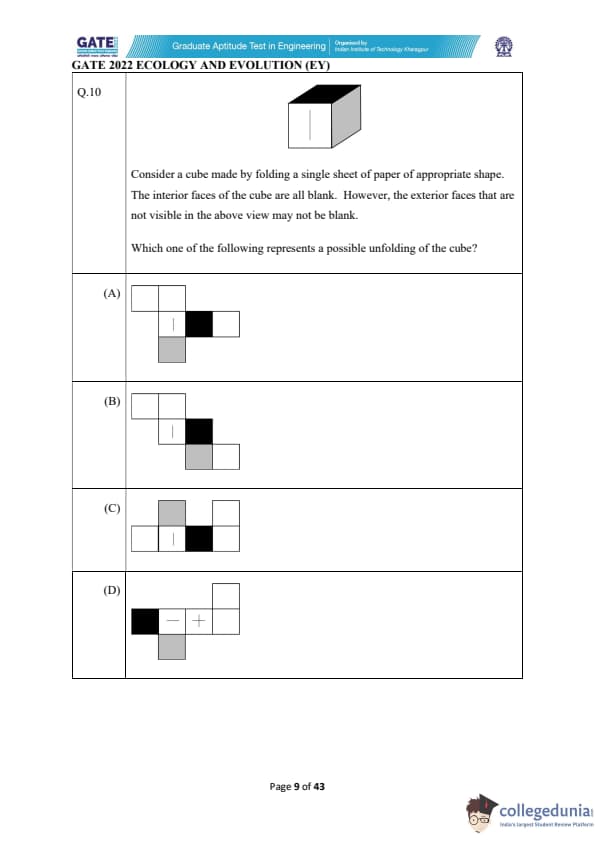
Consider a cube made by folding a single sheet of paper of appropriate shape. The interior faces of the cube are all blank. However, the exterior faces that are not visible in the above view may not be blank. Which one of the following represents a possible unfolding of the cube?


View Solution
To solve this, we need to visualize how the cube is folded and how the faces would appear when unfolded into a two-dimensional shape. The cube has six faces, and when unfolded, the net of the cube will show these six faces.
The visible and hidden faces must align correctly to form a proper cube. After examining each option, we observe that option (B) represents a valid unfolding of the cube. In this option, the layout of the faces allows them to be folded correctly into a cube with the given conditions.
Thus, the correct answer is (B). Quick Tip: When solving cube unfolding problems, visualize the three-dimensional structure and how the faces fit together. Ensure that all faces align logically when folded.
Which one of the following options denotes the time when the majority of animal phyla first appeared in the fossil record? (MYA = Million Years Ago)
View Solution
Step 1: Understanding the fossil record.
The majority of animal phyla first appeared during the Cambrian period, which is around 550 million years ago (MYA). This is known as the Cambrian explosion, a period of rapid diversification of life forms.
Step 2: Evaluating the options.
- (A) 65 MYA: This is around the time of the dinosaur extinction, not the appearance of animal phyla.
- (B) 250 MYA: This is the time of the Permian-Triassic extinction event, not the appearance of animal phyla.
- (C) 550 MYA: Correct, the Cambrian explosion occurred around this time.
- (D) 700 MYA: This is before the Cambrian period, during the Ediacaran period, but it is not the time of the appearance of most animal phyla.
Quick Tip: The Cambrian explosion around 550 MYA marked the appearance of most of the major animal phyla in the fossil record.
Consider the following strains of an influenza virus and their basic reproduction numbers (\(R_0\)). Assuming that they are all equally virulent, which one of the following strains would be most concerning for a completely vulnerable population of humans?
View Solution
Step 1: Understanding the basic reproduction number (\(R_0\)).
The basic reproduction number (\(R_0\)) represents the average number of secondary infections produced by a single infected individual in a completely susceptible population. A higher \(R_0\) indicates a more contagious strain.
Step 2: Analyzing the strains.
- (A) α-strain with \(R_0 = 4.0\): This strain has the highest \(R_0\) and would be the most concerning because it spreads more easily in a vulnerable population.
- (B) β-strain with \(R_0 = 1.0\): This strain has a moderate \(R_0\), so it is less concerning than the α-strain.
- (C) γ-strain with \(R_0 = 0.5\): This strain has a low \(R_0\), so it is less concerning than the β-strain.
- (D) δ-strain with \(R_0 = 0.2\): This strain has the lowest \(R_0\) and would spread less, making it less concerning.
Quick Tip: The higher the \(R_0\) value, the more contagious the virus is, making it a greater threat to a completely vulnerable population.
Which one of the following statements is true with respect to energy requirements of photosynthesis in C3 and C4 biochemical cycles?
View Solution
Step 1: Understand C3 and C4 photosynthesis.
C3 plants perform the Calvin cycle directly, whereas C4 plants first fix carbon dioxide into a four-carbon compound and then use the Calvin cycle. C4 photosynthesis is more energy-efficient under high light and temperature conditions, but it requires more energy compared to C3 photosynthesis.
Step 2: Evaluate options.
Option (A): Incorrect, as C4 plants require more energy than C3 plants.
Option (B): Correct, C4 plants have higher energy requirements compared to C3 plants due to the extra steps in carbon fixation.
Option (C): Incorrect, as C4 plants have higher energy requirements.
Option (D): Incorrect, energy requirements are related to whether the plant uses C3 or C4 photosynthesis.
Hence, the correct answer is (B).
Quick Tip: C4 photosynthesis requires more ATP than C3 due to the additional steps involved in fixing carbon dioxide.
Which one of the following is a proximate explanation for grouping in animals?
View Solution
Step 1: Understand proximate explanations.
Proximate explanations refer to immediate, mechanistic factors that explain behavior. In the case of animal grouping, the proximate cause often includes behaviors such as attraction to others or benefits in foraging efficiency.
Step 2: Evaluate options.
Option (A): This is a more ultimate explanation, explaining why grouping may be advantageous in terms of evolutionary fitness, rather than a proximate cause.
Option (B): Correct, animals often group together to increase foraging efficiency, a proximate behavior.
Option (C): This is more of a consequence or benefit of grouping, not the proximate cause.
Option (D): Correct, animals may form groups due to attraction to others, which is a proximate explanation for grouping.
Hence, the correct answers are (B) and (D).
Quick Tip: Proximate explanations focus on the immediate cause of behavior, such as individual attraction or efficiency, while ultimate explanations address the evolutionary advantage of that behavior.
The ethologist Konrad Lorenz is known for his discovery of which one of the following processes?
View Solution
Step 1: Understanding Konrad Lorenz's work.
Konrad Lorenz is known for his work in the field of ethology, especially for his discovery of the process of imprinting. Imprinting is a form of learning in which a young animal, during a critical period of development, forms an attachment to a specific object, often the first moving object it encounters, typically the mother. Lorenz demonstrated this with ducklings and geese.
Step 2: Explanation of other options.
(A) Habituation is a form of non-associative learning where an organism decreases its response to a repeated stimulus over time.
(B) Sensitization involves an increased response to a stimulus after repeated exposure.
(C) Reinforcement refers to a process in operant conditioning, not specifically associated with Lorenz's work.
Step 3: Conclusion.
The correct answer is (D) Imprinting, as it is the process Konrad Lorenz is most famously associated with.
Quick Tip: Imprinting is a rapid and irreversible form of learning, occurring during a critical period, typically early in an animal's life.
Male stickleback fish develop red colour on their ventral side in the breeding season and maintain territories. When a conspecific male intruder enters their territory, resident males perform an aggressive display. The ethologist Niko Tinbergen presented models of different shapes to territorial male stickleback fish. He found that models of any shape elicited aggressive displays, provided the ventral part of the models was coloured red. This observation led to the development of which one of the following concepts?
View Solution
Step 1: Understanding Niko Tinbergen's work.
Niko Tinbergen's experiments with stickleback fish led to the development of the concepts of sign stimuli and supernormal stimuli. In his study, he found that male sticklebacks would respond aggressively to models of any shape, as long as the ventral part of the model was coloured red, a feature that served as a "sign stimulus" for aggression.
Step 2: Explanation of each concept.
(A) Supernormal stimuli are exaggerated versions of natural stimuli that elicit stronger responses than the natural stimuli themselves. Tinbergen's models could be considered supernormal stimuli because they elicited exaggerated aggressive responses.
(B) Sign stimuli are cues or triggers in the environment that evoke a fixed action pattern, like the red ventral coloration in the stickleback fish.
(C) Gestalt stimuli refer to perceptual phenomena, often unrelated to animal behavior and learning.
(D) Internal stimuli refer to stimuli originating inside the organism, not external environmental triggers like the red color in the models.
Step 3: Conclusion.
The correct answers are (B) Sign stimuli and (A) Supernormal stimuli, as these concepts best describe the response elicited by the red coloration in the models.
Quick Tip: Supernormal stimuli are exaggerated cues that elicit stronger reactions than natural ones, while sign stimuli are natural cues that trigger specific behavioral responses.
Neuronal circuits that mediate escape responses in animals would perform best if they had which one of the following combination of properties?
View Solution
N/A Quick Tip: In systems that require fast responses, large diameter axons and electrical synapses are preferred because they allow quicker transmission of signals with less delay.
Moth caterpillars that mimic bird droppings are an example of which one of the following phenomena?
View Solution
N/A Quick Tip: Masquerade is when an organism resembles an object that is not preyed upon, like bird droppings, to avoid detection by predators.
Which one of the following processes is not likely to lead to the stable coexistence of two species at the same trophic level within an ecological community?
View Solution
Step 1: Understanding coexistence mechanisms.
For two species to coexist at the same trophic level, their ecological niches must either not overlap or must be differentiated. Various processes help facilitate coexistence, such as facilitation and niche differentiation. Intense interspecific competition, however, tends to decrease the potential for coexistence by driving one species to outcompete the other.
Step 2: Analysis of options.
- (A) Density-dependent predation: Predation that depends on population density can regulate species numbers but may still allow coexistence by preventing either species from becoming overly abundant.
- (B) Facilitation: This occurs when one species benefits another, which can help stabilize coexistence.
- (C) Intense interspecific competition: High levels of competition typically reduce the chances of stable coexistence as one species is likely to dominate.
- (D) Niche differentiation: This refers to the process where species evolve to occupy different ecological niches, thus reducing direct competition and facilitating stable coexistence.
Step 3: Conclusion.
The correct answer is (C) Intense interspecific competition, as it is the least likely to lead to the stable coexistence of two species at the same trophic level. Quick Tip: Coexistence at the same trophic level is more likely when species reduce direct competition through niche differentiation or facilitation.
Which one of the following organisms is a cytoplasmically inherited symbiotic bacterium that can cause extreme female-biased sex ratios in many insects?
View Solution
Step 1: Understanding Wolbachia.
Wolbachia is a genus of bacteria that is maternally inherited and can manipulate host reproductive systems, causing extreme sex ratio distortions, such as producing more females than males. This bacterium is commonly found in many insect species.
Step 2: Analysis of options.
- (A) Clostridium: These are anaerobic bacteria, not associated with sex ratio manipulation in insects.
- (B) Escherichia: This is a genus of bacteria that includes E. coli, which does not cause sex ratio distortions in insects.
- (C) Mycobacterium: These bacteria are responsible for diseases like tuberculosis but do not cause sex ratio distortion.
- (D) Wolbachia: Wolbachia is known for inducing female-biased sex ratios and is a symbiotic bacterium found in many insect species.
Step 3: Conclusion.
The correct answer is (D) Wolbachia, as it is the bacterium responsible for causing extreme female-biased sex ratios in many insects. Quick Tip: Wolbachia can cause sex ratio distortion in insects by affecting their reproductive processes, including parthenogenesis and male killing.
A cross between a pure-bred plant with red flowers and a pure-bred plant with white flowers produced F1 generation with pink flowers. If the plants with pink flowers are selfed, what is the proportion of white : pink : red flowers expected in the next generation?
View Solution
Step 1: Understanding incomplete dominance.
In this case, the plants with red flowers (RR) and white flowers (WW) are crossed. The F1 generation will have pink flowers (RW), which is a classic example of incomplete dominance. Incomplete dominance occurs when neither allele is completely dominant, resulting in an intermediate phenotype (pink flowers, in this case). The genotype of the F1 generation will be heterozygous (RW).
Step 2: Self-crossing of F1 plants.
When the F1 plants (RW) are selfed, the offspring will inherit one allele from each parent. The possible combinations of alleles are:
- RR (red flowers)
- RW (pink flowers)
- WW (white flowers)
The expected genotypic ratio from a self-cross between two heterozygotes (RW × RW) is: \[ Genotypic ratio: \ 1 \, RR : 2 \, RW : 1 \, WW. \]
Thus, the expected phenotypic ratio is 1 red : 2 pink : 1 white.
Step 3: Conclusion.
The proportion of white : pink : red flowers in the next generation will be 1 : 2 : 1, corresponding to option (B). Quick Tip: In incomplete dominance, the self-cross of F1 heterozygotes (RW) will result in a 1:2:1 phenotypic ratio in the F2 generation.
A gene coding for a particular protein exhibits 2% DNA sequence divergence between humans and chimpanzees. However, protein sequences encoded by them are identical. Which one of the following processes explains this?
View Solution
Step 1: Understanding synonymous mutations.
Synonymous mutations are mutations in the DNA sequence that do not lead to a change in the amino acid sequence of the resulting protein. This happens because of the redundancy of the genetic code — multiple codons can code for the same amino acid. For example, both the codons UUU and UUC code for phenylalanine (Phe), so a mutation that changes one codon to another codon for the same amino acid will not change the protein sequence.
Step 2: Exploring the relationship between DNA and protein sequences.
In this case, the 2% divergence in the DNA sequence between humans and chimpanzees means that there are small differences in the gene sequences. However, since the protein sequences are identical, this suggests that the changes in the DNA sequence are synonymous. These mutations do not affect the final protein product because they still encode the same amino acids.
Step 3: Evaluating the options.
- (A) Nonsynonymous changes: Nonsynonymous mutations lead to a change in the amino acid sequence, which would result in a different protein. This is not the case here because the protein sequences are identical.
- (B) Synonymous changes: Correct, these mutations do not affect the protein sequence despite changes in the DNA sequence.
- (C) Nonsense mutations: These mutations introduce a stop codon in the sequence, which would truncate the protein. This does not apply because the protein sequences are the same.
- (D) Frameshift mutations: Frameshift mutations result in a change in the reading frame of the gene and would lead to a different protein sequence. This is not the case here because the protein sequences are identical.
Step 4: Conclusion.
The correct explanation for why the protein sequences are identical despite 2% DNA sequence divergence is that the mutations are synonymous, meaning they do not alter the protein sequence. Therefore, the correct answer is (B).
Quick Tip: Synonymous mutations do not affect the protein product because they code for the same amino acid, even though the DNA sequence may change.
Which one of the following sets of characteristics is most likely to cause population extinction via demographic stochasticity?
View Solution
Step 1: Understand demographic stochasticity.
Demographic stochasticity refers to the random fluctuations in population size and growth due to the random nature of reproduction and survival at the individual level. Populations with small geographical ranges and low population densities are more vulnerable to these fluctuations, making them more likely to face extinction.
Step 2: Evaluate each option.
Option (A): Correct, small range and low population density increase vulnerability to extinction via demographic stochasticity.
Option (B): Larger ranges can reduce vulnerability by allowing for a larger population, even if density is low.
Option (C): High population density can buffer against demographic stochasticity, making this option less likely to cause extinction.
Option (D): Large range and high density would typically protect against stochastic extinction.
Hence, the correct answer is (A).
Quick Tip: Demographic stochasticity has a greater impact on populations with smaller sizes and restricted ranges.
Which one of the following is not an expected impact of global warming?
View Solution
Step 1: Understand global warming impacts.
Global warming is expected to cause shifts in species distributions due to changes in temperature and habitat suitability. Generally, species are expected to move towards higher latitudes or elevations as temperatures rise.
Step 2: Evaluate each option.
Option (A): Birds are expected to shift to higher elevations as temperatures increase.
Option (B): Fish are likely to move to deeper waters as surface waters warm.
Option (C): Lizards, being ectothermic, are more likely to move towards higher latitudes or elevations, not the equator, as the equator is already at high temperatures.
Option (D): Mammals are expected to shift towards higher latitudes as temperatures rise.
Hence, the correct answer is (C).
Quick Tip: As global temperatures rise, species are expected to shift towards cooler habitats, such as higher latitudes or elevations.
Which one of the following represents the chemical energy available to herbivores in an ecosystem?
View Solution
Step 1: Understanding the terms.
Net Secondary Productivity (NSP) represents the chemical energy that is available to herbivores (primary consumers) in an ecosystem. It refers to the amount of energy that is transferred from the primary producers (plants) to the herbivores after accounting for energy lost through respiration.
Step 2: Explanation of other options.
(B) Gross Primary Productivity (GPP) refers to the total amount of chemical energy that is captured by primary producers through photosynthesis, not the energy available to herbivores.
(C) Net Ecosystem Productivity (NEP) is the balance of energy in the ecosystem after accounting for both primary and secondary productivity.
(D) Net Primary Productivity (NPP) is the energy available to herbivores, but it does not include the energy used by the herbivores, only the energy captured by primary producers.
Step 3: Conclusion.
The correct answer is (A) Net Secondary Productivity, as it represents the energy available to herbivores in an ecosystem.
Quick Tip: Net Secondary Productivity refers to the energy available for herbivores and other consumers in the ecosystem after accounting for energy lost in respiration.
Which one of the following major mass extinctions is the most recent?
View Solution
Step 1: Understanding the mass extinctions.
The most recent mass extinction event is the Cretaceous-Paleogene (K-Pg) extinction, which occurred around 66 million years ago and is most famous for the extinction of the dinosaurs. This event marked the end of the Mesozoic Era and the beginning of the Cenozoic Era.
Step 2: Explanation of other options.
(B) Late Devonian occurred around 360-375 million years ago, primarily affecting marine life.
(C) Permian-Triassic extinction, about 252 million years ago, was the largest extinction event in Earth's history, wiping out nearly 90% of life.
(D) Triassic-Jurassic extinction occurred about 201 million years ago, marking the end of the Triassic period and paving the way for the dinosaurs to dominate.
Step 3: Conclusion.
The correct answer is (A) Cretaceous-Paleogene, as it is the most recent of the major mass extinction events.
Quick Tip: The Cretaceous-Paleogene extinction event is best known for the extinction of dinosaurs, caused by a combination of volcanic activity, climate change, and an asteroid impact.
Which one of the following does not help maintain genetic diversity at a given locus?
View Solution
N/A Quick Tip: Genetic drift can decrease genetic diversity, especially in small populations, by causing random changes in allele frequencies.
Which one of the following is potentially explained by the mid-domain effect?
View Solution
N/A Quick Tip: The mid-domain effect is often observed when species richness peaks in the middle of a gradient, as it is where the most overlap in species ranges occurs.
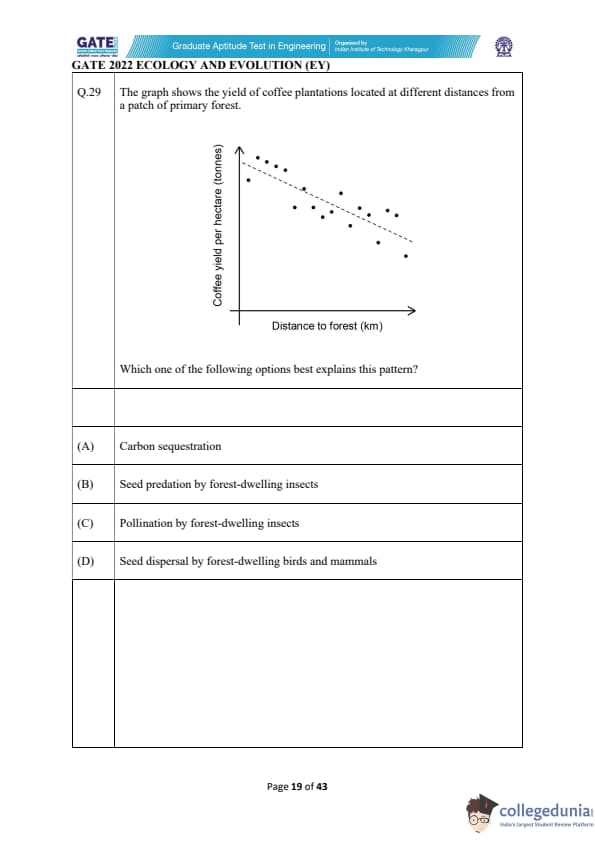
The graph shows the yield of coffee plantations located at different distances from a patch of primary forest.
Which one of the following options best explains this pattern?

View Solution
Step 1: Understanding the graph.
The graph shows a negative correlation between the distance of coffee plantations from the primary forest and their yield. This suggests that the coffee plantations closer to the forest are performing better than those farther away. This could be due to interactions with forest-dwelling species that enhance coffee growth.
Step 2: Analysis of options.
- (A) Carbon sequestration: While carbon sequestration may happen in forests, it does not directly explain the variation in coffee yield as shown in the graph.
- (B) Seed predation by forest-dwelling insects: This would likely negatively impact coffee yield, but it would not explain the pattern observed in the graph.
- (C) Pollination by forest-dwelling insects: Forest-dwelling insects such as bees and butterflies are often important pollinators for crops like coffee. The closer the plantation is to the forest, the higher the likelihood of receiving pollination from these insects, thus increasing coffee yield.
- (D) Seed dispersal by forest-dwelling birds and mammals: Seed dispersal would be relevant to plant growth but is unlikely to explain the yield pattern observed in the graph.
Step 3: Conclusion.
The best explanation for the observed pattern is (C) Pollination by forest-dwelling insects, as proximity to the forest likely provides better access to pollinators that enhance coffee yield. Quick Tip: Pollination by insects from nearby forests is often crucial for the successful cultivation of crops like coffee.
Which one or more of the following bird species is/are the focus of conservation-oriented captive breeding efforts in India?
View Solution
Step 1: Understanding the focus of conservation efforts.
Conservation-oriented captive breeding efforts are aimed at species that are critically endangered and at risk of extinction. These efforts help in increasing population numbers and ensuring species survival in the wild.
Step 2: Evaluating the species.
- (A) Great Indian Bustard: This species is critically endangered, but the focus of captive breeding efforts in India is more on the White-winged Wood Duck.
- (B) Himalayan Quail: This species is also critically endangered, but the primary focus is on other species like the White-winged Wood Duck.
- (C) Jerdon’s Courser: This species is critically endangered, but its conservation efforts are focused more on habitat protection than captive breeding.
- (D) White-winged Wood Duck: This species has been a significant focus of conservation efforts and captive breeding in India. The efforts are aimed at increasing its population.
Step 3: Conclusion.
The correct answer is (D) White-winged Wood Duck, as it is the species most closely associated with captive breeding efforts in India. Quick Tip: Conservation efforts focus on critically endangered species to increase their population and ensure long-term survival, often through captive breeding programs.
Which one or more of the following is/are not an example of a zoonotic disease(s)?
View Solution
Step 1: Understanding zoonotic diseases.
Zoonotic diseases are those that are transmitted from animals to humans. These diseases are caused by pathogens such as bacteria, viruses, or parasites that are primarily found in animals but can also infect humans.
Step 2: Evaluating the options.
- (A) Ebola: Ebola is a viral disease that can be transmitted to humans from animals, primarily through direct contact with infected animals. It is a zoonotic disease.
- (B) HIV-AIDS: HIV is a viral disease that primarily affects humans, but it is thought to have originated from primates and is not considered a zoonotic disease in its current form.
- (C) Lyme disease: Lyme disease is caused by bacteria transmitted by ticks that feed on animals and then infect humans. It is a zoonotic disease.
- (D) Poliomyelitis: Poliomyelitis (polio) is a viral disease that affects humans, but it is not transmitted from animals to humans. It is not a zoonotic disease.
Step 3: Conclusion.
The correct answer is (A) Ebola, (B) HIV-AIDS, (C) Lyme disease, as these are zoonotic diseases caused by transmission from animals to humans. Poliomyelitis, however, is not a zoonotic disease.
Quick Tip: Zoonotic diseases are transmitted from animals to humans. HIV and polio are not considered zoonotic diseases.
Small islands tend to have fewer species than nearby large islands. Which one or more of the following reasons explain(s) this outcome?
View Solution
Step 1: Understand island biogeography.
Island biogeography suggests that small islands typically support fewer species because they have fewer resources, lower environmental heterogeneity, and smaller populations.
Step 2: Evaluate each option.
Option (A): Correct, small islands have smaller populations and fewer resources, which increases the likelihood of extinction.
Option (B): Correct, smaller islands typically have less environmental variation, limiting the diversity of species they can support.
Option (C): Correct, smaller islands support fewer individuals, which increases the risk of extinction due to random events.
Option (D): Incorrect, smaller islands typically have lower speciation rates due to fewer ecological opportunities.
Hence, the correct answers are (A), (B), and (C).
Quick Tip: Smaller islands are more vulnerable to extinction due to limited resources, lower population sizes, and less environmental variation.
The term “living fossil” applies to which one or more of the following organisms?
View Solution
Step 1: Understand the concept of "living fossil."
A "living fossil" refers to an organism that has changed very little over millions of years and resembles species known only from the fossil record.
Step 2: Evaluate each option.
Option (A): The coelacanth is a well-known "living fossil" as it has been largely unchanged for around 400 million years, and it is often cited as the classic example of such species.
Option (B): The echidna is considered a living fossil due to its primitive features that date back to the Mesozoic era.
Option (C): The horseshoe crab is another example of a living fossil, with a lineage stretching back over 450 million years.
Option (D): The rhinoceros viper does not qualify as a living fossil as it is a relatively recent species in terms of evolutionary history.
Hence, the correct answers are (B) and (C).
Quick Tip: Living fossils are organisms that have existed with little morphological change for long periods, offering insights into early life forms.
Which one or more of the following reasons has/have been invoked to explain island gigantism?
View Solution
Step 1: Understanding island gigantism.
Island gigantism refers to the phenomenon where certain species, especially animals, grow larger on islands than their mainland counterparts. This is often attributed to ecological factors such as the absence of predators, limited competition, and available resources.
Step 2: Explanation of each option.
(A) Absence of interspecific competitors allows a species to dominate its niche, leading to larger body sizes due to the absence of competition.
(B) Absence of predators means the species does not need to stay small to avoid predation, which can lead to an increase in body size.
(C) Limited habitat is not typically associated with gigantism, as species with limited habitat tend to be smaller.
(D) Limited prey base leads to selection for larger body sizes in some cases, as larger individuals may be more capable of obtaining food.
Step 3: Conclusion.
The correct answers are (A) and (B) because these factors are commonly invoked to explain island gigantism.
Quick Tip: Island gigantism occurs when ecological pressures like the absence of predators and competition, along with limited prey, lead to an increase in body size for certain species.
Which one or more of the following options represent(s) life history trade-offs?
View Solution
Step 1: Understanding life history trade-offs.
Life history trade-offs refer to the balancing act that organisms must perform between different biological processes such as reproduction, survival, and growth. These trade-offs are crucial for understanding evolutionary strategies.
Step 2: Explanation of each option.
(A) Egg size versus clutch size is a classic trade-off, where producing fewer, larger eggs may be beneficial in terms of offspring survival, but fewer offspring are produced.
(B) Growth versus age at sexual maturation is another trade-off. Faster growth may delay reproduction, while early reproduction may limit growth.
(C) Mate choice versus offspring quality is not a direct trade-off in life history, though it may influence evolutionary outcomes, it is not typically seen as a fundamental life history trade-off.
(D) Survival versus reproduction is a well-known trade-off in evolutionary biology, where resources allocated to reproduction may reduce survival, and vice versa.
Step 3: Conclusion.
The correct answers are (A), (B), and (D) because these are well-documented life history trade-offs.
Quick Tip: Life history trade-offs are central to evolutionary biology, illustrating the constraints organisms face in balancing different biological needs like growth, survival, and reproduction.
Certain plants and animals rely on toxins such as cardiac glycosides for self-defense. Digitoxin and bufalin, structurally similar toxins produced by foxglove plants and bufonid toads, respectively, are one such example. Which one of the following statements about these toxins is correct?
View Solution
N/A Quick Tip: Analogous structures or functions arise independently, while homologous traits arise due to shared ancestry.
A behavioural ecologist records the number of times a kingfisher succeeds in catching fish over multiple five-minute intervals. Which one of the following distributions best describes these data?
View Solution
N/A Quick Tip: The Poisson distribution is often used when counting the number of events (e.g., successes or failures) that happen in a fixed interval of time or space.
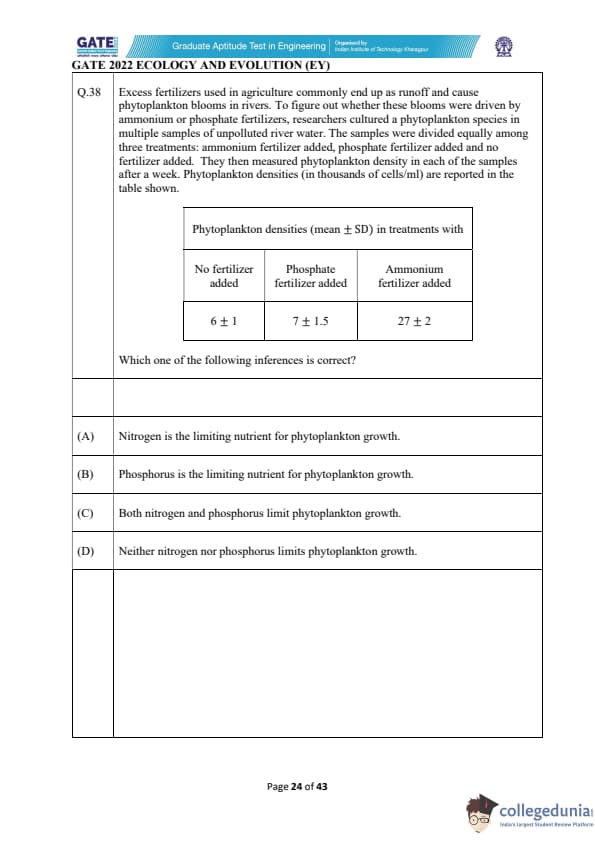
Excess fertilizers used in agriculture commonly end up as runoff and cause phytoplankton blooms in rivers. To figure out whether these blooms were driven by ammonium or phosphate fertilizers, researchers cultured a phytoplankton species in multiple samples of unpolluted river water. The samples were divided equally among three treatments: ammonium fertilizer added, phosphate fertilizer added, and no fertilizer added. They then measured phytoplankton density in each of the samples after a week. Phytoplankton densities (in thousands of cells/ml) are reported in the table shown.

View Solution
Step 1: Understanding the data.
The table provides phytoplankton densities in three treatments: no fertilizer, phosphate fertilizer, and ammonium fertilizer. The data shows that without fertilizer, the density is 6 ± 1, with phosphate fertilizer it is 7 ± 1.5, and with ammonium fertilizer it is 27 ± 2.
Step 2: Analyzing the results.
The density is significantly higher when ammonium fertilizer is added compared to both no fertilizer and phosphate fertilizer. This suggests that ammonium (a source of nitrogen) has a major positive impact on phytoplankton growth. Phosphate fertilizer leads to a slight increase in growth, but not as much as ammonium. This indicates that nitrogen is the limiting nutrient for phytoplankton growth in this case.
Step 3: Conclusion.
The correct inference is (A) Nitrogen is the limiting nutrient for phytoplankton growth, as shown by the large increase in phytoplankton density when ammonium (nitrogen) is added. Quick Tip: In aquatic ecosystems, nitrogen is often the limiting nutrient for phytoplankton growth, while phosphorus typically plays a secondary role.
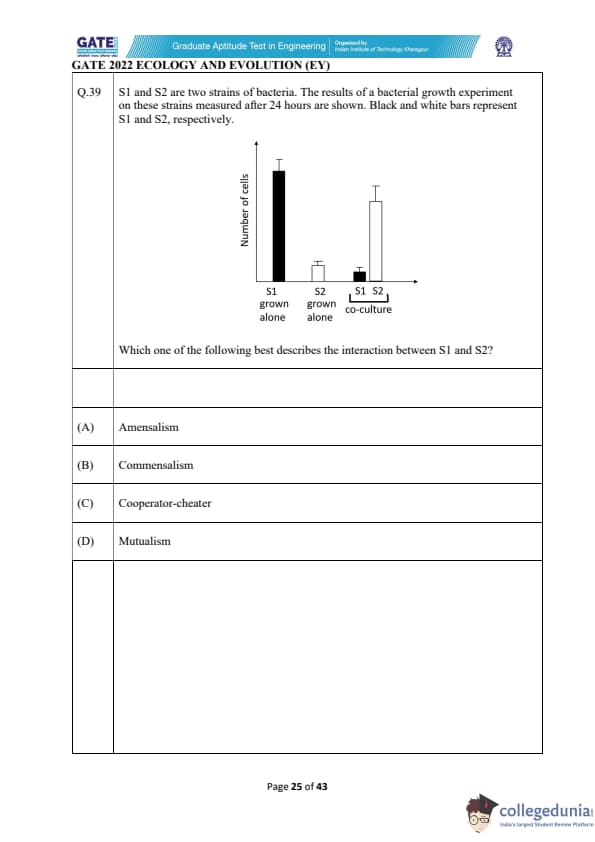
S1 and S2 are two strains of bacteria. The results of a bacterial growth experiment on these strains measured after 24 hours are shown. Black and white bars represent S1 and S2, respectively.

View Solution
Step 1: Understanding the interaction types.
- Amensalism: One species is harmed while the other is unaffected.
- Commensalism: One species benefits while the other is unaffected.
- Cooperator-cheater: One species benefits at the expense of the other, where one benefits from cooperation but does not reciprocate, thus acting as a cheater.
- Mutualism: Both species benefit from the interaction.
Step 2: Evaluating the data.
From the graph, we see that S1 grown alone has a high cell count, and S2 grown alone has a low cell count. However, when S1 and S2 are co-cultured, the cell count of S2 increases dramatically while S1's cell count remains relatively stable. This indicates that S1 benefits from the presence of S2, but S2 benefits from the interaction without contributing to S1's growth. Thus, S2 is acting as a "cheater" by benefiting without providing any benefit to S1.
Step 3: Conclusion.
The interaction between S1 and S2 can best be described as a cooperator-cheater interaction, where S1 is the cooperator, and S2 is the cheater. Therefore, the correct answer is (C).
Quick Tip: In cooperator-cheater interactions, one species benefits from the other's activities without reciprocating, resulting in an imbalance of benefits.
Habitat P has twice the density of resources as habitat Q. Assume that individuals are identical, can move freely, have perfect information about the environment, and compete for resources when they are in a habitat. At equilibrium, which one of the following represents the predicted outcome?
View Solution
Step 1: Understand the dynamics of resource density.
Given that habitat P has twice the resource density as habitat Q, individuals in habitat P will experience more resources and thus can support a larger population. However, as the number of individuals increases in P, the profitability per individual will eventually stabilize, resulting in equal profitability between habitats at equilibrium. This is because, at equilibrium, the profitability per individual depends on the resource density relative to the number of individuals.
Step 2: Analyze the options.
Option (A): Incorrect, while the number of individuals will be higher in P, the profitability per individual will not be higher in P than in Q.
Option (B): Incorrect, the number of individuals will not be the same in both habitats. P will support more individuals due to higher resource density.
Option (C): Correct, habitat P will support more individuals, but the profitability per individual will be the same in both habitats at equilibrium.
Option (D): Incorrect, while the number of individuals will be higher in P, the profitability per individual in Q will not be higher.
Hence, the correct answer is (C).
Quick Tip: In ecological models, when resources are abundant, populations increase, but the profitability per individual typically decreases as the population grows, leading to an equilibrium where profitability per individual is the same across habitats.
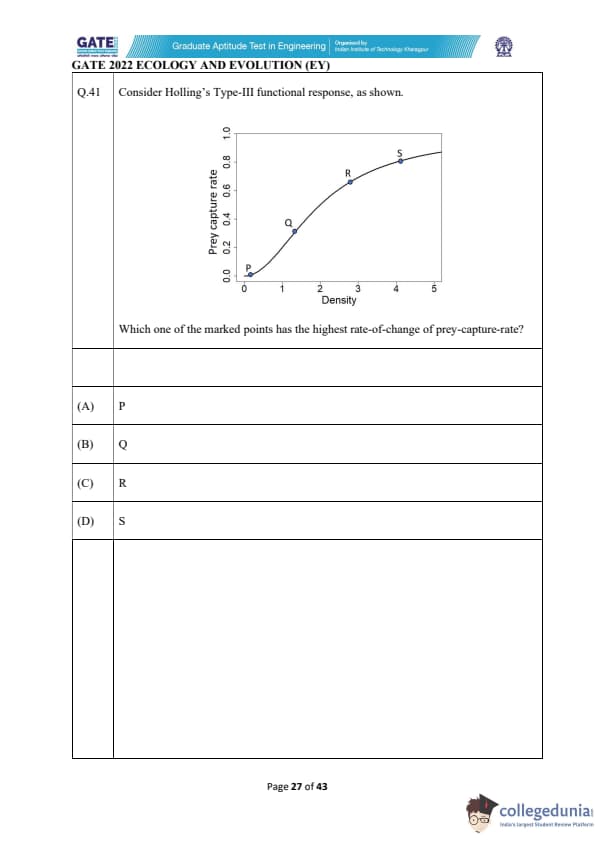
Consider Holling’s Type-III functional response, as shown.
Which one of the marked points has the highest rate-of-change of prey-capture-rate?

View Solution
Step 1: Understanding Holling’s Type-III functional response.
In Holling’s Type-III functional response, the prey capture rate initially increases slowly at low prey density, then more rapidly at intermediate densities, and eventually reaches a plateau at high densities. The rate of change of prey capture rate is highest when the curve has the steepest slope, which typically occurs at the point where the curve changes most significantly.
Step 2: Evaluating the points.
- Point P: The rate of change is highest at the beginning of the curve, where the prey capture rate increases rapidly. This corresponds to a steep slope at low density.
- Point Q: The slope is still positive but starts to level off as the prey capture rate increases more gradually.
- Point R: The curve is near the inflection point, where the increase in prey capture rate starts to slow down.
- Point S: At this point, the prey capture rate has plateaued and is no longer increasing, so the rate of change is zero.
Step 3: Conclusion.
The highest rate of change of the prey capture rate occurs at Point P, where the curve has the steepest slope. Therefore, the correct answer is (A).
Quick Tip: In Holling’s Type-III functional response, the highest rate of change occurs at the steepest part of the curve, typically at low to intermediate prey densities.
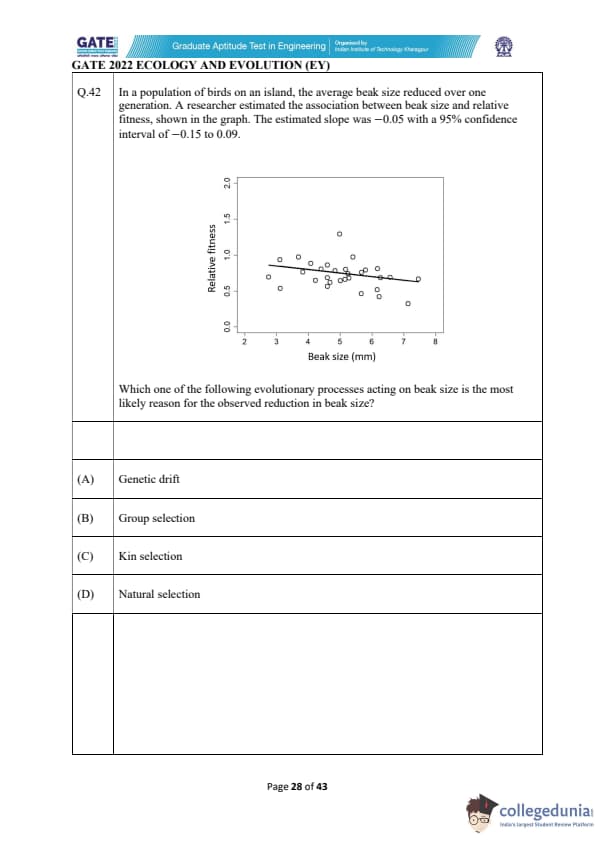
In a population of birds on an island, the average beak size reduced over one generation. A researcher estimated the association between beak size and relative fitness, shown in the graph. The estimated slope was \(-0.05\) with a 95% confidence interval of \(-0.15\) to \(0.09\).

View Solution
Step 1: Understand the context of the graph.
The graph shows a negative association between beak size and relative fitness, meaning that smaller beak sizes may confer higher fitness. The slope of \(-0.05\) indicates a weak negative correlation, but with a confidence interval that includes zero, suggesting the effect could be small or negligible.
Step 2: Evaluate the evolutionary processes.
Option (A): Genetic drift is the most likely cause of the observed reduction in beak size. Genetic drift can lead to random changes in traits, including a decrease in beak size, especially in small populations.
Option (B): Group selection is not a likely explanation in this context, as the focus is on individual fitness rather than the group level.
Option (C): Kin selection could involve relatedness but does not directly explain the observed reduction in beak size.
Option (D): Natural selection would typically result in an adaptive change in beak size, but the confidence interval suggests the reduction might not be strongly linked to fitness, making genetic drift more likely.
Hence, the correct answer is (A).
Quick Tip: Genetic drift can cause random changes in traits, especially in small populations, leading to changes such as a reduction in beak size.
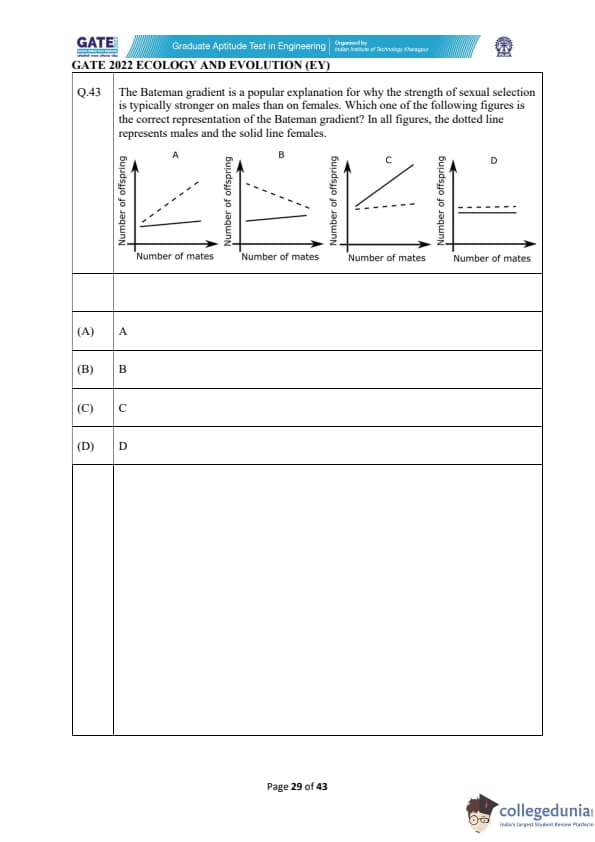
The Bateman gradient is a popular explanation for why the strength of sexual selection is typically stronger on males than on females. Which one of the following figures is the correct representation of the Bateman gradient? In all figures, the dotted line represents males and the solid line females.

View Solution
Step 1: Understanding the Bateman gradient.
The Bateman gradient refers to the relationship between the number of mates and the number of offspring produced, which typically shows a stronger increase for males than for females. This suggests that sexual selection, which drives increased mating success, generally has a greater effect on males.
Step 2: Explanation of the figures.
- (A) In figure A, males (represented by the dotted line) show a sharp increase in the number of offspring with an increasing number of mates, while females (represented by the solid line) show a much more modest increase, which is the classic representation of the Bateman gradient.
- (B) In figure B, the number of offspring increases for both males and females, but the gradient is similar for both sexes, which does not represent the Bateman gradient.
- (C) In figure C, the increase in offspring for females is too steep, which does not match the expected relationship for the Bateman gradient.
- (D) In figure D, the dotted line for males shows a flat slope, which is incorrect for the Bateman gradient, where we expect males to benefit more from multiple mates.
Step 3: Conclusion.
The correct answer is (A), as it accurately depicts the Bateman gradient with a steep slope for males and a relatively shallow slope for females.
Quick Tip: The Bateman gradient illustrates that sexual selection is usually stronger in males than in females, with males benefiting more from increasing their number of mates.
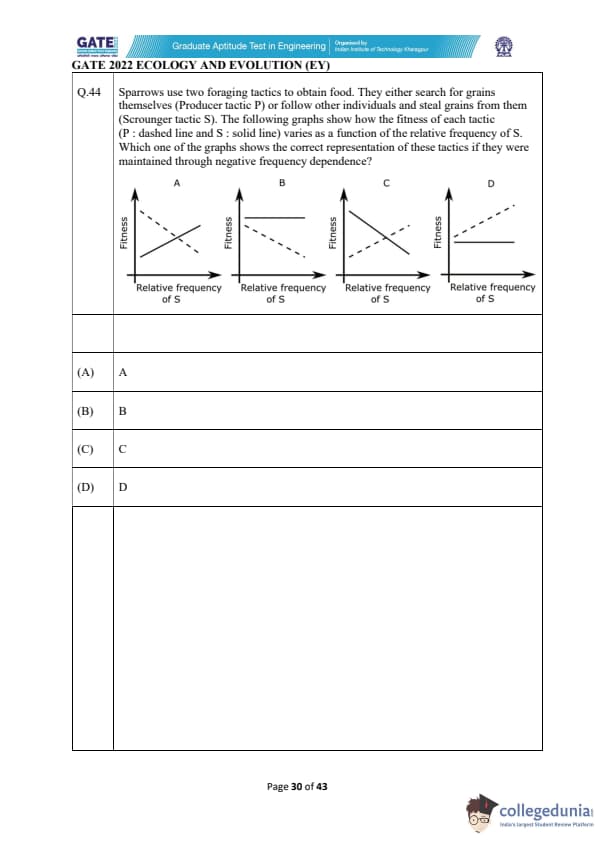
Sparrows use two foraging tactics to obtain food. They either search for grains themselves (Producer tactic P) or follow other individuals and steal grains from them (Scrounger tactic S). The following graphs show how the fitness of each tactic (P : dashed line and S : solid line) varies as a function of the relative frequency of S. Which one of the graphs shows the correct representation of these tactics if they were maintained through negative frequency dependence?
View Solution
N/A Quick Tip: In negative frequency-dependent selection, the fitness of a trait decreases as it becomes more common, while rarer traits are favored.
Some lizard species show positive allometry in head width, with larger individuals investing disproportionately more in musculature leading to wider heads. To test for positive allometry in a study population, a researcher measures body size and head width for 100 individuals and fits a straight line to a log-log plot of these two traits. Which one of the following estimated values of the slope indicates support for positive allometry?
View Solution
Step 1: Understanding positive allometry.
Positive allometry occurs when larger individuals invest more in a particular trait than smaller individuals. This results in the trait growing faster than body size. In a log-log plot, the slope represents the ratio of growth rates between body size and the trait.
Step 2: Interpreting the slope.
- A slope of 0 would indicate no relationship between body size and the trait.
- A slope of 0.5 would suggest a sublinear relationship, meaning the trait grows slower than body size.
\
- A slope of 1 indicates an isometric relationship, meaning the trait grows at the same rate as body size.
- A slope greater than 1 (such as 1.5) indicates positive allometry, where the trait grows faster than body size.
Step 3: Conclusion.
The correct answer is (D) 1.5, as it indicates positive allometry, with the trait growing disproportionately faster than body size. Quick Tip: Positive allometry is indicated by a slope greater than 1 in a log-log plot of body size vs. trait size.
A team of ecologists laid 100 plots of 50 m \(\times\) 50 m in a forest and counted the number of individuals of a tree species in each plot. They then calculated the mean and variance of the number of individuals per plot. If trees are randomly distributed, then which one of the following relationships between the variance and mean is expected?
View Solution
Step 1: Understanding the distribution of trees.
For randomly distributed trees, the number of individuals per plot follows a Poisson distribution. In a Poisson distribution, the variance is equal to the mean. This implies that for random distribution, the variance and mean of the number of individuals per plot will be equal.
Step 2: Interpreting the options.
- (A) Variance \(>\) mean: This would occur in situations of overdispersion, but it is not expected in a random distribution.
\
- (B) Variance < mean: This would indicate underdispersion, which is not typical of random distributions.
- (C) Variance = mean: This is the characteristic relationship for a Poisson distribution, where the variance equals the mean.
- (D) Variance is independent of the mean: This would not apply in this case because in a Poisson distribution, the variance is directly tied to the mean.
Step 3: Conclusion.
The correct answer is (C) Variance = mean, as expected for a random distribution of trees in the plots. Quick Tip: In a Poisson distribution, variance equals the mean, which applies to random distributions in ecological studies.
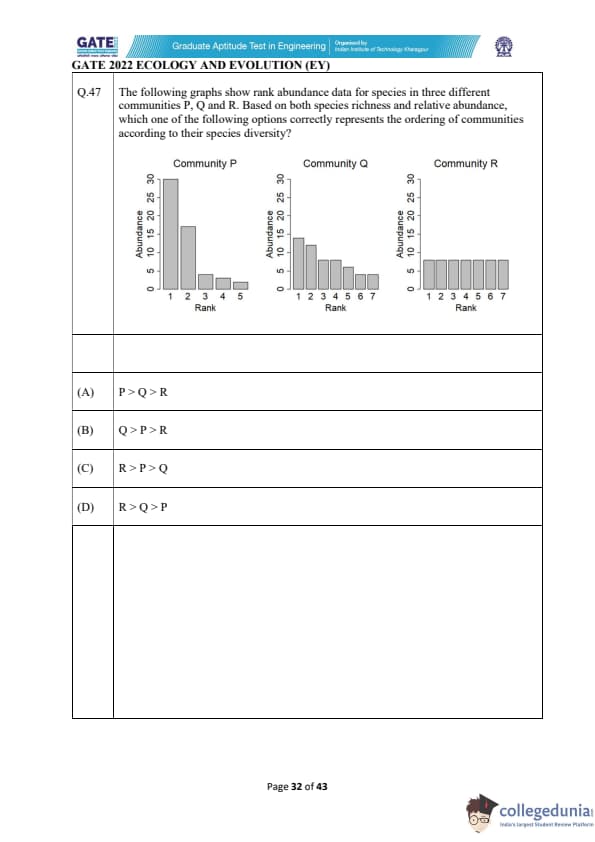
The following graphs show rank abundance data for species in three different communities P, Q and R. Based on both species richness and relative abundance, which one of the following options correctly represents the ordering of communities according to their species diversity?

View Solution
Step 1: Understanding the rank abundance curve.
The rank abundance curve is a tool used to represent species diversity within a community. The curve plots species rank on the x-axis and species abundance on the y-axis. In this case, the graphs show how the abundance of species varies in communities P, Q, and R. The position and slope of the curve provide insight into species richness (the number of species) and the evenness of species distribution.
Step 2: Analyzing the community data.
- Community P: This community has a low species richness (with fewer species represented), and the abundance of the most dominant species is significantly higher than that of other species. This indicates lower species evenness, where one species dominates.
- Community Q: This community has moderate species richness, and the species are more evenly distributed compared to community P, though there is still a significant difference in the abundance of the dominant species and others.
- Community R: Community R has the highest species richness (with more species) and the most even distribution of species abundance, as all species have relatively similar abundances. This indicates the highest species diversity.
Step 3: Conclusion.
Based on both species richness and relative abundance, Community R has the highest diversity, followed by Community Q, and finally Community P, which has the least diversity. Therefore, the correct answer is (D) R > Q > P.
Quick Tip: A more even distribution of species abundance and a higher number of species indicate greater species diversity in a community.
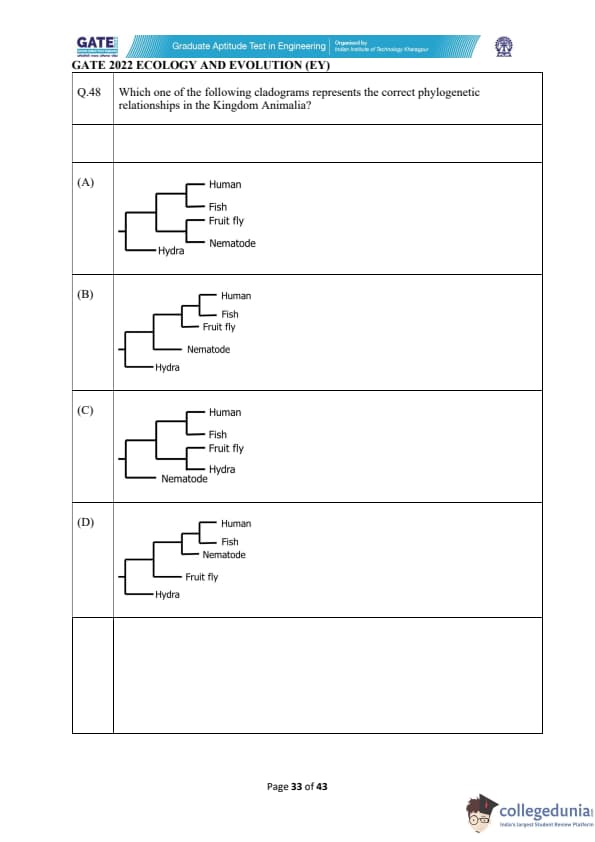
Which one of the following cladograms represents the correct phylogenetic relationships in the Kingdom Animalia?

View Solution
Step 1: Understand the phylogenetic relationships.
The correct cladogram should reflect the evolutionary relationships among the species. Humans are more closely related to fish and fruit fly (as vertebrates), and Hydra is more distantly related to these species. Nematodes are more distantly related to the other species, making the order of the tree important.
Step 2: Evaluate the options.
Option (A): Correct, this cladogram correctly places Hydra as a separate lineage from the vertebrates, while showing the closer evolutionary relationship between fish and fruit fly.
Option (B): Incorrect, the relationships do not reflect the true phylogeny of the species.
Option (C): Incorrect, the placement of the organisms does not match their actual evolutionary distances.
Option (D): Incorrect, the cladogram does not reflect the accurate relationships among these species.
Hence, the correct answer is (A).
Quick Tip: Cladograms represent evolutionary relationships based on shared ancestry and characteristics. The correct tree structure follows the actual phylogeny of the species.
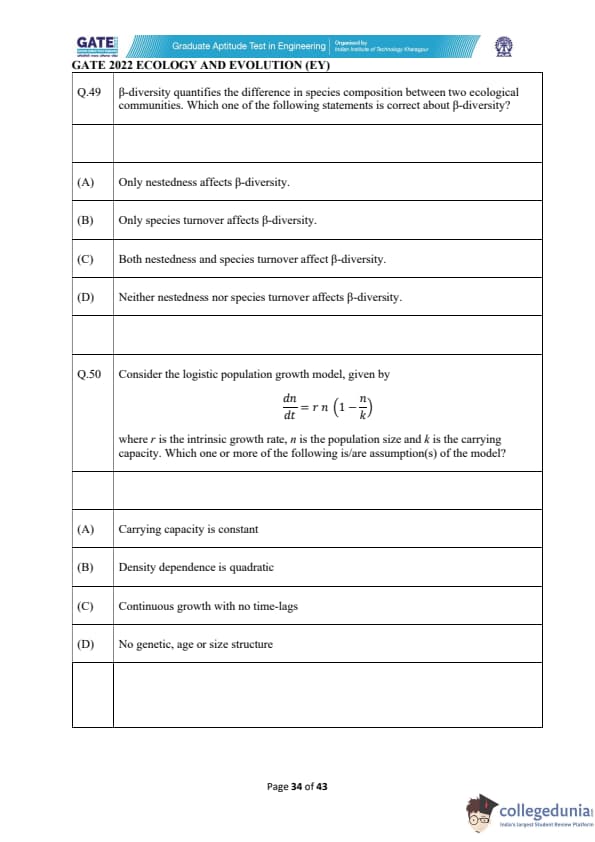
\(\beta\)-diversity quantifies the difference in species composition between two ecological communities. Which one of the following statements is correct about \(\beta\)-diversity?
View Solution
Step 1: Understanding \(\beta\)-diversity.
\(\beta\)-diversity refers to the variation in species composition between two ecological communities. It is determined by both nestedness (the sharing of species between communities) and species turnover (the replacement of species between communities).
Step 2: Explanation of each option.
(A) Nestedness refers to the pattern where species in one community are a subset of species in another community. However, \(\beta\)-diversity also involves species turnover.
(B) Species turnover is a key factor in \(\beta\)-diversity but does not alone account for all the variations between communities.
(C) Both nestedness and species turnover are key contributors to \(\beta\)-diversity, making this option correct.
(D) This statement is incorrect as both nestedness and species turnover contribute to \(\beta\)-diversity.
Step 3: Conclusion.
The correct answer is (C), as both nestedness and species turnover affect \(\beta\)-diversity.
Quick Tip: \(\beta\)-diversity is determined by both nestedness and species turnover, which together quantify the difference in species composition between communities.
Consider the logistic population growth model, given by
\[ \frac{dn}{dt} = r n \left( 1 - \frac{n}{k} \right) \]
where \(r\) is the intrinsic growth rate, \(n\) is the population size, and \(k\) is the carrying capacity. Which one or more of the following is/are assumption(s) of the model?
View Solution
Step 1: Understanding the logistic model assumptions.
The logistic growth model assumes that the population grows continuously, without time-lags, and that the carrying capacity (\(k\)) remains constant. The model also assumes that density dependence is linear and does not account for genetic, age, or size structure.
Step 2: Explanation of each option.
(A) Carrying capacity (\(k\)) is assumed to be constant in the logistic model.
(B) The logistic model assumes linear density dependence, not quadratic.
(C) The logistic model assumes continuous growth with no time-lags, meaning population growth responds immediately to changes in population size.
(D) The logistic model does not include genetic, age, or size structure, assuming a homogeneous population.
Step 3: Conclusion.
The correct answers are (A), (C), and (D) as they represent the assumptions of the logistic growth model.
Quick Tip: The logistic population growth model assumes continuous growth, a constant carrying capacity, and no structure in terms of age, size, or genetics.
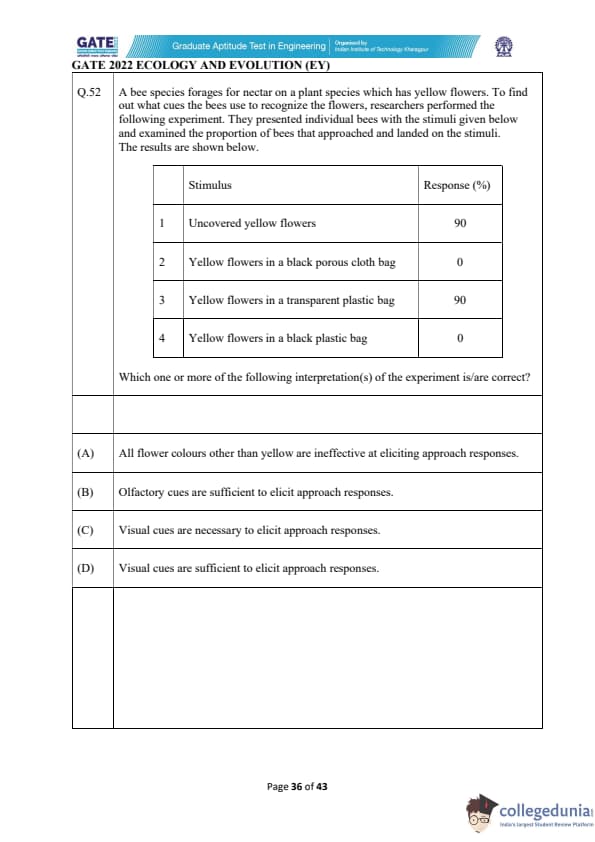
A bee species forages for nectar on a plant species which has yellow flowers. To find out what cues the bees use to recognize the flowers, researchers performed the following experiment. They presented individual bees with the stimuli given below and examined the proportion of bees that approached and landed on the stimuli. The results are shown below.

Which one or more of the following interpretation(s) of the experiment is/are correct?
View Solution
N/A Quick Tip: Bees rely on visual cues, particularly the colour of flowers, to identify and approach them. The presence of visual cues, such as the colour yellow, is key to eliciting approach responses.
Which one or more of the following reason(s) explain(s) why whales use low frequencies (infrasound) for mate-finding and high frequencies (ultrasound) for hunting prey?
View Solution
Step 1: Understanding sound propagation.
Whales use different frequencies for different purposes based on how sound travels through water. Low frequencies (infrasound) travel long distances with minimal distortion, making them useful for communication and mate-finding over long distances. High frequencies (ultrasound), on the other hand, scatter more but provide higher resolution, making them ideal for hunting prey as they allow whales to detect smaller, closer objects.
Step 2: Analyzing the options.
- (A) High frequencies transmit further without distortion than low frequencies: This is incorrect because low frequencies transmit further with less distortion compared to high frequencies.
- (B) High frequencies scatter more and allow for high-resolution information: This is correct in terms of high-frequency characteristics, but it doesn't explain why whales use both low and high frequencies for different purposes.
- (C) Low frequencies transmit further without distortion than high frequencies: This is correct because low frequencies can travel further with less distortion, making them ideal for long-distance communication.
- (D) Low frequencies scatter more and allow for high-resolution information: This is also correct, as low frequencies can scatter more, enabling better detection of prey in high-resolution detail.
Step 3: Conclusion.
The correct answers are (C) and (D), as they explain the different benefits of low frequencies (long-range transmission with minimal distortion and high-resolution scattering for prey detection). Quick Tip: Low frequencies are better for long-range communication, while high frequencies offer more detailed resolution for close-range activities like hunting.
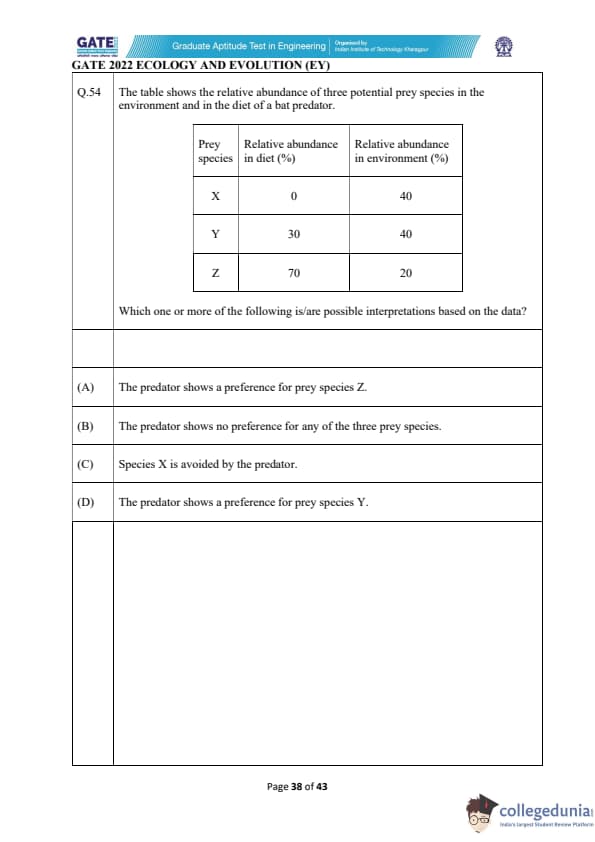
The table shows the relative abundance of three potential prey species in the environment and in the diet of a bat predator.

View Solution
Step 1: Analyzing the data.
The table provides information about the relative abundance of three prey species (X, Y, and Z) in the diet of a bat predator, as well as their relative abundance in the environment. The key to understanding predator preferences is to compare the proportion of each species in the predator's diet with its relative abundance in the environment.
- Species X: Its relative abundance in the environment is 40%, but it is completely absent from the predator's diet (0% in diet). This suggests that the predator avoids species X.
- Species Y: Its relative abundance in the environment is 40%, and it makes up 30% of the predator's diet. This suggests that species Y is consumed by the predator in proportion to its abundance in the environment, indicating no strong preference or avoidance.
- Species Z: Its relative abundance in the environment is 20%, yet it makes up 70% of the predator's diet. This suggests that the predator shows a strong preference for species Z, as it is being consumed at a much higher rate than expected based on its abundance in the environment.
Step 2: Interpreting the options.
- (A) The predator shows a preference for prey species Z: Correct, as species Z is consumed at a much higher rate (70% in the diet compared to 20% in the environment). This suggests the predator strongly favors species Z.
- (B) The predator shows no preference for any of the three prey species: This is incorrect because species Z is overrepresented in the diet, indicating a preference for it.
- (C) Species X is avoided by the predator: Correct, as species X is not consumed at all, despite its 40% abundance in the environment.
- (D) The predator shows a preference for prey species Y: This is not correct because species Y's relative abundance in the diet is proportionate to its abundance in the environment.
Step 3: Conclusion.
Based on the data, the predator shows a preference for species Z and avoids species X. Therefore, the correct answer is (A) and (C).
Quick Tip: Comparing the relative abundance of prey species in the diet of a predator with their relative abundance in the environment can reveal the predator's preference for or avoidance of certain species.
Which one or more of the following options represent(s) an evolutionary arms race?
View Solution
Step 1: Understand the concept of evolutionary arms race.
An evolutionary arms race occurs when two species continuously evolve adaptations and counteradaptations in response to each other. In the case of prey and predators or hosts and parasites, each species tries to outcompete the other through evolving more effective strategies.
Step 2: Evaluate each option.
Option (A): Correct, snake venom toxin specificity and prey receptor modification is an example of an evolutionary arms race. As snakes evolve more potent venom, prey species evolve better receptors to resist it, and vice versa.
Option (B): Correct, egg discrimination by hosts and brood parasite egg coloration is an example of a coevolutionary interaction, where hosts evolve strategies to detect parasitic eggs, and parasites evolve to match the host's egg coloration.
Option (C): Incorrect, cooperative breeding and offspring survival rate are more of a cooperative strategy and do not reflect an arms race where one species evolves to counteract another.
Option (D): Correct, crypsis in prey and visual acuity in predators form an arms race where prey evolve better camouflage, and predators evolve better vision to detect them.
Hence, the correct answers are (A), (B), and (D).
Quick Tip: In an evolutionary arms race, species evolve traits that counteract each other's adaptations, often leading to a cycle of mutual adaptation. Examples include predator-prey interactions and host-parasite coevolution.
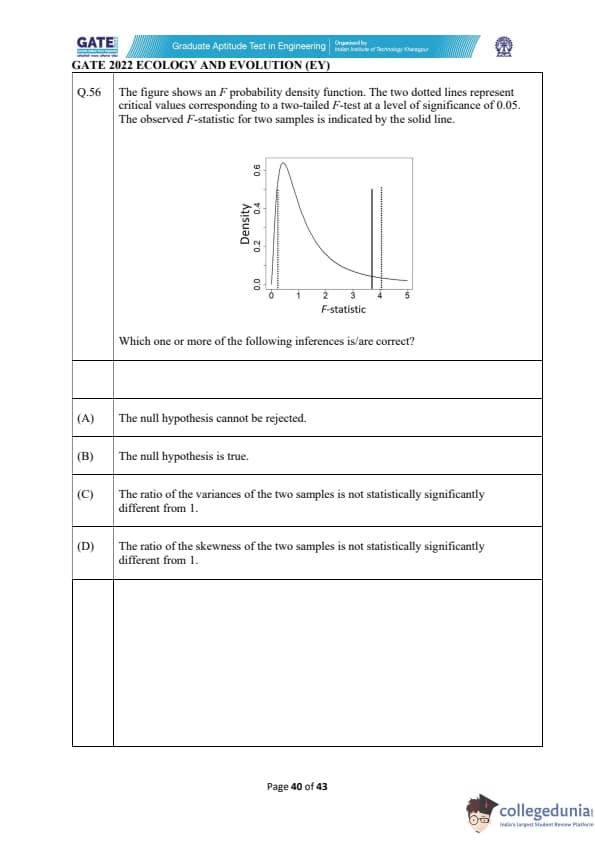
The figure shows an \(F\) probability density function. The two dotted lines represent critical values corresponding to a two-tailed \(F\)-test at a level of significance of 0.05. The observed \(F\)-statistic for two samples is indicated by the solid line.

View Solution
Step 1: Understanding the figure.
The figure shows an \(F\)-distribution with the observed \(F\)-statistic marked by the solid line. The two dotted vertical lines represent the critical values corresponding to a significance level of 0.05. This indicates a two-tailed \(F\)-test where we fail to reject the null hypothesis if the observed \(F\)-statistic falls between these two critical values.
Step 2: Interpretation of the options.
(A) The observed \(F\)-statistic lies within the range defined by the two critical values, meaning the null hypothesis cannot be rejected. This is the correct inference.
(B) The null hypothesis being true refers to the assumption that there is no significant difference in variances. Since the observed \(F\)-statistic does not exceed the critical values, this is not the case.
(C) This option suggests the ratio of variances is not statistically significantly different from 1, which is correct because the observed \(F\)-statistic falls within the critical range.
(D) Skewness does not directly affect the interpretation of the \(F\)-test, so the ratio of skewness being not significantly different from 1 is not a relevant inference here.
Step 3: Conclusion.
The correct answers are (A) and (C), as they align with the interpretation of the \(F\)-distribution and the observed \(F\)-statistic.
Quick Tip: In an \(F\)-test, the null hypothesis is rejected if the observed \(F\)-statistic exceeds the critical value. If it lies within the critical range, we cannot reject the null hypothesis.
Which one or more of the following conditions can lead to an increase in tree densities in tropical savannas?
View Solution
N/A Quick Tip: Fire suppression, increased rainfall, and higher CO2 levels can all lead to increased tree densities in savannas by reducing the limitations on tree growth.
Gene conversion can lead to which one or more of the following evolutionary outcomes?
View Solution
N/A Quick Tip: Gene conversion helps to homogenize genetic sequences, which can result in concerted evolution, increased expression, and increased sequence similarity among gene copies.
If the observed heterozygosity at a locus is 0.6, which one or more of the following could produce this outcome?
\textbf{Correct Answer:} (B) A locus under selection with two alleles
View Solution
Step 1: Understanding heterozygosity.
Heterozygosity refers to the proportion of individuals in a population that are heterozygous at a given locus. A value of 0.6 indicates a relatively high level of genetic diversity at the locus.
Step 2: Analyzing the options.
- (A) A neutral locus with three alleles: A locus with three alleles can result in higher heterozygosity, and a value of 0.6 is reasonable for such a locus.
- (B) A locus under selection with two alleles: Selection can maintain or increase heterozygosity at a locus, especially if heterozygous individuals have a fitness advantage. A heterozygosity of 0.6 is feasible here.
- (C) A neutral locus with two alleles: This could result in lower heterozygosity, typically around 0.5 for a two-allele system in Hardy-Weinberg equilibrium. It would be less likely to result in 0.6 heterozygosity.
- (D) A locus under selection with one allele: A single allele would result in no heterozygosity at all, so this option is not feasible.
\
Step 3: Conclusion.
The correct answers are (A) and (B), as both can explain the observed heterozygosity of 0.6. Quick Tip: Higher heterozygosity can be maintained at a locus with multiple alleles or under selection, especially if heterozygous individuals have a fitness advantage.
Which one or more of the following reasons has/have been invoked to explain high species diversity in the tropics?
\textbf{Correct Answer:} (B) Higher speciation rates in the tropics
\textbf{Correct Answer:} (C) Lower extinction rates in the tropics
View Solution
Step 1: Understanding species diversity.
The tropics are known for their high species diversity, and several factors contribute to this phenomenon, including a large area, higher speciation rates, and lower extinction rates.
Step 2: Analyzing the options.
- (A) Greater area in the tropics: The larger area available in the tropics allows for more niches and habitats, supporting higher biodiversity.
- (B) Higher speciation rates in the tropics: The tropics often have higher rates of speciation due to stable climates and complex ecosystems, which foster diversification.
- (C) Lower extinction rates in the tropics: The stable, favorable climate in the tropics also contributes to lower extinction rates, further promoting species diversity.
- (D) The tropics are closer to the sun: While the proximity to the sun does contribute to a stable climate, it is not the direct cause of higher species diversity. The primary factors are the larger area and the higher speciation rates.
Step 3: Conclusion.
The correct answers are (A), (B), and (C), as these factors have all been identified as contributing to the high species diversity observed in the tropics. Quick Tip: Species diversity is driven by a combination of factors including greater area, higher speciation rates, and lower extinction rates in tropical regions.
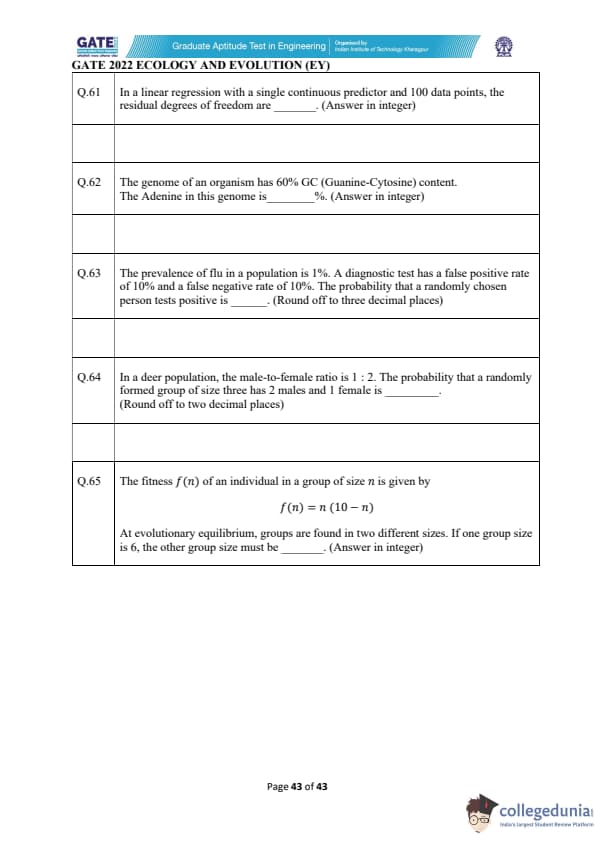
In a linear regression with a single continuous predictor and 100 data points, the residual degrees of freedom are ________ (Answer in integer).
View Solution
In a linear regression model, the residual degrees of freedom are calculated as: \[ Residual degrees of freedom = n - p - 1, \]
where \( n \) is the number of data points and \( p \) is the number of predictors.
Here, \( n = 100 \) and \( p = 1 \) (since there is a single continuous predictor). Thus, the residual degrees of freedom are: \[ Residual degrees of freedom = 100 - 1 - 1 = 98. \]
Thus, the residual degrees of freedom are \( 98 \). Quick Tip: For simple linear regression, the residual degrees of freedom are calculated as \( n - 2 \), where \( n \) is the number of data points.
The genome of an organism has 60% GC (Guanine-Cytosine) content. The Adenine in this genome is ________% (Answer in integer).
View Solution
In a DNA molecule, the content of Adenine (A) is equal to the content of Thymine (T), and the content of Guanine (G) is equal to the content of Cytosine (C). This is due to base pairing. Therefore, if the GC content is 60%, the AT content must be 40%, as \( A + T = 40% \). Since the amounts of Adenine and Thymine are equal, the content of Adenine is: \[ Adenine content = \frac{40}{2} = 20%. \]
Thus, the Adenine content in the genome is \( 20% \). Quick Tip: In DNA, the sum of the percentages of GC and AT must be 100%. The percentage of Adenine is half of the AT content.
The prevalence of flu in a population is 1%. A diagnostic test has a false positive rate of 10% and a false negative rate of 10%. The probability that a randomly chosen person tests positive is ________ (Round off to three decimal places).
View Solution
We can use Bayes' Theorem to solve this problem. Let:
- \( P(Flu) = 0.01 \) (prevalence of flu),
- \( P(No Flu) = 0.99 \) (probability of not having the flu),
- \( P(Positive \mid Flu) = 0.9 \) (probability of testing positive given flu, i.e., 1 - false negative rate),
- \( P(Positive \mid No Flu) = 0.1 \) (false positive rate).
The probability of testing positive, \( P(Positive) \), is: \[ P(Positive) = P(Positive \mid Flu) P(Flu) + P(Positive \mid No Flu) P(No Flu). \]
Substituting the known values: \[ P(Positive) = (0.9)(0.01) + (0.1)(0.99) = 0.009 + 0.099 = 0.108. \]
Thus, the probability that a randomly chosen person tests positive is: \[ \boxed{0.108}. \] Quick Tip: Bayes' Theorem helps in calculating conditional probabilities like this one. Remember to use the prevalence and false positive/negative rates correctly in the formula.
In a deer population, the male-to-female ratio is 1 : 2. The probability that a randomly formed group of size three has 2 males and 1 female is ________ (Round off to two decimal places).
View Solution
Given the male-to-female ratio of 1 : 2, the probability of selecting a male is: \[ P(Male) = \frac{1}{3}, \quad P(Female) = \frac{2}{3}. \]
The problem asks for the probability of forming a group of 3 with exactly 2 males and 1 female. This is a binomial probability problem, where we calculate the probability for 2 males and 1 female in 3 selections. The formula is: \[ P(2 Males, 1 Female) = \binom{3}{2} \left( \frac{1}{3} \right)^2 \left( \frac{2}{3} \right)^1. \]
The binomial coefficient \( \binom{3}{2} \) is 3, so: \[ P(2 Males, 1 Female) = 3 \times \left( \frac{1}{3} \right)^2 \times \frac{2}{3} = 3 \times \frac{1}{9} \times \frac{2}{3} = \frac{6}{27} = 0.222. \]
Thus, the probability is: \[ \boxed{0.22}. \] Quick Tip: For problems involving a fixed number of successes in a given number of trials (like selecting males and females), use the binomial distribution to calculate the probability.
The fitness \( f(n) \) of an individual in a group of size \( n \) is given by \[ f(n) = n(10 - n). \]
At evolutionary equilibrium, groups are found in two different sizes. If one group size is 6, the other group size must be ________ (Answer in integer).
View Solution
At evolutionary equilibrium, the fitness for the two group sizes must be equal. Therefore, we have: \[ f(6) = f(n), \]
where \( n \) is the other group size. First, calculate \( f(6) \): \[ f(6) = 6(10 - 6) = 6 \times 4 = 24. \]
Now, set \( f(n) = 24 \), and solve for \( n \): \[ f(n) = n(10 - n) = 24. \]
This simplifies to: \[ n(10 - n) = 24, \] \[ 10n - n^2 = 24, \] \[ n^2 - 10n + 24 = 0. \]
Solving this quadratic equation: \[ n = \frac{10 \pm \sqrt{10^2 - 4 \times 1 \times 24}}{2 \times 1} = \frac{10 \pm \sqrt{100 - 96}}{2} = \frac{10 \pm \sqrt{4}}{2} = \frac{10 \pm 2}{2}. \]
Thus, \[ n = \frac{10 + 2}{2} = 6 \quad or \quad n = \frac{10 - 2}{2} = 4. \]
Since one group size is already 6, the other group size must be \( 4 \).
Thus, the other group size is \( 4 \). Quick Tip: At evolutionary equilibrium, the fitness values for different group sizes must be equal. Use this condition to solve for the unknown group size.
Quick Links:
GATE 2022 EY Detailed Paper Analysis
A total of 65 questions listed in the question paper of GATE 2022 EY. Each question carried either 1 or 2 marks. Refer to the below-mentioned table, showing the details of questions and carried marks-
| Question Types | Question Frequency | Carried Marks |
|---|---|---|
| No. Of 1 mark MCQs | 24 | 24 |
| No. Of 2 marks MCQs | 19 | 38 |
| No. Of 1 mark MSQs | 6 | 6 |
| No. Of 2 marks MSQs | 11 | 22 |
| No. Of 1 mark NATs | - | - |
| No. Of 2 marks NATs | 5 | 10 |
| Total | 65 | 100 |
- NATs carried the least weightage in GATE 2022 EY
- There were only 5 NAT questions, each carrying 2 marks, appeared in GATE 2022 EY
- The General Aptitude section was rated easy, while the core EY section was rated moderate to tough
Also Check:
GATE 2022 EY: Exam Pattern and Marking Scheme
- GATE 2022 EY asked both MCQs and NATs. It was held online via CBT mode
- As per the specified marking scheme by IIT Delhi, from the final score, ⅓ and ⅔ marks would be reduced for each wrong MCQ carried 1 and 2 marks
- Wrong attempted NATs were not supposed to bring any kind of deduction in the final achieved marks
GATE Previous Year Question Papers
| GATE 2022 Question Papers | GATE 2021 Question Papers | GATE 2020 Question Papers |
| GATE 2019 Question Papers | GATE 2018 Question Papers | GATE 2017 Question Papers |


Comments