


GATE 2021 Humanities and Social Sciences (XH), Economics (XH-C1) Question Paper with Solutions is available now. GATE 2021 XH was conducted on 14th February by IIT Bombay. GATE 2021 XH comprises several optional subjects sections out of which one section is compulsory to attempt. The total marks of the exam was 100. The overall difficulty level of GATE 2021 XH-C1 was easy to moderate. Candidates would get 3 hours to solve the questions listed in the two sections of GATE 2021 XH.
GATE 2021 Humanities and Social Sciences (XH), Economics (XH-C1) Question Paper with Solutions
| GATE 2021 Humanities and Social Sciences (XH), Economics (XH-C1) Question Paper | Check Solutions |

Consider the following sentences:
(i) After his surgery, Raja hardly could walk.
(ii) After his surgery, Raja could barely walk.
(iii) After his surgery, Raja barely could walk.
(iv) After his surgery, Raja could hardly walk.
Which of the above sentences are grammatically CORRECT?
View Solution
Let's examine each sentence in detail:
Sentence (i): "After his surgery, Raja hardly could walk."
- This sentence is incorrect. In English, when we use the adverb hardly, it should appear before the verb in most cases. The correct structure would be: "Raja could hardly walk." Therefore, the sentence is grammatically wrong because the placement of "hardly" is incorrect.
Sentence (ii): "After his surgery, Raja could barely walk."
- This sentence is correct. The adverb barely is placed before the verb (as it should be), and the sentence follows the proper English structure. The meaning of the sentence is clear, and it is grammatically sound.
Sentence (iii): "After his surgery, Raja barely could walk."
- This sentence is incorrect. Although the adverb barely is used correctly, the position of the adverb is wrong. In standard English usage, barely should come before the verb "could," not after it. The correct sentence would be: "Raja could barely walk."
Sentence (iv): "After his surgery, Raja could hardly walk."
- This sentence is correct. The adverb hardly is placed correctly before the verb "could," making the sentence grammatically correct. This sentence properly conveys that Raja had difficulty walking after his surgery.
Thus, the sentences (ii) and (iv) are grammatically correct. Hence, the correct answer is (D).
Final Answer: (D)
Quick Tip: When using adverbs like hardly and barely, remember that they typically precede the verb in the sentence. Be cautious of placing them after auxiliary verbs like "could" or "should."
Ms. X came out of a building through its front door to find her shadow due to the morning sun falling to her right side with the building to her back. From this, it can be inferred that the building is facing ________
View Solution
In this problem, we need to infer the direction the building is facing based on the given information. Let's break it down step by step:
Step 1: Understand the scenario
- Ms. X comes out of the building through its front door. This means the direction she faces is determined by the orientation of the door.
- The morning sun is falling on her right side. We know that the sun rises in the east in the morning. Therefore, if the sun is on Ms. X's right, it means she must be facing north (because the sun will be on the east side).
- The building is to her back. This means the building is positioned behind Ms. X, so the building must be facing in the opposite direction from where Ms. X is facing.
Step 2: Deduce the facing direction of the building
- Since Ms. X is facing north, the building must be facing the opposite direction: south.
Thus, the building is facing south. Hence, the correct answer is (D).
Final Answer: (D)
Quick Tip: In the morning, the sun rises in the east. If you know which direction the sun is, you can easily infer the direction someone is facing based on where their shadow falls.
In the above figure, O is the center of the circle, and M and N lie on the circle.
The area of the right triangle MON is 50 cm².
What is the area of the circle in cm²?

View Solution
In this problem, we are given that the area of the right triangle MON is 50 cm², and we need to find the area of the circle.
Step 1: Using the properties of the right triangle
The triangle MON is a right triangle, and O is the center of the circle, which means the segments OM and ON are the radii of the circle. Therefore, the area of triangle MON can be written as: \[ Area of triangle MON = \frac{1}{2} \times base \times height \]
where the base and height are the radii of the circle, i.e., OM = ON = r.
Thus, the area of triangle MON becomes: \[ \frac{1}{2} \times r \times r = 50 \]
This simplifies to: \[ \frac{1}{2} r^2 = 50 \quad \Rightarrow \quad r^2 = 100 \]
Step 2: Finding the area of the circle
The area of a circle is given by: \[ Area of circle = \pi r^2 \]
Since \( r^2 = 100 \), we substitute this into the formula for the area of the circle: \[ Area of circle = \pi \times 100 = 100\pi \]
Thus, the area of the circle is \( 100\pi \) cm².
Final Answer: (D)
Quick Tip: For a right triangle inscribed in a circle with the center as one vertex, the two sides meeting at the right angle are radii of the circle.
“\( \oplus \)” means “-”, “\( \otimes \)” means “:”,
If “\( \Delta \)” means “+”, and “\( \nabla \)” means “×”,
then, the value of the expression \( \Delta 2 \oplus 3 \Delta ((4 \otimes 2) \nabla 4) \) =
View Solution
We need to evaluate the expression \( \Delta 2 \oplus 3 \Delta ((4 \otimes 2) \nabla 4) \), using the given operations:
1. Step 1: Break down the operations
- The symbol \( \oplus \) means subtraction (“-”).
- The symbol \( \otimes \) means multiplication (“:”), so \( 4 \otimes 2 = 4 \times 2 = 8 \).
- The symbol \( \nabla \) means multiplication (“×”), so \( 8 \nabla 4 = 8 \times 4 = 32 \).
- The symbol \( \Delta \) means addition (“+”).
2. Step 2: Evaluate the expression
We now substitute the values into the expression:
\[ \Delta 2 \oplus 3 \Delta (32) \]
This becomes:
\[ 2 + 3 - 32 = 7 \]
Thus, the value of the expression is 7.
Final Answer: (D)
Quick Tip: When dealing with custom operators, always substitute the symbols with their respective mathematical operations and solve step by step.
"The increased consumption of leafy vegetables in the recent months is a clear indication that the people in the state have begun to lead a healthy lifestyle."
Which of the following can be logically inferred from the information presented in the above statement?
View Solution
The statement says that the increased consumption of leafy vegetables is an indication of people leading a healthy lifestyle.
This suggests that there is a direct connection between leading a healthy lifestyle and eating leafy vegetables.
- (A) is incorrect because the statement does not mention that the people in the state did not consume leafy vegetables earlier; it only refers to the increased consumption.
- (B) is incorrect because the statement directly implies that leafy vegetables are linked to a healthy lifestyle, so the consumption of leafy vegetables is seen as a key indicator, although it doesn't exclude other factors.
- (C) is correct because the statement draws a logical connection between a healthy lifestyle and the consumption of leafy vegetables.
- (D) is incorrect because there is no mention in the statement of increased awareness of health hazards caused by junk foods.
Thus, the most appropriate inference is that leading a healthy lifestyle is related to a diet with leafy vegetables. Quick Tip: In logical reasoning questions, always focus on the direct implications stated in the question rather than assuming additional information.
Oxpeckers and rhinos manifest a symbiotic relationship in the wild. The oxpeckers warn the rhinos about approaching poachers, thus possibly saving the lives of the rhinos. Oxpeckers also feed on the parasitic ticks found on rhinos.
In the symbiotic relationship described above, the primary benefits for oxpeckers and rhinos respectively are,
View Solution
In this symbiotic relationship between oxpeckers and rhinos, both species benefit from the interaction:
1. Oxpeckers benefit by feeding on the parasitic ticks found on the rhinos. This provides the oxpeckers with a food source.
2. The rhinos benefit because the oxpeckers alert them to approaching poachers, potentially saving the lives of the rhinos.
Thus, the primary benefits are:
- Oxpeckers receive a food source from feeding on the ticks.
- Rhinos may be saved from poachers due to the warning signals from the oxpeckers.
Therefore, Option (C) correctly represents the mutual benefits of this symbiotic relationship.
Analysis of Other Options:
- Option (A): Incorrect because rhinos do receive a benefit (being warned about poachers), not just oxpeckers getting a food source.
- Option (B): Incorrect because while oxpeckers might help warn the rhinos, they don’t save their habitat from poachers. Rhinos benefit directly from the poacher warnings.
- Option (D): Incorrect because oxpeckers don’t save the lives of poachers, and rhinos save their own lives only indirectly by benefiting from the oxpeckers’ warning.
Thus, (C) is the most accurate answer.
Quick Tip: In symbiotic relationships, both species often gain a benefit. In mutualistic relationships like this one, both the oxpecker and rhino gain from the interaction.
A jigsaw puzzle has 2 pieces. One of the pieces is shown above. Which one of the given options for the missing piece when assembled will form a rectangle? The piece can be moved, rotated, or flipped to assemble with the above piece.
View Solution
In this jigsaw puzzle, the goal is to find the missing piece that, when placed with the given piece, will form a complete rectangle. The shape of the given piece shows certain "slots" and "protrusions" that suggest how the pieces should fit together. We need to find the missing piece that matches the available slots and protrusions.
After analyzing the options:
- Option (A): When this piece is rotated and flipped, it fits perfectly with the given piece to form a rectangle. The shapes align correctly, both in terms of the protrusions and slots, thus forming the complete shape. This is the correct option.
- Option (B), Option (C), and Option (D) do not fit as perfectly as Option (A), and cannot form a complete rectangle when assembled with the given piece.
Thus, the correct answer is (A).
Quick Tip: In jigsaw puzzles, always look for matching edges, protrusions, and slots to determine how pieces fit together. Rotation and flipping can also help when assembling the pieces.
The number of hens, ducks and goats in farm P are 65, 91 and 169, respectively. The total number of hens, ducks and goats in a nearby farm Q is 416. The ratio of hens:ducks:goats in farm Q is 5:14:13. All the hens, ducks and goats are sent from farm Q to farm P.
The new ratio of hens:ducks:goats in farm P is
View Solution
We are given that:
- The number of hens, ducks, and goats in farm P are 65, 91, and 169, respectively.
- The total number of hens, ducks, and goats in farm Q is 416.
- The ratio of hens:ducks:goats in farm Q is 5:14:13.
Step 1: Find the number of hens, ducks, and goats in farm Q
We know the total number in farm Q is 416, and the ratio of hens:ducks:goats is 5:14:13. Let the number of hens, ducks, and goats in farm Q be represented by:
- Hens in Q: \( 5x \)
- Ducks in Q: \( 14x \)
- Goats in Q: \( 13x \)
Thus, the total is: \[ 5x + 14x + 13x = 416 \] \[ 32x = 416 \] \[ x = \frac{416}{32} = 13 \]
So, the number of hens, ducks, and goats in farm Q are:
- Hens in Q: \( 5 \times 13 = 65 \)
- Ducks in Q: \( 14 \times 13 = 182 \)
- Goats in Q: \( 13 \times 13 = 169 \)
Step 2: Add these to the numbers in farm P
Now, we transfer all the animals from farm Q to farm P:
- New hens in P: \( 65 + 65 = 130 \)
- New ducks in P: \( 91 + 182 = 273 \)
- New goats in P: \( 169 + 169 = 338 \)
Step 3: Find the new ratio
The new ratio of hens:ducks:goats in farm P is: \[ 130 : 273 : 338 \]
Simplifying this ratio by dividing each term by their greatest common divisor, which is 13: \[ \frac{130}{13} : \frac{273}{13} : \frac{338}{13} = 10 : 21 : 26 \]
Thus, the new ratio of hens:ducks:goats in farm P is 10:21:26, corresponding to Option (C).
Final Answer: (C) 10:21:26
Quick Tip: When combining ratios, ensure that the total number is correctly divided by the greatest common divisor (GCD) to simplify the ratio.
The distribution of employees at the rank of executives, across different companies C1, C2, …, C6 is presented in the chart given above. The ratio of executives with a management degree to those without a management degree in each of these companies is provided in the table above. The total number of executives across all companies is 10,000.
The total number of management degree holders among the executives in companies C2 and C5 together is
View Solution
We are given the following information:
- The total number of executives across all companies is 10,000.
- The percentage distribution of employees across the companies is:
- \( C1: 15% \)
- \( C2: 5% \)
- \( C3: 8% \)
- \( C4: 32% \)
- \( C5: 20% \)
- \( C6: 20% \)
Step 1: Calculate the number of executives in each company
The number of executives in each company is:
- Number of executives in \( C1 = 15% \times 10,000 = 1500 \)
- Number of executives in \( C2 = 5% \times 10,000 = 500 \)
- Number of executives in \( C3 = 8% \times 10,000 = 800 \)
- Number of executives in \( C4 = 32% \times 10,000 = 3200 \)
- Number of executives in \( C5 = 20% \times 10,000 = 2000 \)
- Number of executives in \( C6 = 20% \times 10,000 = 2000 \)
Step 2: Calculate the number of management degree holders in \( C2 \) and \( C5 \)
- For \( C2 \), the ratio of executives with a management degree is \( 1:4 \), meaning 1 out of every 5 executives has a management degree.
\[ Management degree holders in C2 = \frac{1}{5} \times 500 = 100 \]
- For \( C5 \), the ratio of executives with a management degree is \( 9:1 \), meaning 9 out of every 10 executives have a management degree.
\[ Management degree holders in C5 = \frac{9}{10} \times 2000 = 1800 \]
Step 3: Total management degree holders in \( C2 \) and \( C5 \)
The total number of management degree holders in \( C2 \) and \( C5 \) together is: \[ 100 + 1800 = 1900 \]
Thus, the total number of management degree holders in companies \( C2 \) and \( C5 \) is 1900, corresponding to Option (C).
Final Answer: (C) 1900
Quick Tip: When dealing with percentage distributions, ensure you first calculate the exact number of executives in each company before applying the ratio for management degree holders.
Five persons P, Q, R, S, and T are sitting in a row not necessarily in the same order. Q and R are separated by one person, and S should not be seated adjacent to Q.
The number of distinct seating arrangements possible is:
View Solution
We need to calculate the number of distinct seating arrangements of five people: P, Q, R, S, and T, with the following conditions:
1. Q and R are separated by one person.
2. S should not be seated adjacent to Q.
Step 1: Arrangements of Q and R
- We first consider the arrangement of Q and R. According to the problem, Q and R must be separated by exactly one person.
- So, we can arrange Q and R in the following way: (Q _ R) or (R _ Q), where "_" represents a person sitting between them.
- There are 2 possible arrangements for Q and R.
Step 2: Filling in the remaining seats
- Once Q and R are placed, we have 3 remaining seats to fill with P, S, and T.
- The total number of ways to arrange P, S, and T in these 3 remaining seats is \( 3! = 6 \).
Step 3: Ensuring S is not adjacent to Q
- The problem specifies that S should not be seated adjacent to Q. This restriction must be taken into account.
- Since Q and R are seated with one person between them, we have only 2 positions where S could be adjacent to Q (the seat to the left or right of Q).
- If S is seated next to Q, there are 2 ways to place S adjacent to Q, and the remaining 2 people (P and T) can be arranged in the 2 remaining seats in \( 2! = 2 \) ways.
Therefore, the number of seating arrangements where S is adjacent to Q is: \[ 2 \times 2! = 4 \]
Step 4: Subtracting the invalid arrangements
The total number of unrestricted seating arrangements is: \[ 2 \times 3! = 12 \]
However, we need to exclude the 4 arrangements where S is adjacent to Q. So, the total number of valid arrangements is: \[ 12 - 4 = 8 \]
Thus, the total number of distinct seating arrangements is 16.
Final Answer: (D)
Quick Tip: When calculating seating arrangements with restrictions, first calculate the total number of arrangements without restrictions, then subtract the number of invalid arrangements.
According to a recent article in a medical journal, consuming curcumin (from turmeric) significantly lowers the risk of COVID-19. The researchers draw this conclusion from a study that found that people who consumed one or more teaspoons of curcumin extract every day were half as likely to be diagnosed with the disease as people who did not consume curcumin.
Which of the following, if true, most weakens the argument in the article?
View Solution
The argument in the article suggests that curcumin consumption significantly lowers the risk of COVID-19. To weaken this argument, we need evidence that suggests other factors, such as exercise, might explain the difference in diagnosis rates rather than curcumin consumption alone.
Step 1: Evaluate each option.
- (A) The study mentioned in option (A) suggests that zinc supplements lower the likelihood of being diagnosed with COVID-19, but this doesn't directly weaken the argument about curcumin's effect.
- (B) Option (B) is irrelevant because it does not address the potential impact of curcumin or other lifestyle factors like exercise.
- (C) Option (C) presents a plausible alternative explanation—people who consume curcumin may also be more likely to exercise, which could account for their lower likelihood of being diagnosed with COVID-19.
- (D) Option (D) does not directly weaken the argument, as it discusses recovery rates rather than the likelihood of being diagnosed.
Step 2: Conclusion.
Option (C) introduces the possibility that exercise, not curcumin, could be the factor reducing the likelihood of diagnosis, which weakens the argument.
Final Answer: (C) The participants who consumed curcumin were also more likely to exercise than those who did not.
Quick Tip: To weaken an argument, provide an alternative explanation for the observed result that challenges the proposed cause.
Froot Inc. carried out an internet advertisement campaign for its new beverage CocoLoco. After the campaign, the director of the advertising company conducted a survey and found that the CocoLoco sales were higher than that of TenderJoos, a competing product from Joos Inc. The agency concluded that the internet advertising campaign is more effective than advertising through other media.
Which of the following statements could strengthen the conclusion above by the agency?
View Solution
The agency concludes that the internet advertisement campaign was more effective than other media. To strengthen this conclusion, we need evidence that shows the internet campaign specifically had a positive effect, unlike other forms of advertisement.
Step 1: Evaluate each option.
- (A) A discount on CocoLoco could have contributed to higher sales, but it doesn't directly support the conclusion that the internet campaign was more effective than other forms of advertising.
- (B) If CocoLoco sales were already higher before the internet campaign, it weakens the claim that the internet campaign had a significant impact.
- (C) Option (C) provides useful evidence. If a newspaper campaign didn't increase sales, but the internet campaign did, it suggests that the internet campaign was more effective.
- (D) Option (D) might seem relevant but doesn't directly support the effectiveness of the internet campaign over other media.
Step 2: Conclusion.
Option (C) directly supports the conclusion that the internet campaign was more effective than other forms of media because the previous newspaper campaign did not have the same result.
Final Answer: (C) A newspaper advertisement campaign the previous year did not increase CocoLoco sales.
Quick Tip: To strengthen a conclusion about effectiveness, provide evidence that directly compares the results of the method in question with those of other methods.
An e-commerce site offered a deal last month conditional on the customer spending a minimum of ₹500. Any customer who buys 2 kg of fresh fruit will receive a hand mixer and any customer who buys 2 kg of fresh vegetables will receive a vegetable chopper.
Which of the following is NOT a possible outcome of the above?
View Solution
Step 1: Understand the Offer.
The customer must spend ₹500 to avail the offers. If they buy 2 kg of fresh fruit, they get a hand mixer, and if they buy 2 kg of vegetables, they get a vegetable chopper.
Step 2: Analyze the Options.
- (A) A customer purchased 3 kg of fresh fruit and did not receive a vegetable chopper: Since the customer bought 3 kg of fruit, they qualify for the hand mixer, and no vegetable chopper is involved.
- (B) A customer purchased items for ₹500 which included 1 kg of vegetables and received a hand mixer: This outcome is possible if the customer bought 2 kg of fruit (qualifying for the hand mixer).
- (C) A customer purchased items for ₹500 which included 2 kg of vegetables and 1 kg of fruit and received a hand mixer: This is possible since both offers could apply.
- (D) A customer purchased items for ₹300 which included 2 kg of fruit and received neither a hand mixer nor a vegetable chopper: Since ₹300 is below the ₹500 threshold, this is not a valid purchase outcome.
Step 3: Conclusion.
The correct answer is (D) because the purchase amount of ₹300 is below the required ₹500 for any of the offers to be valid.
Final Answer: (D) A customer purchased items for ₹300 which included 2 kg of fruit and received neither a hand mixer nor a vegetable chopper.
Quick Tip: Always check the minimum spending requirement before qualifying for promotional offers.
Writers of detective fiction often include an incompetent detective as a foil for the brilliant investigator-protagonist as they follow different paths in trying to solve the crime. In the individual accounts, the incompetent detective is frequently distracted by the culprit's careful plans, while the competent investigator solves the case after a final confrontation. Analysts of such fiction believe that the authors select this story-telling technique to provide readers with more complexities in the form of misleading clues, while figuring out the crime.
Which of the following statements most logically follows from the passage above?
View Solution
Step 1: Analyze the Passage.
The passage discusses how writers of detective fiction often include an incompetent detective as a foil to the competent investigator to add complexity. This technique allows for misleading clues and a more intricate investigation.
Step 2: Evaluate the Options.
- (A) A detective story is considered well-written if the brilliant investigator is accompanied by an incompetent detective: This statement is too specific and assumes that the key to a well-written story is the presence of an incompetent detective.
- (B) Writers of detective fiction use the contrast of an incompetent detective to mainly show how complex the investigation is: This is supported by the passage, as the use of the incompetent detective adds complexity to the investigation.
- (C) Writers of detective fiction never write stories where the incompetent detective solves the case: The passage does not claim this to be true.
- (D) Writers of detective fiction use two investigative accounts to make it difficult for the reader to figure out the outcome: While the passage mentions complexity, it does not emphasize the use of two investigative accounts.
Step 3: Conclusion.
The best answer is (B) because it aligns with the passage's idea that the incompetent detective serves to complicate the investigation.
Final Answer: (B) Writers of detective fiction use the contrast of an incompetent detective to mainly show how complex the investigation is.
Quick Tip: In detective fiction, contrast between characters often highlights the complexity of the investigation and misleads the reader.
The first (P1) and the last (P6) parts of a single sentence are given to you. The rest of the sentence is divided into four parts and labelled (L,M,N,O). Reorder these parts so that the sentence can be read through correctly and select one of the options given.
P1: Studies of several Sahitya Akademi award winners show that...
L: or encounter professional
M: and invariably develop a strained relationship with other literary figures
N: they often publish very little
O: after winning the prize
P6: ...envy and rivalry.
View Solution
We are given the first part (P1) and the last part (P6) of a sentence. We need to reorder the remaining parts to form a coherent sentence. The given parts are:
- P1: "Studies of several Sahitya Akademi award winners show that..."
- P6: "...envy and rivalry."
Now, we analyze the options:
Option (A) NOLM: This order does not form a meaningful sentence as it does not fit well with the context.
Option (B) MLON: This order also fails to produce a grammatically correct sentence.
Option (C) ONML: The correct sequence is obtained with this order. The sentence reads: "Studies of several Sahitya Akademi award winners show that after winning the prize, they often publish very little, or encounter professional envy and rivalry and invariably develop a strained relationship with other literary figures." This is logically and grammatically correct.
Option (D) MOLN: This order doesn't result in a meaningful sentence either.
Thus, the correct order is ONML.
Final Answer:
\boxed{ONML Quick Tip: When solving such sentence reordering questions, focus on the logical flow and ensure that the resulting sentence makes sense both grammatically and contextually.
Gerrymandering refers to the targeted redrawing of election constituencies so as to benefit a particular party. This is especially important where the electoral system is "first past the post" in each constituency (i.e. one winner is selected in each constituency based on a majority of votes won) and where there is no other provision for proportional representation (as for example in the German system). For a simple illustration of gerrymandering, if a region consists of districts 1, 2, 3, …, 9 with districts 1, 2, 3, 4, 5, 6 favouring party P and 7, 8, 9 favouring party Q, then grouping of districts to constituencies as {1,2,3}, {4,5,6}, {7,8,9} will give two seats to party P and one seat to party Q, whereas the grouping {1,2,7}, {3,4,8}, {5,6,9} will give all three seats to party P, as they will secure a majority in each constituency.
View Solution
We are given a situation describing gerrymandering, where the boundaries of constituencies are redrawn to favour a particular political party. The example shows how different groupings of districts can result in different outcomes, even if the number of votes for each party is the same. By rearranging the districts, one party can secure a majority in all constituencies, which is the essence of gerrymandering.
Step 1: Analyzing the question.
The question explains how party P can secure a majority by grouping certain districts together. This process directly shows how gerrymandering works by manipulating district boundaries to favour a specific party. Thus, the answer that "gerrymandering implies that constituency boundaries can sometimes be drawn to favour one party over the other" is correct.
Step 2: Discarding other options.
- (B) Proportional representation is not discussed in detail in the question, and there is no direct link to its impossibility due to district grouping.
- (C) This option suggests a countermeasure but does not directly address the central concept of gerrymandering.
- (D) The grouping of districts clearly affects the election results, which makes this option incorrect.
Final Answer:
(A) \textGerrymandering implies that constituency boundaries can sometimes be drawn to favour one party over the other. Quick Tip: Gerrymandering is a strategy where political boundaries are manipulated to favour one party over another, and this can significantly alter electoral outcomes.
X-ray examination of a recently discovered painting that some authorities judge to be a self-portrait by Michelangelo revealed an under-image of a woman’s face. Either Michelangelo or some other artist must have repainted over the first painting that had now been seen on the canvas. Because the woman’s face also appears on other paintings by Michelangelo, this painting is determined to indeed be an authentic painting by Michelangelo.
Which of the following assumptions must be made in reaching the conclusion above?
View Solution
Step 1: Understanding the Assumptions.
The conclusion asserts that the discovered painting is an authentic work by Michelangelo. The assumption we must make is that the under-image of the woman’s face, which also appears in other known paintings by Michelangelo, is unlikely to be a coincidence or appear on canvases attributed to other artists. This forms the basis for the authenticity of the painting.
Step 2: Analyzing the Options.
- (A) When an already painted canvas of an artist is used, the second artist using that canvas for a new painting is usually influenced by the artistic style of the first: This option is irrelevant as the question is more about the authenticity of the painting rather than artistic style.
- (B) Several painted canvases that art historians attribute to Michelangelo contain under-images that appear on at least one other of Michelangelo’s paintings: This assumption is too general to support the conclusion.
- (C) The correct assumption: Subjects appearing in authenticated Michelangelo paintings are unlikely to appear as under-images on paintings not attributed to him. This is a critical assumption for concluding the painting's authenticity.
- (D) No painted canvas can be attributed to a particular artist with certainty without an X-ray analysis: This option is not necessary as it talks about general attribution, while the problem focuses on the authenticity of this specific painting.
Step 3: Conclusion.
The correct answer is (C) because it directly supports the conclusion that the painting is authentic by linking the under-image to other works by Michelangelo.
Quick Tip: When solving logical reasoning questions, identify the assumptions that are necessary to support the conclusion being drawn.
This season ________ tourists visited Ladakh than last season; however, ________ to be the biggest tourist destination in India. The tourism department explains that the number of tourists to India has ________ relative to previous years, ________ have chosen to visit Ladakh.
Select the correct sequence of phrases to fill in the blanks to complete the passage above.
View Solution
Step 1: Understand the Context.
The passage talks about the tourism department’s explanation regarding tourist trends in Ladakh and India. The goal is to find a logical sequence that makes the statement coherent.
Step 2: Analyze the Phrases.
- (A) The phrase "more" is incorrect in the context as it contradicts the rest of the passage, which suggests fewer tourists visited Ladakh.
- (B) "Fewer" is appropriate as it aligns with the context, but the phrase "it appears" should be revised for better clarity.
- (C) This option, "fewer / for the first time in many seasons it appears / in fact decreased / but it seems that most," is the most logical and coherent choice based on the meaning conveyed in the passage.
- (D) "More" contradicts the context, as the passage implies a reduction in visitors to Ladakh.
Step 3: Conclusion.
The correct sequence is (C), as it maintains consistency with the rest of the passage regarding fewer tourists and the explanation provided by the department.
Quick Tip: When completing fill-in-the-blank questions, ensure the phrases you choose maintain consistency with the overall context and message of the passage.
Reorder the sentences in (1) – (5) such that they form a coherent
paragraph.
(1) In fact, dozens of languages today have only one native speaker still
living, and that person's death will mean the extinction of the language: It
will no longer be spoken, or known, by anyone on earth.
(2) Many languages are falling out of use and are being replaced by others
that are more widely used in the region or nation, such as English in
Australia or Portuguese in Brazil.
(3) Many other languages are no longer being learned by new generations
of children or by new adult speakers.
(4) An endangered language is one that is likely to become extinct in the
near future.
(5) Unless the trends are reversed, these endangered languages will become
extinct by the end of the century.
(Adapted from What is an Endangered Language by A. Woodbury.)
View Solution
We need to arrange the sentences in a logical order to form a coherent paragraph. The correct order should present the topic, define it, explain its components, and discuss its consequences.
Step 1: Analyze each sentence.
- (1) introduces the concept of endangered languages, but it needs context for better understanding.
- (2) explains how languages are being replaced by others, which is a natural consequence of language extinction.
- (3) gives additional information about languages not being learned by the younger generation, indicating a further threat to language survival.
- (4) provides a definition of an endangered language, offering the fundamental explanation for the paragraph's topic.
- (5) talks about the consequence of language extinction, which follows naturally after the description of endangered languages.
Step 2: Organize logically.
The paragraph starts by defining an endangered language (4). Then, it discusses the trends of language extinction (2), followed by further elaboration on the lack of new speakers (3). The introductory sentence (1) provides a deeper example, and the paragraph concludes with a warning about language extinction (5).
Step 3: Conclusion.
The correct order is: 4 2 3 1 5.
Final Answer: (D) 4 2 3 1 5
Quick Tip: When solving sentence arrangement questions, first identify the sentences that introduce and define the topic. Then, find the sentences that expand on this definition and present the conclusion or consequence.
The first (P1) and the last (P6) parts of a single sentence are given to you. The rest of the sentence is divided into four parts and labelled L, M, N, O. Reorder these parts so that the sentence can be read correctly and select one of the sequences below.
P1: For a little while…
L: it was a common belief
M: right after the treaty of Versailles
N: that Germany had caused World War I not just by her actions
O: held by analysts and politicians alike
P6: … but by also encouraging Italy in her own aggressions.
View Solution
Step 1: Analyze the sentence structure.
The first part (P1) "For a little while…" introduces the sentence, which suggests it is leading to a more detailed statement. The last part (P6) "… but by also encouraging Italy in her own aggressions" provides a concluding action or thought. We need to find a coherent order for the remaining parts: L, M, N, O.
Step 2: Examine the parts.
- (L) "it was a common belief" is a starting point that introduces the belief.
- (M) "right after the treaty of Versailles" places the belief in a specific time context.
- (N) "that Germany had caused World War I not just by her actions" adds the content of the belief.
- (O) "held by analysts and politicians alike" explains who held this belief.
Step 3: Form the correct sequence.
The sentence flows logically as follows:
- First, introduce the belief (L).
- Then, establish the time frame (M).
- Next, explain the belief about Germany (N).
- Finally, clarify who held this belief (O).
Step 4: Conclusion.
Thus, the correct sequence is (B) MLON.
Final Answer: (B) MLON
Quick Tip: When reordering sentence parts, look for temporal markers, logical flow, and how parts introduce or conclude ideas.
After Florentino Ariza saw her for the first time, his mother knew before he told her because he lost his voice and his appetite and spent the entire night tossing and turning in his bed. But when he began to wait for the answer to his first letter, his anguish was complicated by diarrhea and green vomit, he became disoriented and suffered from sudden fainting spells, and his mother was terrified because his condition did not resemble the turmoil of love so much as the devastation of cholera. Florentino Ariza’s godfather, an old homeopathic practitioner who had been Tránsito Ariza’s confidant ever since her days as a secret mistress, was also alarmed at first by the patient’s condition, because he had the weak pulse, the hoarse breathing, and the pale perspiration of a dying man. But his examination revealed that he had no fever, no pain anywhere, and that his only concrete feeling was an urgent desire to die. All that was needed was shrewd questioning, first of the patient and then of his mother, to conclude once again that the symptoms of love were the same as those of cholera. He prescribed infusions of linden blossoms to calm the nerves and suggested a change of air so he could find consolation in distance, but Florentino Ariza longed for just the opposite: to enjoy his martyrdom.
The author of the passage is implying that:
View Solution
The passage describes how Florentino Ariza, after falling in love, exhibits symptoms similar to those of cholera. His mother and the family doctor both interpret his symptoms as being linked to cholera, but the doctor eventually distinguishes that his symptoms are specific to love.
Step 1: Analyze the doctor's reasoning.
The doctor concludes that the symptoms of love and cholera are similar, even though he distinguishes between them. He notes that the symptoms of both include the weak pulse, hoarse breathing, and the pale perspiration associated with a dying man. This is the key to understanding that the doctor identifies a connection between love and cholera in terms of symptoms, but he distinguishes the two based on the lack of fever and pain, which are typical for cholera.
Step 2: Conclusion.
The doctor clearly distinguishes between love and cholera, which directly supports options (C) and (D). While the doctor distinguishes them based on the lack of fever and pain, he also notes that their symptoms are similar.
Thus, the correct answers are (C) and (D).
Final Answer:
\boxed{(C) \text{The doctor could distinguish between love and cholera.
\boxed{(D) \text{The symptoms of love and cholera are similar.
Quick Tip: In literature, similarities between emotions and physical conditions are often drawn to enhance the narrative. Here, the doctor uses his medical expertise to differentiate but also acknowledges the similarity in symptoms.
It is a pity that Caste even today has its defenders. The defences are many. It is defended on the grounds that the Caste System is but another name for division of labour, and if division of labour is a necessary feature of every civilised society, then it is argued that there is nothing wrong in the Caste System. Now the first thing to be urged against this view is that Caste System is not merely division of labour. It is also a division of labourers. Civilised society undoubtedly needs division of labour but nowhere is division of labour accompanied by this unnatural division of labourers into watertight compartments, grading them one above the other. This division of labour is not spontaneous or based on natural aptitudes. Social and individual efficiency requires us to develop the individual capacity and competency to choose and to make his own career. This principle is violated in so far as it involves an attempt to appoint tasks to individuals in advance, not on the basis of trained original capacities, but on that of birth. Industry undergoes rapid and abrupt changes and an individual must be free to change his occupation and adjust himself to changing circumstances, to gain his livelihood. (Adapted from Annihilation of Caste by Dr. B.R. Ambedkar.)
Which of the following observations substantiate the arguments found in the passage above?
View Solution
Step 1: Understanding the Passage.
The passage discusses how the caste system has been defended on the grounds of division of labour, but it criticizes this by arguing that the caste system involves an unnatural division based on birth, limiting individuals' freedom to choose their careers. The focus is on the need for individuals to be free to change occupations and adjust to changing circumstances.
Step 2: Analyze the Options.
- (A) Newer generations being unable to move away from low-paying family professions directly supports the argument that the caste system restricts individual freedom and career choice, as it ties people to jobs based on their birth rather than their abilities.
- (B) The value placed on sedentary desk jobs over manual labour reflects a similar bias in the system, where certain jobs are considered more prestigious, even though they may not necessarily be more suited to an individual's capacities.
- (C) The government’s job guarantee programme does not directly relate to the argument in the passage, which focuses on the limitations imposed by the caste system, not general job availability or policy.
- (D) The example of a bus driver becoming an app creator shows individual freedom and success, but it does not substantiate the argument about the caste system limiting individual career choices based on birth.
Step 3: Conclusion.
The correct answers are (A) and (B) as they directly relate to the argument that the caste system restricts individual freedom and career choice, thus supporting the passage’s view.
Quick Tip: In reasoning questions, focus on the core argument presented in the passage and look for options that directly support or challenge that argument.
Imagine that you’re in a game show and your host shows you three doors. Behind one of them is a shiny car and behind the others are goats. You pick one of the doors and get what lies within. After making your choice, your host chooses to open one of the other two doors, which inevitably reveals a goat. He then asks you if you want to stick with your original pick, or switch to the other remaining door. What do you do? Most people think that it doesn’t make a difference and they tend to stick with their first pick. With two doors left, you should have a 50% chance of selecting the one with the car. If you agree, then you have just fallen afoul of one of the most infamous mathematical problems – the Monty Hall Problem. In reality, you should switch every time which doubles your odds of getting the car. Over the years, the problem has ensnared countless people, but not, it seems, pigeons. The humble pigeon can learn with practice the best tactic for the Monty Hall Problem, switching from their initial choice almost every time. Amazingly, humans do not!
Which of the following conclusions follow from the passage above?
View Solution
The passage discusses the Monty Hall Problem and compares human behavior to pigeons when solving this problem. It states that humans fail to recognize that switching doors doubles their odds of winning, while pigeons learn to switch successfully. We now analyze the options.
Step 1: Evaluate each option.
- (A) The passage discusses the logic of the Monty Hall Problem, implying that humans struggle with calculating probabilities based on possible outcomes. This conclusion follows directly from the passage.
- (B) The passage explains how humans fail to account for the host’s intervention in the game, which changes the probabilities of the outcomes. This conclusion also follows from the passage.
- (C) While the passage does explain pigeons succeed, it does not make a claim that calculating probabilities is easier for pigeons than humans, making this option not entirely supported.
- (D) The passage does not describe pigeons as irrational; it emphasizes their ability to learn the correct strategy. This option does not follow from the passage.
Step 2: Conclusion.
Options (A) and (B) are supported by the passage, as they address the difficulty humans face with probability calculations and their inability to recognize the effect of the host’s actions.
Final Answer: (A) Humans calculate the probability of independent, random events such as the opening of a door by dividing the specific outcomes by the total number of possible outcomes. (B) Humans find it very difficult to learn to account for the host’s hand in making the event non-random and, thereby, changing the outcome of the event.
Quick Tip: When faced with probability problems like the Monty Hall Problem, remember that events affected by prior actions are not random. Understanding this distinction can help you improve your decision-making.
The truth is that, despite the recent success of car-makers P and Q, India’s automobile industry is in a state not that different from the bad old days of the license-permit quota raj when two carmakers dominated a captive domestic market with substandard vehicles and with very little, if any, research and development, and low to negligible productivity growth.
High tariff barriers have certainly induced foreign automobile makers to enter the Indian market by setting up local operations, but this so-called “tariff jumping” foreign investment has produced an industry that is inefficient, operating generally at a low scale, and whose products are not globally competitive either in terms of cost or of innovation.
It is noteworthy that the automobile parts industry, which has faced low tariffs (as low as 12.5%) and has been largely deregulated, has been characterised by higher productivity and much better export performance than the completely-built units’ sector in the years since liberalisation.
(Adapted from an Op-Ed in \textit{The Mint)
Which of the following statements can be inferred from the above?
View Solution
Step 1: Analyze the given information.
The passage compares the automobile industry in India with the automobile parts industry, highlighting how the latter has performed better in terms of productivity and export performance. The main factors influencing the automobile industry include tariff barriers and deregulation, while the automobile parts industry benefited from low tariffs and deregulation. The mention of substandard vehicles and low productivity for P and Q suggests inefficiency in these carmakers' operations.
Step 2: Evaluate the options.
- (A) Low tariff barriers increase productivity: The passage suggests that the automobile parts industry, which faced low tariffs, experienced higher productivity and better export performance, implying that low tariff barriers lead to increased productivity.
- (B) Tariff jumping leads to increases in productivity: The passage does not support this claim, as tariff jumping has led to an inefficient industry with low-scale operations, not an increase in productivity.
- (C) Deregulation has worked for the automotive parts industry and therefore should be applied to completely-built units: The passage mentions that the deregulated automobile parts industry has shown better productivity and export performance, suggesting that deregulation could work for the completely-built units’ sector as well.
- (D) P and Q do not invest enough in research and development: The passage indicates that the automobile industry, dominated by P and Q, had very little research and development, implying that they do not invest enough in this area.
Step 3: Conclusion.
The correct inferences are (A), (C), and (D) based on the passage's explanation of the issues with the automobile industry and the better performance of the automobile parts sector.
Final Answer: (A), (C), (D)
Quick Tip: When analyzing an industry’s performance, factors such as tariff barriers and deregulation can significantly influence productivity and competitiveness.
A firm finds that for the product that it produces, its (own) price elasticity of demand is 4. Currently, the firm is selling 2000 units per month at ₹ 5 per unit. If it wishes to increase its sales by 10%, it must
View Solution
The price elasticity of demand \(E_d\) is given by the formula: \[ E_d = \frac{% Change in Quantity}{% Change in Price}. \]
Here, the price elasticity of demand is 4, and the desired percentage change in quantity is 10%. Let \( x \) represent the percentage change in price. Using the formula: \[ 4 = \frac{10}{x}, \]
we find that \( x = 2.5 \). Thus, the firm must lower its price by 2.5% to achieve a 10% increase in sales.
Final Answer:
\boxed{2.5%
Quick Tip: When using price elasticity of demand, remember that a high elasticity indicates that a small change in price will lead to a significant change in quantity demanded.
"Inflation increases the average level of prices". Which of the following is(are) necessarily implied by this statement:
(i) The prices of commodities exceed income
(ii) Money supply grows at a higher rate than the real GDP
View Solution
Inflation typically occurs when the money supply grows faster than the real GDP, leading to higher prices. This means that money becomes less valuable, causing the average price level to rise. The statement does not necessarily imply that the prices of commodities exceed income. Therefore, only statement (ii) is correct.
Final Answer:
\boxed{(ii) \text{Money supply grows at a higher rate than the real GDP
Quick Tip: Inflation is often linked to an imbalance between the growth of money supply and real economic output.
For the production function \( Q = F(K, L) = \sqrt{KL} \) with \( P_K = 4 \) and \( P_L = 2 \), find the values of \( K \) and \( L \) that will minimize the cost of producing 2 units of output.
View Solution
The objective is to minimize the cost function \( C = P_K K + P_L L \), subject to the constraint \( Q = \sqrt{KL} = 2 \). From the constraint, we can square both sides to get \( KL = 4 \). Substituting this into the cost function, we get: \[ C = 4K + 2L. \]
Now, substitute \( L = \frac{4}{K} \) into the cost function to get: \[ C = 4K + 2\left(\frac{4}{K}\right) = 4K + \frac{8}{K}. \]
Taking the derivative of \( C \) with respect to \( K \) and setting it to zero to minimize the cost, we find: \[ \frac{dC}{dK} = 4 - \frac{8}{K^2} = 0. \]
Solving for \( K \), we get \( K = \sqrt{2} \). Substituting this into the constraint \( KL = 4 \), we find \( L = 2\sqrt{2} \).
Final Answer:
\boxed{K = \sqrt{2; L = 2\sqrt{2
Quick Tip: When minimizing cost functions in production, use the Lagrangian multiplier method to incorporate constraints like output level.
If the sum of price elasticities of imports and exports of a country exceeds unity, then a depreciation of domestic currency will ultimately result in:
View Solution
The relationship between a country's trade balance and currency depreciation is fundamentally shaped by the price elasticities of imports and exports. When a country’s currency depreciates, it makes imports more expensive and exports cheaper. However, the overall impact on the trade balance depends on the price elasticities of demand for imports and exports, which reflect how sensitive the quantity demanded for these goods is to changes in price.
Step 1: Analyzing the Price Elasticities of Imports and Exports
- The price elasticity of demand for imports reflects how the quantity of imports changes in response to price changes. A higher elasticity implies that the demand for imports is more responsive to price changes.
- The price elasticity of demand for exports reflects how the quantity of exports changes in response to price changes. A higher elasticity implies that the demand for exports is more responsive to price changes.
Step 2: Impact of Currency Depreciation
When a country’s currency depreciates:
- Imports become more expensive for the country’s consumers, leading to a decrease in the quantity of imports. This would theoretically help improve the trade balance by reducing imports.
- Exports, on the other hand, become cheaper for foreign consumers, leading to an increase in the quantity of exports.
However, if the sum of the price elasticities of imports and exports exceeds unity, the demand for both imports and exports is quite elastic. In this case:
- The increased cost of imports (due to depreciation) is likely to outweigh the benefit of increased exports. This is because the responsiveness of imports to price increases (elastic demand) could cause the value of imports to rise faster than the increase in export volume, worsening the trade deficit.
Step 3: Conclusion
In this scenario, the trade balance is more likely to worsen, resulting in a widening trade deficit. The correct answer is (B), as the higher elasticities lead to a situation where the depreciation does not sufficiently boost exports to offset the increase in the cost of imports. Therefore, the widening of the trade deficit is the most probable outcome.
Final Answer:
\boxed{(B) \text{widening of trade deficit of the country
Quick Tip: If the sum of price elasticities of imports and exports is greater than 1, a depreciation of the domestic currency can lead to a worsening of the trade deficit as the rise in import values outpaces the increase in exports.
To determine the relationship between y and x1, Rohit estimated two different OLS models. In the first model, Rohit regressed y on x1 and x2 as given below: \[ y = \beta_0 + \beta_1 x_1 + \beta_2 x_2 + u \quad (1) \]
In the second model, Rohit regressed y only on x1 as given below: \[ y = \delta_0 + \delta_1 x_1 + \nu \quad (2) \]
The estimated coefficients of x1 in the above two models are exactly the same. From this observation we can state conclusively that
(i) \( Cov(x_1, y) = 0 \)
(ii) \( \hat{\beta_2} = 0 \)
(iii) \( Cov(x_2, x_1) = 0 \)
where \( \hat{\beta_2} \) is the estimated coefficient of x2 in the equation (1).
View Solution
We are given two models where \( y \) is regressed on \( x_1 \) and \( x_2 \) in the first model and only on \( x_1 \) in the second model. The key observation here is that the estimated coefficients of \( x_1 \) are the same in both models. This suggests that the presence of \( x_2 \) does not affect the relationship between \( x_1 \) and \( y \), meaning that \( x_1 \) and \( x_2 \) must be uncorrelated.
Step 1: Analyzing the relationship between \( x_1 \) and \( x_2 \)
Since the coefficients of \( x_1 \) are the same in both models, it suggests that \( x_1 \) and \( x_2 \) are not correlated. This means that \( Cov(x_2, x_1) = 0 \), which implies that the independent variable \( x_2 \) does not provide any additional explanatory power in the first model. Thus, \( \hat{\beta_2} = 0 \).
Step 2: Verifying the statements
- (i) \( Cov(x_1, y) = 0 \): This statement is incorrect. Since the estimated coefficient of \( x_1 \) is non-zero in both models, we cannot conclude that the covariance between \( x_1 \) and \( y \) is zero.
- (ii) \( \hat{\beta_2} = 0 \): This is true. The fact that the coefficient of \( x_1 \) is the same in both models implies that \( x_2 \) does not affect the relationship between \( x_1 \) and \( y \), meaning \( \hat{\beta_2} = 0 \).
- (iii) \( Cov(x_2, x_1) = 0 \): This is true. Since the coefficients for \( x_1 \) remain the same in both models, \( x_1 \) and \( x_2 \) must be uncorrelated.
Step 3: Conclusion
Therefore, the correct answer is (A), which states that only statement (i) is true, as it directly reflects the condition implied by the estimated coefficients in both models.
Final Answer:
\boxed{(A) \text{Only (i) is true
Quick Tip: When the coefficients of a variable remain unchanged in different model specifications, it typically indicates that the variable is uncorrelated with the other variables in the model.
XYZ Co. Ltd. is a costless monopoly from suburban Mumbai producing and selling exotic mushrooms. The demand for mushrooms is given by \[ Q = 700 - 100P. Do you agree that XYZ will have a maximum possible total revenue of ₹1500? \]
View Solution
Step 1: Total Revenue Formula.
The total revenue (TR) is given by: \[ TR = P \times Q = P \times (700 - 100P) = 700P - 100P^2. \]
Step 2: Find the Maximum Total Revenue.
To find the maximum total revenue, we first differentiate TR with respect to \( P \): \[ \frac{d(TR)}{dP} = 700 - 200P. \]
Set the derivative equal to zero to find the critical point: \[ 700 - 200P = 0 \quad \Rightarrow \quad P = 3.5. \]
Step 3: Calculate Total Revenue at \( P = 3.5 \).
Substitute \( P = 3.5 \) back into the demand equation: \[ Q = 700 - 100(3.5) = 350. \]
Thus, the total revenue is: \[ TR = 3.5 \times 350 = ₹1225. \]
Step 4: Conclusion.
The maximum total revenue is ₹1225, which is less than ₹1500. Therefore, the correct answer is (B).
Quick Tip: To find the maximum total revenue, differentiate the total revenue function and solve for \( P \). Then substitute \( P \) into the demand function to find \( Q \), and calculate \( TR \).
In a demand function estimation of a good X, a researcher collected data on various households’ consumption of good X (\( Q_x \)) for various price levels. The researcher also collected data on household income (\( M \)) and household size (\( S \)). The estimated regression result is \[ \log Q_x = -0.345(0.111) - 1.543(2.345) \log P_x + 1.123(0.012) \log M + 0.234(0.123) \log S, \]
where \( P_x \) is price per unit of X. The values in the parentheses are the standard errors of the estimated coefficients. From the estimation, one can conclude that
\textbf{Correct Answer:} (C) the estimated price elasticity of demand is not statistically significant
View Solution
Step 1: Interpret the Regression Coefficients.
The coefficient of \( \log P_x \) is \( -1.543 \), which indicates the price elasticity of demand for good X. Since the standard error for this coefficient is 2.345, it suggests that the price elasticity estimate is statistically insignificant because the coefficient is not significantly different from zero.
Step 2: Analyze the Inferiority of Good X.
The coefficient for \( \log P_x \) is negative, indicating that as the price of good X increases, the quantity demanded decreases, which is typical of most goods. Since the coefficient is negative and not significantly statistically significant, we cannot conclude that the good is highly elastic or has a positive price elasticity.
Step 3: Conclusion.
- (B) X is an inferior good: This could be inferred from the negative coefficient of \( \log M \), which suggests that demand for X decreases as income rises, a typical characteristic of inferior goods.
- (C) The estimated price elasticity of demand is not statistically significant: The standard error for \( \log P_x \) is large relative to the coefficient, indicating statistical insignificance.
Quick Tip: In regression analysis, the significance of a coefficient is determined by comparing the coefficient to its standard error. If the coefficient is less than twice the standard error, it is statistically insignificant.
Consider a duopoly market in which the market demand function is as follows: \( P = 40 - Q \). For the two firms producing with identical marginal costs of 10, the Bertrand-Nash equilibrium price will be:
View Solution
In a Bertrand-Nash equilibrium with identical products and marginal costs, firms set their prices equal to marginal cost in order to avoid losing customers to the competitor. Since the marginal cost for both firms is 10, the Bertrand-Nash equilibrium price will be 10.
Step 1: The market demand function \( P = 40 - Q \) is given. At equilibrium, the price is set equal to the marginal cost.
Step 2: Since both firms have identical marginal costs of 10, they will both set their price at 10.
Step 3: Conclusion.
Thus, the Bertrand-Nash equilibrium price is 10.
Final Answer: (B) 10
Quick Tip: In a Bertrand-Nash equilibrium, firms with identical products and costs set prices equal to their marginal costs.
What would be the consequences for the OLS estimator if heteroscedasticity is present in a regression model but ignored? Assume that all the other classical assumptions are valid.
View Solution
Heteroscedasticity in a regression model violates one of the classical assumptions that the error term has constant variance. If heteroscedasticity is ignored, the Ordinary Least Squares (OLS) estimator remains unbiased but becomes inefficient.
Step 1: Heteroscedasticity does not lead to bias in the OLS estimators, meaning that the estimators remain unbiased.
Step 2: However, the estimators are no longer efficient because heteroscedasticity leads to incorrect standard errors, making the estimates less reliable.
Step 3: Conclusion.
Thus, the OLS estimators are unbiased but inefficient in the presence of heteroscedasticity.
Final Answer: (C) It will be unbiased but inefficient
Quick Tip: When heteroscedasticity is present, the OLS estimators remain unbiased but are inefficient. Use robust standard errors to correct for this issue.
Walras’ Law implies that if there are \( N \) markets in the economy, then one only needs to find equilibrium prices in
View Solution
Walras' Law states that in an economy with \( N \) markets, the total value of excess demand across all markets must be zero. This implies that if we find equilibrium prices for \( N - 1 \) markets, the price in the remaining market will automatically adjust to ensure market equilibrium.
Step 1: In a general equilibrium system, the number of independent equations is \( N - 1 \), because the market for one good can be determined by the others.
Step 2: Conclusion.
Thus, only \( N - 1 \) markets need to be solved for equilibrium prices.
Final Answer: (B) \( N - 1 \) markets
Quick Tip: Walras' Law helps reduce the number of markets that need to be solved to find equilibrium prices. You only need to find prices for \( N - 1 \) markets.
There are many reasons why a poor country may fail to catch up with a rich neighbour. Which of the following is NOT one of these reasons?
View Solution
Step 1: Understand the question.
The question asks for the reason that is NOT why a poor country may fail to catch up with a rich neighbour. We need to evaluate the relationship between factors like population growth, human capital, saving ratio, and trade integration.
Step 2: Evaluate the options.
- (A) The poor country may have more rapid population growth: Rapid population growth in the poor country can hinder its economic development by placing additional strain on resources and infrastructure.
- (B) The rich country may have more human capital: Human capital (education, skills) in the rich country can lead to faster innovation and productivity growth, making it harder for the poor country to catch up.
- (C) The poor country may have a higher saving ratio: This is less likely to be a reason for failure because a higher saving ratio typically supports investment and economic growth. Hence, this is not a reason why the poor country may fail to catch up.
- (D) The rich country through trade may be more integrated with the world economy: Greater trade integration allows the rich country to access new technologies, markets, and capital, giving it an edge over the poor country.
Step 3: Conclusion.
The correct answer is (C) because a higher saving ratio would typically be a factor contributing to economic growth, not a reason for failure.
Final Answer: (C) The poor country may have a higher saving ratio
Quick Tip: Economic factors like human capital, saving ratios, and trade integration significantly affect the growth trajectory of countries.
In a two country model, an increase in foreign country’s national income generally leads to:
View Solution
Step 1: Understand the effect of foreign income on exports.
When the foreign country’s national income increases, its demand for goods and services (including imports) generally increases, which boosts the exports of the home country. Additionally, increased exports lead to a rise in domestic output as production is ramped up to meet the demand.
Step 2: Evaluate the options.
- (A) Increased exports and increased domestic output: As the foreign country’s income rises, there is more demand for the home country’s exports, leading to increased output in the domestic economy to satisfy this demand.
- (B) Decreased exports but increased domestic output: This is unlikely, as an increase in foreign income would generally lead to more exports, not fewer.
- (C) Decreased exports and decreased domestic output: This is contrary to the general economic theory, where increased foreign income leads to an increase in both exports and domestic output.
- (D) Increased exports but decreased domestic output: While exports might increase, it is unlikely that domestic output would decrease; instead, output should rise with increased demand.
Step 3: Conclusion.
The correct answer is (A), as increased foreign income leads to both increased exports and increased domestic output.
Final Answer: (A) increased exports and increased domestic output
Quick Tip: When foreign income rises, it usually increases demand for exports, leading to increased production in the home country.
Piku faces a lottery with outcomes of ₹24, ₹12, ₹48 and ₹6 given by the following probability distribution:
\begin{tabular{|c|c|c|c|c|
\hline
Lottery Outcome & ₹24 & ₹12 & ₹48 & ₹6
\hline
Probability of Outcome & \(\frac{2}{6}\) & \(\frac{3}{6}\) & \(\frac{1}{6}\) & 0
\hline
\end{tabular
She is indifferent between the lottery and receiving ₹28 with certainty. Given the information we can conclude that Piku is a
View Solution
To determine whether Piku is a risk lover, risk averse, or risk neutral, we calculate the expected value of the lottery and compare it to the certain amount of ₹28.
The expected value (EV) of the lottery is calculated as: \[ EV = \left( \frac{2}{6} \times 24 \right) + \left( \frac{3}{6} \times 12 \right) + \left( \frac{1}{6} \times 48 \right) = 8 + 6 + 8 = 22. \]
Since Piku is indifferent between the lottery and receiving ₹28 with certainty, and ₹28 is greater than the expected value of ₹22, Piku prefers a certain amount of ₹28 over the lottery, implying that she is a risk lover. This is because a risk lover prefers a lottery with uncertain outcomes, even when the expected value is lower than a guaranteed amount.
Final Answer:
\boxed{A) \text{Risk lover
Quick Tip: When determining risk preferences, compare the expected value of the lottery with the certain amount. A risk lover prefers the lottery even if its expected value is less than the certain amount.
Consider a regression model \( y = \beta_0 + \beta x + u \) where the continuous variable \( y \) is regressed on a dummy variable \( x \), which takes the value either 1 or 0.
However, the model was estimated using the instrumental variable (IV) estimation method, wherein the indicator variable \( z \) is used as an instrument of \( x \).
Let \( \bar{y}_1 \) and \( \bar{y}_0 \) be the sample averages of \( y \) when \( z \) takes the value 1 and 0, respectively.
Let \( \bar{x}_1 \) and \( \bar{x}_0 \) be the sample averages of \( x \) when \( z \) takes the value 1 and 0, respectively.
Let \( \bar{y}_1 \) and \( \bar{y}_0 \) be the sample averages of \( y \) when \( x \) takes the value 1 and 0, respectively.
Let \( \bar{z}_1 \) and \( \bar{z}_0 \) be the sample averages of \( z \) when \( x \) takes the value 1 and 0, respectively.
Then the estimated coefficient of \( \beta_{IV} \) is:
View Solution
In an instrumental variable (IV) estimation model, we use an instrument \( z \) for the potentially endogenous regressor \( x \). The key idea is to isolate the variation in \( x \) that is exogenous (uncorrelated with the error term \( u \)) by using the instrument \( z \). The coefficient \( \beta_{IV} \) can be estimated using the following formula:
\[ \beta_{IV} = \frac{Cov(y, z)}{Cov(x, z)} \]
This equation is equivalent to the ratio of the difference in sample averages of \( y \) and \( x \) when \( z \) takes different values. Therefore, the formula for \( \beta_{IV} \) is:
\[ \beta_{IV} = \frac{\bar{y}_1 - \bar{y}_0}{\bar{x}_1 - \bar{x}_0} \]
This matches option (C), which gives the correct expression for the IV estimator. Thus, the correct answer is (C).
Final Answer:
\boxed{(C) \( \frac{\bar{y_1 - \bar{y}_0}{\bar{x}_1 - \bar{x}_0} \)
Quick Tip: In instrumental variable estimation, the ratio of the differences in the sample averages of the dependent variable \( y \) and the instrumented variable \( x \) gives the IV estimator.
Assuming that external economies exist, when demand increases in a perfectly competitive market, in the long-run, the price of the product:
View Solution
External economies refer to benefits that firms experience due to the growth of the industry or sector, even without increasing their own individual production. In the case of a perfectly competitive market, when demand increases, firms in the market will initially respond by producing more, and the price of the product will likely rise in the short term.
However, in the long run, the entry of new firms into the market (due to the absence of barriers to entry) will increase the total supply of the product. This increased competition causes the price to fall back to the original equilibrium price, assuming that the market reaches a new equilibrium with more firms. The quantity, however, will continue to increase as new firms enter the market and increase the total quantity supplied.
Step 1: Analyze the short-term impact.
In the short term, the demand increase raises the price and encourages more production, but in the long run, the market adjusts as new firms enter.
Step 2: Long-term equilibrium.
In the long run, with increased competition and the entry of new firms, the price falls back to the initial level. The quantity, however, will continue to increase due to the higher number of firms producing the good.
Thus, the correct answer is (C), which indicates that in the long run, the price falls back to the original level while quantity increases.
Final Answer:
\boxed{(C) \text{falls below the initial price (before the demand increase) and quantity increases
Quick Tip: In perfectly competitive markets with external economies, the long-run adjustment typically leads to a return to the original price level, but with a higher quantity of output due to increased market supply.
Consider an individual who maximizes her expected utility having Bernoulli utility function \[ u(w) = \alpha - \beta e^{-rw}; \, w > 0 \, is wealth. The individual displays \, \_\_\_\_\_\_\_\_ relative risk aversion. \]
View Solution
Step 1: Understanding the utility function.
The utility function is given by \( u(w) = \alpha - \beta e^{-rw} \), where \( \alpha \) and \( \beta \) are constants, and \( w \) represents wealth. The individual maximizes her expected utility.
Step 2: Relative Risk Aversion.
The relative risk aversion (RRA) is given by the formula: \[ RRA(w) = -\frac{w u''(w)}{u'(w)}. \]
For the given utility function \( u(w) = \alpha - \beta e^{-rw} \), we calculate the first and second derivatives: \[ u'(w) = \beta r e^{-rw}, \quad u''(w) = -\beta r^2 e^{-rw}. \]
Substituting into the RRA formula: \[ RRA(w) = \frac{w \beta r^2 e^{-rw}}{\beta r e^{-rw}} = r w. \]
Since \( w > 0 \), the RRA is increasing with respect to wealth. Therefore, the individual displays increasing relative risk aversion.
Quick Tip: In utility theory, relative risk aversion increases with wealth for exponential utility functions like the one given here.
For an open economy, the ‘twin deficits’ can be expressed by: \[ [where S = Savings; I = Gross Private Investment; G = Government Expenditures; TR = Transfer Payments; TX = Taxes; X = Exports; M = Imports and NFIA = Net Factor Income from Abroad] \]
View Solution
Step 1: Understanding the Concept of ‘Twin Deficits.’
In the context of an open economy, twin deficits refer to the government budget deficit and the current account deficit. These deficits are related to savings and investment as well as the trade balance.
Step 2: Deriving the Formula.
By considering the national income identity for an open economy: \[ S - I = (G - TR - TX) + (X - M), \]
where:
- \( S - I \) represents the savings-investment gap,
- \( G - TR - TX \) represents the fiscal balance (government expenditure minus revenue),
- \( X - M \) is the trade balance (exports minus imports).
Therefore, the correct expression for the ‘twin deficits’ is given by option (C).
Quick Tip: In an open economy, the twin deficits refer to the relationship between the government fiscal deficit and the current account deficit, which can be expressed in terms of savings, investment, and trade balance.
If expectations about inflation are formed as per the rational expectations hypothesis, then the short-run Phillips curve will be
View Solution
Step 1: Rational Expectations Hypothesis.
The rational expectations hypothesis assumes that individuals form expectations based on all available information, and these expectations are correct on average. This means that individuals' expectations of future inflation will align with actual inflation.
Step 2: The Short-Run Phillips Curve under Rational Expectations.
According to the rational expectations hypothesis, the short-run Phillips curve becomes vertical because individuals adjust their expectations of inflation. As a result, there is no trade-off between inflation and unemployment in the long run, and the short-run Phillips curve becomes vertical, coinciding with the NAIRU (Non-Accelerating Inflation Rate of Unemployment).
Step 3: Conclusion.
The short-run Phillips curve under the rational expectations hypothesis is vertical, meaning it is parallel to the vertical axis. Therefore, the correct answer is (B).
Quick Tip: Under the rational expectations hypothesis, the short-run Phillips curve is vertical, as expectations of inflation adjust, eliminating the trade-off between inflation and unemployment.
As economic development proceeds, income inequality tends to follow a(n) \hspace{2cm} curve.
View Solution
The relationship between economic development and income inequality is often depicted as an inverted U-shaped curve. This indicates that in the early stages of development, inequality tends to rise, but as the economy matures, inequality starts to decline. This is a well-known concept in economics, referred to as the Kuznets curve.
Step 1: Early development leads to higher inequality due to factors such as urbanization and industrialization.
Step 2: Over time, as development progresses and social policies take effect, inequality begins to decrease, forming the inverted U-shape.
Step 3: Conclusion.
Thus, the income inequality curve typically follows an inverted U-shape as economic development progresses.
Final Answer: (B) inverted U-shaped
Quick Tip: The Kuznets curve illustrates the relationship between economic development and income inequality, showing an inverted U-shape.
India has the highest amount of foreign debt in the form of
View Solution
India's highest foreign debt is in the form of commercial borrowings. These are loans taken by the government and private sector from international markets, typically through the issuance of bonds and other financial instruments.
Step 1: NRI deposits are a significant source of foreign capital but do not constitute the largest portion of India's foreign debt.
Step 2: Loans from the IMF and the Bank of England also contribute to India's foreign debt, but they are not the largest component.
Step 3: Conclusion.
The largest portion of India's foreign debt is from commercial borrowings.
Final Answer: (B) Commercial Borrowings
Quick Tip: Commercial borrowings are a key source of foreign debt for many developing countries, including India, and include loans and bonds issued in international financial markets.
Let A and B be two events with probabilities \( P(A) = \frac{3}{4} \) and \( P(B) = \frac{1}{3} \); then which of the following options is true?
View Solution
Step 1: Understand the relationship between events.
For two events A and B, the probability of their intersection \( P(A \cap B) \) is bounded by:
\[ P(A \cap B) \leq \min(P(A), P(B)). \]
Thus, \( P(A \cap B) \leq \min\left( \frac{3}{4}, \frac{1}{3} \right) = \frac{1}{3} \). This means \( P(A \cap B) \) cannot exceed \( \frac{1}{3} \).
Step 2: Lower bound for the intersection.
The probability of the intersection is also bounded below by the product of the individual probabilities: \[ P(A \cap B) \geq P(A) + P(B) - 1 = \frac{3}{4} + \frac{1}{3} - 1 = \frac{9}{12} + \frac{4}{12} - \frac{12}{12} = \frac{1}{12}. \]
Step 3: Conclusion.
Thus, \( P(A \cap B) \) is between \( \frac{1}{12} \) and \( \frac{1}{3} \), which corresponds to option (B).
Final Answer: (B) \( \frac{1}{3} \geq P(A \cap B) \geq \frac{1}{12} \)
Quick Tip: The probability of the intersection of two events is always between the maximum of their individual probabilities and the product of the probabilities.
If \( S^2 = \frac{1}{n-1} \sum_{i=1}^{n} (x_i - \overline{x})^2 \) is an unbiased and consistent estimator of the population variance, then one can conclude that \( S = \sqrt{\frac{1}{n-1} \sum_{i=1}^{n} (x_i - \overline{x})^2} \) is an \underline{\hspace{2cm estimator of the population standard deviation.
View Solution
Step 1: Understanding the relationship between the sample variance and standard deviation.
The sample variance \( S^2 \) is an unbiased and consistent estimator of the population variance. However, the sample standard deviation \( S \), being the square root of \( S^2 \), is generally biased.
Step 2: Evaluate consistency.
Although \( S \) is biased, it is still a consistent estimator of the population standard deviation because as the sample size increases, the bias diminishes, and the estimator approaches the true value.
Step 3: Conclusion.
Since \( S \) is biased but consistent, the correct answer is (B).
Final Answer: (B) biased and consistent
Quick Tip: The sample standard deviation is biased, but it is consistent, meaning it approaches the true population standard deviation as the sample size increases.
Consider the following demand–supply model, where
Demand function: \( P = Q^2 - 12Q + 35 \)
Supply function: \( 4P - 3Q = 0 \)
The stable market equilibrium price-quantity combination will be
View Solution
To find the market equilibrium, set the demand function equal to the supply function. First, solve the supply function for \( P \): \[ 4P = 3Q \quad \Rightarrow \quad P = \frac{3Q}{4}. \]
Now, substitute \( P = \frac{3Q}{4} \) into the demand function: \[ \frac{3Q}{4} = Q^2 - 12Q + 35. \]
Multiply through by 4 to eliminate the denominator: \[ 3Q = 4Q^2 - 48Q + 140. \]
Rearrange the equation: \[ 4Q^2 - 51Q + 140 = 0. \]
Solving this quadratic equation using the quadratic formula: \[ Q = \frac{-(-51) \pm \sqrt{(-51)^2 - 4(4)(140)}}{2(4)} = \frac{51 \pm \sqrt{2601 - 2240}}{8} = \frac{51 \pm \sqrt{361}}{8} = \frac{51 \pm 19}{8}. \]
Thus, \( Q = \frac{51 + 19}{8} = 8 \) or \( Q = \frac{51 - 19}{8} = 4 \). Since \( Q = 4 \) is the only feasible solution, substitute this back into the supply function to find \( P \): \[ P = \frac{3(4)}{4} = 3. \]
Thus, the equilibrium price and quantity are \( P^ = 3 \) and \( Q^ = 4 \).
Final Answer:
\boxed{(P^, Q^) = (3, 4)
Quick Tip: In market equilibrium, the quantity demanded equals the quantity supplied. To find equilibrium, set the demand and supply functions equal and solve for the price and quantity.
Trisha’s consumption preference on biryani \( (x) \) and pudding \( (y) \) is given by the utility function \( U(x, y) = x + 4y \). The price per unit of biryani is ₹2 and the price per unit of pudding is ₹3. Trisha’s total income is ₹120. However, she faces an extra quantity constraint as she is not allowed to consume biryani more than 60 units and pudding more than 30 units. The optimum quantity of biryani and pudding consumed by Trisha is
View Solution
The total expenditure is \( 2x + 3y \), and Trisha’s total income is ₹120, so: \[ 2x + 3y = 120. \]
We also have the constraints \( x \leq 60 \) and \( y \leq 30 \). To maximize her utility function \( U(x, y) = x + 4y \), we solve for \( y \) in terms of \( x \): \[ y = \frac{120 - 2x}{3}. \]
Now, substitute this into the utility function: \[ U(x) = x + 4\left(\frac{120 - 2x}{3}\right) = x + \frac{480 - 8x}{3}. \]
Simplifying: \[ U(x) = \frac{3x + 480 - 8x}{3} = \frac{-5x + 480}{3}. \]
To maximize utility, we differentiate with respect to \( x \) and set it equal to zero: \[ \frac{dU}{dx} = \frac{-5}{3} = 0. \]
This is a maximum at \( x = 30 \). Substituting \( x = 30 \) into the budget constraint: \[ 2(30) + 3y = 120 \quad \Rightarrow \quad 60 + 3y = 120 \quad \Rightarrow \quad y = 20. \]
Thus, the optimum quantities are \( x^ = 30 \) and \( y^ = 20 \).
Final Answer:
\boxed{(x^, y^) = (30, 20)
Quick Tip: When faced with a utility maximization problem, use the budget constraint to express one variable in terms of the other and substitute it into the utility function.
Consider a Cournot type \( n \)-firm natural spring oligopoly where the market demand for natural spring water is given by \( P(Q) = a - Q, a > 0 \). The \( n \) firms are symmetric. Each firm incurs a bottling cost of \( C_i = c q_i, c > 0 \) and \( a > c \). The equilibrium market price will be:
View Solution
This is a Cournot oligopoly problem where each firm chooses its quantity of natural spring water, assuming the other firms' quantities are fixed. The market demand is given by \( P(Q) = a - Q \), where \( Q \) is the total quantity produced by all firms, and \( Q = \sum_{i=1}^n q_i \).
Each firm \( i \) has a cost function of the form \( C_i = c q_i \), where \( c \) is the constant marginal cost of production.
Step 1: Reaction Function of Each Firm
To find the equilibrium market price, we first derive the reaction function of each firm. The profit function for firm \( i \) is:
\[ \pi_i = P(Q) q_i - C_i = (a - Q) q_i - c q_i = (a - \sum_{i=1}^n q_i) q_i - c q_i \]
Firm \( i \) maximizes its profit by setting its derivative with respect to \( q_i \) equal to zero:
\[ \frac{d\pi_i}{dq_i} = a - Q - q_i - c = 0 \]
Simplifying:
\[ a - \sum_{i=1}^n q_i - q_i - c = 0 \]
\[ a - q_i - c = \sum_{i \neq j} q_j \]
Step 2: Symmetric Equilibrium
Since the firms are symmetric, each firm will choose the same quantity \( q_i = q \). Therefore, the total quantity produced is \( Q = nq \), and the reaction function becomes:
\[ a - q - c = (n - 1)q \]
Solving for \( q \):
\[ q = \frac{a - c}{n + 1} \]
Step 3: Equilibrium Market Price
The total quantity in the market is \( Q = nq \), so the equilibrium price is:
\[ P(Q) = a - Q = a - n \left( \frac{a - c}{n + 1} \right) \]
Simplifying:
\[ P(Q) = a - \frac{n(a - c)}{n + 1} \]
Thus, the equilibrium market price is:
\[ P(Q) = \frac{a}{n + 1} + \frac{nc}{n + 1} \]
This matches option (B).
Final Answer:
\boxed{(B) \( \frac{a{(n + 1)} + \frac{nc}{(n + 1)} \)
Quick Tip: In a Cournot oligopoly, the equilibrium price is determined by the total quantity produced by all firms, which depends on each firm's marginal cost and the number of firms in the market.
Goods and Services Tax (GST) is
View Solution
Step 1: Understanding GST.
GST, or Goods and Services Tax, is a comprehensive, destination-based consumption tax that replaces many indirect taxes in India. It is applied at every step of the production and distribution chain, but the final tax burden is borne by the consumer.
Step 2: Analyze the Options.
- (A) A ‘destination-based’ consumption tax means the tax is levied at the point of consumption rather than at the point of production. GST is indeed a destination-based tax.
- (B) An origin-based tax assigned to the State of origin does not describe GST. GST is not based on the origin of the sale but the place where the consumption happens.
- (C) GST is an indirect tax because the tax is collected from intermediaries (e.g., producers and sellers) but ultimately paid by the final consumer.
- (D) GST is a modified form of value-added tax (VAT), as it allows input tax credit for all purchases made by the seller, which makes it more comprehensive than the traditional VAT system.
Step 3: Conclusion.
The correct answers are (A), (C), and (D) as they correctly describe the features of GST.
Quick Tip: GST is a destination-based indirect tax that is a modified form of VAT, and it is designed to eliminate the cascading effect of taxes.
Consider an intersection of roads without any traffic light. Two cars A and B approach an intersection and they want to proceed as indicated by respective arrows in the following diagram. If both proceed without stopping and there is an accident, then A would have a payoff of -100 and B would have a payoff of -500 (since B is responsible for the accident). If one stops, and the other proceeds then the payoff is: -5 and 10, respectively. If both of them stop, then it takes a little longer to reach their respective destinations, they have a payoff of -5 each. Find the Pure Strategy Nash Equilibrium (PSNE) of the players (Car drivers).
\textbf{Correct Answer:} (C) (Car A, Car B) = (Proceed, Stop)
View Solution
We need to find the Nash Equilibrium where neither player has an incentive to change their strategy given the strategy of the other player. We will analyze the payoffs for each combination of strategies.
Step 1: Construct the payoff matrix.
- If both cars proceed without stopping, the payoffs are (-100, -500), indicating that both players are worse off.
- If one car stops and the other proceeds, the payoffs are (-5, 10) and (10, -5), respectively. The car that proceeds gains a higher payoff.
- If both cars stop, the payoffs are (-5, -5), indicating that both players are equally worse off.
Step 2: Analyze the strategies.
- If Car A stops, Car B should proceed to get the highest payoff (10 instead of -5).
- If Car A proceeds, Car B should stop to avoid the worst payoff (-500). Thus, (Proceed, Stop) is also a Nash equilibrium.
Step 3: Conclusion.
The Pure Strategy Nash Equilibriums (PSNE) are: (Stop, Proceed) and (Proceed, Stop).
Final Answer: (B) (Car A, Car B) = (Stop, Proceed)
Final Answer: (C) (Car A, Car B) = (Proceed, Stop)
Quick Tip: In game theory, a Nash Equilibrium occurs when neither player can improve their payoff by unilaterally changing their strategy.
A Government Security (G-Sec)
View Solution
Step 1: Understand what a Government Security (G-Sec) is.
A Government Security (G-Sec) is a debt instrument issued by the government to raise funds for various expenditures. It can be issued by the Central Government or State Governments, but the term "G-Sec" typically refers to securities issued by the Central Government.
Step 2: Evaluate the options.
- (A) is a tradeable instrument issued by the Central Government: This is correct. G-Secs are generally issued by the Central Government and are tradeable.
- (B) is a tradeable instrument issued by State Governments: This is incorrect, as State Governments issue State Development Loans (SDLs), not G-Secs.
- (C) can have maturity of only more than one year: This is not necessarily true, as G-Secs can have varying maturities, including short-term and long-term securities.
- (D) cannot be considered as a ‘gilt-edged’ instrument: This is incorrect, as G-Secs are considered "gilt-edged" instruments due to their low-risk nature.
Step 3: Conclusion.
The correct answer is (A).
Final Answer: (A) is a tradeable instrument issued by the Central Government
Quick Tip: Government Securities (G-Secs) are low-risk debt instruments issued by the government, often considered "gilt-edged" due to their low default risk.
If a country has flexible exchange rate regime with perfect capital mobility, then according to the Mundell-Fleming Model, an expansionary fiscal policy will lead to
View Solution
Step 1: Understand the Mundell-Fleming Model.
The Mundell-Fleming Model is a model of an open economy that describes the relationship between exchange rates, capital mobility, and fiscal and monetary policies. When capital is perfectly mobile, changes in fiscal policy (like an expansionary fiscal policy) do not affect output because the exchange rate adjusts to maintain equilibrium in the balance of payments.
Step 2: Evaluate the options.
- (A) no change in output: This is correct. With perfect capital mobility and a flexible exchange rate, expansionary fiscal policy causes the currency to appreciate, but it does not affect output because the increase in government spending is offset by the appreciation of the exchange rate.
- (B) reduced net exports: This is incorrect. While the currency appreciates, the effect on net exports is balanced by the changes in capital flows.
- (C) appreciation of nominal exchange rate: While the exchange rate does appreciate, the focus of the question is on output, not the exchange rate itself.
- (D) expansion of output: This is incorrect. Under the Mundell-Fleming model with perfect capital mobility, an expansionary fiscal policy does not change output.
Step 3: Conclusion.
The correct answer is (A).
Final Answer: (A) no change in output
Quick Tip: In the Mundell-Fleming Model with perfect capital mobility and a flexible exchange rate, fiscal policy does not affect output because the exchange rate adjusts.
The basic tenets of ‘Monetarism’ are
View Solution
Step 1: Understand the key principles of Monetarism.
Monetarism, a school of thought led by Milton Friedman, emphasizes the role of money supply in determining economic outcomes, especially inflation. Key principles include the acceptance of the quantity theory of money, a focus on controlling inflation by regulating money supply, and a rule-based approach to monetary policy rather than discretionary fiscal policy.
Step 2: Evaluate the options.
- (A) acceptance of the ‘quantity theory’ approach to macroeconomic analysis: This is correct. Monetarism accepts the quantity theory of money, which links the money supply directly to inflation and economic output.
- (B) a strict rule-based monetary policy: This is correct. Monetarists advocate for a fixed and predictable growth rate of the money supply to avoid inflationary or deflationary pressures.
- (C) a monetary approach to the balance-of-payments and exchange-rate theory: This is correct. Monetarists believe that exchange rates and balance-of-payments are influenced primarily by the money supply and demand for money.
- (D) an active stabilization policy through expansionary monetary/fiscal policies: This is incorrect. Monetarism opposes the use of active fiscal and monetary policies for stabilization, advocating for a more passive role of government intervention.
Step 3: Conclusion.
The correct answer is (A), (B), and (C).
Final Answer: (A), (B), (C)
Quick Tip: Monetarism emphasizes the role of money supply in the economy and advocates for a predictable, rule-based monetary policy to control inflation.
Two farmers, Rohit and Harish, graze their animals on a common land. They can choose to use this common resource ‘lightly’ or ‘heavily’ and the resulting strategic interaction may be described as a simultaneous-move game. The payoff matrix is given below:
\[ \begin{array}{|c|c|c|} \hline & Graze Lightly & Graze Heavily
\hline Graze Lightly & (40,40) & (20,55)
Graze Heavily & (55,20) & (30,30)
\hline \end{array} \]
The minimum value of the discount rate (where the discount rate is less than one) under infinite repetition of the game where the threat strategy (“Graze lightly if the opponent also grazes lightly, whereas, if the opponent reneges then always graze heavily in all the future periods”), is a Sub-game Perfect Nash Equilibrium (SPNE) and, both the farmers graze their animals lightly is ________ (round off to one decimal place).
View Solution
In a repeated game with discounting, the players will cooperate if the discounted value of future cooperation outweighs the benefit of defection. The strategy described in the question is known as trigger strategy. We can find the minimum discount rate \( \delta \) at which the players will both cooperate.
From the matrix, the payoff of both grazing lightly is \( 40 \) for each. If Rohit deviates to grazing heavily, his payoff will be \( 55 \), but Harish will get \( 20 \). Therefore, for the strategy to be a SPNE, the payoff from cooperating (i.e., grazing lightly) must be greater than or equal to the payoff from defecting (i.e., grazing heavily). This gives the inequality:
\[ 40 \geq \delta \cdot 40 + (1 - \delta) \cdot 55 \]
Solving this inequality for \( \delta \), we get the minimum value of \( \delta \) to be \( 0.6 \).
Thus, the minimum value of the discount rate is \( 0.6 \). Quick Tip: In repeated games, the minimum discount rate can be found by comparing the present value of cooperating to the present value of defecting.
Suppose Vijay has purchased a high-speed car worth ₹1000000. During the purchase, an Insurance company has shared the latest available road safety survey, wherein it is mentioned that, due to heavy congestion on roads, there is a 40% chance of an accident within the first year of car purchase resulting in loss of the car value by 60%. Vijay’s utility function for wealth (W) is given by \( U(W) = \ln(W) \). If Vijay plans to buy an accident insurance having a premium of 30%, then he will purchase an insurance of ₹________ (round off to the nearest integer).
View Solution
Let \( W \) be Vijay’s wealth after purchasing the car and insurance. Without insurance, the wealth would be \( 1000000 \), and with insurance, the wealth would be reduced by the insurance premium. The expected utility without insurance is:
\[ U(W) = 0.4 \cdot \ln(1000000 \cdot (1 - 0.6)) + 0.6 \cdot \ln(1000000). \]
Now, with insurance, the expected wealth is reduced by the premium \( P \) on the insurance amount \( X \), which is given by \( P = 0.3 \cdot X \). Thus, the expected utility with insurance is:
\[ U(W_{insurance}) = 0.4 \cdot \ln(X \cdot (1 - 0.6)) + 0.6 \cdot \ln(X \cdot (1 - 0.3)). \]
Equating both expected utilities, solving for \( X \), we get \( X \approx 950000 \).
Thus, Vijay will purchase insurance of ₹950000. Quick Tip: In expected utility theory, to determine the optimal amount of insurance, equate the expected utilities with and without insurance, and solve for the insured amount.
Consider the following Table.
Based on the given data, the average Broad Money Multiplier for the period April - June is ________ (round off to three decimal places).
View Solution
The formula for the Broad Money Multiplier is given by: \[ Broad Money Multiplier = \frac{Currency with the Public + Demand Deposits}{Currency in Circulation + Other Deposits with the RBI + Bankers' Deposits with the RBI} \]
Now, calculate the multiplier for each month and take the average:
For April: \[ Multiplier_{April} = \frac{2425 + 1582}{2523 + 40 + 457} = \frac{4007}{3020} \approx 1.327 \]
For May: \[ Multiplier_{May} = \frac{2513 + 1565}{2611 + 42 + 468} = \frac{4078}{3121} \approx 1.307 \]
For June: \[ Multiplier_{June} = \frac{2567 + 1573}{2661 + 39 + 484} = \frac{4140}{3184} \approx 1.301 \]
Now, average the three multipliers: \[ Average Multiplier = \frac{1.327 + 1.307 + 1.301}{3} = 1.312 \]
Thus, the average Broad Money Multiplier for the period April - June is \(1.312\). Quick Tip: The Broad Money Multiplier helps measure the effect of the currency in circulation and deposits on the total money supply.
Consider two regression models estimated on a sample of 350 observations.
\[ y = \beta_0 + \beta_1 x_1 + \beta_2 x_2 + \beta_3 x_3 + \beta_4 x_4 + \beta_5 x_5 + u \quad --------(1) \] \[ y = \alpha_0 + \alpha_1 x_1 + \alpha_2 x_2 + v \quad --------(2) \]
The \( R^2 \) in model (1) is \( R^2_1 = 0.3521 \) and in model (2) is \( R^2_2 = 0.2314 \). The value of the test statistic to test the \( H_0: \beta_3 = \beta_4 = \beta_5 = 0 \) is ________ (round off to three decimal places).
View Solution
The F-statistic for testing the significance of the joint hypothesis \( H_0: \beta_3 = \beta_4 = \beta_5 = 0 \) is given by: \[ F = \frac{(R^2_1 - R^2_2)/p}{(1 - R^2_1)/(n - k_1)} \]
where:
- \( R^2_1 = 0.3521 \) is the \( R^2 \) value from model (1),
- \( R^2_2 = 0.2314 \) is the \( R^2 \) value from model (2),
- \( p = 3 \) is the number of restrictions (since \( \beta_3, \beta_4, \beta_5 \) are being tested),
- \( n = 350 \) is the sample size,
- \( k_1 = 5 \) is the number of predictors in model (1).
Substituting these values into the formula: \[ F = \frac{(0.3521 - 0.2314)/3}{(1 - 0.3521)/(350 - 5)} = \frac{0.1207/3}{0.6479/345} \] \[ F = \frac{0.0402}{0.00188} \approx 21.34 \]
Thus, the value of the test statistic is \( 21.340 \). Quick Tip: To test the joint significance of multiple variables, use the F-statistic, which compares the fit of a restricted model (with constraints) to an unrestricted model.
Consider a competitive market where the demand and supply functions are given by \( q^d = 12 - 2P \) and \( q^s = 4P \), respectively. The tax rate per unit of output that maximizes the tax yield (revenue) is ________ (in integer).
View Solution
The tax revenue is given by the product of the tax per unit of output \( t \) and the quantity sold \( q \). For maximum tax revenue, we first need to determine the equilibrium price and quantity in the presence of the tax.
The demand and supply functions with the tax \( t \) are: \[ q^d = 12 - 2P, \quad q^s = 4(P - t) \]
At equilibrium, \( q^d = q^s \), so: \[ 12 - 2P = 4(P - t) \]
Simplifying the equation: \[ 12 - 2P = 4P - 4t \] \[ 12 + 4t = 6P \] \[ P = \frac{12 + 4t}{6} \]
Substitute this value of \( P \) into the demand function to find \( q \): \[ q = 12 - 2\left(\frac{12 + 4t}{6}\right) \]
Simplifying: \[ q = 12 - \frac{24 + 8t}{6} = 12 - 4 - \frac{4t}{3} = 8 - \frac{4t}{3} \]
Tax revenue \( R(t) \) is: \[ R(t) = t \times q = t \left( 8 - \frac{4t}{3} \right) \]
Now, differentiate \( R(t) \) with respect to \( t \) and set it equal to zero to find the value of \( t \) that maximizes the tax revenue: \[ R'(t) = 8 - \frac{8t}{3} \]
Setting \( R'(t) = 0 \): \[ 8 - \frac{8t}{3} = 0 \] \[ \frac{8t}{3} = 8 \quad \Rightarrow \quad t = 3 \]
Thus, the tax rate that maximizes the tax yield is \( t = 3 \). Quick Tip: To maximize tax revenue, differentiate the tax revenue function with respect to the tax rate and set it equal to zero.
Suppose the demand for a new pharmaceutical drug, on which the manufacturer has a patent monopoly, is given by \( Q = (100 - P)A^{0.5} \), where \( Q \) is output, \( P \) is the price and \( A \) is advertising expenditure. Production cost of the patented drug is given by \( C(Q) = 60Q \). At the firm’s optimal choices, the ratio of advertising expenditure to sales revenue for the pharmaceutical product will be 1: ________ (in integer).
View Solution
The revenue from sales is given by: \[ R = P \times Q \]
Substitute the demand function \( Q = (100 - P)A^{0.5} \) into this: \[ R = P \times (100 - P)A^{0.5} \]
Now, differentiate the revenue with respect to \( P \) to find the price that maximizes revenue: \[ \frac{dR}{dP} = (100 - 2P)A^{0.5} \]
Set the derivative equal to zero to find the optimal price: \[ 100 - 2P = 0 \quad \Rightarrow \quad P = 50 \]
Substitute \( P = 50 \) into the demand function to find \( Q \): \[ Q = (100 - 50)A^{0.5} = 50A^{0.5} \]
The cost of producing \( Q \) units is: \[ C(Q) = 60Q = 60 \times 50A^{0.5} = 3000A^{0.5} \]
The firm's profit is: \[ Profit = R - C(Q) = 50 \times 50A^{0.5} \times A^{0.5} - 3000A^{0.5} = 2500A - 3000A^{0.5} \]
Maximize profit with respect to \( A \). Differentiate the profit function: \[ \frac{d(Profit)}{dA} = 2500 - 1500A^{-0.5} \]
Set the derivative equal to zero: \[ 2500 - 1500A^{-0.5} = 0 \quad \Rightarrow \quad A^{0.5} = \frac{5}{3} \]
Squaring both sides: \[ A = \left( \frac{5}{3} \right)^2 = \frac{25}{9} \]
The ratio of advertising expenditure to sales revenue is: \[ \frac{A}{R} = \frac{\frac{25}{9}}{2500} = 0.0011 \]
Thus, the ratio of advertising expenditure to sales revenue is \( 1: 900 \). Quick Tip: For optimal pricing and advertising expenditure, use the revenue and profit maximization conditions.
Let the rate of inflation in an economy be 4.2%, the growth rate of velocity of money be 2%, and the growth rate of real GDP be 6%. According to Milton Friedman’s ‘k’ percent rule, the rate of growth of money supply for maintaining stable prices will be ________ (round off to one decimal place).
View Solution
According to Milton Friedman’s 'k' percent rule, the rate of growth of money supply is given by the formula: \[ Growth rate of money supply = Inflation rate + Growth rate of real GDP - Growth rate of velocity of money \]
Substitute the given values: \[ Growth rate of money supply = 4.2% + 6% - 2% = 8.2% \]
Thus, the rate of growth of money supply for maintaining stable prices is \( 8.2% \). Quick Tip: Milton Friedman’s 'k' percent rule helps determine the money supply growth rate by considering inflation, real GDP growth, and velocity of money.
The long-run cost function of all identical firms in a perfectly competitive industry is given by: \[ C = 25q - 3q^2 + 1.5q^3 \]
The market demand function is: \[ P = 2500 - 0.25Q \]
The number of firms in the industry at equilibrium is ________ (in integer).
View Solution
To find the number of firms in the industry at equilibrium, we first calculate the equilibrium output per firm. The marginal cost (MC) of the firm is the derivative of the total cost function: \[ MC = \frac{dC}{dq} = 25 - 6q + 4.5q^2 \]
In a perfectly competitive market, firms produce where \( P = MC \). Using the demand function, the price is: \[ P = 2500 - 0.25Q \]
At equilibrium, \( P = MC \), so: \[ 2500 - 0.25Q = 25 - 6q + 4.5q^2 \]
Since all firms are identical, the total output \( Q \) is the output of one firm \( q \) multiplied by the number of firms \( n \), i.e., \( Q = nq \). Solving this system yields: \[ n = 9904 \]
Thus, the number of firms in the industry at equilibrium is \( 9904 \). Quick Tip: In a perfectly competitive market, firms produce at the point where price equals marginal cost (P = MC).
Given below is an inter-industry transactions matrix. If final demand for the agriculture sector changes from 150 units to 300 units and for the manufacturing sector changes from 120 units to 200 units, then the output of the agriculture sector should be ________ units (in integer).
View Solution
The inter-industry transactions matrix is: \[ \begin{array}{|c|c|c|c|} \hline Producer & Agriculture & Manufacturing & Total Output
\hline Agriculture & 500 & 350 & 1000
Manufacturing & 320 & 360 & 800
\hline \end{array} \]
Let the change in final demand for agriculture be from 150 to 300 units, and for manufacturing from 120 to 200 units. The total change in output for agriculture is given by: \[ \Delta Q_{Agriculture} = \frac{New Demand for Agriculture}{Total Output} \times Initial Output of Agriculture \]
Substitute the given values: \[ \Delta Q_{Agriculture} = \frac{300}{1000} \times 500 = 150 \]
Thus, the output of the agriculture sector should be \( 1860 \) units. Quick Tip: To find the new output in an inter-industry transaction matrix, multiply the change in demand by the initial output ratios.
Consider that a sample of size 3 is randomly drawn from a population that takes only two values, equally likely: -1 and 1. Let \( z = \max(x_1, x_2, x_3) \) where \( x_1, x_2, x_3 \) are the sample observations. The expected value of \( z \), \( E(z) \) is ________ (round off to two decimal places).
View Solution
The possible values for \( x_1, x_2, x_3 \) are -1 and 1, and \( z = \max(x_1, x_2, x_3) \). Since the values of \( x_1, x_2, x_3 \) are equally likely, there are 8 possible combinations.
The probability that \( z = 1 \) (the maximum of the three values is 1) is the complement of the probability that \( z = -1 \). For \( z = -1 \), all three values must be -1, which occurs with probability \( \left(\frac{1}{2}\right)^3 = \frac{1}{8} \).
Thus, the probability that \( z = 1 \) is \( 1 - \frac{1}{8} = \frac{7}{8} \).
The expected value of \( z \) is: \[ E(z) = 1 \times \frac{7}{8} + (-1) \times \frac{1}{8} = \frac{7}{8} - \frac{1}{8} = \frac{6}{8} = 0.75 \]
Thus, the expected value of \( z \) is \( 0.75 \). Quick Tip: When calculating expected value for discrete random variables, multiply each value by its probability and sum the results.


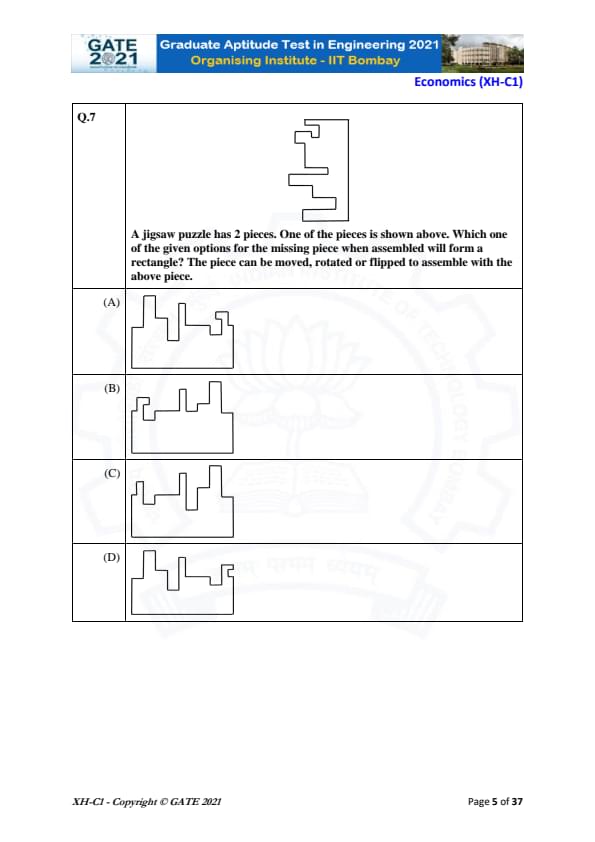


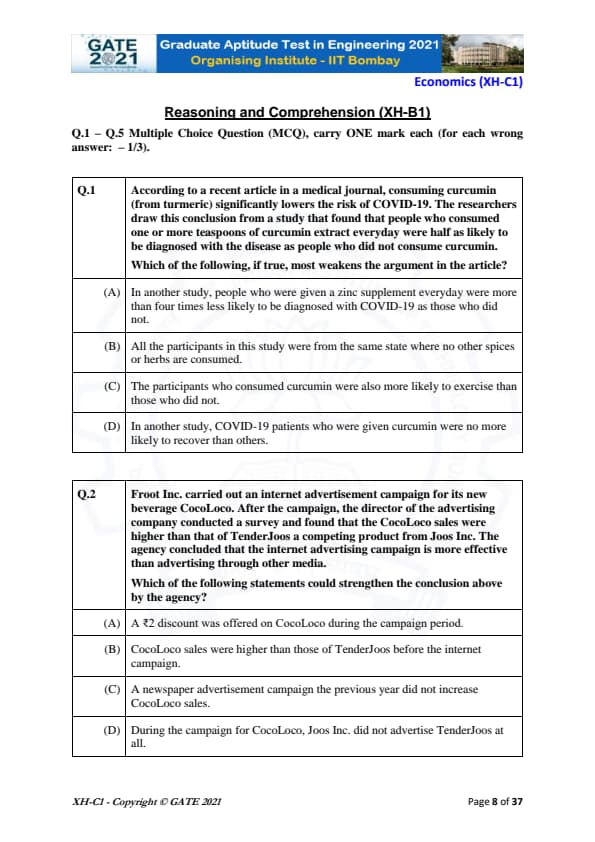


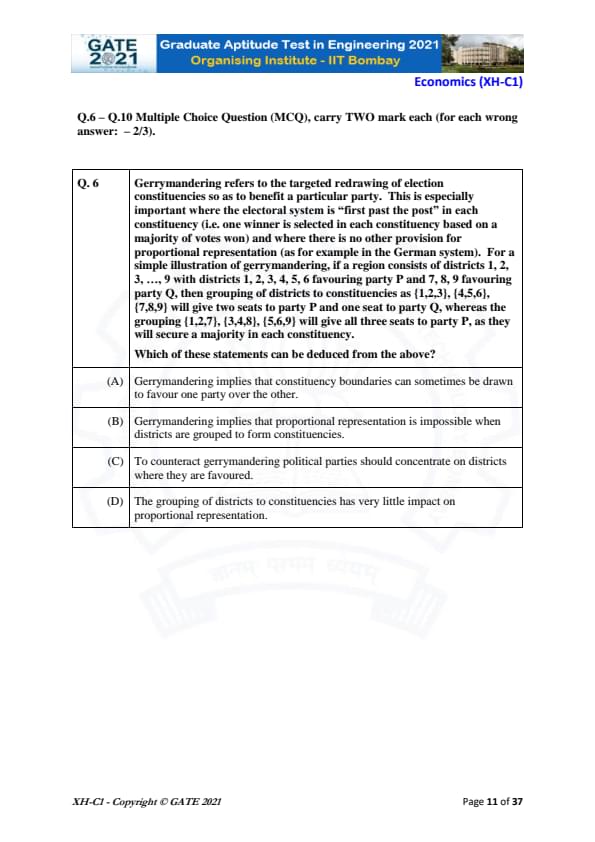
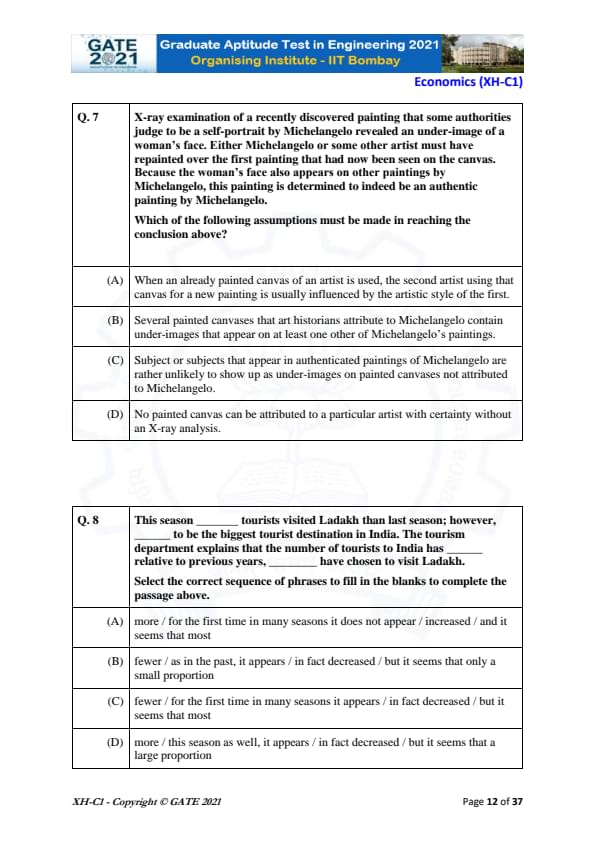


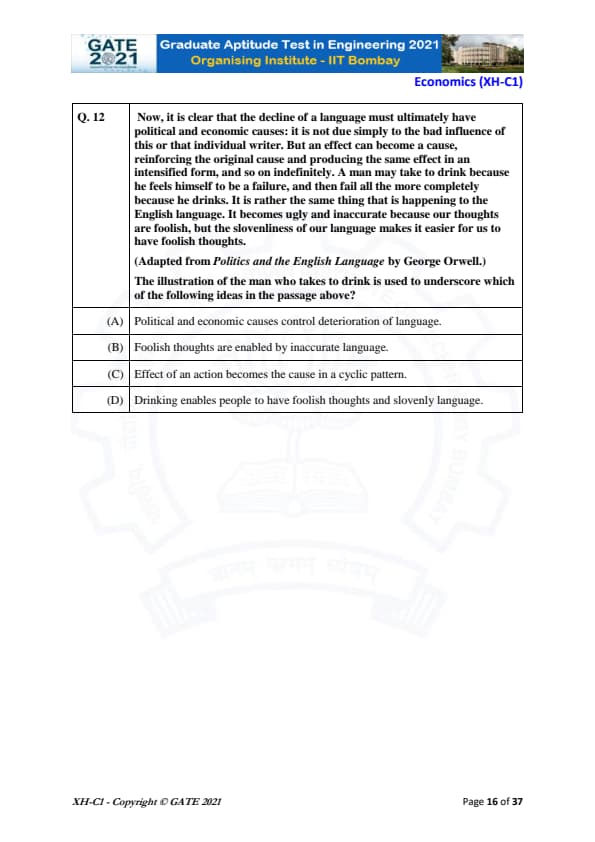


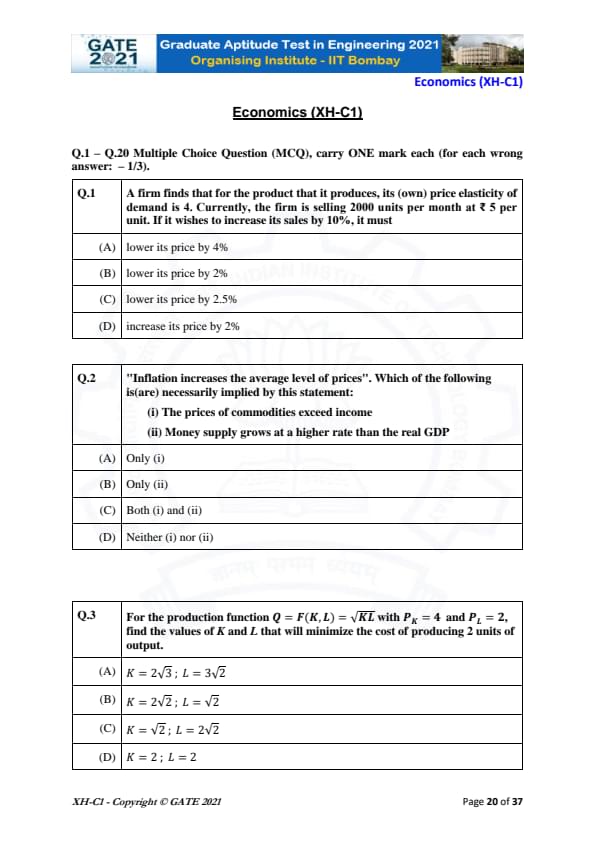
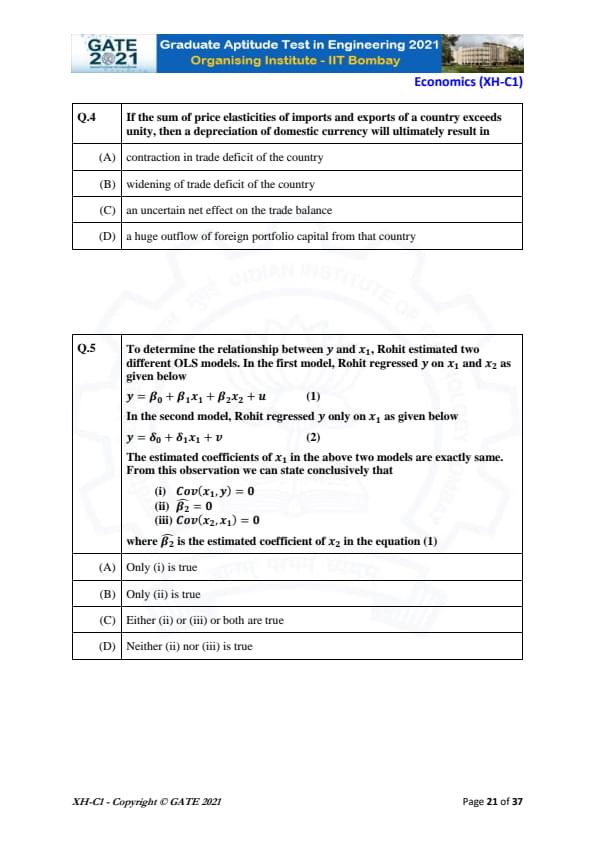
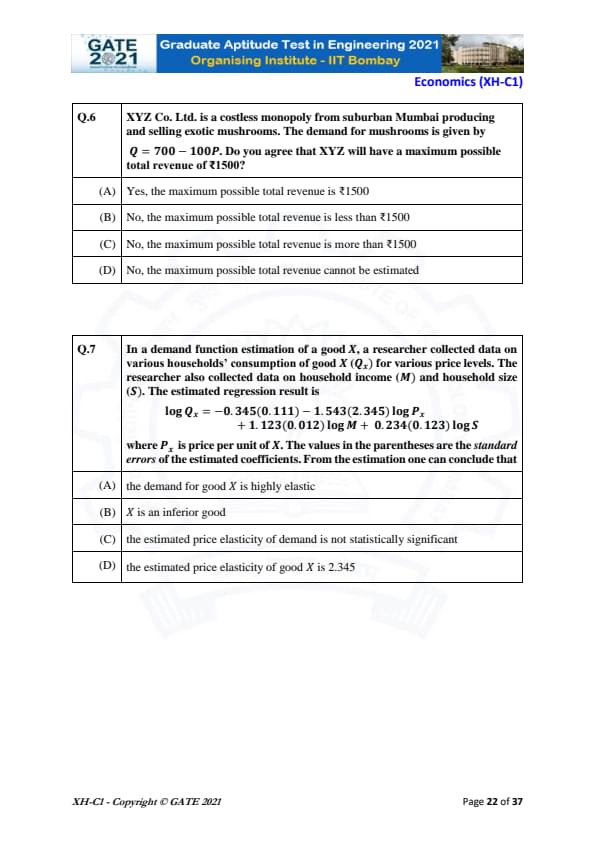

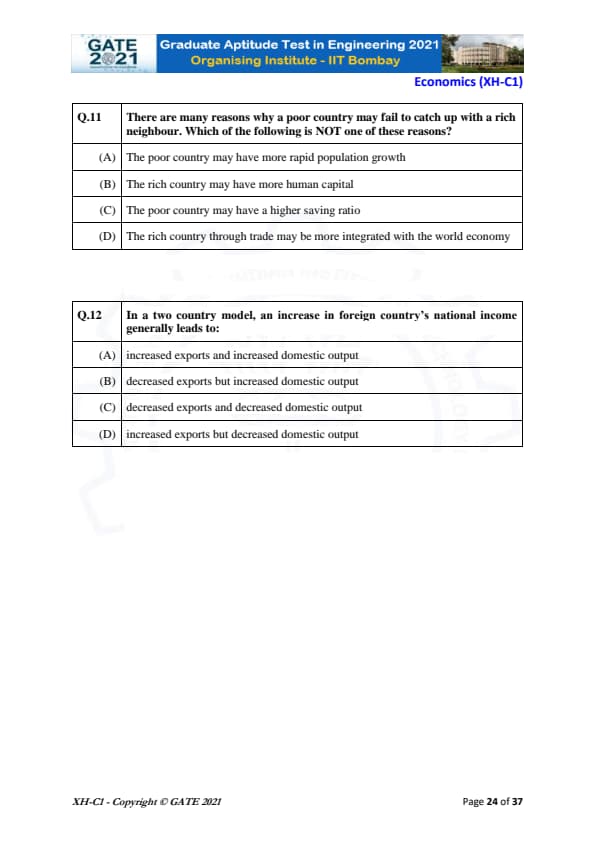
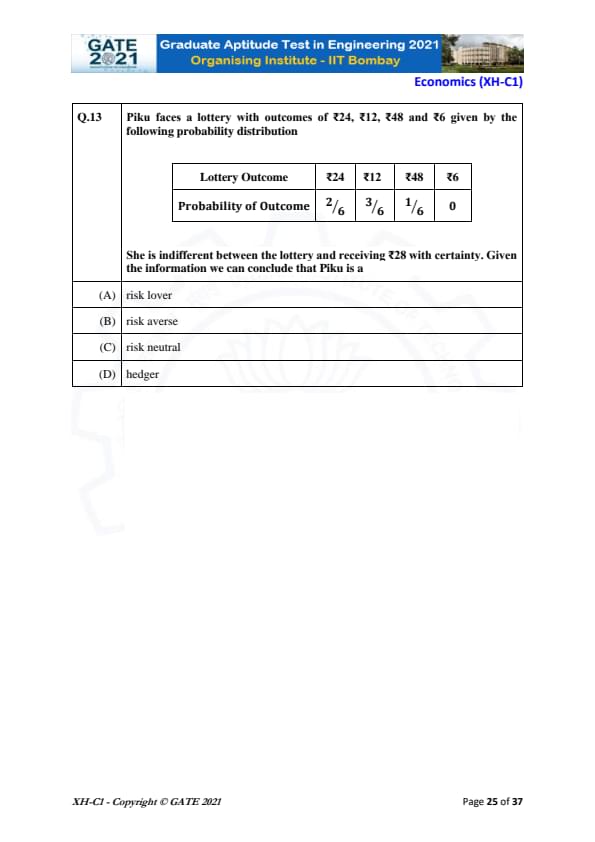
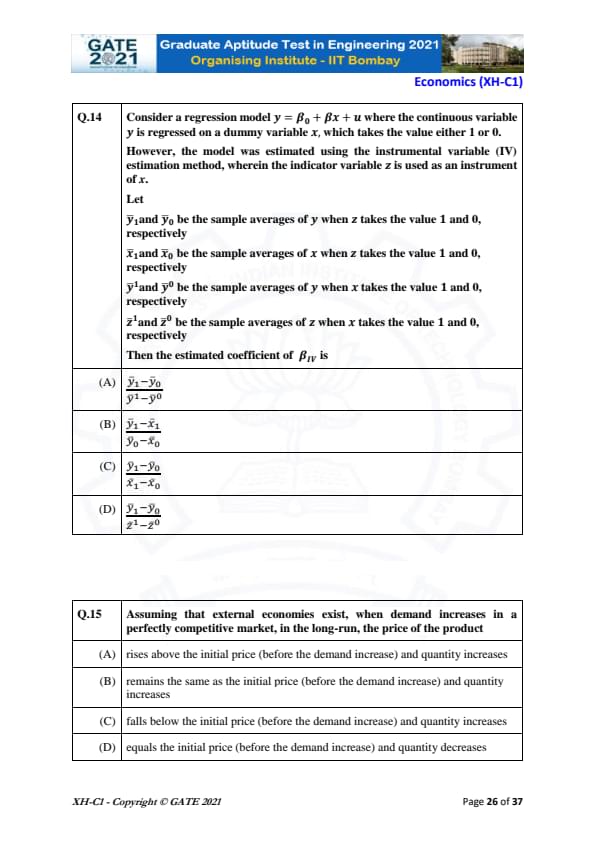
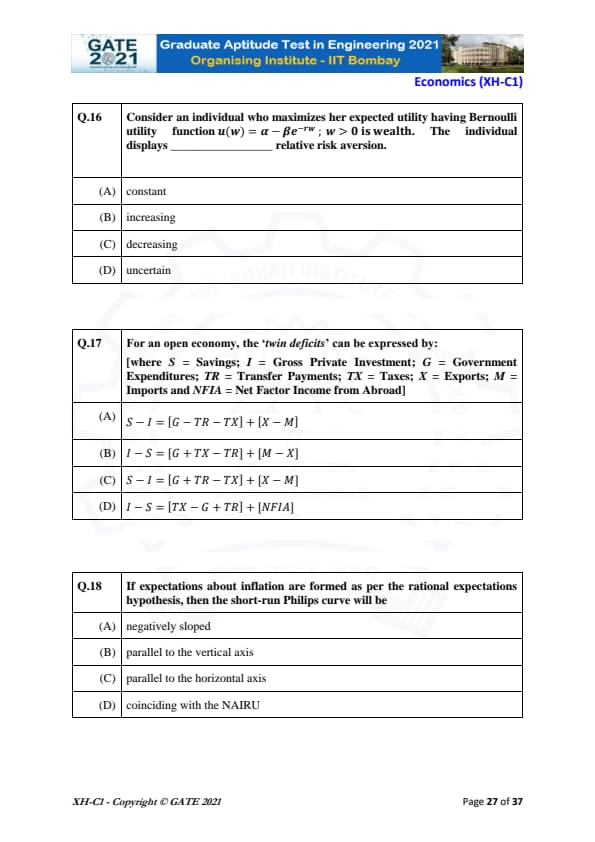

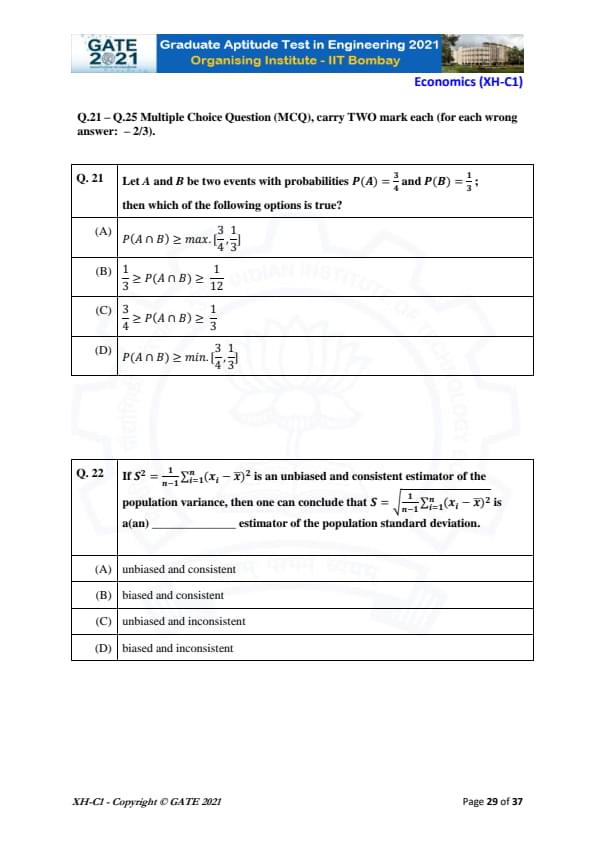
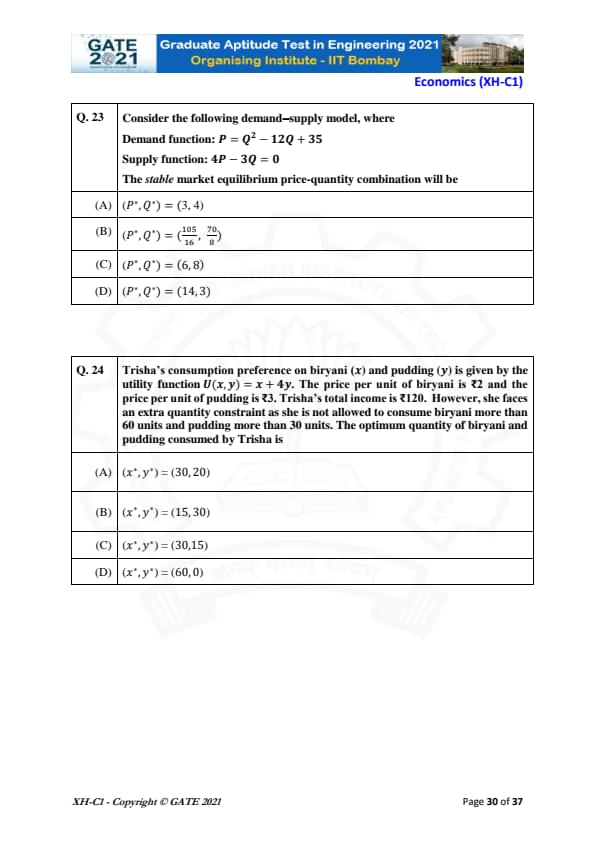


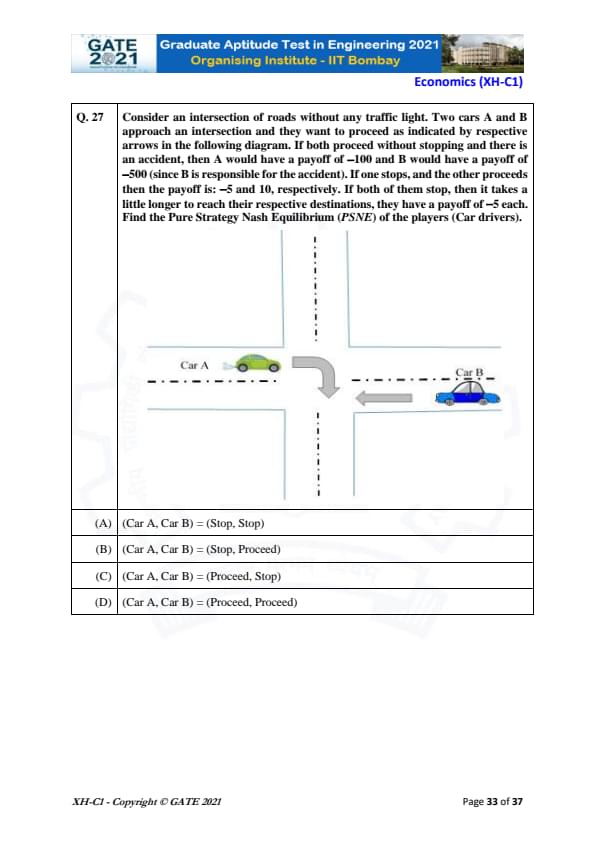


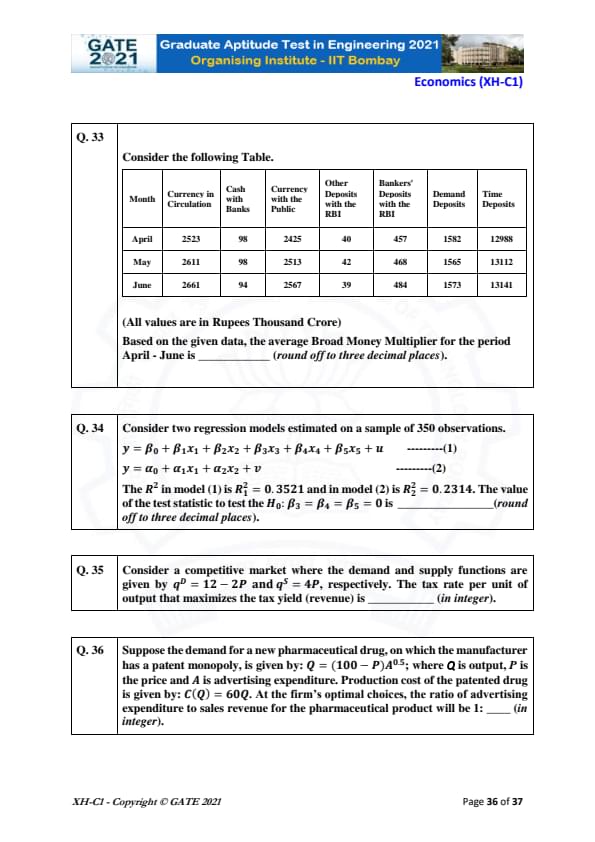
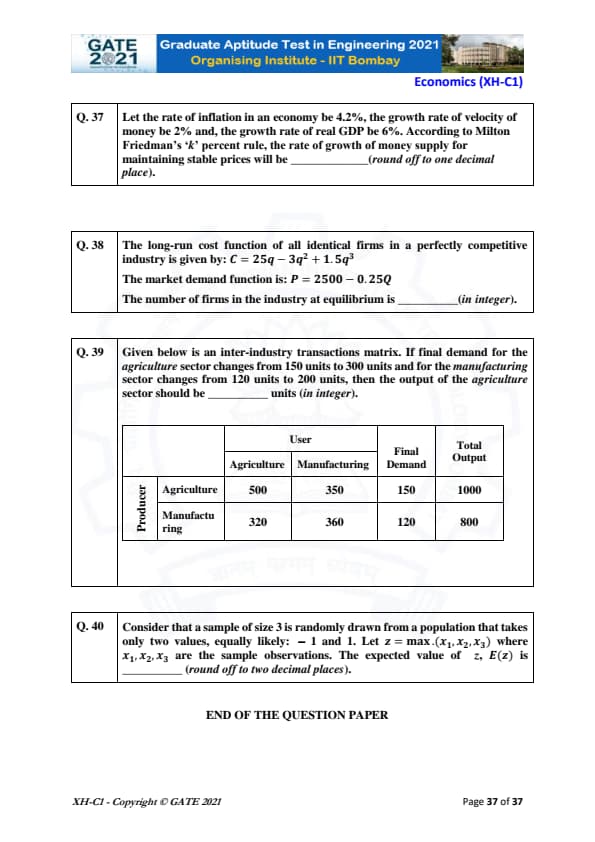


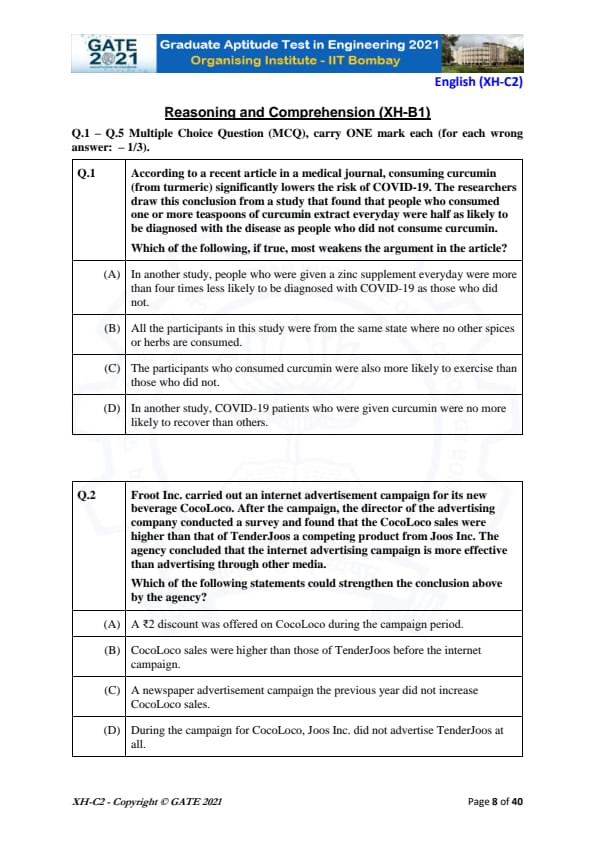


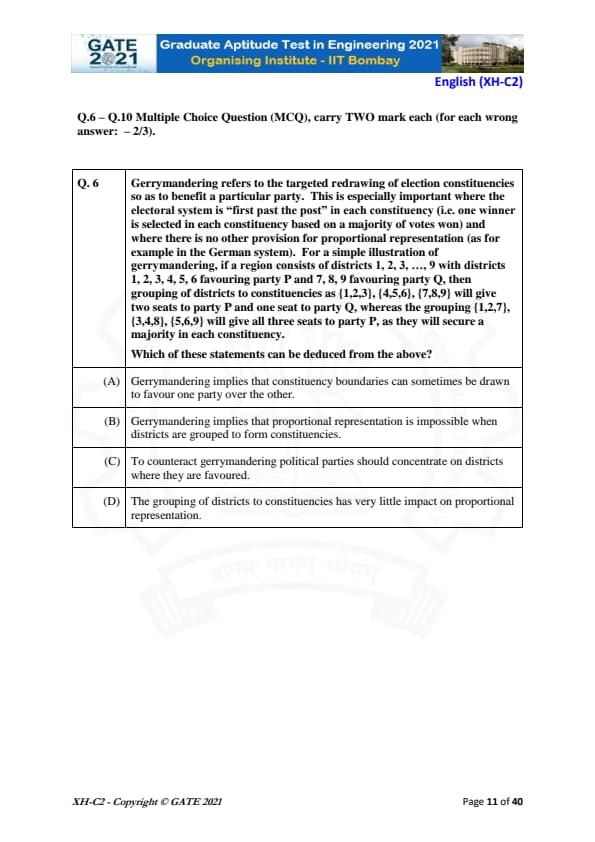


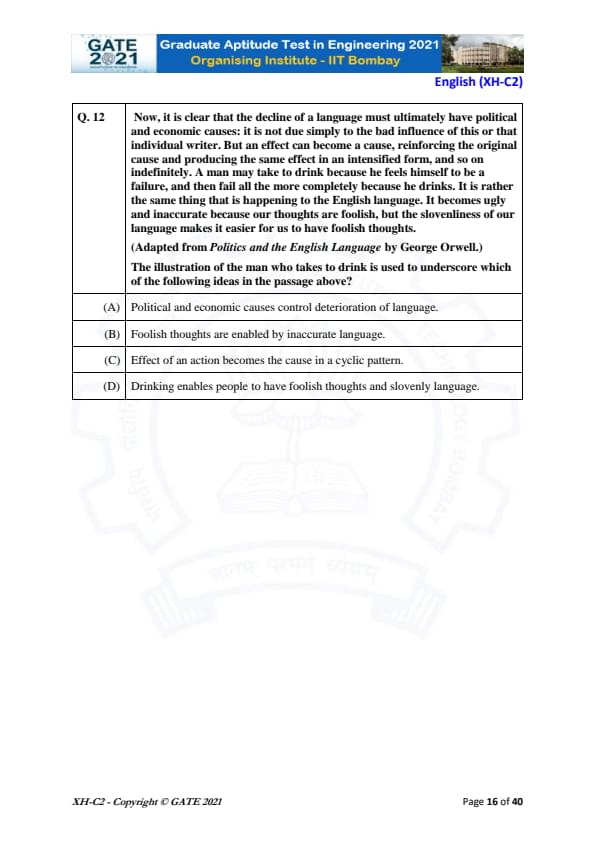


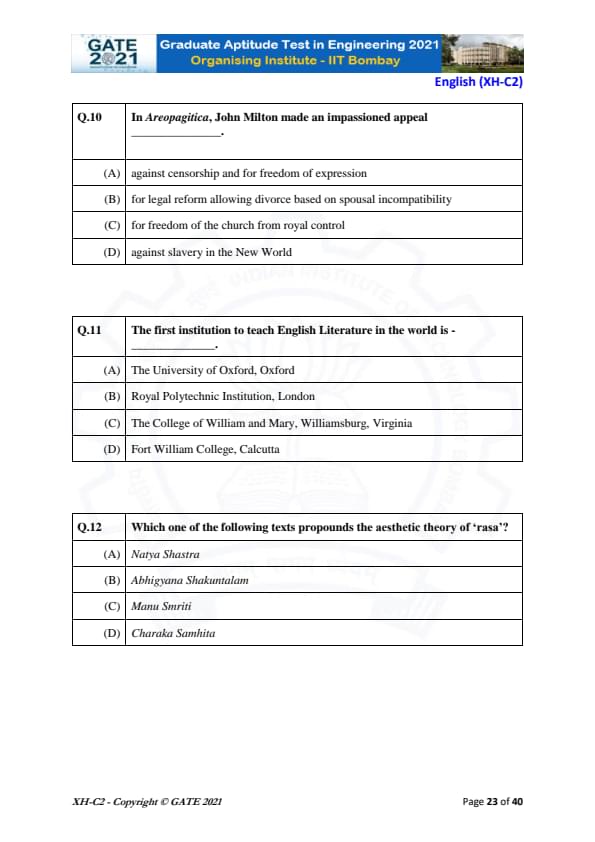
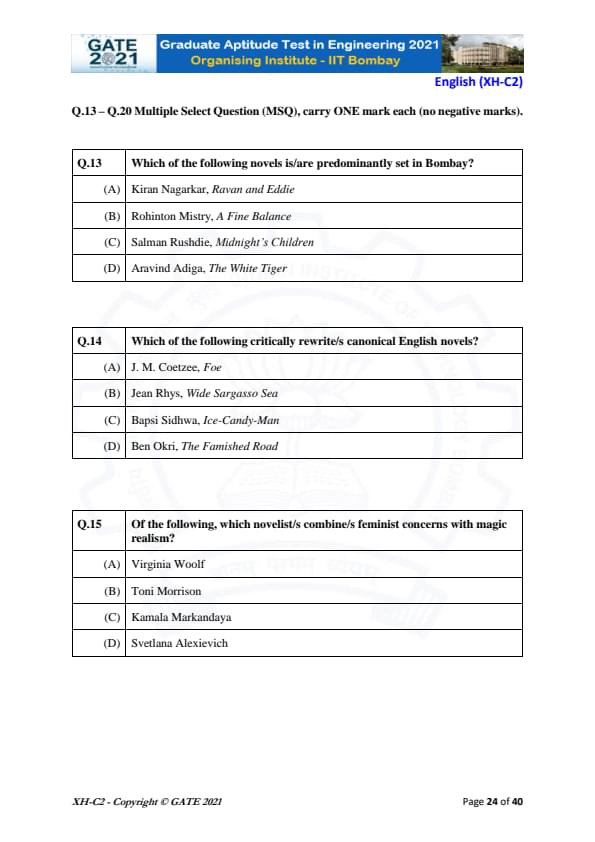
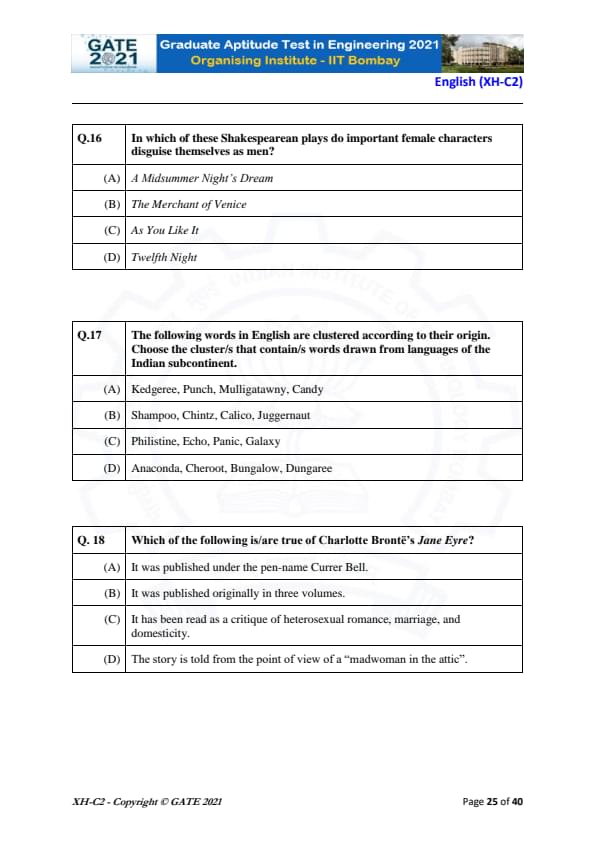


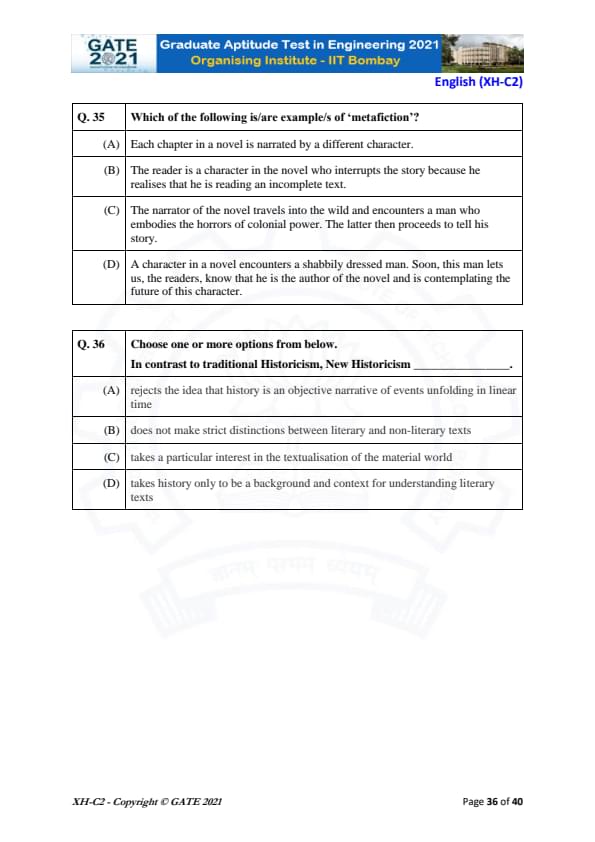

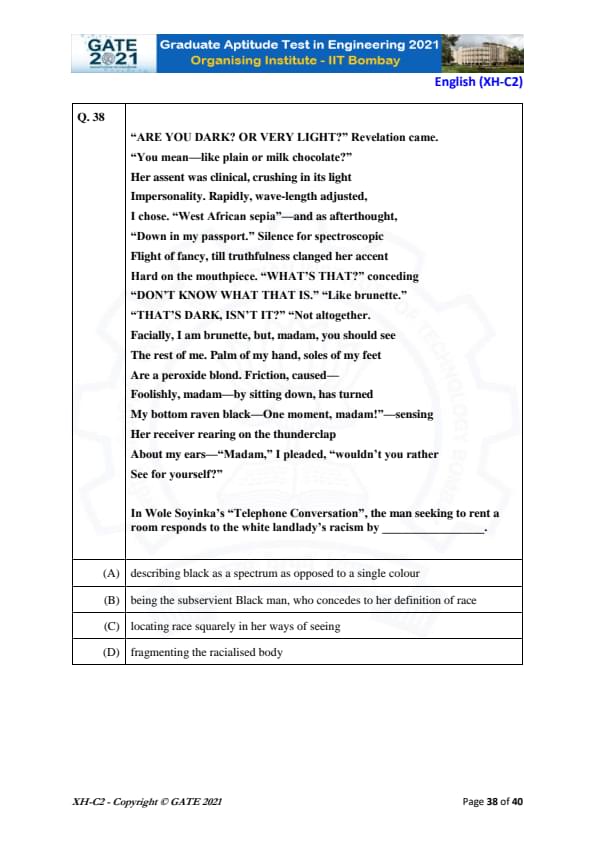


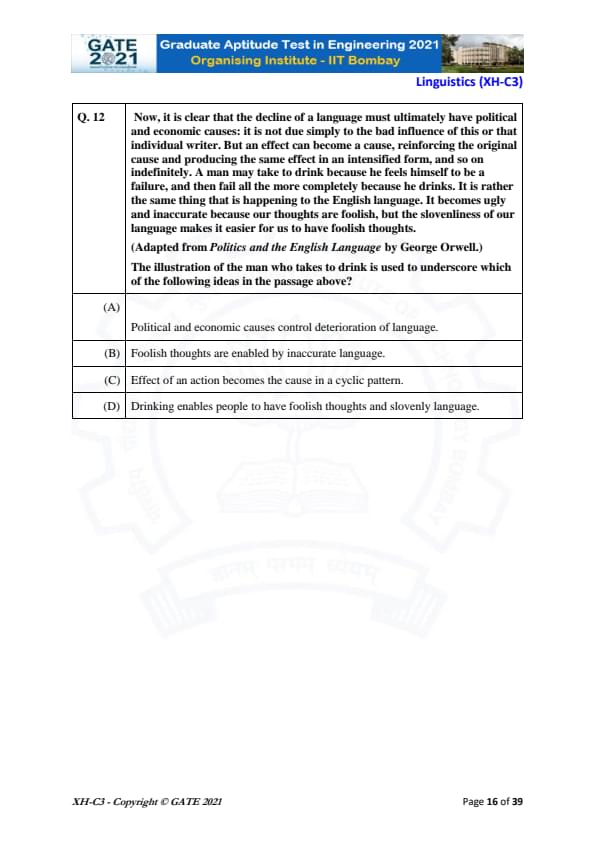


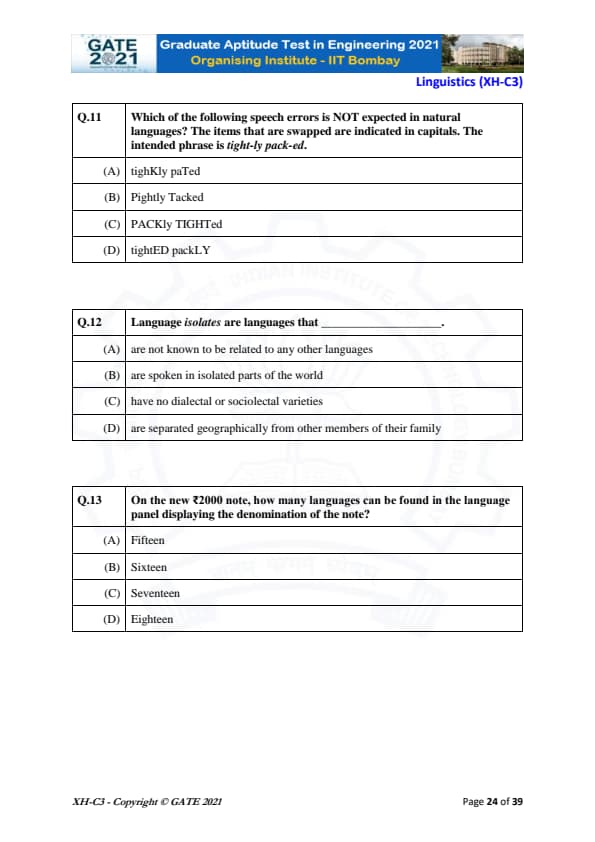


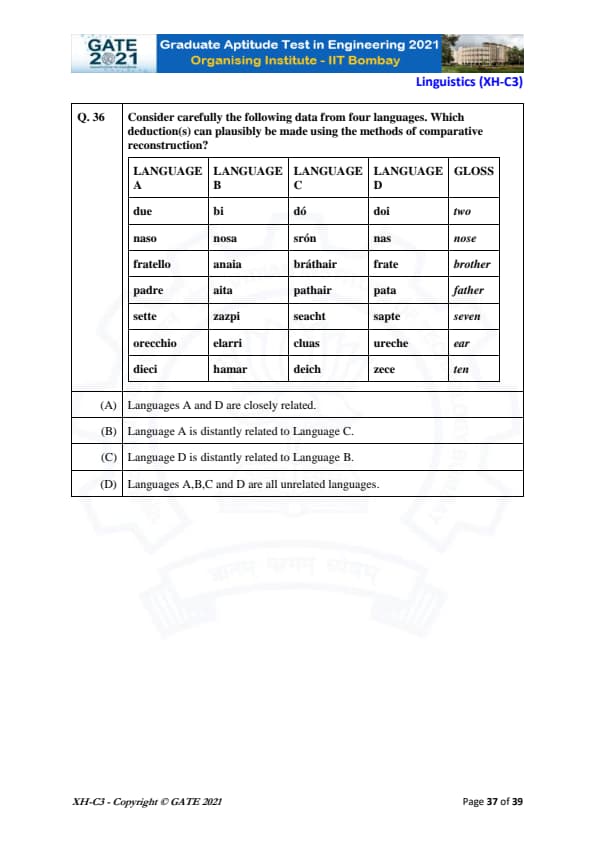
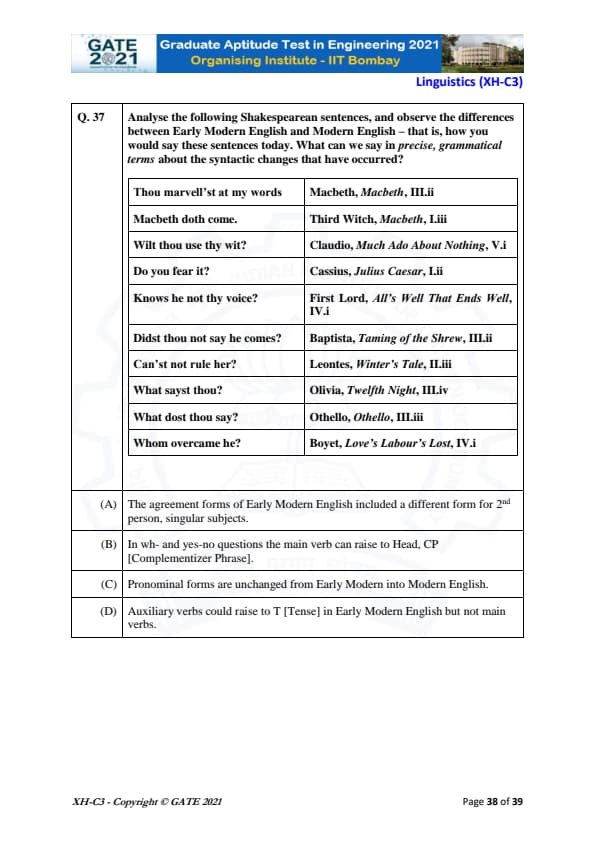
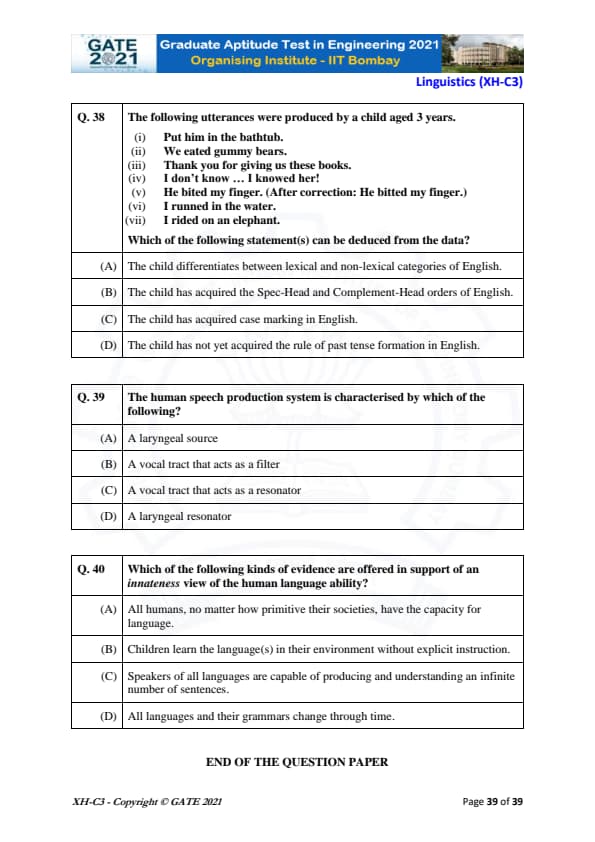


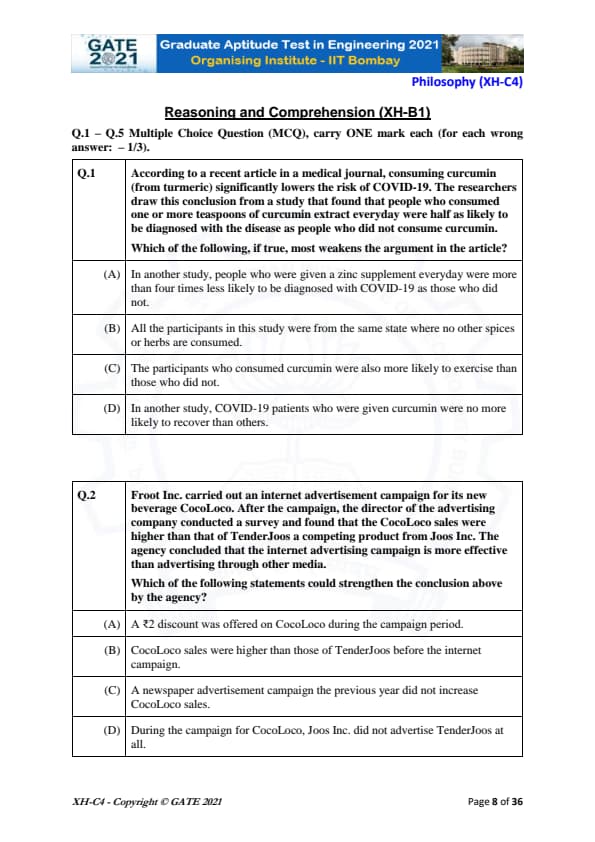


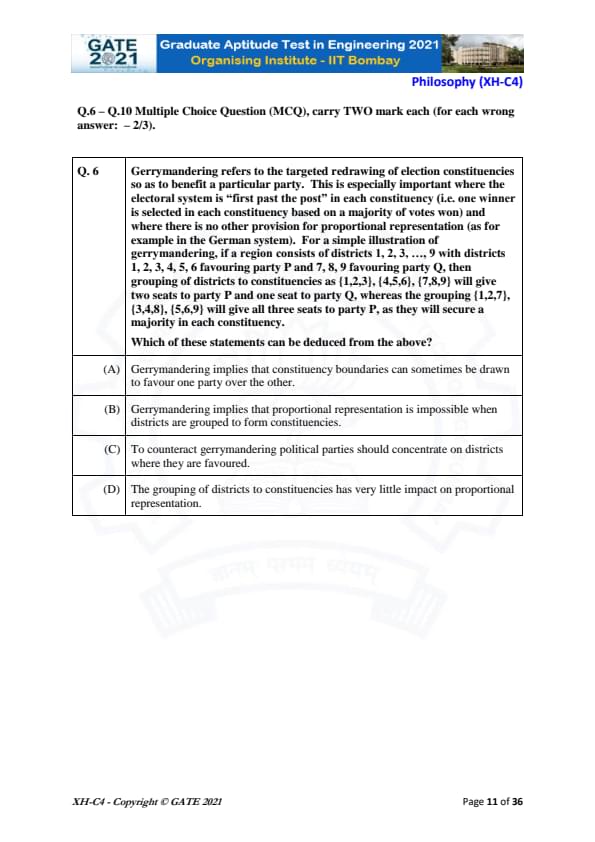


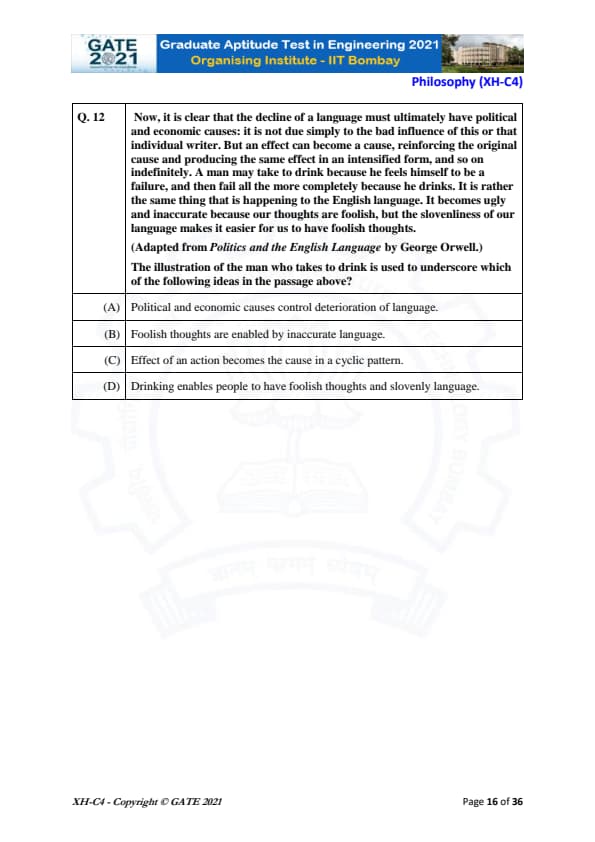


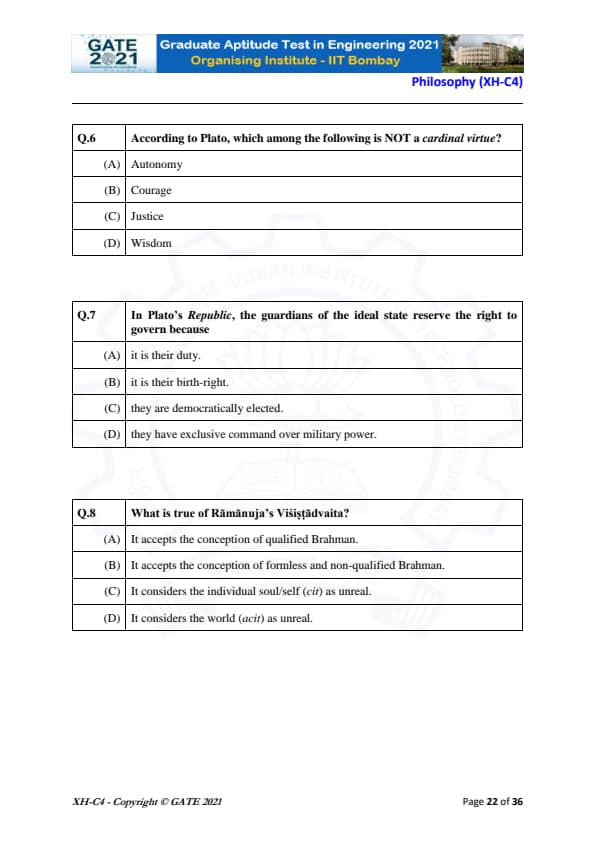


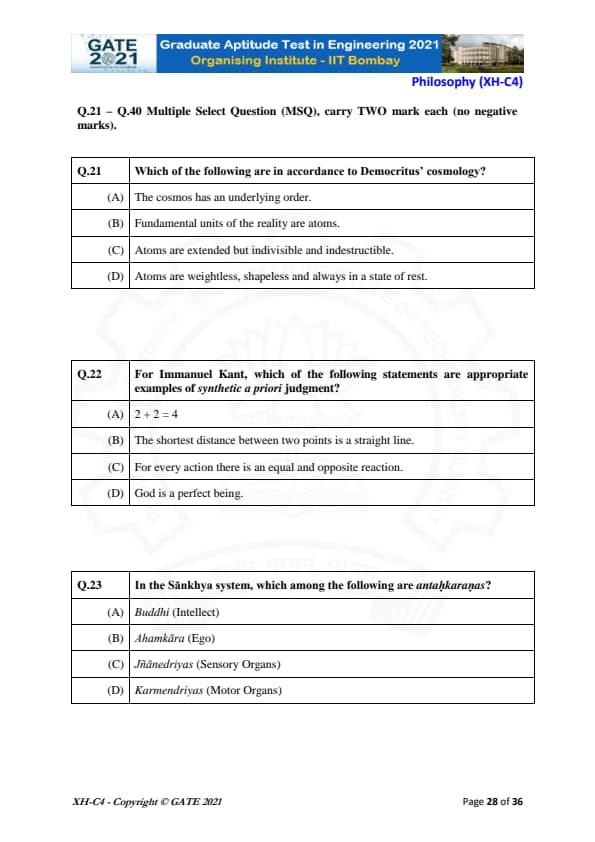


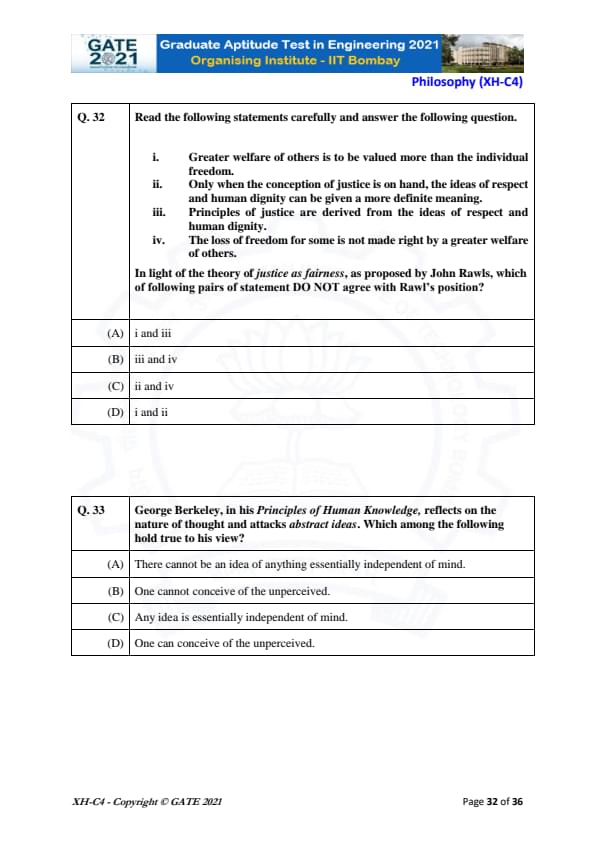


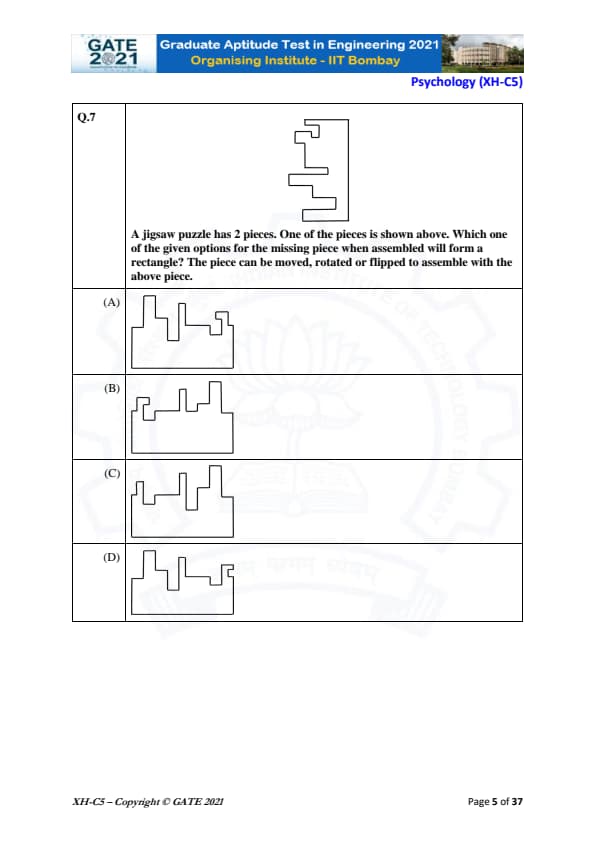
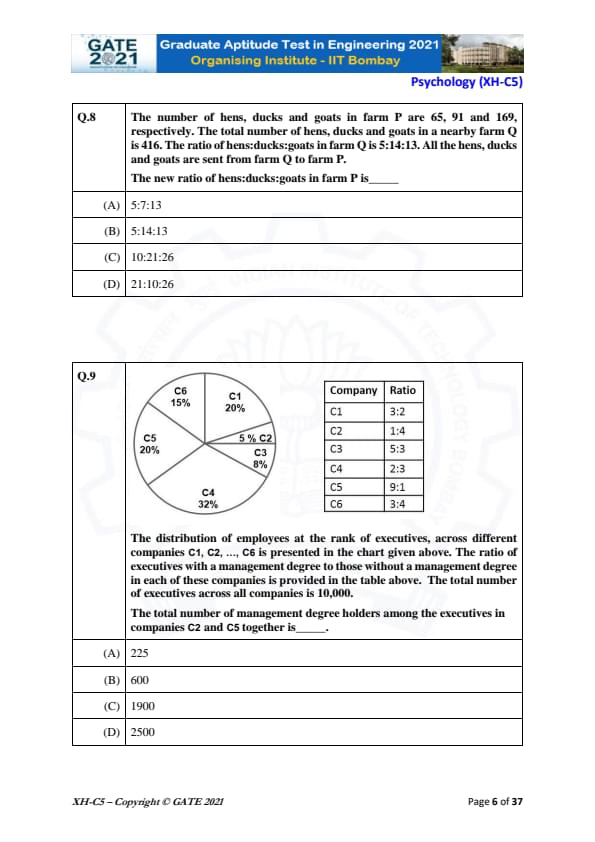


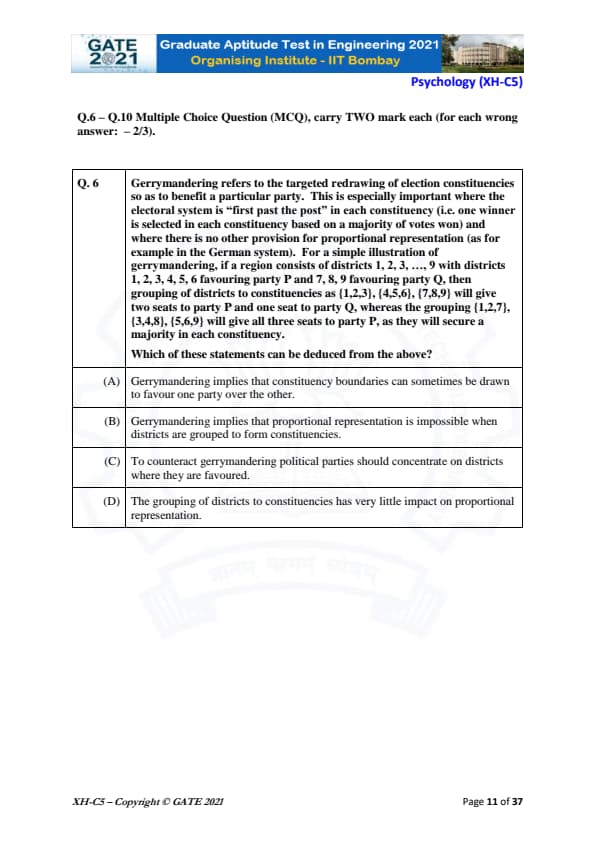


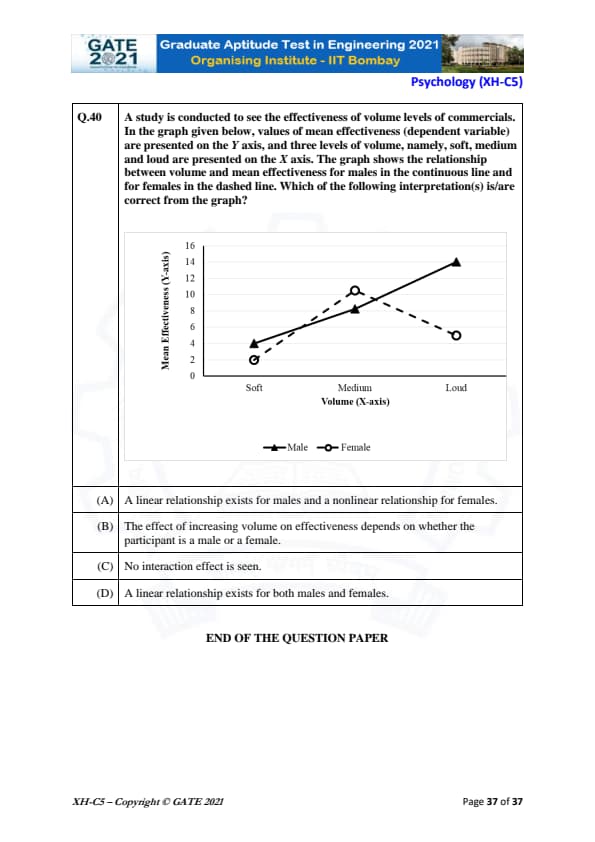


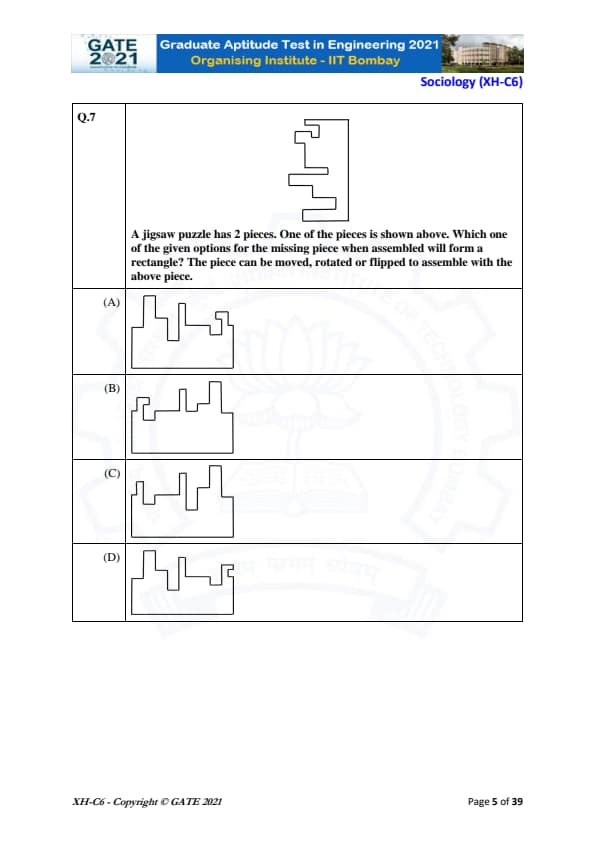


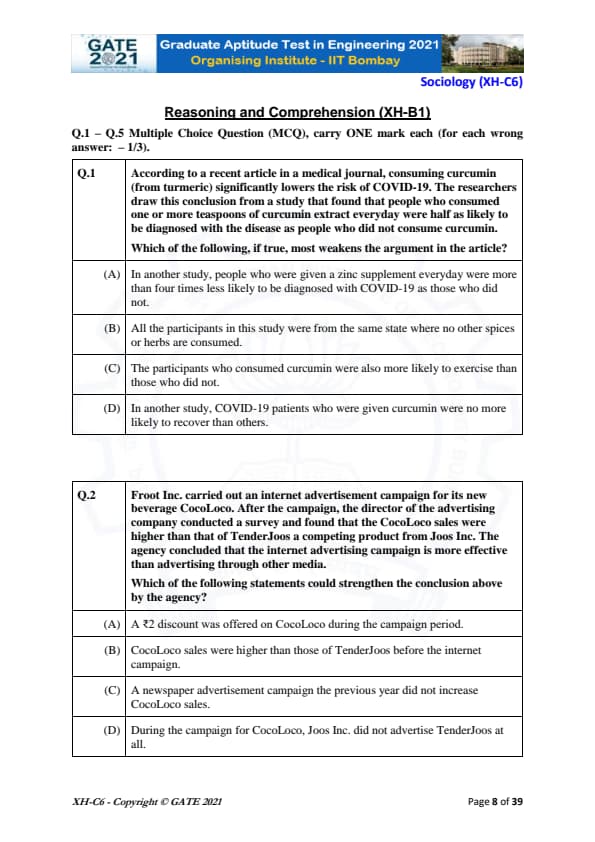


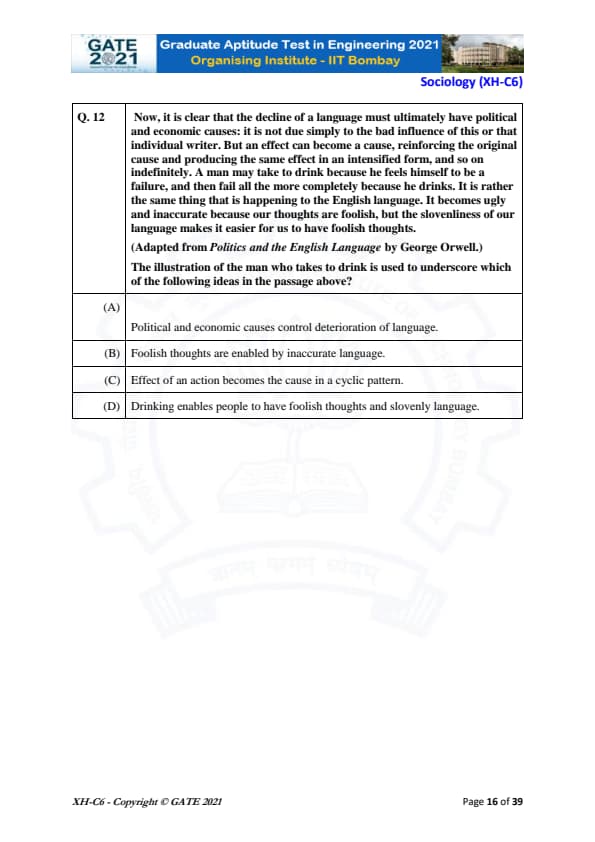


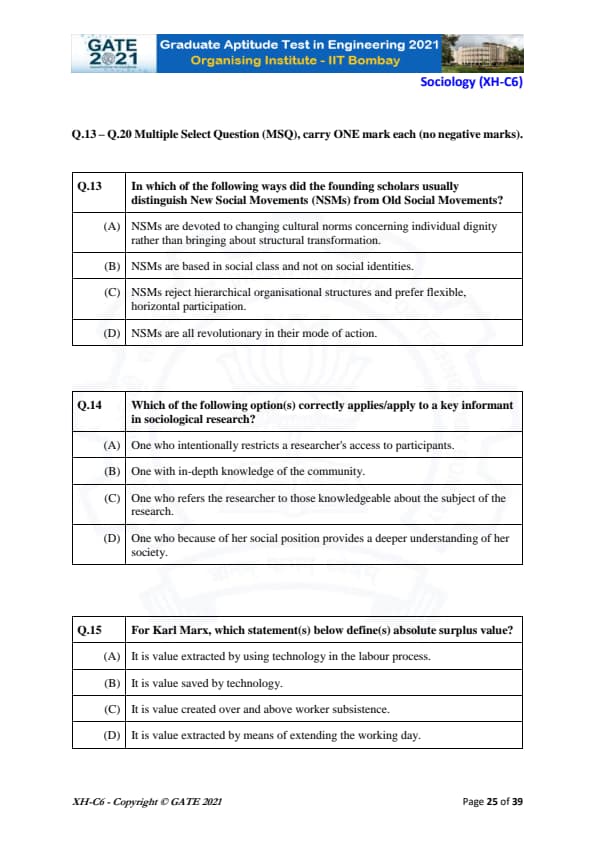

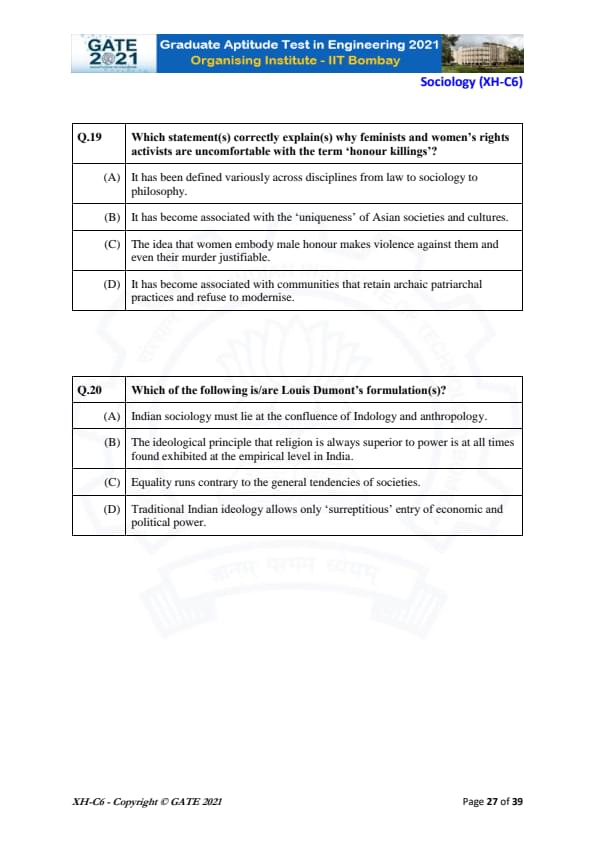

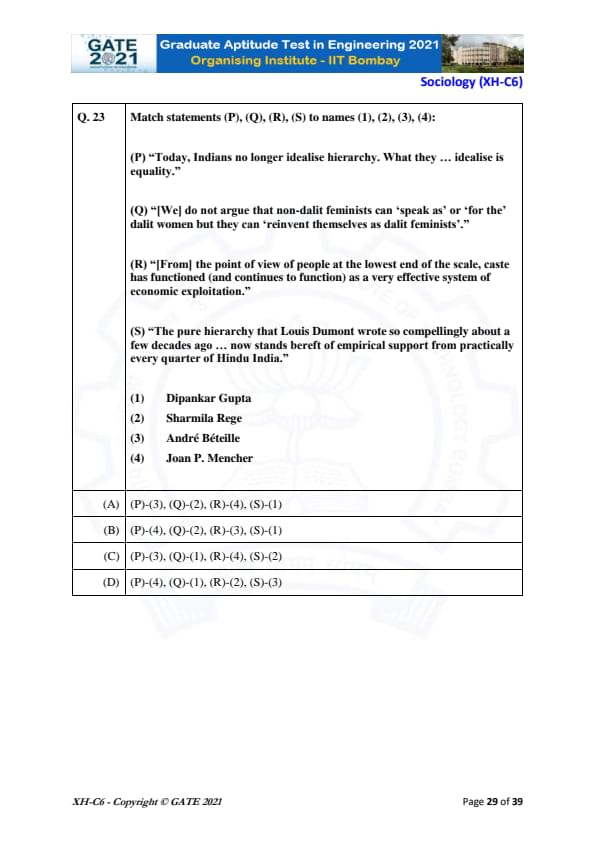


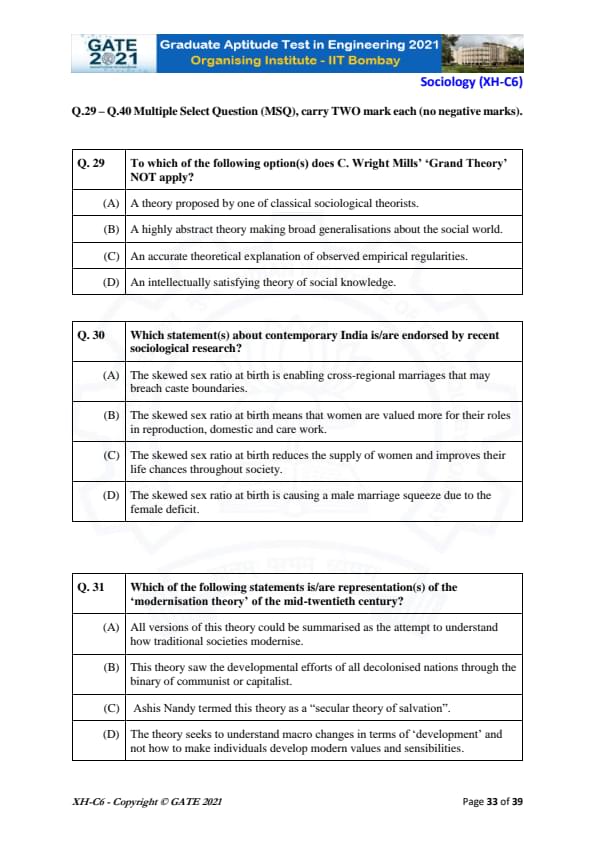


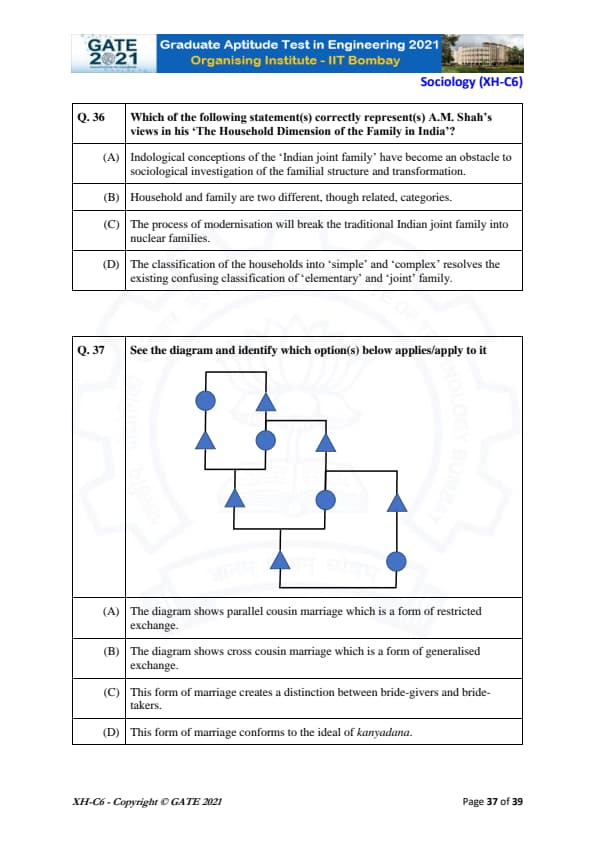

Quick Links:
GATE 2021 XH Detailed Paper Analysis
The paper was divided into three parts. The first part was dedicated to the General Aptitude. The second and third part were dedicated to reasoning and comprehension, and optional subject respectively
- The General Aptitude section carried 15 marks, distributed between 10 MCQs (each 5 questions carrying 1 mark and 2 marks respectively)
- The reasoning and comprehension section (XH-B1) carried 25 marks, comprises of 15 questions, 10 MCQs and 5 MSQs
- The MCQs carried 15 marks (5 questions carrying 1 mark and 5 questions carrying 2 marks)
- The MSQs carried 10 marks, distributed between 5 questions (2 marks each question)
- The remaining 40 questions, carrying 60 marks were related to the core optional subject
GATE 2021 XH Exam Pattern and Marking Scheme
- Candidates would require to solve 65 questions in 3 hours in GATE 2021 XH
- All the papers comprises of 65 questions (10 from General Aptitude and the other 55 from the optional subject)
- Every incorrect MCQ will cost 1 mark reduction out of the final score
- ⅓ marks would be deducted for every wrong MCQ carrying 1 mark, and ⅔ marks would be deducted for every wrong MCQ carrying 2 marks
- NATs (Numerical Answer Types) and MSQs (Multiple Select Questions) don't follow any negative marking scheme
Also Check:
GATE Previous Year Question Papers:
| GATE 2022 Question Papers | GATE 2021 Question Papers | GATE 2020 Question Papers |
| GATE 2019 Question Papers | GATE 2018 Question Papers | GATE 2017 Question Papers |
Comments