


GATE 2021 Ecology and Evolution (EY) Question Paper with Solutions PDFs can be downloaded from here. On 7th February 2021 IIT Bombay successfully conducted GATE 2021 EY in the forenoon session (9:30 AM to 12:30 PM). There were a total of 65 questions that were distributed in two sections i.e General Aptitude and core EY topics. 10 questions appeared from the General Aptitude section, holding 15% of the total weightage. The rest of the 85% were distributed between core EY topics. The overall difficulty level of the exam was Moderate.
GATE 2021 Ecology and Evolution (EY) Question Paper with Solutions
| GATE 2021 Ecology and Evolution (EY) Question Paper | Check Solutions |

The people _______ were at the demonstration were from all sections of society.
View Solution
The blank requires a relative pronoun referring to "people".
Among the options, the correct relative pronoun to refer to humans (subjects of the verb "were") is "who".
- "whose" indicates possession → incorrect.
- "which" refers to non-living things → incorrect.
- "whom" is used for objects, not subjects → incorrect.
Therefore, the correct sentence is: \[ "The people who were at the demonstration were from all sections of society." \]
Quick Tip: Use "who" for people (subject), "whom" for people (object), "which" for things, and "whose" for possession.
A transparent square sheet shown above is folded along the dotted line. The folded sheet will look like _______.


View Solution
Step 1: Identify the fold line.
The sheet is folded along the vertical dotted line, meaning the right half folds onto the left half. Because the sheet is transparent, the drawing on the right side will appear as a mirror image on the left after folding.
Step 2: Visualize the reflection.
The original figure contains a vertical line at the center and two slanted lines attached to it. When reflected across the dotted line, the right-side slanted line flips horizontally, forming a symmetric “< >” shape.
Step 3: Compare with given options.
Option (C) correctly shows the mirrored shape after folding, where the two slanted lines form a symmetric pair around the central vertical line.
Final Answer: (C)
Quick Tip: When folding transparent sheets, always reflect the figure across the fold line as if using a mirror.
For a regular polygon having 10 sides, the interior angle between the sides of the polygon, in degrees, is:
View Solution
For a regular polygon with \(n\) sides, the measure of each interior angle is given by the formula: \[ Interior angle = \frac{(n-2)\times 180^\circ}{n} \]
Substituting \(n = 10\) for a regular decagon: \[ Interior angle = \frac{(10 - 2) \times 180^\circ}{10} = \frac{8 \times 180^\circ}{10} \]
\[ = \frac{1440^\circ}{10} = 144^\circ \]
Thus, each interior angle of a regular 10-sided polygon is 144 degrees. Quick Tip: Memorize: A regular polygon with more sides always has larger interior angles; formula = \(\frac{(n-2)180}{n}\).
Which one of the following numbers is exactly divisible by \(\left(11^{13}+1\right)\)?
View Solution
We need to determine which expression is divisible by: \[ 11^{13} + 1 \]
This is a classic number theory pattern based on factorization identities:
\[ a^m - 1 is divisible by a^n - 1 if n \mid m \]
and \[ a^{2k} - 1 = (a^k - 1)(a^k + 1) \]
Since the expression to divide is \(11^{13}+1\), notice:
\[ 11^{26} - 1 = (11^{13}-1)(11^{13}+1) \]
Thus, anything of the form \(11^{26k} - 1\) is divisible by \((11^{13}+1)\).
Check option (D):
\[ 11^{52}-1 = 11^{4\times 13} - 1 \]
Since 13 divides 52, \[ 11^{52} - 1 is divisible by 11^{13} - 1 and also by 11^{13} + 1 \]
Thus option (D) is exactly divisible by \(11^{13} + 1\).
Other options fail because:
- (A) is \(11^{26}+1\) → not divisible
- (B) \(11^{33}+1\) wrong sign
- (C) \(11^{39}-1\), exponent 39 not divisible by 26 or 13
Hence, only Option (D) is correct. Quick Tip: Use exponent divisibility: \(a^m - 1\) is divisible by both \((a^k-1)\) and \((a^k+1)\) if \(m = 2k\).
Oasis is to sand as island is to _____. Which one of the following options maintains a similar logical relation in the above sentence?
View Solution
The analogy compares an object with the environment that surrounds it:
- An oasis is a region of water and vegetation that appears within a surrounding region of sand (desert).
Thus: \[ oasis : sand \]
Similarly:
- An island is a region of land that is fully surrounded by water.
Thus: \[ island : water \]
This gives the same relationship pattern.
Check other options:
- Stone → does not surround an island
- Land → the opposite (an island itself is land)
- Mountain → unrelated
Hence the correct analogy match is Water. Quick Tip: When solving analogies, identify the environmental or containment relationship, not physical similarity.
The importance of sleep is often overlooked by students when they are preparing for exams. Research has consistently shown that sleep deprivation greatly reduces the ability to recall the material learnt. Hence, cutting down on sleep to study longer hours can be counterproductive.
Which one of the following statements is the CORRECT inference from the above passage?
View Solution
The passage emphasizes that lack of sleep harms memory recall and that reducing sleep to study longer is counterproductive.
Step 1: Identify the key idea.
The passage does not claim that sleep alone is enough, nor that students are correct in thinking sleep is a waste. It also does not say that well-prepared students need no sleep.
Step 2: Choose the inference.
The only statement that aligns with the author’s conclusion is that proper sleep must be included as part of exam preparation.
Final Answer: (D)
Quick Tip: When a passage stresses consequences of ignoring something, the valid inference usually includes that element as essential.
In the figure, each inside square is formed by joining the midpoints of the sides of the next larger square. The area of the smallest shaded square is to be found. The outermost square has a side length of 10 cm.

View Solution
Joining midpoints of a square forms a new square whose area is exactly half of the previous square.
Step 1: Area of the outermost square.
Side = 10 cm → Area = \(10^2 = 100\) cm².
Step 2: Area ratio for midpoint-joined squares.
Each new square = \( \frac{1}{2} \) × area of previous square.
Thus areas form the sequence: \[ 100,\; 50,\; 25,\; 12.5,\; 6.25,\; 3.125,\; \dots \]
Step 3: Identify the smallest shaded square.
According to the diagram, the smallest (innermost) shaded square corresponds to \[ 100 \times \left(\frac{1}{2}\right)^5 = 3.125. \]
Final Answer: 3.125
Quick Tip: Joining midpoints of a square always produces a new square with exactly half the area of the previous one.
Let \(X\) be a continuous random variable denoting the temperature measured.
The range of temperature is \([0, 100]\) degree Celsius and the probability density function of \(X\) be \(f(x) = 0.01\) for \(0 \le X \le 100\).
The mean of \(X\) is _______
View Solution
Step 1: Identify the PDF.
The PDF is constant: \[ f(x) = 0.01,\quad 0 \le x \le 100. \]
Step 2: Compute the mean of a uniform distribution.
A constant PDF over \([0,100]\) means \(X\) is uniform on \([0,100]\).
Mean of uniform distribution is: \[ E[X] = \frac{a + b}{2} = \frac{0 + 100}{2} = 50. \]
Step 3: Final conclusion.
Thus, the mean is: \[ \boxed{50} \] Quick Tip: A constant PDF over an interval always represents a uniform distribution; its mean is simply the midpoint.
The number of students passing or failing in an exam are shown in the bar chart.
Students who pass do not appear again.
Students who fail must reappear the next year and always pass in their second attempt.
Find the number of students who took the exam for the first time in Year 2 and Year 3.

View Solution
Step 1: Use Year 1 data.
Year 1: Pass = 50, Fail = 10.
Thus 10 failed students must appear again in Year 2.
Step 2: Use Year 2 totals.
Year 2: Pass = 60, Fail = 5 → total = 65.
Since 10 are repeaters: \[ New students in Year 2 = 65 - 10 = 55. \]
Step 3: Use Year 3 data.
Year 2 failures = 5 → these 5 must appear again in Year 3.
Year 3: Pass = 50, Fail = 3 → total = 53.
Thus new students in Year 3: \[ 53 - 5 = 48. \]
Step 4: Final result.
Number of first-time candidates:
Year 2 → 55
Year 3 → 48 Quick Tip: Always subtract repeaters (previous year fails) from the total strength to find new candidates.
Seven cars P, Q, R, S, T, U and V are parked in a row not necessarily in that order.
The cars T and U should be parked next to each other.
The cars S and V also should be parked next to each other, whereas P and Q cannot be parked next to each other.
Q and S must be parked next to each other.
R is parked to the immediate right of V.
T is parked to the left of U.
Based on the above statements, the only INCORRECT option is:
View Solution
Step 1: Grouping mandatory pairs.
Q must be next to S, so QS or SQ is a block.
S must also be next to V → the only possible chain is: \[ Q - S - V \]
Step 2: Placement of R.
R is immediately to the right of V: \[ Q - S - V - R \]
Step 3: Placement of T and U.
T must be to the left of U and must be adjacent: \[ T - U \]
Step 4: Remaining car P.
P cannot be next to Q, so P must be placed on the far right end: \[ Q - S - V - R - T - U - P \]
This arrangement satisfies all constraints.
Step 5: Checking the options.
(A) “There are two cars between Q and V.”
Actual positions: Q(1), S(2), V(3).
There are zero cars between Q and V.
So (A) is incorrect.
(B), (C), (D) are all consistent with the valid arrangement.
Hence, option (A) is the only incorrect statement.
Quick Tip: Always place forced adjacency pairs first, then apply directional rules (left/right), and finally place restricted cars last.
Animal species can vary in whether dispersal is more likely among male offspring (male-biased), female offspring (female-biased), or similar between the sexes. Dispersal in birds and mammals is most commonly:
View Solution
Dispersal patterns in animals, particularly in birds and mammals, can be influenced by various ecological and evolutionary factors.
Step 1: Understand dispersal patterns.
In birds, it is common for males to disperse more frequently than females. This is thought to be due to females remaining close to their natal territory to facilitate reproduction and maintain access to resources.
In mammals, it is the opposite: females often remain close to their birthplace, while males tend to disperse to avoid inbreeding and establish their own territories.
Step 2: Match the answer.
- Female-biased dispersal in birds and male-biased dispersal in mammals is the typical pattern observed. Thus, option (A) is correct.
Step 3: Conclusion.
The correct answer is (A) because it accurately reflects the common dispersal patterns in birds and mammals.
Quick Tip: Dispersal patterns are typically influenced by mating systems and resource availability, which differ between species.
Of the following, which one is the most direct measure of Darwinian fitness?
View Solution
Darwinian fitness refers to an individual's ability to survive and reproduce in its environment, contributing to the gene pool of the next generation.
Step 1: Understand Darwinian fitness.
Fitness is most directly measured by the number of viable offspring an individual produces that survive to reproduce. This is known as lifetime reproductive success.
Step 2: Evaluate options.
- Option (A): Adult body size may correlate with fitness but is not a direct measure of reproductive success.
- Option (B): Lifetime reproductive success is the most direct measure, as it directly quantifies the number of offspring produced.
- Option (C): Lifespan alone does not indicate reproductive success. An individual may live long but produce few offspring.
- Option (D): Maximum sprint speed is unrelated to overall reproductive success or fitness in terms of gene contribution.
Step 3: Conclusion.
The most direct measure of Darwinian fitness is lifetime reproductive success, making option (B) the correct answer.
Quick Tip: Darwinian fitness is best measured by the number of offspring an individual produces that survive and reproduce, not by physical traits like size or speed.
The marginal value theorem in optimal foraging theory examines which one of the following foraging decisions?
View Solution
The Marginal Value Theorem (MVT) is a central concept in optimal foraging theory, which was formulated by Eric Charnov in 1976. This theorem helps explain the foraging decisions of animals, particularly the time spent in each foraging patch, which ultimately impacts their overall energy intake. The goal is to maximize energy gain while minimizing the costs associated with foraging.
The key idea behind MVT is that animals, while foraging, must decide how long to stay in a specific food patch. The optimal time to leave a patch depends on the diminishing returns from foraging in that patch. As time passes, the rate of energy gain from the patch decreases. The optimal strategy, according to MVT, is to stay in a patch as long as the marginal benefit (additional food collected) from the patch exceeds the marginal cost (energy spent). Once the returns from the patch decrease to the average rate of return in the environment, the animal should leave the patch and search for a new one.
This decision directly addresses the question of how long to stay in a patch of food, which is the primary focus of the marginal value theorem. Therefore, the correct answer is (A).
Quick Tip: Marginal Value Theorem: Foragers should stay longer in patches with higher food availability but leave when returns start to decrease.
Which one of the following shows the highest degree of endemism?
View Solution
Endemism refers to the ecological state of a species being native and restricted to a particular geographic area. Endemic species are typically found only in one location in the world and nowhere else. This phenomenon is especially prominent in regions with unique geographical features, such as mountain ranges, isolated islands, and biogeographical hotspots.
Among the options provided, the Western Ghats is one of the biodiversity hotspots in India, and it shows a particularly high degree of endemism, especially among amphibians, such as frogs. Approximately 30% of the frog species in the Western Ghats are endemic to the region, meaning they are not found anywhere else in the world. This makes the Western Ghats one of the most important areas for frog conservation, and it has a significantly higher degree of endemism compared to other regions.
In contrast, while the Himalayas have a number of endemic bird species, the degree of endemism in birds is lower compared to that of amphibians in the Western Ghats. Similarly, mammals of central India and trees of the Gangetic basin also show some degree of endemism, but the Western Ghats stands out due to the large number of species, particularly amphibians, that are endemic to the region.
Thus, frogs of the Western Ghats exhibit the highest degree of endemism, making option (C) the correct answer.
Quick Tip: The Western Ghats are a biodiversity hotspot with a high degree of amphibian endemism, especially frogs.
Which one of the following Mendelian disorders is influenced by diet?
View Solution
Phenylketonuria (PKU) is a genetic disorder caused by mutations in the gene encoding the enzyme phenylalanine hydroxylase. This enzyme normally converts phenylalanine, an amino acid found in many foods, into another amino acid called tyrosine. In individuals with PKU, this enzyme is deficient or absent, leading to the accumulation of phenylalanine in the blood and tissues.
[6pt]
If PKU is left untreated, the elevated phenylalanine levels can cause severe intellectual disabilities, brain damage, seizures, and other neurological symptoms. However, the condition can be managed with a strict diet that limits phenylalanine intake. This dietary restriction typically includes avoiding high-protein foods such as meat, dairy, and eggs, which contain high levels of phenylalanine. Patients with PKU are also given a special low-phenylalanine medical formula to ensure they receive adequate nutrition. This demonstrates that diet plays a crucial role in the management of PKU.
[6pt]
Other disorders listed do not have a similar direct dietary influence:
[6pt]
- Cystic fibrosis: This is a genetic disorder that affects the lungs, pancreas, liver, and intestines. It causes the production of thick, sticky mucus, leading to respiratory and digestive issues. While diet can support treatment (e.g., enzyme supplements and a high-calorie diet), it is not directly influenced by diet in the same way PKU is.
[6pt]
- Haemophilia: Haemophilia is a genetic disorder where blood does not clot properly due to a deficiency of clotting factors. Although proper nutrition can aid in overall health, haemophilia is not directly influenced by diet.
[6pt]
- Thalassemia: Thalassemia is a blood disorder characterized by the abnormal production of hemoglobin. It can be managed through blood transfusions and iron chelation therapy, but it is not influenced by diet in the same way PKU is.
Quick Tip: For PKU, strict dietary control is essential to prevent harmful neurological effects due to phenylalanine buildup.
Which one of the following mammalian DNA regions exhibits the highest level of sequence variation?
View Solution
The mitochondrial D-loop region (option C) is known to exhibit the highest level of sequence variation among mammalian DNA regions. This region is part of the mitochondrial genome and plays a key role in regulating mitochondrial DNA replication and transcription. It is highly variable because it is involved in the control of mitochondrial gene expression and replication, and it accumulates mutations more quickly than other regions of the genome. This high mutation rate has made the D-loop a valuable tool for studying evolutionary relationships, genetic diversity, and population genetics. The D-loop region is often used in forensic and anthropological studies to trace maternal lineage due to its variability.
[6pt]
In contrast, other regions listed have lower sequence variation:
[6pt]
- Homeobox transcription factor binding domain (option A): Homeobox genes are important for regulating early development in organisms, particularly in pattern formation. The homeobox transcription factor binding domain is relatively conserved because these genes are critical for proper development and any mutation could result in severe developmental abnormalities. Therefore, it does not exhibit the high level of sequence variation seen in the mitochondrial D-loop region.
[6pt]
- Hox genes (option B): Hox genes, which are a group of related genes that control the body plan of an embryo along the anterior-posterior axis, are also relatively conserved. While mutations in Hox genes can lead to major developmental changes, the sequence variation within these genes is not as high as in the mitochondrial D-loop. Hox genes are highly conserved across species due to their fundamental role in development.
[6pt]
- Histone protein-encoding genes (option D): Histone proteins are key components of chromatin and play an essential role in DNA packaging and regulation. The genes encoding histones are highly conserved, as any significant variation in these genes could disrupt cellular function. Histones are under selective pressure to remain stable, which limits the level of sequence variation within histone-encoding genes.
Quick Tip: The mitochondrial D-loop region is highly variable and is used in studies of evolutionary genetics, population diversity, and forensic analysis.
Which one of the following makes a species most vulnerable to extinction?
View Solution
We are given the options related to species vulnerability to extinction. The most important factors influencing extinction risk include geographic range, population density, and habitat specificity.
Step 1: Understanding the factors.
Species with a small geographic range and limited habitat types are more vulnerable to extinction because they are dependent on a specific environment, making them less adaptable to changes or disturbances.
Step 2: Analyzing the options.
- (A) Low density throughout a large geographic range and in several habitat types: While the species may have low density, the large range and multiple habitats give it more flexibility and resilience to threats.
- (B) Locally common in a restricted geographic range and in several habitat types: The species is common in its region but still has a restricted geographic range, which can limit its survival chances.
- (C) Low density throughout a large geographic range and in a specific habitat type: Even though the species is spread across a large area, its dependence on a specific habitat type increases its vulnerability.
- (D) Locally common in a restricted geographic range and in a specific habitat type: This option presents the highest risk. A species that is locally common but limited to a small geographic area and specific habitat type has no room for expansion or adaptation in the face of changes.
Step 3: Conclusion.
The most vulnerable species would be one that is both locally common and restricted to a specific geographic and habitat type. Therefore, the correct answer is (D).
Final Answer: (D) Locally common in a restricted geographic range and in a specific habitat type Quick Tip: Species that are geographically restricted and dependent on specific habitats are at the highest risk of extinction, as they have fewer opportunities to adapt or relocate.
The frequency distributions of a trait in two populations, X and Y, are shown in the figure.

Which one of the following statements about the mean and standard deviation (SD) of the two populations is accurate?
View Solution
We are given the frequency distributions of two populations, X and Y. Based on the shape of the curves, we analyze the mean and standard deviation (SD) for each population.
Step 1: Analyze the mean.
The mean is determined by the center of the distribution. In the graph, Population X has a sharply peaked distribution, while Population Y has a wider distribution. This suggests that Population Y has a lower peak, indicating that its mean is higher than Population X.
Step 2: Analyze the standard deviation (SD).
The standard deviation measures the spread of the data. A wider distribution indicates a higher SD. Since Population Y has a wider distribution, it also has a higher SD compared to Population X, which has a narrower distribution.
Step 3: Conclusion.
Thus, based on the shape of the frequency distributions, we conclude that Population Y has both a higher mean and a higher SD than Population X.
Final Answer: \boxed{(D) Quick Tip: For normal distributions, a higher peak indicates a lower mean and lower SD, while a wider distribution suggests a higher mean and higher SD.
Two sister species of bulbuls have non-overlapping distributions. One is distributed in India and the other in Sri Lanka. Which of the following modes of speciation is the most parsimonious explanation for this pattern?
View Solution
When populations of the same species become geographically isolated and eventually evolve into separate species, it is called allopatric speciation.
Step 1: Understand the concept of allopatric speciation.
Allopatric speciation occurs when a population is divided by a physical barrier (like a mountain, river, or ocean), leading to genetic divergence. In the case of the bulbuls, the populations are geographically isolated in India and Sri Lanka, creating the conditions for allopatric speciation.
Step 2: Consider other types of speciation.
- Sympatric speciation: Occurs when a species evolves into two without geographical isolation, typically due to ecological, behavioral, or temporal factors. This is not applicable to the given scenario.
- Parapatric speciation: Occurs when populations are partially separated but still have some contact, not applicable here.
- Peripatric speciation: A form of allopatric speciation where small populations at the edge of a species range evolve into new species. This is less likely to apply given the large geographical separation of the populations.
Step 3: Conclusion.
Thus, the most parsimonious explanation for this pattern is allopatric speciation.
Quick Tip: Allopatric speciation is the most common form of speciation when populations are geographically separated.
In an Arctic Ocean food chain, killer whales feed on sea otters, which feed on sea urchins, which in turn feed on kelp (a type of seaweed). An increase in the abundance of killer whales causes sea otter abundance to decline, leading to higher sea urchin densities, which in turn reduces the abundance of kelp. Which of the following terms describes this phenomenon?
View Solution
A trophic cascade occurs when changes at the top of the food chain influence multiple lower trophic levels.
Step 1: Define trophic cascade.
In this example, killer whales (top predator) affect the abundance of sea otters (secondary predator), which indirectly increases sea urchin populations. The resulting increase in sea urchins negatively impacts kelp (primary producer). This is a typical example of a trophic cascade, where one top-down effect propagates through the food chain.
Step 2: Consider other options.
- Prey switching: Refers to a predator changing its prey preference; this is not applicable here.
- Competitive exclusion: Describes a situation where one species outcompetes another, leading to the latter’s local extinction. Not applicable in this context.
- Productivity-stability relationship: Refers to the effect of productivity on the stability of an ecosystem, not the chain of trophic interactions described here.
Step 3: Conclusion.
The correct term for this phenomenon is a trophic cascade.
Quick Tip: Trophic cascades demonstrate the top-down effects of predator-prey interactions through the food web.
Listed below are hypotheses for the evolution of monogamy. Which one of these is NOT based on the concept of individual selection?
View Solution
Individual selection refers to the evolutionary process where natural selection operates at the level of the individual organism, with survival and reproduction as key factors.
In the context of the evolution of monogamy, many hypotheses have been proposed, and some are based on individual selection. For example, the idea that food provisioning by both parents (A) and biparental protection from predators (B) helps to increase the survival chances of offspring fits the idea of individual selection because it directly benefits the reproductive success of the individuals involved.
Females being solitary and dispersed, and males being unable to mate-guard more than one female at a time (C) also relates to individual selection because it revolves around mating behaviors and individual reproductive success.
However, forming monogamous pairs to regulate reproductive output and ensure the survival of the species (D) focuses on species-level benefits, which is group selection, not individual selection. It suggests that monogamy ensures the survival of the species rather than optimizing the reproductive success of individual organisms.
Thus, the answer is (D).
Quick Tip: Individual selection focuses on individual reproductive success, whereas group selection benefits the species as a whole.
Rising temperature due to global warming can stimulate decomposition of organic matter and release CO\(_2\) into the atmosphere. This is an example of
View Solution
Positive feedback occurs when an initial change in a system leads to further changes that amplify the original effect. In the context of global warming, rising temperatures can increase the rate of decomposition of organic matter in soils. This process releases more CO\(_2\) into the atmosphere, which in turn increases the greenhouse effect, leading to higher temperatures. Thus, the warming accelerates the process, creating a vicious cycle of increasing temperature and CO\(_2\) levels. This is an example of positive feedback.
On the other hand, negative feedback involves processes that counteract the original change, stabilizing the system, which is not the case here.
Environmental heterogeneity refers to spatial variability in environmental conditions, and environmental stochasticity refers to random variations in environmental factors, neither of which applies directly to the CO\(_2\) feedback loop described in the question.
Thus, the correct answer is (A), positive feedback.
Quick Tip: Positive feedback: Warming increases decomposition, releasing more CO\(_2\) and enhancing warming.
Ant-mimic spiders of the genus Myrmarachne are known for which one of the following evolutionary phenomena?
View Solution
Myrmarachne spiders are well-known for their mimicry of ants. These spiders engage in aggressive mimicry, where they imitate ants in appearance and behavior in order to deceive their prey or avoid predators. This type of mimicry allows them to infiltrate ant colonies or remain unnoticed by potential predators.
[6pt]
- Aposematism (Option A) is a form of warning coloration used by some organisms to indicate that they are toxic or dangerous, which is not the case for \textit{Myrmarachne.
[6pt]
- Batesian mimicry (Option C) involves a harmless organism imitating a harmful one to avoid predation, which is not the case for \textit{Myrmarachne, since they do not rely on mimicking dangerous or toxic species for protection.
[6pt]
- Müllerian mimicry (Option D) involves two harmful or dangerous species mimicking each other, but \textit{Myrmarachne does not fit this category.
Quick Tip: Aggressive mimicry allows predators or prey to benefit from their mimicry by deceiving other species, like \textit{Myrmarachne spiders mimicking ants.
The probability of local extinction increases with body size when there is forest degradation, loss, and fragmentation. Consider the following hypotheses for the vulnerability of larger-bodied species:
(P) Larger-bodied species tend to have smaller population sizes.
(Q) Larger-bodied species require larger territories/home ranges.
(R) Larger-bodied species have higher absolute resource and energy requirements.
Which one of the following options correctly lists all potential reasons for the vulnerability of larger-bodied species?
View Solution
The vulnerability of larger-bodied species in fragmented habitats can be explained by the following hypotheses:
[6pt]
- (P) Larger-bodied species tend to have smaller population sizes.: Larger animals typically have slower reproductive rates and lower population densities. As habitat fragmentation occurs, these species are more prone to local extinction due to limited gene flow and a higher risk of inbreeding.
[6pt]
- (Q) Larger-bodied species require larger territories/home ranges.: Larger animals need more space to find food, mates, and suitable habitats. Fragmentation reduces the available space, making it harder for these species to survive and reproduce.
[6pt]
- (R) Larger-bodied species have higher absolute resource and energy requirements.: Larger animals require more resources to maintain their body mass, making them more susceptible to habitat degradation that reduces the availability of food or shelter.
Thus, all three factors (P, Q, and R) contribute to the vulnerability of larger-bodied species, which makes (D) the correct answer.
Quick Tip: Larger animals require more resources, space, and have smaller populations, making them more vulnerable to extinction in fragmented habitats.
Grazing by large mammalian herbivores can have a strong influence on ecosystem structure, and can cause ecosystems to transition between alternative states over decades. Which one of the following transitions can result from grazing?
View Solution
Grazing by large herbivores can affect the plant composition and structure of ecosystems, often leading to a shift in vegetation types. These shifts are typically from more closed-canopy systems to more open, grass-dominated systems.
Step 1: Analyzing the options.
- (A) Mangrove to coral reef: Grazing does not cause this transition, as mangroves and coral reefs are fundamentally different ecosystems.
- (B) Terai grassland to alpine meadow: Grazing does not typically result in a shift from a grassland to a high-altitude meadow.
- (C) Savanna to grassland: Grazing often leads to the transformation of savannas into more open grasslands. This is a well-documented ecological process.
- (D) Tropical rainforest to arid desert: This is not a typical result of grazing; rather, deforestation and climatic changes may cause such a transition.
Step 2: Conclusion.
The correct answer is (C) because grazing can reduce tree cover and favor the growth of grasses, leading to the transformation of savannas into grasslands.
Final Answer: (C) Savanna to grassland Quick Tip: Grazing by large herbivores can shift ecosystems from woody, tree-dominated areas (like savannas) to grass-dominated systems.
The effective population size of a sexually reproducing, diploid, animal species will be highest when the sex ratio (number of reproducing males / number of reproducing females) is
View Solution
In population genetics, the effective population size depends on the ratio of males to females. The most balanced and genetically diverse population occurs when the sex ratio is 1:1.
Step 1: Analyzing the options.
- (A) 1: A 1:1 sex ratio is ideal because it ensures that both males and females contribute equally to the next generation, maximizing genetic diversity.
- (B) 0.5: A skewed sex ratio with more females than males reduces the number of potential matings and thus decreases genetic diversity.
- (C) 1.5: A slightly skewed ratio still does not maximize effective population size as efficiently as a 1:1 ratio.
- (D) 2: A 2:1 ratio where there are more males than females is also suboptimal as it reduces the number of female contributions to the gene pool.
Step 2: Conclusion.
The correct answer is (A), as the ideal sex ratio for the highest effective population size is 1:1.
Final Answer: (A) 1 Quick Tip: To maximize genetic diversity and effective population size, the sex ratio should ideally be 1:1.
The theory of evolution by natural selection was proposed by which one (or more) of the following?
View Solution
Step 1: Understanding the Theory of Evolution.
The theory of evolution by natural selection was primarily developed by Charles Darwin and Alfred Russel Wallace. Both independently came up with the same idea: that species evolve over time due to pressures from the environment, and the individuals best suited to the environment survive and reproduce. Thus, Charles Darwin and Alfred Russel Wallace are credited with the development of the theory.
Step 2: Analysis of the Options.
- (A) Charles Darwin: Darwin is famously known for his work "On the Origin of Species" where he outlined the theory of evolution by natural selection.
- (B) Jean Baptiste Lamarck: Lamarck proposed an earlier theory of evolution, known as Lamarckism, which involved the inheritance of acquired characteristics, but his theory is not considered correct today.
- (C) Alfred Russel Wallace: Wallace, working independently of Darwin, also proposed the theory of evolution by natural selection and is considered a co-founder of this theory.
- (D) Georges Cuvier: Cuvier is known for his work on catastrophism, not natural selection.
Step 3: Conclusion.
Thus, the correct answers are (A) Charles Darwin and (C) Alfred Russel Wallace.
Final Answer: \boxed{(A) Charles Darwin, (C) Alfred Russel Wallace Quick Tip: Remember, both Charles Darwin and Alfred Russel Wallace are credited with the theory of evolution by natural selection. However, Darwin is more famous for his comprehensive work on the topic.
According to the MacArthur – Wilson equilibrium model of island biogeography, which one (or more) of the following factors affect(s) extinction rate on an island?
View Solution
Step 1: Understanding the MacArthur – Wilson Equilibrium Model.
The MacArthur – Wilson equilibrium model of island biogeography suggests that the number of species on an island is determined by a balance between immigration rates and extinction rates. Factors influencing extinction rates include island size and the interactions between species.
Step 2: Analysis of the Options.
- (A) Interspecific competition: This factor influences extinction rates as species competing for limited resources can lead to the extinction of less competitive species.
- (B) Island area: According to the model, larger islands tend to have lower extinction rates because they provide more resources and habitat for species.
- (C) Intraguild predation: This factor may influence species dynamics but is not the primary determinant in the MacArthur – Wilson model.
- (D) Species identity: While the species identity can influence interactions, it does not directly affect the extinction rate as per the model.
Step 3: Conclusion.
The correct factors that affect the extinction rate, according to the model, are island area and interspecific competition.
Final Answer: \boxed{(A) Interspecific competition, (B) Island area Quick Tip: In the MacArthur-Wilson equilibrium model, larger islands have lower extinction rates, and interspecific competition influences the survival of species.
A sample of heights of trees follows a normal distribution. In this sample, 68% of height measurements are expected to fall in the interval: \[ mean \pm \_\_\_ standard deviation. \]
(Round off to the nearest integer.)
View Solution
In a normal distribution, approximately 68% of all values lie within one standard deviation from the mean. This is a well-known property of the normal distribution curve.
Step 1: Understand the concept of 68% range.
For any normally distributed dataset, the interval covering 68% of the data will be within one standard deviation on either side of the mean. This means the range is defined by: \[ mean \pm 1 \times standard deviation. \]
Step 2: Applying the formula.
The data provided indicates that 68% of the values fall within this range. So, to express the interval mathematically, we use: \[ Interval = mean \pm 1 \times \sigma \]
where \( \sigma \) is the standard deviation of the dataset. This allows us to understand the variability or spread of data around the mean.
Step 3: Conclusion.
Thus, the interval containing 68% of the data points will be from \( mean - \sigma \) to \( mean + \sigma \), and the range is simply the standard deviation from the mean. Quick Tip: In a normal distribution, 68% of the data lies within one standard deviation from the mean. This is a key property when analyzing data distributions.
A bird species has an annual survival probability of 0.30. While sampling the population of this species, the probability that any individual is captured in a given year is 0.40. A bird is captured, tagged, and released in Year one. The probability that it is re-captured in Year two is ___ (Round off to two decimal places.)
View Solution
Step 1: Understand the concept of recapture probability.
The probability of recapture depends on two independent events: survival of the bird and the probability of capture. The problem clearly states that the bird survives with a probability of 0.30 and that there is a 0.40 chance that the bird is captured.
Step 2: Apply the formula.
To find the probability that the bird is recaptured, we multiply the probability of survival by the probability of capture: \[ P(recaptured) = P(survival) \times P(capture) = 0.30 \times 0.40 = 0.12. \]
Step 3: Conclusion.
Therefore, the probability that the bird is recaptured in Year two is \( 0.12 \). Quick Tip: To calculate recapture probability, multiply the survival probability by the capture probability. This gives the likelihood of both events happening.
Sex ratio at birth is biased towards females in a mongoose population. If the probability of having a daughter is 0.7 in this population, and if sex determination of each offspring is an independent event, then the probability that a female with a litter of four offspring has at least one son is ___ (Round off to two decimal places.)
View Solution
Step 1: Understand the problem setup.
The question gives the probability of having a daughter as \( P(daughter) = 0.7 \). This implies that the probability of having a son is: \[ P(son) = 1 - 0.7 = 0.3. \]
Step 2: Calculate the probability of having no sons.
The probability of having no sons (i.e., all four offspring are daughters) is: \[ P(no sons) = (0.7)^4 = 0.2401. \]
Step 3: Calculate the probability of having at least one son.
The probability of having at least one son is the complement of the probability of having no sons: \[ P(at least one son) = 1 - P(no sons) = 1 - 0.2401 = 0.7599. \]
Step 4: Conclusion.
Thus, the probability that a female with four offspring has at least one son is approximately \( 0.76 \). Quick Tip: To calculate the probability of having at least one son, subtract the probability of having no sons from 1. This technique is useful when dealing with complementary events.
In a species of gecko, males are polymorphic such that some males are yellow and other males are white. A student hypothesises that body colour is a signal of aggression. To test this, he measures aggression in yellow and white males. He also measures body size in every individual he tests. He plots the data in the following way (yellow males: solid line and filled dots; white males: dashed line and open dots). Which one of the following statements is correct based on these data?

View Solution
The key to answering this question is interpreting the graph and understanding the relationship between body size and aggression for yellow and white males.
Step 1: Analyze the graph.
The graph shows a clear pattern where yellow males (represented by solid line and filled dots) exhibit a positive correlation between body size and aggression. As the body size increases, aggression also increases.
For white males (represented by dashed line and open dots), there is no noticeable trend or correlation between body size and aggression. The data points are scattered without any clear pattern.
Step 2: Evaluate the options.
- Option (A): This is incorrect because the graph does not show that all yellow males are more aggressive than white males; aggression is related to body size in yellow males, but not in all yellow males.
- Option (B): This is incorrect because while body size is correlated with aggression in yellow males, there is no such correlation in white males.
- Option (C): This is correct because the graph shows that body size is correlated with aggression in yellow males but not in white males.
- Option (D): This is incorrect because the graph does not suggest that small yellow males are more aggressive than small white males. The relationship between body size and aggression is not evident for white males.
Step 3: Conclusion.
Based on the graph, the correct answer is (C), as body size correlates with aggression only in yellow males.
Quick Tip: When interpreting scatter plots, look for clear trends in the data. In this case, body size correlates with aggression in yellow males but not in white males.
Homing pigeons can perceive the pattern of polarized light in the sky (which depends on the position of the sun relative to the earth). This enables homing pigeons to orient and navigate home if released in any location. One can reset their biological clock in captivity by artificially controlling the light conditions. If you acclimatize a pigeon to a new lighting cycle with "sunrise" at 6 PM and "sunset" at 6 AM, instead of 6 AM sunrise and 6 PM sunset that naturally occurs, the bird will be clock-shifted by 12 hours within a few days. Suppose you release two birds, a normal bird (N) and a 12-hr clock-adjusted bird (C), 30 km East of their home at 6 AM. In which direction will each bird fly?
View Solution
Homing pigeons rely on their biological clock and the position of the sun for navigation. The direction they fly depends on their internal clock and how it aligns with the time of day at their release site.
Bird N is the normal bird, whose biological clock is not adjusted. Therefore, it perceives 6 AM as the natural time of release and will use the sun's position accordingly. Since the bird is 30 km East of its home, it will orient West towards its home.
Bird C has been clock-adjusted by 12 hours. This means it perceives the 6 AM release time as 6 PM and uses the sun's position as if it were the evening. Since it is 30 km East, the bird will attempt to fly East, as it mistakenly perceives the sun's position as evening and moves away from its home.
Thus, the correct answer is (C), where Bird N flies West and Bird C flies East.
Quick Tip: When adjusting biological clocks, animals may perceive the time of day incorrectly, affecting their navigation direction.
Demographic stochasticity introduces random variation in population growth because
View Solution
Demographic stochasticity refers to the random variation in population growth due to the discrete nature of births and deaths. In small populations, this randomness becomes more pronounced because the effect of each individual birth or death can significantly affect the overall population size.
Option (A), while true that changing weather conditions can affect reproduction, refers to environmental stochasticity, not demographic stochasticity.
Option (C) describes the effect of density dependence, where the birth rate decreases as population density increases, but it does not directly refer to random variation in population growth.
Option (D) refers to time lags in response to environmental changes but is unrelated to random variation in population dynamics.
Thus, (B) is the correct answer, as it directly addresses the random fluctuations in population size due to the discrete events of births and deaths.
Quick Tip: Demographic stochasticity refers to random variations in population size due to births and deaths, especially in small populations.
In an island chain, species richness (S) increases with island area (A) according to the equation, \(S = 4.3A^{0.55}\).
Which one of the following graphs best represents this equation?

View Solution
The equation given is \(S = 4.3A^{0.55}\), where \(S\) represents species richness and \(A\) represents the island area. This is a power law relationship, where the exponent 0.55 indicates how species richness increases with the area of an island.
Step 1: Analyzing the relationship
The equation shows that species richness \(S\) increases with island area \(A\), but the increase in \(S\) is not linear. Instead, it follows a diminishing rate of increase. This means that as the area of the island increases, the species richness does increase, but at a slower rate. This type of relationship is characteristic of power laws with exponents less than 1, where the curve becomes flatter as the independent variable (in this case, area) increases.
Step 2: Visualizing the curve
To visualize the curve, let's break down the equation:
- When \(A\) is small, the value of \(A^{0.55}\) will be significantly lower than \(A\). As \(A\) increases, the impact of the exponent 0.55 becomes more apparent, and the rate at which species richness increases slows down.
- This results in a concave upward curve, which indicates rapid increases in species richness for small island areas, but as the area grows, the increase in species richness becomes less pronounced.
Step 3: Identifying the correct graph
Among the given graphs, graph (ii) best represents the behavior described by the equation \(S = 4.3A^{0.55}\). It shows a steady increase in species richness with island area, but the rate of increase gradually slows down as the island area increases, which is consistent with a power law with an exponent less than 1.
- Graph (i) shows a linear relationship, which is not correct because the equation is not linear.
- Graph (iii) is an exponential curve, which would imply that species richness increases rapidly at a constant rate, which is not the case here.
- Graph (iv) shows a curve that starts high and then decreases, which does not align with the expected behavior of the equation.
Thus, the correct graph is (ii).
Quick Tip: Power law relationships between area and species richness result in concave upward curves, indicating diminishing returns as the area increases. If the exponent is less than 1, the curve will flatten as the area grows.
A researcher measures the abundance of a tree species in 10 plots in each of two habitats. She tests for differences in abundance between the two habitats using an ANOVA. The results from the ANOVA are as follows:
Mean abundance in habitat A = 30 trees
Mean abundance in habitat B = 50 trees
F-statistic (on 1 and 18 degrees of freedom) = 6.04
P-value = 0.02
Here, a P-value of 0.02 means that:
View Solution
The P-value in an ANOVA test represents the probability of observing an F-statistic as extreme as, or more extreme than, the one calculated, assuming that there is no real difference between the groups (null hypothesis). A P-value of 0.02 indicates that the probability of obtaining an F-statistic of 6.04 or higher under the null hypothesis is 2%.
Step 1: Analyzing the options.
- (A) This statement misinterprets the meaning of the P-value. The P-value does not refer to repeating the study 100 times with the same probability.
- (B) This is a common misconception. The P-value is not the probability that the null hypothesis is true, but rather the probability of obtaining a result at least as extreme as the one observed.
- (C) This is correct. The P-value of 0.02 means that the probability of obtaining an F-statistic of 6.04 or greater, under the assumption that there is no difference between habitats, is 0.02.
- (D) The P-value being less than 0.05 only tells us that there is evidence to reject the null hypothesis, but it does not imply a "very large difference."
Step 2: Conclusion.
The correct answer is (C), as the P-value represents the probability of obtaining an F-statistic as extreme as the observed value under the null hypothesis.
Final Answer: (C) the probability that an F-statistic with a value of 6.04 or greater falls within the F-distribution for 1 and 18 degrees of freedom is 0.02. Quick Tip: The P-value in an ANOVA test tells you the probability of obtaining a result at least as extreme as the one observed, assuming the null hypothesis is true.
In the graph shown, the solid line represents the best fit from an ordinary least-squares regression, where X is the predictor variable and Y is the response variable. In this case, which one of the following assumptions of the linear regression is violated?

View Solution
Step 1: Understanding the Assumptions of Linear Regression.
Linear regression assumes several things about the data, including:
1. A linear relationship between the predictor and response variables.
2. Equal variances in the response variable (homoscedasticity).
3. Normal distribution of residuals.
4. Independence of data points.
Step 2: Analyzing the Graph.
In the provided graph, we see that the spread of the residuals (the vertical distances between the data points and the regression line) varies as X increases. Initially, the residuals appear relatively small but grow larger as X increases, indicating a violation of the assumption of homoscedasticity. This means that the variance of Y is not constant across the values of X. This condition is known as heteroscedasticity, which violates the assumption that the variance of the errors should be constant.
Step 3: Conclusion.
Thus, the assumption that is violated in this case is Equal variances in Y across values of X.
Final Answer: \boxed{(A) Quick Tip: When performing linear regression, check for homoscedasticity (constant variance of residuals). If the spread of residuals increases or decreases with X, it indicates a violation of this assumption.
Consider the following list of bacteria and the infections they cause in humans.

Which one of the following combinations correctly matches these micro-organisms and the infections they cause in humans?
View Solution
We are asked to match each bacteria with the infection it causes. Let's go through the options systematically.
- Staphylococcus aureus (P): Known to cause postoperative infections.
- Shigella sp. (Q): Causes diarrhoea.
- Neisseria sp. (R): Known for causing meningitis.
- Yersinia pestis (S): Causes plague.
Now, match the correct pairs:
- P → Postoperative infection (Option 3)
- Q → Diarrhoea (Option 4)
- R → Meningitis (Option 1)
- S → Plague (Option 2)
Thus, the correct combination is P-3; Q-4; R-1; S-2, which matches Option (C).
Quick Tip: When matching diseases with causative organisms, remember that many pathogens have well-established associations with certain infections.
Which one of the following statements is INCORRECT with respect to the tree of life?
View Solution
The question asks us to identify the incorrect statement in terms of the evolutionary relationships among various phyla. Let's evaluate each statement:
Step 1: Evaluate each statement.
- (A): Ctenophora and Cnidaria are both part of the group Radiata and share a more recent common ancestor with each other than with Echinodermata. This is correct.
- (B): Porifera (sponges) are more closely related to Ctenophora than to Echinodermata. Porifera is a basal group, and Ctenophora and Echinodermata are both more derived, but this relationship is supported by molecular data. This is correct.
- (C): Arthropoda is more closely related to Tardigrada (water bears) than to Annelida. Molecular phylogenies support the idea that arthropods and tardigrades are more closely related, forming a group called Ecdysozoa. This is correct.
- (D): This is incorrect because Arthropoda is more closely related to Nematoda than to Mollusca, according to current phylogenetic studies. Arthropoda and Nematoda both belong to the group Ecdysozoa, while Mollusca is part of a different group, Lophotrochozoa.
Step 2: Conclusion.
Therefore, the incorrect statement is (D).
Quick Tip: When analyzing evolutionary relationships, remember that molecular data often provides a clearer picture of phylogenetic relationships than traditional morphological similarities.
Consider a population that shows logistic growth of the form
\[ \frac{dN}{dt} = rN \left( 1 - \frac{N}{K} \right) \]
where \(\frac{dN}{dt}\) is the population growth rate, \(r\) \text{is the instantaneous rate of increase, \(K\) \text{is the carrying capacity and N \text{is the population size.
For such a population (N > 0), which one of the following graphs shows the correct relationship between per capita growth rate \(\frac{1{N} \frac{dN}{dt}\) on the y-axis, and population size (N) on the x-axis?

View Solution
The logistic growth equation models population growth where the rate of growth is proportional to both the current population size and the amount of resources available (which are limited by the carrying capacity, \(K\)).
To determine the relationship between per capita growth rate \(\frac{1}{N} \frac{dN}{dt}\) and population size \(N\), we start by simplifying the logistic growth equation:
\[ \frac{dN}{dt} = rN \left( 1 - \frac{N}{K} \right) \]
The per capita growth rate is defined as:
\[ \frac{1}{N} \frac{dN}{dt} = r \left( 1 - \frac{N}{K} \right) \]
This equation shows that the per capita growth rate is high when \(N\) is small (far from the carrying capacity \(K\)) and decreases as the population size \(N\) approaches the carrying capacity \(K\). At \(N = K\), the per capita growth rate becomes zero because the population is at equilibrium, and no further growth occurs.
This relationship is represented in graph (i), which shows a curve where the per capita growth rate is highest at low population sizes, gradually decreases, and becomes zero as the population size approaches the carrying capacity.
Thus, the correct answer is (A), graph (i).
Quick Tip: In logistic growth, per capita growth rate is highest when the population is small and declines as the population approaches the carrying capacity.
Which one of the following represents the correct chronological order of geological periods (from oldest to most recent)?
View Solution
The correct chronological order of geological periods, from oldest to most recent, is:
[4pt]
- Cambrian: This period is one of the oldest, occurring around 541 million years ago. It marks the start of the Paleozoic era and is known for the Cambrian explosion, where many major groups of animals first appeared.
[4pt]
- Devonian: Following the Cambrian, the Devonian period (419–359 million years ago) saw the evolution of fish, amphibians, and the first forests.
[4pt]
- Jurassic: The Jurassic period (201–145 million years ago) follows the Devonian and is known for the dominance of dinosaurs and the first birds.
[4pt]
- Neogene: The most recent period listed, the Neogene (23–2.6 million years ago), saw the development of mammals and modern plant life.
[6pt]
Thus, the correct order is (C): Cambrian \(\to\) Devonian \(\to\) Jurassic \(\to\) Neogene.
Quick Tip: Geological periods are divided by major changes in Earth's biodiversity, with earlier periods characterized by simpler life forms and later periods by more complex organisms.
Soils undergo weathering over large time-scales (millions of years). Over time, concentration of phosphorus (P) declines monotonically (solid line), while nitrogen (N) shows a unimodal pattern (dotted line) as shown.

Based on this pattern, which one of the following diagrams represents the likely trend in N:P ratio?

View Solution
As soils weather over time, phosphorus (P) concentration declines steadily (monotonically), while nitrogen (N) follows a unimodal pattern. The key observation here is that nitrogen increases, reaches a peak, and then decreases, while phosphorus declines continuously. This suggests that the N:P ratio will initially rise as nitrogen increases relative to phosphorus in the younger soils, then reach a peak, and finally decrease as both nitrogen and phosphorus concentrations decline.
[6pt]
Graph (i) shows a similar trend where the N:P ratio increases initially (as N rises relative to P) and then decreases over time, which aligns with the observed patterns of nitrogen and phosphorus in the soils.
[6pt]
- Graph (ii) shows a constant N:P ratio, which does not fit the expected trend.
- Graph (iii) and (iv) show linear increases and decreases, which do not align with the unimodal pattern of nitrogen.
Thus, the correct diagram is (i), showing the expected changes in N:P ratio over the soil's age.
Quick Tip: In ecosystems, nutrient ratios like N:P reflect the availability and cycling of these nutrients. A unimodal pattern for N suggests a peak in availability before declining.
A large forest area is fragmented into multiple smaller patches of different sizes. A researcher estimates the number of bird species in these forest fragments immediately following fragmentation, and then again 20 years later. The relationship between fragment size and species richness is shown in the graph for the two sampling events (immediately after fragmentation: closed circles and solid line; 20 years after fragmentation: open circles and dashed line). The best explanation for the differences in species richness with fragment size between the two sampling events is

View Solution
In ecology, an extinction debt refers to the delayed loss of species in fragmented habitats. It occurs because species may persist in smaller habitat fragments for some time after fragmentation, even though the habitat is no longer able to support them long-term. Over time, species become locally extinct in these smaller, isolated habitats due to environmental changes, lack of resources, or other factors. This delayed extinction process can cause a difference in species richness immediately after fragmentation versus some years later, as seen in the provided graph.
Step 1: Analyzing the options.
- (A) Allen's rule: This rule states that animals in colder climates tend to have shorter appendages (ears, limbs) to conserve heat, which is not relevant to the question about species richness and habitat fragmentation.
- (B) K-selection: This refers to a reproductive strategy where species produce fewer offspring with higher parental investment. While it relates to species survival strategies, it is not the best explanation for changes in species richness following habitat fragmentation.
- (C) Extinction debt: This is the correct answer. It describes the phenomenon where species continue to exist in fragmented habitats even after the conditions for their survival have deteriorated, leading to eventual local extinctions.
- (D) Bergmann's rule: This rule states that animals in colder regions tend to have larger body sizes, which is unrelated to species richness in fragmented habitats.
Step 2: Conclusion.
The correct answer is (C) because extinction debt explains the observed differences in species richness between the two sampling events.
Final Answer: (C) Extinction debt. Quick Tip: Extinction debt occurs when species continue to survive in fragmented habitats for some time after the habitat's ability to support them has declined, leading to eventual local extinctions.
The table shows a list of analysis goals (i, ii, iii) and different statistical tests (P, Q, R).

View Solution
We need to match the analysis goals to the appropriate statistical tests.
Step 1: Analyzing (i).
(i) Comparing the mean body size of three samples of snakes, each from a different population, involves comparing the means of multiple groups. This is typically tested using the Analysis of Variance (ANOVA). Hence, the correct match is (i)-(Q).
Step 2: Analyzing (ii).
(ii) Testing if two continuous traits are linearly associated refers to checking the relationship between two continuous variables. The appropriate test for this is the correlation coefficient (R). Hence, the correct match is (ii)-(R).
Step 3: Analyzing (iii).
(iii) Testing if a plant species shows Mendelian inheritance of flower colour (red, white) is a categorical comparison, where a chi-square test is used to determine whether the observed frequencies match the expected frequencies under Mendelian inheritance. Hence, the correct match is (iii)-(P).
Step 4: Conclusion.
Thus, the correct answer is (C) (i)-(Q), (ii)-(R), (iii)-(P).
Final Answer: \boxed{(C) Quick Tip: Use ANOVA to compare means of multiple groups, the correlation coefficient to check linear relationships between continuous variables, and the chi-square test for categorical comparisons.
Shifting cultivation is a form of agricultural practice in the hills of Northeast India, where a forest patch is cleared and cultivated for a few years, after which it is left fallow and allowed to regenerate. Succession occurs on such previously cultivated plots. Over time, the plant community should move towards which region in the graph?

View Solution
In shifting cultivation, when land is left fallow after being cultivated, it goes through a process of ecological succession, where plant communities gradually move towards a more mature, stable ecosystem. This process can be described using a graph where the x-axis represents shade tolerance (the ability of plants to survive under the canopy of other plants), and the y-axis represents the proportion of woody vegetation (which indicates the development of forest-like characteristics).
Step 1: Analyze the graph.
- Region P corresponds to a situation with low shade tolerance and low proportion of woody vegetation. This is typical of early successional stages when grasses and herbaceous plants dominate.
- Region Q corresponds to higher shade tolerance and a moderate level of woody vegetation, representing the transition from early to later stages of succession. This is where more shade-tolerant species, such as shrubs and small trees, begin to establish.
- Region R shows high proportion of woody vegetation but low shade tolerance, which is not typical of mature forest stages.
- Region S represents a mature forest with both high woody vegetation and high shade tolerance, typical of a stable climax community.
Step 2: Match the process of succession.
As succession progresses in the fallow land, the plant community will first shift to a region of higher shade tolerance and a higher proportion of woody plants. This is best represented by region Q.
Step 3: Conclusion.
Thus, the correct answer is (B) Q, as it represents the stage in ecological succession where plants move from early pioneers towards a more stable, shaded, and woody community.
Quick Tip: In succession, plant communities gradually shift towards higher shade tolerance and greater woody vegetation as they mature.
Consider 1000 terrestrial species that have geographical ranges of different shapes and sizes. If the Earth were entirely covered by land (no oceans), and the ranges of these species were overlaid on the surface of the Earth at random, which one of the following patterns is expected?
View Solution
When considering species distributions over the Earth's landmass, if species' ranges are overlaid randomly, the distribution of species richness across different latitudes would be expected to be roughly equal. This is because without any bias or ecological restrictions (such as climatic gradients or geographical features like mountains and oceans), the species are randomly distributed across the landmasses.
In such a scenario, there would be no preferential clustering of species in the tropics or higher latitudes, as the placement of each species is random, and their geographical range does not follow natural patterns like the latitudinal gradient of species richness observed in real ecosystems.
Thus, roughly equal species richness would be expected across the entire surface of the Earth (answer C). This pattern contrasts with the observed natural world, where the tropics typically exhibit higher species richness due to environmental factors like temperature, humidity, and primary productivity.
Quick Tip: Species richness patterns are affected by factors such as climate, geography, and ecological processes, leading to greater richness in the tropics.
The graph below shows how the lower limits of the elevational ranges of bird species on a tropical mountain have changed over 20 years (2000 to 2020) because of climate change. Each point below represents a bird species. Points would cluster on the dashed line if species had the same lower elevational range limits in 2000 and 2020. Given that the mountain summit is at an elevation of 3500 m (solid horizontal line), and assuming that the trend shown by the graph continues over the next 20 years, what would you expect in 2040?

View Solution
The graph shows how the lower elevational range limits of bird species have shifted upward between 2000 and 2020 due to climate change. The points of species in 2020 are above the dashed line, indicating an upward shift in their lower elevational range. If this trend continues over the next 20 years, as suggested in the question, the bird species' lower elevational limits will continue to rise, pushing them closer to the summit of the mountain.
Given that the summit is at 3500 m, species that are currently living at high elevations (near the summit) will likely become locally extinct as their range limits shift upwards, without suitable habitat left to support them. High-elevation species are particularly vulnerable because they have fewer opportunities to move upwards, especially if they are already near the summit.
[6pt]
- Low-elevation species are less likely to be impacted, as they have more room to move upward. Therefore, (A) is incorrect.
- Mid-elevation species are at a moderate risk of local extinction, but the primary impact will be on species at the highest elevations. Thus, (B) is incorrect.
- High-elevation species are most at risk, as their range limits are already approaching the summit, making them highly vulnerable to local extinction if the trend continues. Therefore, (C) is the correct answer.
- All species returning to their original elevational ranges is not supported by the upward trend observed in the graph, so (D) is incorrect.
Quick Tip: Species living at higher elevations are more vulnerable to extinction in the face of climate change, as they have limited options for upward migration.
Behavioural ecologists exploring a newly discovered island find 20 new species of terrestrial lizards. Males of these species have a dorsal ridge that varies in size from large in some species to entirely lacking in others. The scientists hypothesise that dorsal ridges in males evolved by runaway sexual selection stemming from sensory bias in females. Which one of the following would provide the necessary evidence to support this hypothesis?
View Solution
The hypothesis proposes that the dorsal ridge evolved due to sensory bias in females, which means females are attracted to males with a certain trait, and over time, this preference leads to the evolution of that trait. To test this hypothesis, we need evidence that females show a preference for males with a large dorsal ridge, even in species where males naturally lack the trait.
Step 1: Analyzing the options.
- (A) This option directly tests the hypothesis. If females are attracted to males with an artificially added large dorsal ridge, this provides evidence that the trait evolved due to sensory bias and sexual selection, rather than natural selection.
- (B) This option does not support the hypothesis, as it suggests that males without a ridge attract more females, which contradicts the idea of sexual selection favoring males with the trait.
- (C) This option describes a competitive advantage but does not address the preference of females for the trait, which is crucial for the hypothesis.
- (D) If females of species whose males have a dorsal ridge do not show a preference, it would contradict the idea of sexual selection driven by female preference for the trait.
Step 2: Conclusion.
The correct answer is (A), as it provides the evidence of female preference for the trait, supporting the hypothesis that the dorsal ridge evolved due to runaway sexual selection driven by sensory bias in females.
Final Answer: (A) Females of species in which males lack this trait are attracted to males that have a large dorsal ridge artificially attached to them. Quick Tip: Runaway sexual selection occurs when a trait evolves because of the preference of one sex (usually females) for a particular characteristic in the opposite sex.
The graph shows the relationship between a variable on the x-axis and genetic diversity on the y-axis. Each point represents a species and the trend line describes the relationship across species.

Select the most appropriate variable for the x-axis.
View Solution
Step 1: Interpreting the graph.
The graph shows a negative relationship between the variable on the x-axis and genetic diversity on the y-axis. As the x-axis variable increases, the genetic diversity decreases. This suggests that the variable on the x-axis is something that increases with size or scope and correlates with a decrease in genetic diversity.
Step 2: Analyzing the options.
- (A) Evolutionary age of species: While older species could potentially show reduced genetic diversity due to longer evolutionary periods, this is not the most likely variable for this trend. Evolutionary age typically doesn't show such a direct and consistent negative correlation with genetic diversity.
- (B) Abundance: Species abundance could be related to genetic diversity, but the graph suggests a direct relationship based on size or physical traits, not abundance.
- (C) Body size: Body size is a known variable that often shows a negative correlation with genetic diversity. Larger species tend to have lower genetic diversity due to their smaller populations and more restricted gene pools. This matches the pattern shown in the graph.
- (D) Geographic range: Although geographic range might influence genetic diversity, the graph suggests a more direct and consistent correlation with size rather than spatial factors.
Step 3: Conclusion.
Thus, the most appropriate variable for the x-axis is body size, which explains the observed negative relationship with genetic diversity.
Final Answer: \boxed{(C) Quick Tip: In biology, larger species often have lower genetic diversity due to limited gene flow and smaller populations. This can result in a negative correlation between body size and genetic diversity.
Hunting is a major source of mortality for large frugivorous birds. These birds disperse the seeds of forest trees and are the primary contributors to forest regeneration. The graphs show the distribution of different age-classes of a frugivore-dispersed tree species at two isolated sites.

View Solution
The graphs show the distribution of different age-classes of frugivore-dispersed tree species at two isolated sites (i) and (ii). We can draw conclusions based on the data about tree seedling, sapling, and adult densities and their relationship to hunting.
Step 1: Analyze the graphs.
- At site (i), the density of seedlings is much higher than the density of saplings and adults, which suggests that seedling survival is low and possibly affected by a high level of predation or hunting pressure.
- At site (ii), there is a more balanced distribution between the different age-classes, with relatively high densities of saplings and adults, suggesting a more stable or less disturbed environment, possibly due to lower hunting pressure.
Step 2: Evaluate the options.
- (A) Hunting is higher at site (i) than at site (ii): This seems unlikely, as site (i) has a much lower density of saplings and adults compared to site (ii). Higher hunting pressure would likely reduce the density of all age classes, not just the adults.
- (B) Hunting is higher at site (ii) than at site (i): This option is consistent with the data, as site (ii) shows a more balanced distribution of age-classes, suggesting that hunting may be less intense and that more adult individuals survive to disperse seeds. This would support a hypothesis of higher hunting pressure at site (i), where seedlings are less successful.
- (C) Hunting is similar at both sites: This is not consistent with the data because the densities of different age classes are more similar at site (ii), while site (i) shows a clear dominance of seedlings and very few adults. This suggests that the impact of hunting is not the same at both sites.
- (D) Frugivores are not hunted at either site: This is inconsistent with the patterns of seedling and sapling survival shown in the graphs. Hunting likely affects survival rates, especially in seedlings and saplings, making this option unlikely.
Step 3: Conclusion.
The most likely conclusion is that hunting is higher at site (ii) than at site (i), as site (ii) shows a more balanced distribution of age-classes, whereas site (i) shows low survival rates for saplings and adults.
Quick Tip: When interpreting ecological data, a high density of seedlings relative to adults often indicates predation or disturbance at earlier stages.
The following phylogeny shows how species P to T are related to each other. The branch lengths indicate the degree of evolutionary change.

The species composition of three areas is given below:
Area 1: PQR; Area 2: RST; Area 3: QRS
Given this information, the phylogenetic diversity of
View Solution
The phylogenetic diversity of a region can be understood by examining the species composition and the degree of evolutionary change indicated by branch lengths in the phylogeny. In this case, we are given the species composition for three areas:
- Area 1 contains species PQR.
- Area 2 contains species RST.
- Area 3 contains species QRS.
Looking at the phylogeny:
- Area 1 has species P, Q, and R. The species P and Q are relatively closely related (as per the branch lengths), but R is more distantly related, implying a higher degree of phylogenetic diversity for this area.
- Area 3 has species Q, R, and S. This is similar in diversity to Area 1, but it lacks species P, making the diversity slightly lower than in Area 1.
- Area 2 has species R, S, and T. The species in this area appear to be relatively closely related, with less phylogenetic distance between them compared to Areas 1 and 3. Hence, Area 2 has the least phylogenetic diversity.
Therefore, the phylogenetic diversity follows the pattern: Area 1 > Area 3 > Area 2. The correct answer is (A).
Quick Tip: Phylogenetic diversity is higher when species in an area are more distantly related.
The IUCN Red List provides information on the conservation status of different species. Match the species to their status in the table below.

View Solution
According to the IUCN Red List, the conservation status of the species mentioned is as follows:
- Tiger: Tigers are listed as Near threatened (NT) due to habitat loss and poaching. While conservation efforts are in place, they still face significant threats. Thus, (A) and (D) are incorrect.
[6pt]
- Great Indian Bustard: This species is Extinct (EX) in the wild due to hunting and habitat loss. Therefore, (A) is correct for this species.
[6pt]
- Passenger Pigeon: The Passenger Pigeon, once abundant in North America, went Extinct (EX) in the wild by the early 20th century, primarily due to hunting and habitat destruction. Therefore, (B) is correct.
[6pt]
- Blackbuck: Blackbuck is listed as Endangered (EN) due to habitat loss and hunting. This is a conservation priority in India. Hence, (D) is incorrect for this species.
[6pt]
Thus, the correct match is (B): Tiger: NT; Great Indian Bustard: EX; Passenger Pigeon: EX; Blackbuck: EN.
Quick Tip: Always check the most up-to-date IUCN Red List for the conservation status of species, as statuses can change with ongoing conservation efforts.
A gene duplication event in an organism results in two copies of a gene. Which one (or more) of the following outcomes is/are possible for the duplicated copy?
View Solution
Gene duplication is an important evolutionary process that can lead to the development of new functions and adaptations. Following a gene duplication event, several possible outcomes for the duplicated gene include:
Step 1: Analyzing the options.
- (A) It retains the original function: After duplication, one copy of the gene may continue to function as the original gene did, while the other copy may undergo evolutionary changes.
- (B) It acquires a new function: One copy of the gene may evolve a new function, potentially providing an advantage to the organism.
- (C) It loses function: Sometimes one copy of the gene becomes non-functional due to mutations, which may still contribute to the overall genetic diversity of the organism.
- (D) It gets translated but not transcribed: This is unlikely, as translation is typically preceded by transcription in the expression of a gene.
Step 2: Conclusion.
The correct answers are (A), (B), and (C), as these are all possible outcomes for a duplicated gene.
Final Answer: (A), (B), (C) Quick Tip: Gene duplication can lead to retention of the original function, loss of function, or the evolution of new functions in the duplicated gene.
The egg-laying mammal, platypus, is known for its ability to inject venom by stabbing with spurs on its hindlimbs. Which one (or more) of the following statements supports the hypothesis that venom in this species is used for intrasexual competition?
View Solution
Intrasexual competition occurs when individuals of the same sex compete for access to mates. In this case, male platypuses produce venom, which is likely used during interactions with other males to establish dominance or fend off rivals.
Step 1: Analyzing the options.
- (A) Only males produce venom: This supports the hypothesis that venom is used for intrasexual competition, as only males produce it, possibly to gain an advantage over other males.
- (B) Venom is secreted only during the breeding season: This also supports the hypothesis, as this timing aligns with the period of heightened male competition for mates.
- (C) Venom is only effective against invertebrates: This does not support the hypothesis for intrasexual competition, as it suggests the venom is not used in male-to-male competition.
- (D) Venom is ineffective against conspecifics: If venom were ineffective against other males (conspecifics), it would not be useful for intrasexual competition.
Step 2: Conclusion.
The correct answers are (A), (B), and (C), as they provide evidence that venom is used by males in intrasexual competition.
Final Answer: (A), (B) Quick Tip: Intrasexual competition involves individuals of the same sex competing for mates. Males producing venom during the breeding season supports the idea that it is used to compete with other males.
All octopi dream every night, and sometimes change colour while dreaming. A student hypothesises that octopi change colour only when they dream about the food they ate that day. To test this hypothesis, the student conducts an experiment with two treatments that are randomly ordered, and separated by 2 days. In one treatment, she places 10 octopi in individual tanks in captivity and provides each one with a large crab to eat during the day. She then records the dream state colour of these octopi that night. Which one (or more) of the following would be an appropriate NEGATIVE control to test this hypothesis?
View Solution
A negative control is used to establish a baseline response where no expected effect occurs. The purpose of a negative control is to demonstrate that the change in the dependent variable (in this case, colour change in octopi) is not due to external factors unrelated to the hypothesis.
Step 1: Analyzing the options.
- (A) Provide the same 10 octopi with the same food source (crab), and then record their colour: This option is not a negative control because the experiment is already testing the hypothesis that octopi change colour based on the food they eat.
- (B) Provide the same 10 octopi with a new food object (e.g. sea stars): This is a variation of the treatment group, not a negative control. It would test the hypothesis but wouldn't establish a baseline where no expected effect occurs.
- (C) Provide the same 10 octopi with a non-food object (e.g. rock): This option is the appropriate negative control because it ensures that the observed colour change is not due to factors unrelated to the food, as the octopi would have no expected reason to change colour in response to a non-food object.
- (D) Provide 10 squid with the same food source (crab): This is not a negative control either, as it tests the hypothesis on a different species.
Step 2: Conclusion.
Thus, the correct negative control is option (C), where the octopi are provided with a non-food object, and no colour change is expected.
Final Answer: \boxed{(C) Quick Tip: A negative control ensures that any observed changes in the dependent variable are due to the experimental variable, and not to other unrelated factors.
Which one (or more) of the following conservation actions would NOT benefit native species?
View Solution
Step 1: Analyzing the options.
- (A) Planting Prosopis juliflora in the Thar desert to reduce erosion: Prosopis juliflora is an invasive species and planting it could negatively affect the local ecosystem, displacing native plant species and potentially harming native species. Thus, this action would not benefit native species.
- (B) Stringing rope ladders across roads to connect the canopy for facilitating the movement of arboreal animals in the Western Ghats: This is a conservation measure that would benefit native species by providing safe passage for arboreal animals, aiding in their movement and promoting biodiversity.
- (C) Increasing lights at night on beaches in Odisha to improve visibility for hatching sea turtles: Increasing artificial lighting can disrupt the natural process of sea turtle hatching, causing hatchlings to become disoriented. This could harm the population of sea turtles, thus not benefiting native species.
- (D) Growing native species in urban gardens of Bengaluru to attract pollinators: This action would benefit native species by supporting pollinators and maintaining biodiversity in urban environments.
Step 2: Conclusion.
Thus, options (A) and (C) would not benefit native species.
Final Answer: \boxed{(A) (C) Quick Tip: Invasive species and artificial light can have detrimental effects on native ecosystems. Conservation actions should always focus on preserving and enhancing native biodiversity.
Male beetles are of two phenotypes: horned and hornless. Horned males mate with twice as many females compared with hornless males. But females mated to hornless males produce one-third more offspring. The reproductive success of a male (number of offspring fathered) is the number of females he mates with multiplied by the number of offspring each female produces. The reproductive success of horned males is ____ times that of hornless males. (Round off to one decimal place.)
View Solution
Let the reproductive success of a hornless male be \( R_h \) and the reproductive success of a horned male be \( R_t \).
Step 1: Reproductive success of hornless males.
The hornless male mates with \( F \) females, and each female produces \( O_h \) offspring. Thus, the reproductive success of a hornless male is: \[ R_h = F \times O_h. \]
Step 2: Reproductive success of horned males.
The horned male mates with \( 2F \) females (twice as many), and each female produces \( O_h + \frac{O_h}{3} = \frac{4O_h}{3} \) offspring. Thus, the reproductive success of a horned male is: \[ R_t = 2F \times \frac{4O_h}{3} = \frac{8F O_h}{3}. \]
Step 3: Ratio of reproductive success.
The ratio of the reproductive success of horned males to hornless males is: \[ Ratio = \frac{R_t}{R_h} = \frac{\frac{8F O_h}{3}}{F O_h} = \frac{8}{3} = 2.7. \]
Thus, the reproductive success of horned males is \( \boxed{2.7} \) times that of hornless males. Quick Tip: The reproductive success ratio can be found by comparing the number of females mated and the number of offspring produced by both phenotypes.
A population shows exponential growth of the form \( N_t = N_0 e^{rt} \) where \( N_t \) is the population at time \( t \), \( N_0 \) is the initial population size, and \( r \) is the rate of increase. If \( r = 0.1 \), then the doubling time for this population is ____ (Round off to two decimal places.)
View Solution
The doubling time \( T_d \) is the time it takes for the population to double, and it can be found using the formula: \[ T_d = \frac{\ln(2)}{r}. \]
Given \( r = 0.1 \), we calculate: \[ T_d = \frac{\ln(2)}{0.1} \approx \frac{0.693}{0.1} = 6.93. \]
Thus, the doubling time for this population is \( \boxed{6.93} \) years. Quick Tip: The doubling time for an exponentially growing population is calculated as \( T_d = \frac{\ln(2)}{r} \).
At a locus with two alleles A1 and A2, the genotype A1A1 produces white flowers, A2A2 produces red flowers, and A1A2 produces pink flowers. For a population in Hardy-Weinberg equilibrium, the frequency of red flowers is 0.25. If the white-flowered plants are removed, and all pink and red flowered-plants in this population are randomly crossed amongst each other, the frequency of white flowered plants in the next generation will be ____ (Round off to two decimal places.)
View Solution
Step 1: Determine allele frequencies.
The frequency of red flowers (A2A2) is given as 0.25, which is \( q^2 \), so: \[ q = \sqrt{0.25} = 0.5. \]
Since \( p + q = 1 \), we find: \[ p = 1 - 0.5 = 0.5. \]
Step 2: Calculate the frequencies of genotypes.
The frequency of pink flowers (A1A2) is given by \( 2pq \), so: \[ 2pq = 2 \times 0.5 \times 0.5 = 0.5. \]
Step 3: Next generation after crossing pink and red plants.
In the next generation, pink (A1A2) and red (A2A2) plants will cross. The probability of producing a white flower (A1A1) from an A1A2 × A2A2 cross is: \[ P(A1A1) = 0.5 \times 0.5 = 0.25. \]
Thus, the frequency of white-flowered plants in the next generation will be \( \boxed{0.25} \). Quick Tip: To calculate the frequency of white-flowered plants in the next generation, use the Hardy-Weinberg equilibrium formula for allele frequencies and apply the probability of obtaining each genotype.


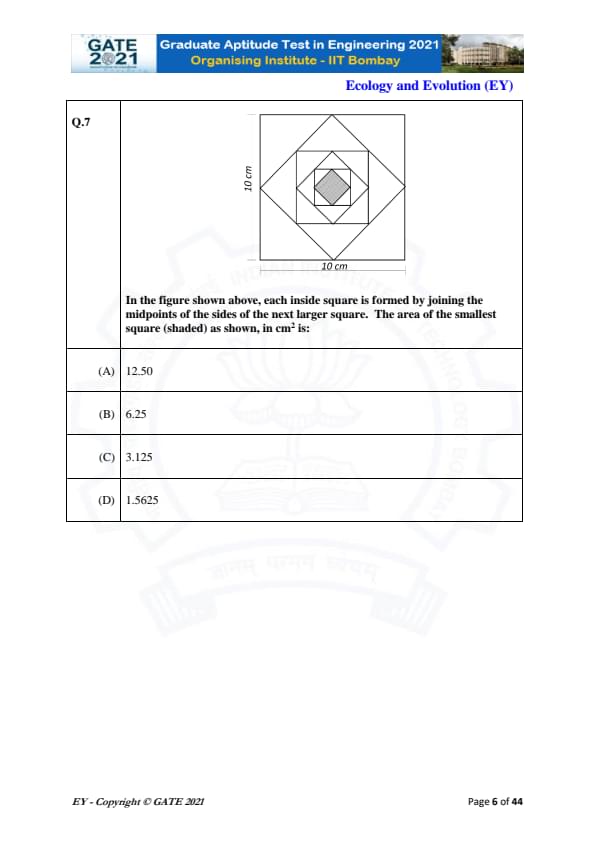
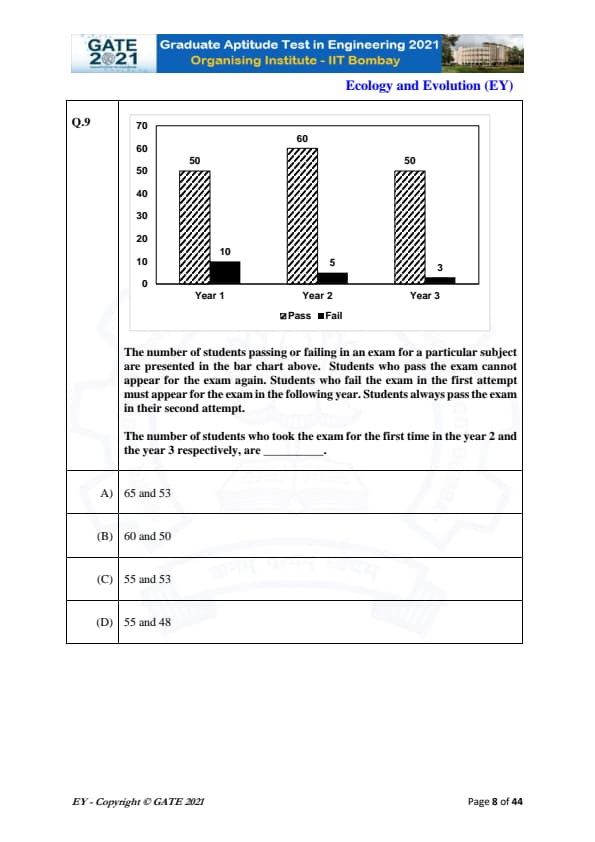
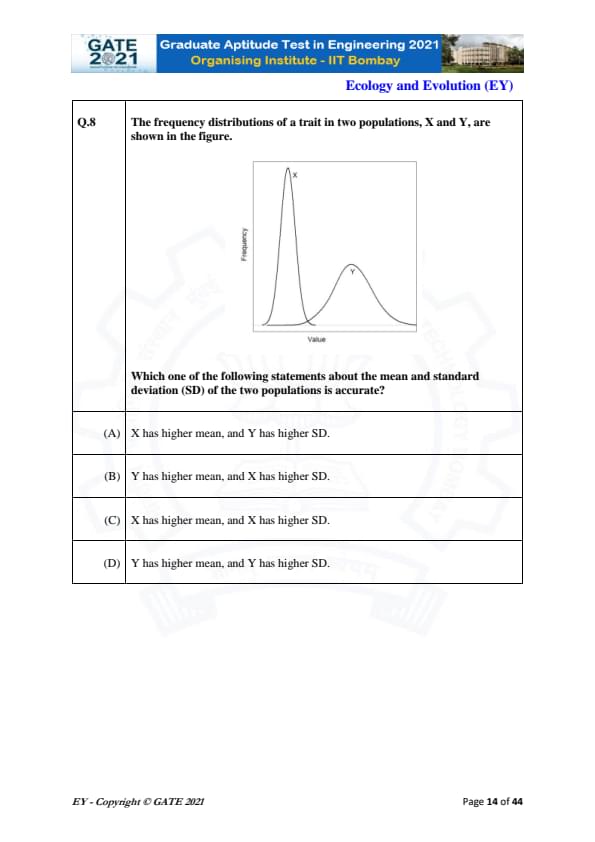
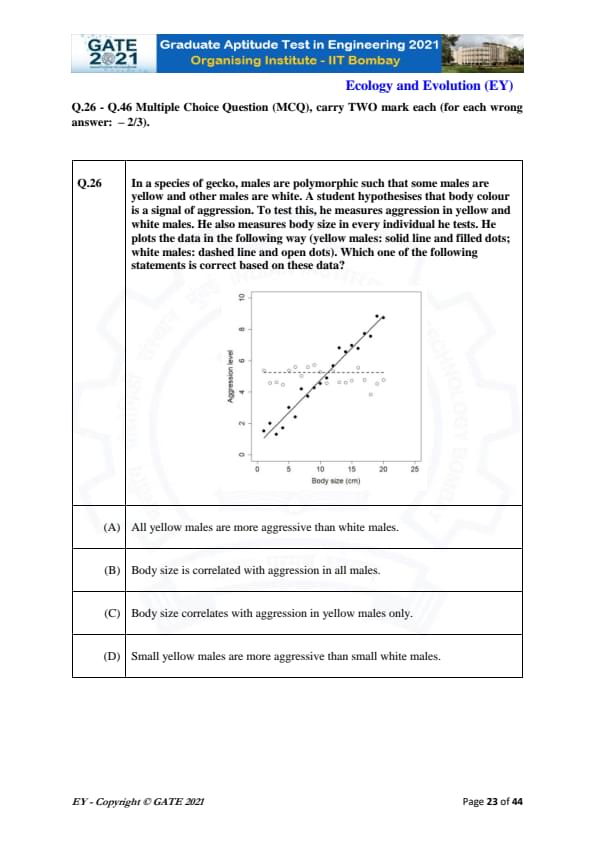
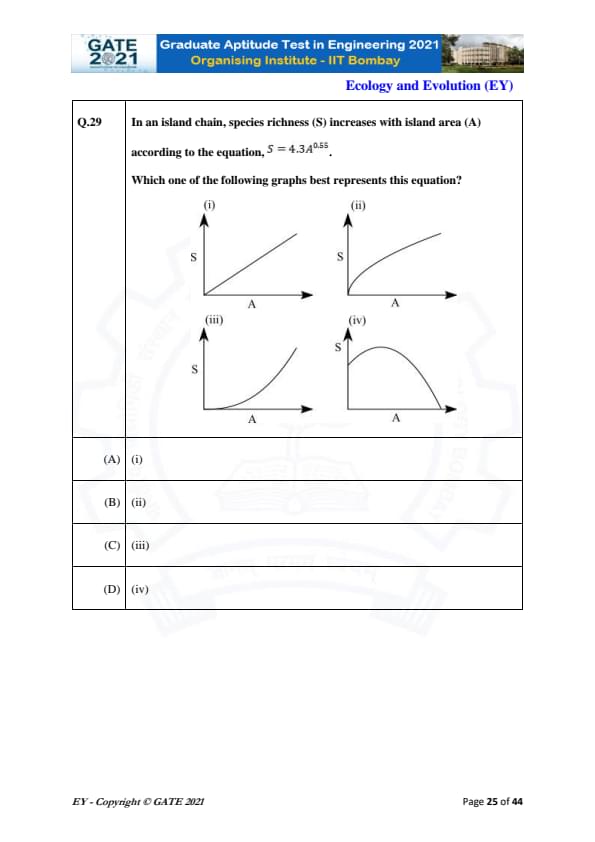
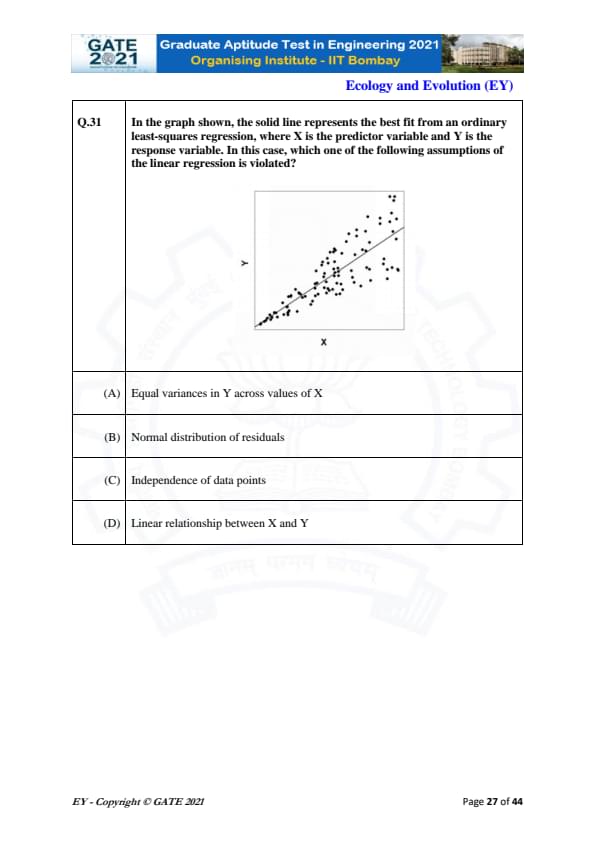
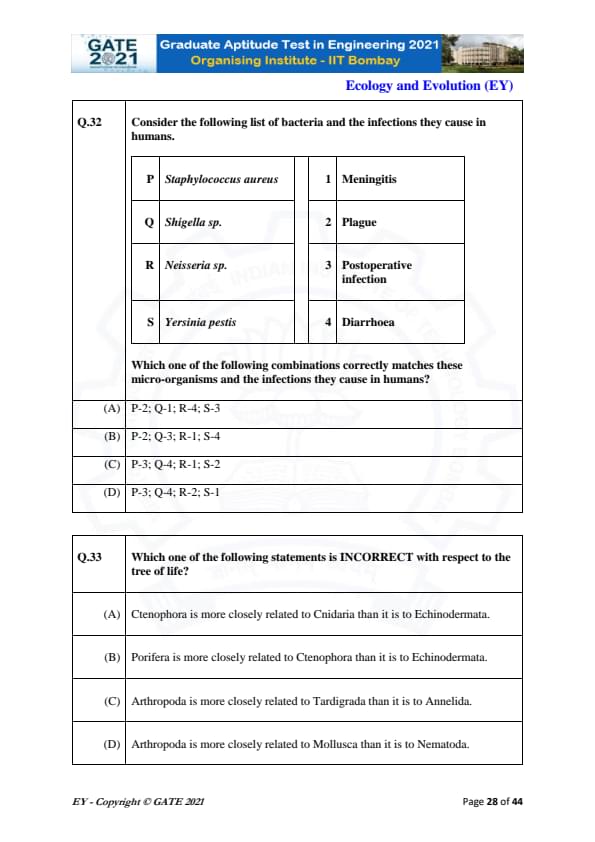
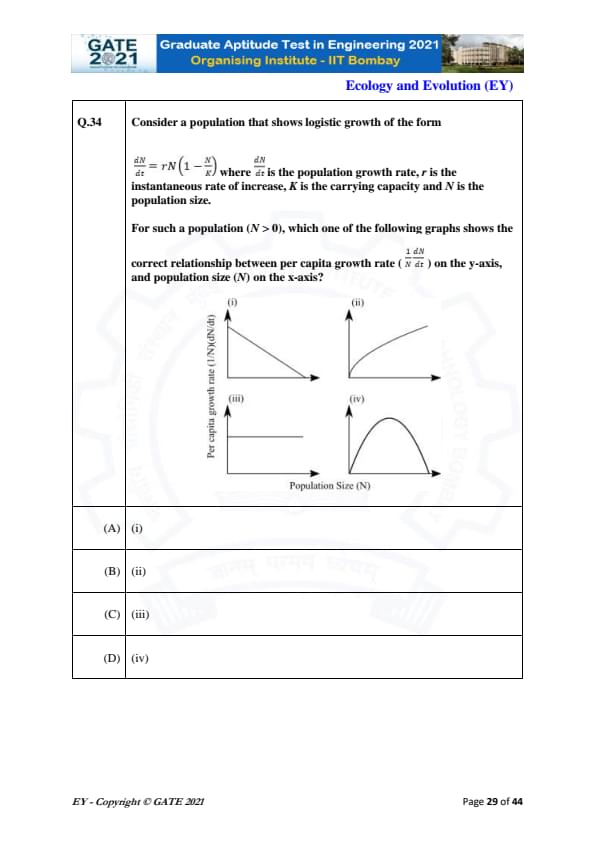
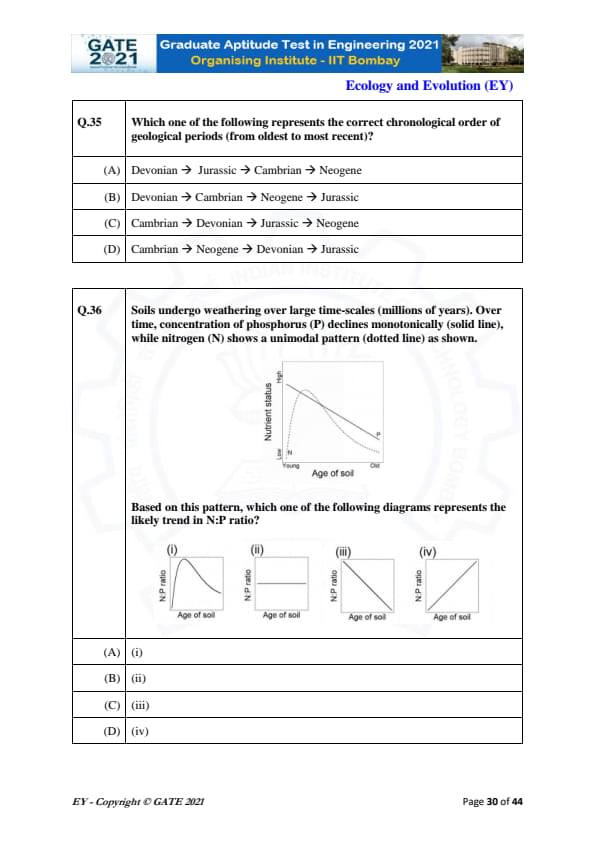
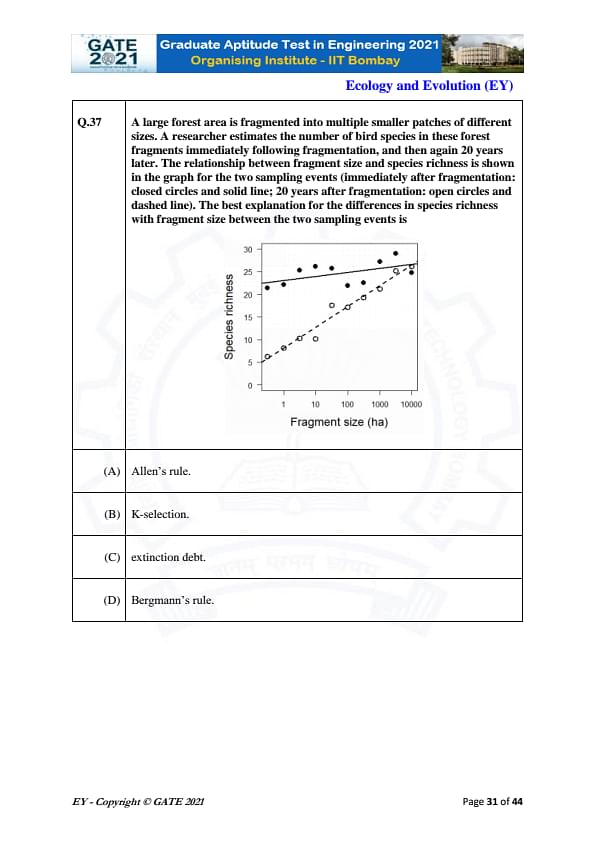
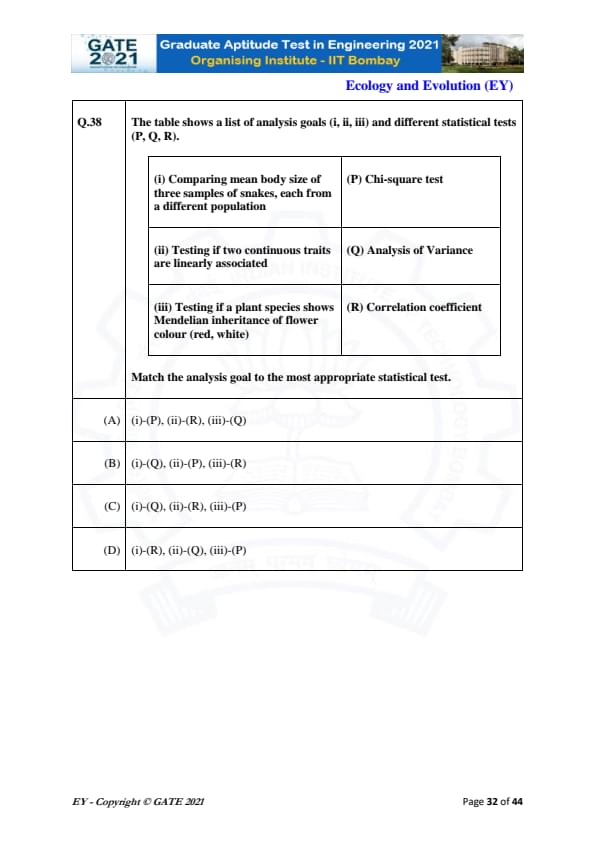
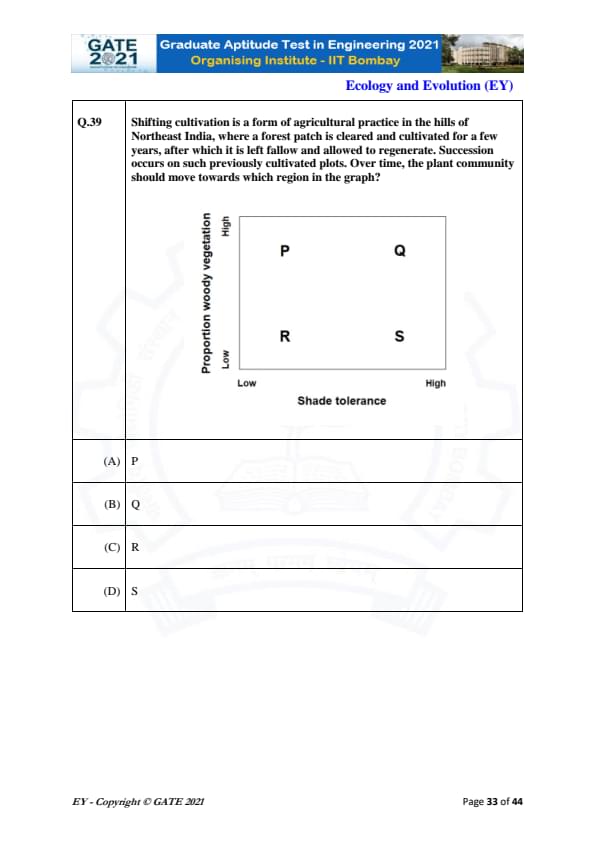
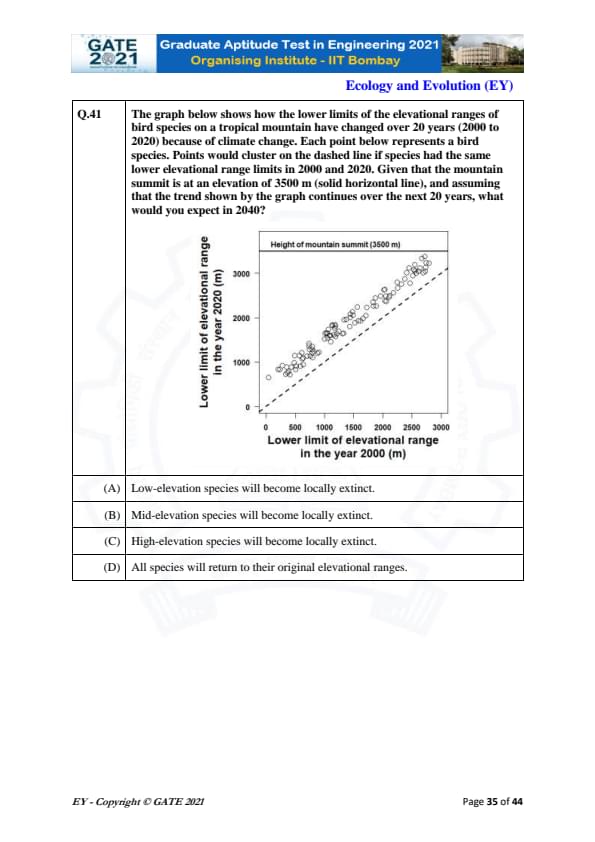
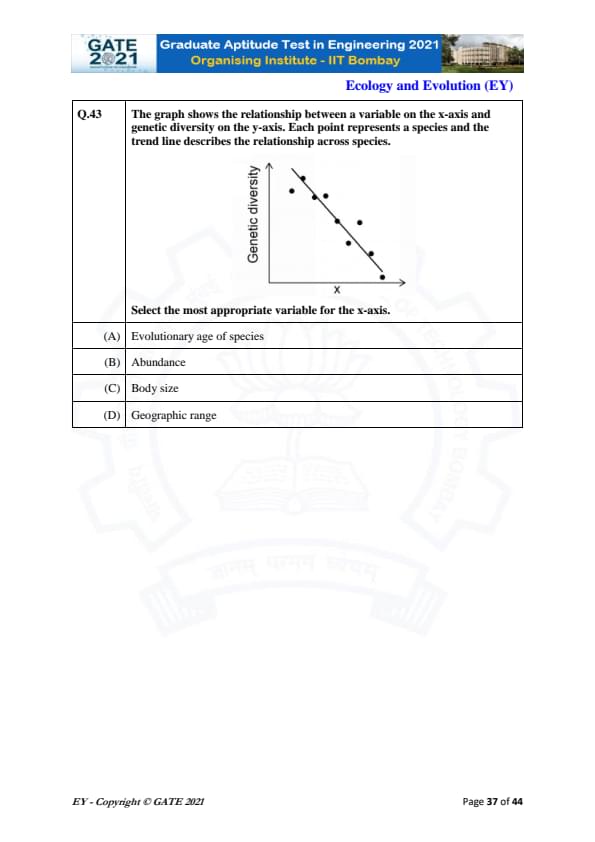
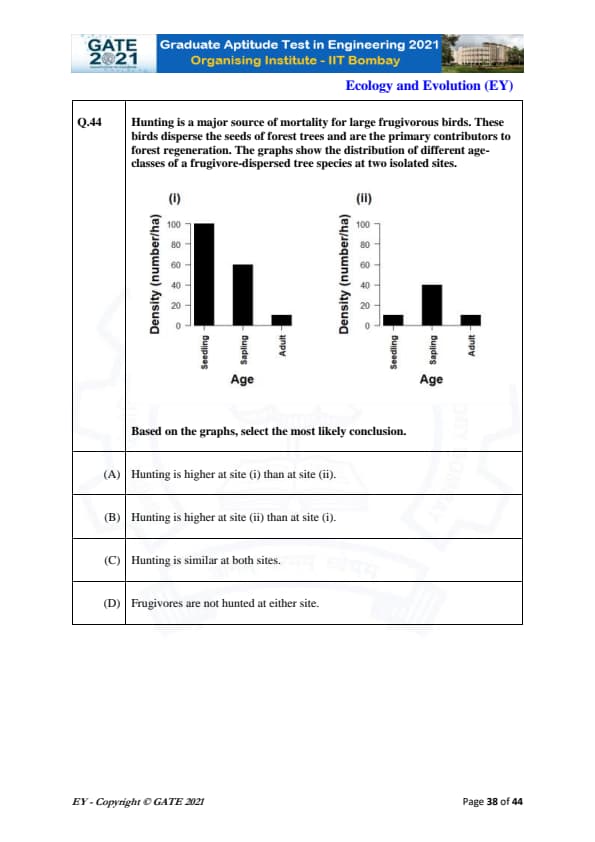
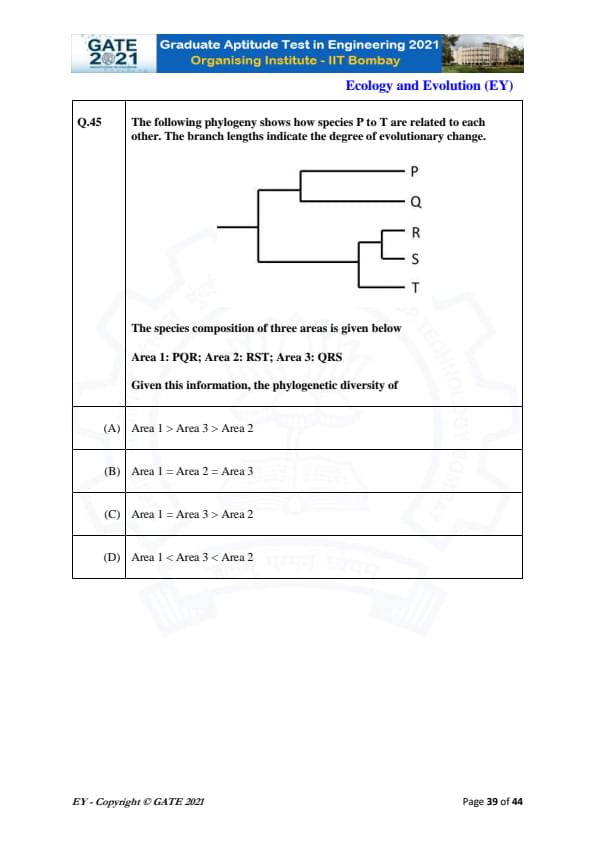
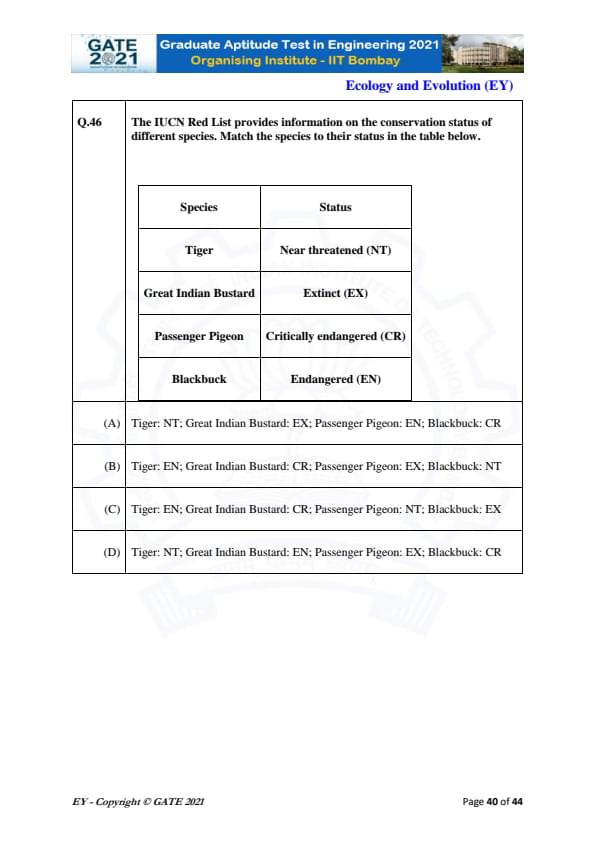
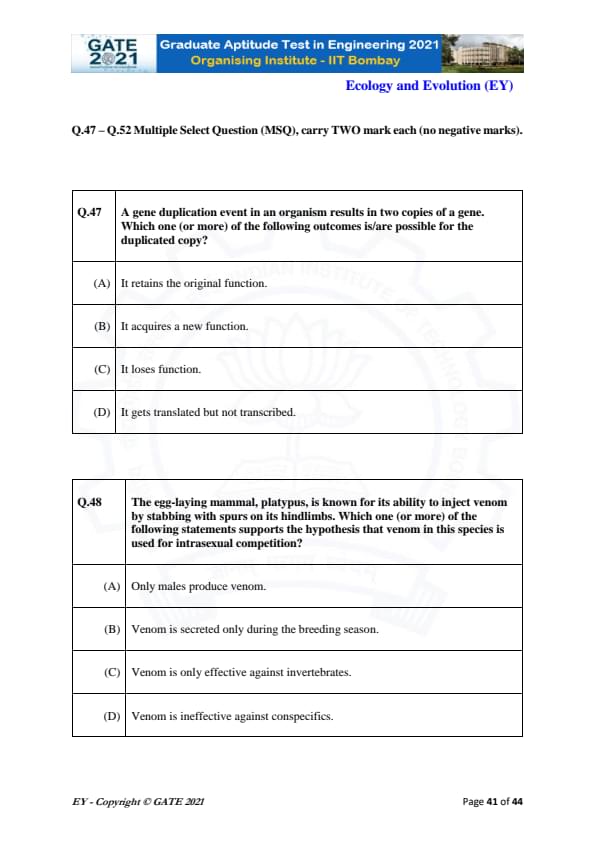
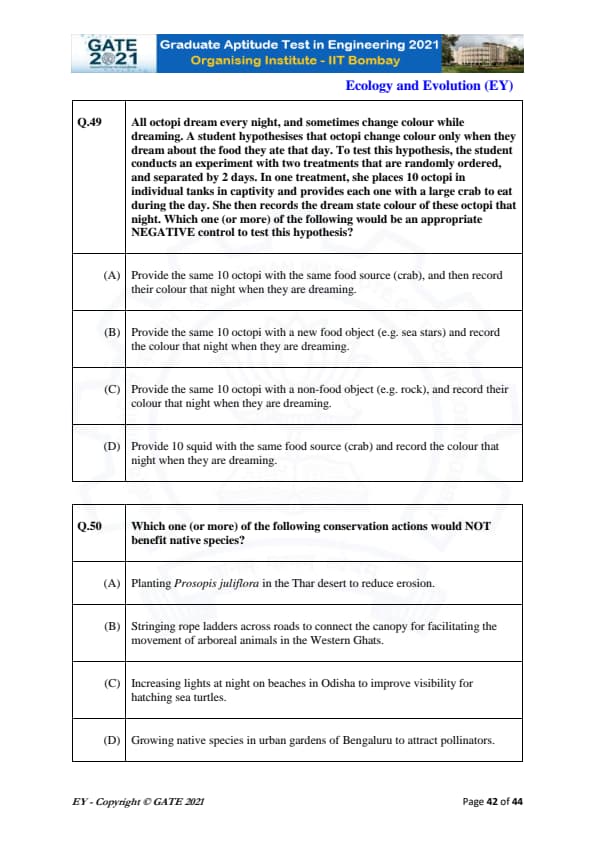
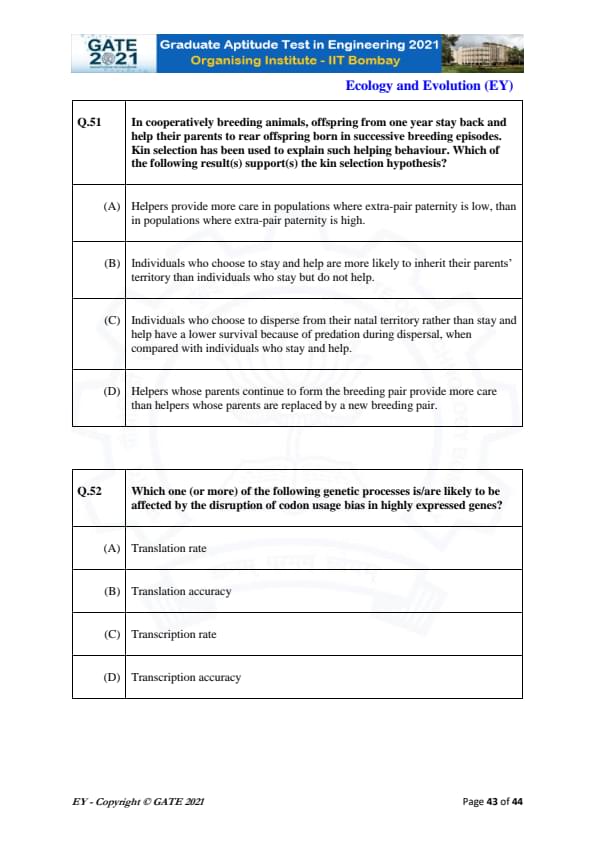
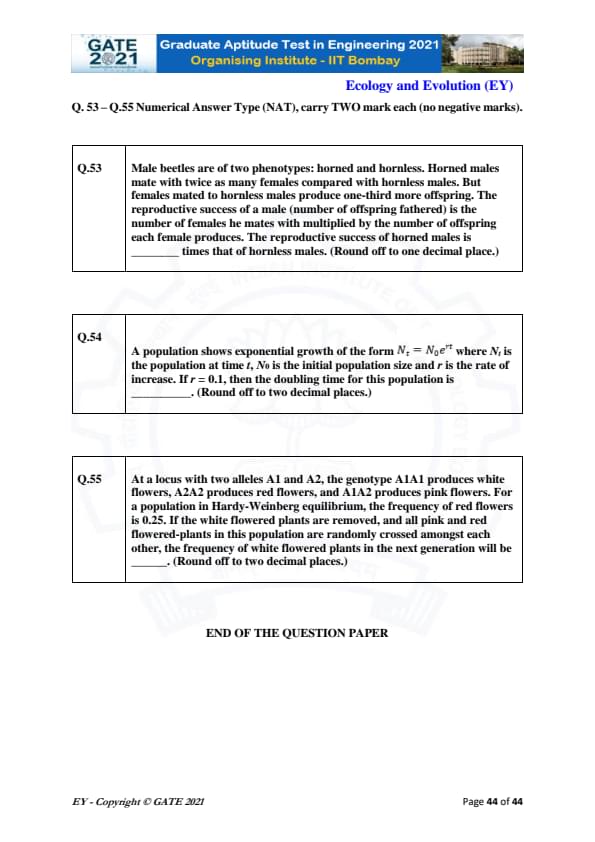
Quick Links:
GATE 2021 EY Paper Analysis
IIT Bombay modified the exam pattern of GATE 2021 exams. IIT Bombay introduced MSQs in GATE 2021 exams. MSQs comes with more or more than one correct answer.
Have a look at the below-mentioned table to get the question frequency of NATs, MCQs, and MSQs-
| Type of Questions | No. Of Questions Asked | Carried Marks |
|---|---|---|
| No. of 1 mark MCQs | 21 | 21 |
| No. Of 2 marks MCQs | 26 | 52 |
| No. Of 1 mark MSQs | 6 | 6 |
| No. Of 2 marks MSQs | 6 | 12 |
| No. Of 1 mark NATs | 3 | 3 |
| No. Of 2 marks NATs | 3 | 6 |
- General Aptitude section was accountable for a total of 10 questions out of 65 questions that were easy to attempt
- The remaining 55 questions related to EY section, that were of moderate level
- The contribution of NATs (Numerical Answer Types) questions was the least in GATE 2021 EY
- MSQs (Multiple Select Questions) contributed 12 questions, carried a total of 18 marks
- MCQs made the most significant contribution of 73% weightage in GATE 2021 EY
Also Check:
GATE 2021 EY Exam Pattern and Marking Scheme
The exam pattern would remain the same as previous years. 1 or 2 marks would be rewarded for each correct answer. ⅓ or ⅔ marks would be reduced for every question carrying 1 or 2 marks. Negative marking scheme is only limited to MCQs. However, NATs and MSQs are exempted from the list of negative marking.
- A candidate must attempt more than 45 questions to score more than 70 marks which is considered a good score in GATE 2021 EY
GATE Previous Year Question Papers:
| GATE 2022 Question Papers | GATE 2021 Question Papers | GATE 2020 Question Papers |
| GATE 2019 Question Papers | GATE 2018 Question Papers | GATE 2017 Question Papers |
Comments