




To calculate your CUET rank, first calculate the raw score with (correct answer x 5) - incorrect answer x 1) then convert raw score in percentile with the normalization formula. Then, the calculated percentile was with the expected rank.
- CUET rank is calculated based on CUET percentile and not the raw score.
- NTA uses a normalization formula to convert raw marks into a percentile, and then the percentile is used to calculate the CUET rank.
- The normalization formula to convert raw marks into percentiles is:
(100 x Number of candidates in the session with a raw score equal to or less than the candidate) / (Total number of candidates in that session).
CUET rank calculation is a relative and data-driven process, where strategy and understanding of percentile matter more than just scoring high marks.
Also Check:

Key Summary
- Many students assume higher marks = better rank, but due to normalization, the same marks can give different ranks in different shifts.
- The calculation process is multi-step raw score - normalized score - percentile - rank, making it more analytical than simple exams.
- Small score differences at higher marks can lead to large rank changes, showing intense competition at the top level.
- CUET rank is influenced not just by marks but also by number of candidates, exam difficulty, and score distribution.
How to Calculate Your CUET Rank
The same marks can give a different rank because of different exam difficulty (normalization). A small increase in marks at higher scores can improve the rank a lot, but at lower scores, the impact is smaller.
Calculation of Raw Marks
- In CUET UG, the first step is to calculate your raw score with marking scheme (for example, +5 for correct and -1 for wrong answers).
- This raw score is only a starting point it can change by around 10–20 marks after normalization so it does not directly decide your rank.
Calculation of Normalized Score
- CUET is held in multiple shifts the scores are provided on the basis of exam difficulty through normalization.
- If your shift was tougher then your score may increase slightly and it easier then it can reduce. It can change your percentile by around 0.5–1 point and shift rank by thousands.
Conversion of Marks into Percentile
- After normalization scores are converted into percentile that shows the relative position among all candidates.
- The formula provided below is used to calculate the raw score into the percentile, and then the percentile is calculated into the CUET rank.
CUET percentile calculator = (Number of candidates who scored equal to or lower than your raw score / Total number of test takers) * 100
Conversion of Percentile into Rank
- Rank is calculated based on percentile and total number of candidates appearing in the exam.
- For example, 99 percentile means you are in the top 1%, but the exact rank depends on total participation, so it is always a range, not a fixed number.
Ques. Is CUET rank calculated directly from marks?
Ans. No, CUET rank is not based directly on marks. It is calculated using the percentile score after normalization, which reflects your performance relative to other candidates.
Ques. How is CUET percentile calculated?
Ans. CUET percentile is calculated using the formula:
(Number of candidates scoring equal to or less than you ÷ Total candidates) × 100.
Ques. Why can the same CUET marks give different ranks?
Ans. Because of normalization across different exam shifts. If one shift is tougher, the same marks may result in a higher percentile and better rank.
| Babasaheb Bhimrao Ambedkar University CUET PG 2025 Cutoff |
| Central University of Punjab CUET PG 2025 Cutoff |
| Central University of Tamil Nadu CUET PG 2025 Cutoff |
| Assam University CUET PG 2025 Cutoff |
Example on How to Calculate CUET Score Out of 600?
The CUET percentile can be calculated by multiplying the marks obtained by students by 100 and then dividing the CUET marks obtained by you by 600. This process will find out the CUET percentile 2026 of the candidate.
(Marks obtained / total marks) * 100
Example - Suppose you obtained 520 marks in the CUET 2026 exam, then the CUET percentile will be calculated as follows:
Marks obtained = 520
Total marks = 600
CUET Percentile = (520/600) * 100 = 90%
The CUET percentile will be 90. Now use this number to predict the rank. You can use any rank predictor or simply use the table below to find out the expected CUET rank.
Now, according to the experts' prediction, the expected CUET rank for 90 percentile can be around 15,000+ rank.

Ques. Can I predict my CUET rank accurately?
Ans. Exact prediction is not possible, but you can estimate a rank range using percentile, previous year trends, and total number of candidates.
Also Check: CUET PG 2026 Answer Key Out
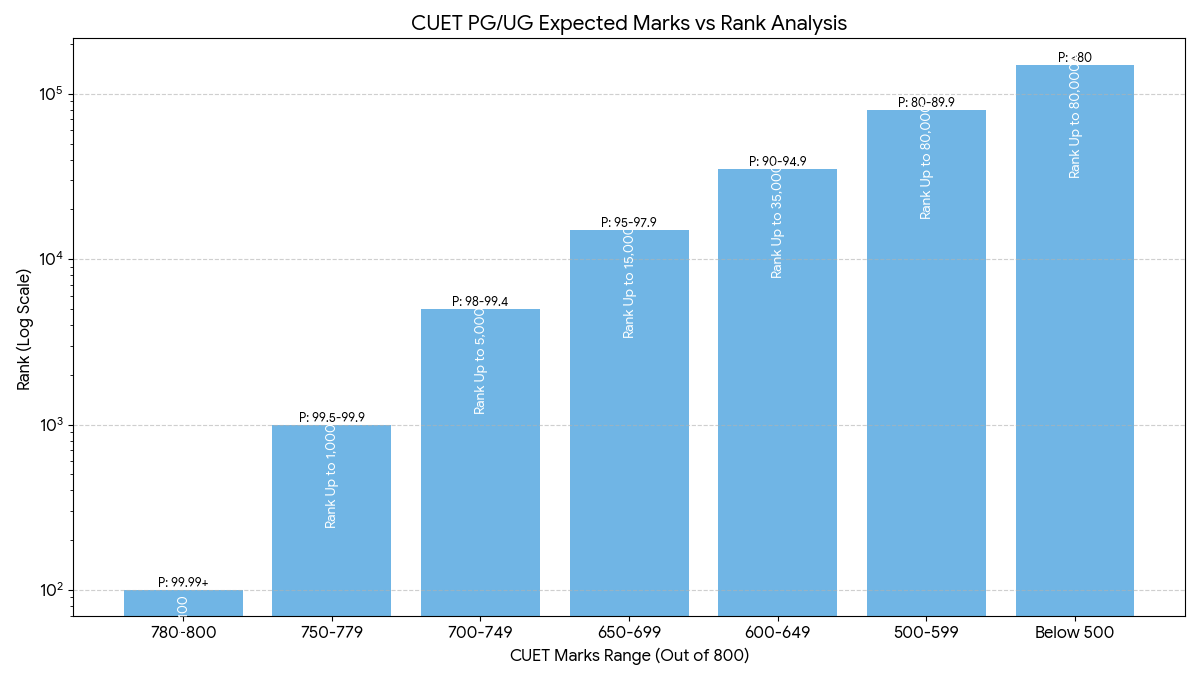
CUET Marks vs Rank vs Percentile
- The top band (780–800 marks) is extremely compressed, where a difference of even 5–10 marks can shift rank by hundreds, showing intense competition at the top.
- Between 750–800 marks, rank movement is highly sensitive—small score changes lead to large rank jumps, indicating a high density of top scorers.
| CUET Marks Range (Out of 800) | Expected Rank Range | Percentile Interpretation |
|---|---|---|
| 780 – 800 | 1 – 100 | 99.99+ |
| 750 – 779 | 101 – 1,000 | 99.5 – 99.9 |
| 700 – 749 | 1,001 – 5,000 | 98 – 99.4 |
| 650 – 699 | 5,001 – 15,000 | 95 – 97.9 |
| 600 – 649 | 15,001 – 35,000 | 90 – 94.9 |
| 500 – 599 | 35,001 – 80,000 | 80 – 89.9 |
| Below 500 | 80,000+ | Below 80 |
Related News: Check Expected CUET PG Qualifying and Cutoff Marks
Ques. What percentile is required for a good CUET rank?
Ans. Generally, 90+ percentile can give a decent rank, while 95–99+ percentile is needed for top colleges and courses.
Ques. Why do small marks differences affect rank a lot at higher scores?
Ans. Because many students score similar high marks, leading to rank compression, where even a small difference changes rank significantly.
Ques. Does the number of candidates affect CUET rank?
Ans. Yes, more candidates increase competition, which can push ranks lower even at similar percentiles.
Ques. Is CUET rank fixed for a particular score every year?
Ans. No, rank changes every year based on candidate count, exam difficulty, and score distribution.



Comments