




The CUET 2026 percentile tells candidates where they rank among all test-takers in the same session, not how many marks they scored. NTA calculates it subject-wise after normalising scores across shifts, and the number on the official scorecard is what universities use for admissions.
- CUET 2026 raw score uses 5 marks for each correct answer and deducts 1 for each wrong answer, out of 250 marks per subject.
- NTA normalises CUET 2026 scores using the equipercentile method so shifts with harder papers do not disadvantage those candidates.
- In CUET 2026, the highest raw score in any session automatically receives 100 percentile for that subject.
- Each subject percentile in CUET 2026 is calculated separately. NTA does not publish any combined percentile across all subjects.
Related Articles:
- CUET 2026 Marks vs Percentile: Score to Rank Conversion
- CUET 2026 Rank Predictor: Estimate Your All India Rank
- CUET 2026 College Predictor: Check Admission Chances by Score

Key Summary
- CUET percentile shows a candidate’s position relative to others in the same session, not the percentage of marks scored.
- Universities like DU, BHU, JNU, and JMI use normalised percentile for admission, not raw marks.
- NTA follows the same equipercentile method every year. Only the candidate data changes.
- Online calculators give an estimate, but the percentile on the official scorecard is final.
How to Calculate CUET 2026 Percentile: Formula and Steps
NTA runs the percentile calculation in four stages. The raw score comes first. Then the session-wise percentile is determined based on candidate distribution. After that, scores are equated across shifts of the same subject. The final output is the normalised NTA score that appears on the scorecard.
| Step | Formula / Action | Output |
|---|---|---|
| 1. Raw Score | (Correct × 5) − (Incorrect × 1) | Marks out of 250 |
| 2. Session Percentile | (Candidates ≤ your score ÷ Total in session) × 100 | Percentile (0 to 100) |
| 3. Cross-Session Equating | Linear interpolation across shifts | Equated percentile |
| 4. NTA Score | Normalised score on a common scale | Final scorecard number |
Ques. What is the official CUET 2026 percentile formula?
Ans. The formula NTA uses is: Percentile = [(Number of candidates with normalised score equal to or below your score) divided by Total candidates in that session] multiplied by 100. It runs session-wise first. Then scores from different shifts are equated using linear interpolation to account for varying difficulty levels.
CUET 2026 Marks Calculator: Raw Score Formula
Raw score is step one of the process. Candidates can calculate it independently once the answer key is out. The marking scheme is plus 5 per correct and minus 1 per wrong.
- Each CUET 2026 subject has 50 MCQs and a maximum of 250 marks.
- Wrong answers cut 1 mark each. Too many wrong attempts can pull the raw score down significantly.
- Skipping a question gives 0 marks. There is no penalty for unattempted questions.
- The raw score ranges from minus 50 at the lowest to 250 at the highest.
| Question Type | Marks Awarded |
|---|---|
| Correct Answer | +5 |
| Incorrect Answer | -1 |
| Unattempted Question | 0 |
| Multiple Answers Marked | -1 (treated as incorrect) |
Ques. How is the CUET raw score calculated?
Ans. Raw Score = (Correct answers × 5) minus (Incorrect answers × 1). A candidate with 40 correct and 7 wrong scores 200 minus 7, which is 193 out of 250. Unattempted questions add or subtract nothing.
CUET Normalisation: Why Percentile Is Not Percentage
These are two different metrics. The percentage is about the marks scored. The percentile is about where the candidate stands among everyone who sat that session.
- Percentage measures how many marks were scored out of the total. Percentile measures rank among all candidates in the same session.
- A candidate with 200 marks in an easy shift can end up with a lower percentile than someone who scored 180 in a harder shift.
- Universities build CUET merit lists using percentile, not percentage. Raw marks alone do not determine admission eligibility.
| Aspect | Percentage | Percentile |
|---|---|---|
| Definition | Marks ÷ Total marks × 100 | Rank position relative to others × 100 |
| Range | 0 to 100 | 0 to 100 |
| Depends On | Your performance only | Performance of all candidates |
| Affected by Shift | No | Yes (then normalised) |
| Used by Universities | No (for CUET admission) | Yes |
Step-by-Step Example: Calculate Your CUET 2026 Percentile
The example below uses assumed session data for Business Studies to show how all four steps work in sequence.
Example Scenario: Subject: Business Studies, Correct: 45, Incorrect: 4, Unattempted: 1 Session Candidates: 50,000 (assumed), Candidates with score equal to or below yours: 49,250 (assumed)
| Step | Calculation | Result |
|---|---|---|
| 1. Raw Score | (45 × 5) − (4 × 1) | 225 − 4 = 221 marks |
| 2. Rank Position | 50,000 − 49,250 = 750 | Rank 750 in session |
| 3. Percentile | (49,250 ÷ 50,000) × 100 | 98.5 percentile |
| 4. Final Normalised Percentile | After cross-session interpolation | ~98.5 percentile (final) |
Ques. Can a candidate calculate their CUET percentile manually before NTA releases the result?
Ans. The raw score can be worked out manually once the answer key is available. The percentile cannot. It needs session-wise candidate distribution data that only NTA holds. Online calculators use previous year figures as a proxy. Good for rough planning, not for the official number.
CUET 2026 Marks vs Percentile Reference Table
Figures below are based on CUET 2025 result trends. High-volume subjects like Business Studies and Political Science tend to have tighter percentile bands at the top end, where small score differences can shift the percentile noticeably.
| Marks (out of 250) | Expected Percentile (2026) | Standing |
|---|---|---|
| 250 | 100 | Top of Top |
| 240 to 249 | 99.5 to 99.9 | Excellent / DU Premier Colleges |
| 225 to 240 | 97.5 to 99.5 | Very Good / DU Top Tier |
| 210 to 225 | 94.0 to 97.5 | Good / BHU, JMI Top Programs |
| 190 to 210 | 89.0 to 94.0 | Above Average / Mid-tier DU, AMU |
| 170 to 190 | 82.0 to 89.0 | Average / State Central Universities |
| 140 to 170 | 70.0 to 82.0 | Below Average / Lower Cutoff Colleges |
| Below 140 | Below 70 | Low Merit |
Ques. What marks are needed for 99 percentile in CUET 2026?
Ans. Around 225 to 235 marks per subject depending on the subject. For high-volume subjects like Business Studies, the mark needed is closer to 235. For less competitive subjects, 225 may be enough to cross 99 percentile.
How CUET Percentile Calculator Tools Work
These tools use previous year data to estimate where a raw score lands in the percentile distribution. The output is always an approximation, not the NTA figure.
- Most calculators use the raw score as input and apply the previous year's percentile distribution curve to estimate the result.
- Some tools ask for the subject and expected shift difficulty to give a more refined estimate.
- College predictors take it further and map the percentile to likely universities and courses based on past cutoff data.
- No calculator gives the final percentile. All outputs are estimates until NTA releases the official result.
| Tool | Input | Output |
|---|---|---|
| Marks Calculator | Correct and incorrect answer count | Raw score (out of 250) |
| Percentile Calculator | Raw score, subject | Estimated percentile |
| Rank Predictor | Percentile, category | Estimated All India Rank |
| College Predictor | Percentile, course preference | Likely university list |
Ques. How accurate are CUET percentile calculators?
Ans. Generally within 1 to 3 percentile points of the actual NTA score. The gap depends on candidate count, shift difficulty, and subject. Use them for rough planning before results. The official NTA scorecard is the only number that counts for admissions.
CUET 2026 Official Notifications: Last 3 Years
NTA publishes the normalisation methodology in the information bulletin each year. The calculation steps stay the same. Only the candidate distribution data changes.
| Year | Document | Download Link |
|---|---|---|
| 2026 | CUET UG 2026 Information Bulletin | View on Official Site |
| 2025 | CUET UG 2025 Result & Normalisation Methodology | View on Official Site |
| 2024 | CUET UG 2024 Result & Percentile Statistics | View on Official Site |
Ques. Does NTA publish a composite percentile for CUET 2026?
Ans. No. Each subject has a separate percentile. Universities use either subject-wise percentiles or total normalised score depending on the course. Adding subject percentiles together gives nothing useful for admission.
Ques. Can two candidates with the same raw score get different CUET percentiles?
Ans. Yes, if they appeared in different shifts. A candidate from a harder session can get a higher percentile than someone with the same raw score from an easier one. That is the purpose of equipercentile normalisation.
Does normalization affect my CUET score?
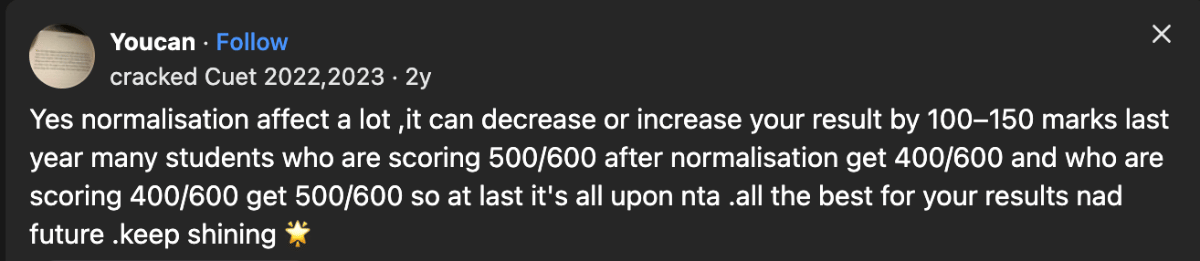
Source: Quora
Also Read:



Comments