


The CUET PG Soil Science exam in 2025 will be held on 30th March during Shift 3. After the exam, candidates will be able to access the question paper, answer key, and solution PDF. The exam tests knowledge in areas such as soil chemistry, soil fertility, soil physics, soil classification, and land management practices.
Students are required to attempt 75 questions in 60 minutes, totaling 300 marks. Each correct answer gives 4 marks, and 1 mark is deducted for every incorrect answer.
CUET PG Soil Science 2025 Question Paper with Solutions PDF
| CUET PG Soil Science Question Paper with Solutions PDF | Download PDF | Check Solutions |
The intensity of drizzling precipitation is generally:
The type of rainfall is called heavy, when its intensity is:
The intensity of rainfall for a 2-hour unit hydrograph is:
An instantaneous unit hydrograph is assumed to have the duration of rainfall occurrence as:
Contour bunds are recommended on the land slopes:
Which of the following is a permanent gully control structure?
For a straight inlet drop spillway with 1 m crest length and 1 m head above the crest, the discharge capacity will be:
The minimum wind velocity at 0.30 m from ground surface required to initiate the movement of the most erodible soil particle is about:
The size of the soil particles prone to saltation due to wind ranges from:
If a water pump delivers 10 liters of water in one second against the head of 38 meters, the water horse power required will be:
The water held tightly to the surface of soil particles by adsorptive forces is called:
In a soil sample, the void ratio 'l' and porosity 'n' are related as:
The instrument which is used to measure evapotranspiration in the field condition is:
For determination of moisture content in a soil sample, the moist sample is put in the oven for a period of:
One horse power is equal to:
In order to determine moisture content by oven drying method, the sample is kept in the oven fixed at a temperature of:
One-atmosphere pressure is equivalent to:
The soil having the maximum water holding capacity is:
The duty of canal water (hectare per cm per second) 'D', base period of crop 'b' in days and delta 'd' in meter are related as:
If the moist and oven dried weights of a soil sample are 100 gram and 80 gram, respectively, the moisture content of the sample on dry weight basis will be:
The water pressure developed by 25 meters of water head is about:
Drip emitters can discharge water ranging from:
A 100-hectare watershed with uniform land use has a time of concentration of 2 hours. What will be the peak runoff rate at its outlet due to a storm with uniform rainfall intensity of 6 cm/h for a fixed return period? The runoff coefficient is 0.60.
Bench terracing is to be done on a 25% sloped land with riser slope of 1:1 and width of level terrace as 6 m. The vertical interval for terraces will be:
If the diameter of the well is doubled, the water yield will increase by about:
Indian remote sensing satellite - 1C (IRS-1C) operates in how many spectral bands?
The portion of electromagnetic spectrum sensitive to human eyes ranges from:
The minimum grade for the drains of 10 cm diameter should be:
The mole drainage system is the most feasible in the fields with:
If 0.36 hectare area is draining excess water at the rate of 0.01 m\(^3\)/sec, the drainage coefficient will be:
Drainage coefficient is depth of water drained from an area during the period of:
If the spacing between the sprinklers on a lateral is doubled, the application rate will be:
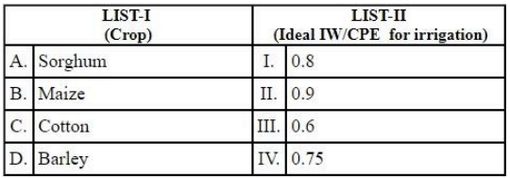
Match LIST I with LIST II

Choose the correct answer from the options given below:
The capacity of receiving bottle of non-recording raingauge is:
The general rules applicable for locating the raingauges:
A. The opening of the raingauge should be at least 50 cm above the ground level.
B. The raingauge should be located in an open space free from obstructions.
C. The distance of the raingauge from the obstruction should be at least twice the height of the obstruction.
D. Uneven topography should be avoided.
Choose the correct answer from the options given below:
The characteristics of the raindrops, which are important from soil erosion point of view are:
A. Raindrop size
B. Terminal velocity
C. Kinetic energy
D. Drop size distribution
Choose the correct answer from the options given below:
The chief advantages of strip cropping are:
A. Physical protection against blowing, provided by the vegetation.
B. Soil erosion is limited to a distance equal to the length of the strip.
C. Greater conservation of moisture.
D. The possibility of the earliest harvest.
Choose the correct answer from the options given below:
Transformation of rainfall at a place in a watershed into the channel flow has the following sequence:
A. Infiltration into soil
B. Depression storage
C. Occurrence of rainfall
D. Interflow
E. Surface runoff
Choose the correct answer from the options given below:
Starting from the water source, the sequence of parts of a drip irrigation system are as follows:
A. Main line
B. Laterals
C. Sub-main
D. Emitter
E. Pump and prime mover unit
Choose the correct answer from the options given below:
With reference to the electromagnetic spectrum, the sequences of various parts of spectrum with increasing order of wave length should be as follows:
A. X-rays
B. Microwaves
C. Infrared
D. Gamma rays
E. Radio waves
Choose the correct answer from the options given below:
The design of a terrace involves:
A. Proper spacing of terraces
B. Location of terrace
C. Design of channel with adequate capacity
D. Development of farmable cross section
Choose the correct answer from the options given below:
Which of the followings is not determined through flood routing?
Which of the followings are true for spillways?
A. The capacity of a chute is decreased by sedimentation at the outlet.
B. The hydraulic capacity of the pipe spillway is related to the cube root of the head.
C. The longitudinal spills serve to straighten the flow.
D. Drop spillways are usually limited to drops of 3 m.
Choose the correct answer from the options given below:
The hydrologic cycle is governed by which of the following equation?
Write the sequence in increasing order of average discharge of the following water lifting devices.
A. Persian wheel
B. Water wheel
C. Don
D. Rope and bucket lift
Write the order of the following regions according to their increasing order of annual rainfall amount received.
A. Karnataka Plateau
B. West Coast
C. Kutch in Gujarat
D. Eastern Coastal Plain
The probability of the occurrence of a rainfall event is calculated by
Write the sequence of the following type of Pan according to the value of pan coefficient in increasing order.
A. Class A Land Pan
B. ISI Pan
C. Colorado Sunken Pan
D. USGS Floating Pan
Write the sequence of flow of water through the Water turbine pump.
A. Turbine intake
B. Turbine runner
C. Pump intake
D. Draft tube
Choose the correct answer from the options given below:
Write the sequence of following soil texture layers according to their increasing radius of influence in wells.
A. Fine to medium sand
B. Fine sand
C. Course gravel
D. Coarse sand
Choose the correct answer from the options given below:
In deriving the equations for confined and unconfined aquifers, which of the following assumptions are used?
A. Change in the drawdown with respect to time is negligible.
B. The well penetrates the entire aquifer.
C. The flow is vertical and uniform everywhere in the horizontal section.
D. The flow is laminar.
Choose the correct answer from the options given below:
Write the steps involved in designing of a sprinkler system in a proper sequence.
A. Quantity of water to be applied
B. Application rate
C. Capacity of the system
D. Selection of sprinklers
Choose the correct answer from the options given below:
The infiltration rates observed by cylinder infiltrometers are affected by:
A. Cylinder diameter
B. Thickness of cylinder
C. Metal with which a cylinder is made of
D. Cylinder installation depth
Choose the correct answer from the options given below:
Arrange the parts of a tensiometer from the bottom to the top of the instrument.
A. Transparent pipe
B. Connecting tube
C. Ceramic cup
D. Vacuum gauge
Choose the correct answer from the options given below:
Read the following statements about border irrigation carefully:
A. Width of borders usually varies from 10 to 25 m.
B. For a sandy and sandy loam soil on moderate slopes and small to moderate irrigation streams, border length ranges from 30 to 90 m.
C. For a medium loam soil on moderate slopes and small to moderate irrigation streams, border length ranges from 100 to 180 m.
D. For a clay loam and clay soil on moderate slopes and small to moderate irrigation streams, border length ranges from 120 to 350 m.
Choose the correct answer from the options given below:
Match LIST I with LIST II
Choose the correct answer from the options given below:
Arrange the following soil types such that the spacing of drains (m) fall in a descending order.
A. Clay loam
B. Loam
C. Sandy loam
D. Peat
Choose the correct answer from the options given below:
Arrange the following irrigation efficiencies starting from source of water to water needed in the root zone:
A. Reservoir storage efficiency
B. Application efficiency
C. Storage efficiency
D. Conveyance efficiency
Choose the correct answer from the options given below:
Line up the following methods for ET\(_{0}\) estimation according to year of development, earliest to latest.
A. Blaney and Criddle
B. Radiation
C. Penman-Monteith
D. Modified Penman
Choose the correct answer from the options given below:
The scientist who has developed the flour pellet method for raindrop size determination is:
Class -A USWB pan has the following specifications:
A. It has metallic sheet of 22 gauge.
B. It has a diameter of 1.2 m.
C. It is painted as green.
D. It has a depth of 25 cm.
E. It is directly placed on the ground surface.
Choose the correct answer from the options given below:
The characteristic curves of a centrifugal pump has the following relationship:
A. Discharge versus Efficiency
B. Head versus BHP
C. BHP versus Discharge
D. Discharge versus Head
E. Efficiency versus Head
Choose the correct answer from the options given below:
Remote sensing data have the following type of resolutions:
A. Temporal resolution
B. Spectral resolution
C. Scattered resolution
D. Spatial resolution
E. Radiometric resolution
Choose the correct answer from the options given below:
If a centrifugal pump does not deliver the water, the possible causes are:
A. Priming is not done.
B. Lubrication is incorrect.
C. Pumping head is too high.
D. Suction pipe is clogged.
Choose the correct answer from the options given below:
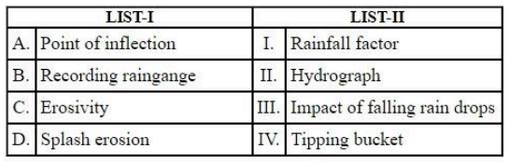
Match LIST I with LIST II

Choose the correct answer from the options given below:
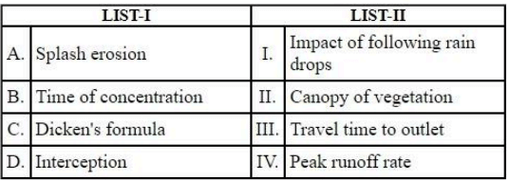
Match LIST I with LIST II

Choose the correct answer from the options given below:
Match LIST I with LIST II
Choose the correct answer from the options given below:
Match LIST I with LIST II

Choose the correct answer from the options given below:
Match LIST I with LIST II

Choose the correct answer from the options given below:
Match LIST I with LIST II

Choose the correct answer from the options given below:
Match LIST I with LIST II

Choose the correct answer from the options given below:
Match LIST I with LIST II
Choose the correct answer from the options given below:
Match LIST I with LIST II

Choose the correct answer from the options given below:
Match LIST I with LIST II

Choose the correct answer from the options given below:
Match LIST I with LIST II

Choose the correct answer from the options given below:


Comments