


As over 2.5 lakh candidates await the CAT 2025 results, many are unsure what their raw marks really mean. That’s where the CAT scaled score and normalisation process come in. It is a statistical adjustment that ensures fairness across different exam slots, regardless how the difficulty of each slot.
Also Read
How CAT 2025 scores convert to percentiles for IIM calls“once raw scores (based on correct and incorrect answers) are calculated, they are adjusted using slot-wise and section-wise normalisation ”, explained Maruti Sir, Co-founder, Cracku
This turns raw marks into a “scaled score,” which is then converted into an official percentile. Top B-schools use this metric for shortlisting.
Watch How Scaling & Normalisation Work | Detailed Explanation by Maruti Sir
CAT with 3 multiple slots and varying difficulty levels, the normalisation system ensures students from every slot are evaluated fairly before final percentiles are released.

Understanding CAT Raw vs Scaled Scores
Before diving into the normalisation process, candidates must distinguish between two fundamental score types:
Raw Score:
- This represents the absolute score calculated directly from marked answers.
- Candidates can get +3 marks for each correct response, while incorrect Multiple Choice Questions (MCQs) attract a -1 penalty.
- Type-In-The-Answer (TITA) questions carry no negative marking.
Scaled Score:
- This is the normalised score obtained after applying statistical formulas to adjust raw scores based on slot-specific difficulty levels.
- This final scaled score appears on the CAT result and determines percentile rankings.
According to Collegedunia's consolidated analysis, the scaling process operates independently for each of the three sections:
- Verbal Ability and Reading Comprehension (VARC),
- Data Interpretation and Logical Reasoning (DILR), and
- Quantitative Ability (QA).
Check:
- Collegedunia Launches IIM Call Predictor 2025 for CAT Students
- How Scaled CAT Score Calculated for the Three Slots?
The Scaling Formula Breakdown
Basic Linear Equation
At its foundation, the relationship between Raw Score and Scaled Score follows a linear equation:
Scaled Score = K × Raw Score + K1
Where
- K and K1 are constants that remain identical for all candidates within a specific slot and section.
"For everybody in that particular slot, these two constants will be the same. The only thing that will vary is the raw score." , emphasized Maruti Sir, Co-founder, Cracku
Official Technical Formula
According to the official CAT scaled score calculation document, the actual normalisation formula is:
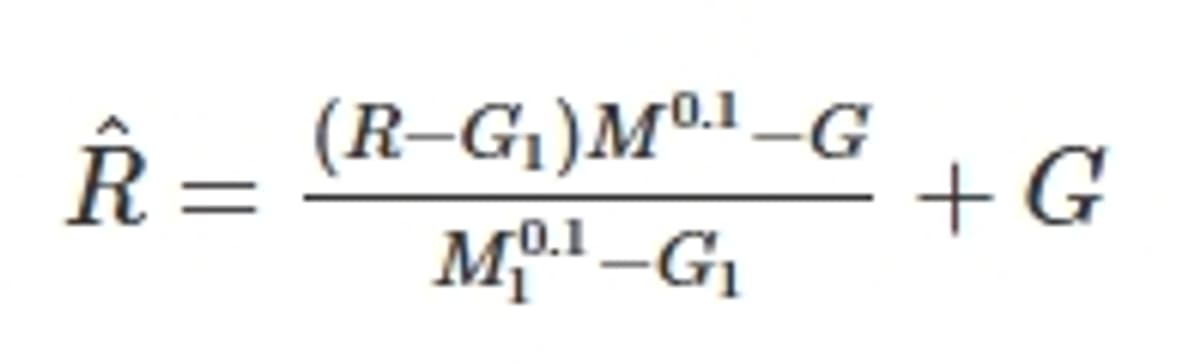
Where for each session (morning/afternoon/evening):
| Component | Representation | Explanation |
|---|---|---|
| R̂ | Scaled Score | Final adjusted score for the section |
| R | Raw Score | Actual marks obtained in the section |
| G_session | Session-Specific Baseline | Mean + Standard Deviation (M_session + S_session) of all candidates in that particular session |
| G | Overall Baseline | Mean + Standard Deviation (M + S) across all three sessions combined |
| μ₀.₁ | Overall Top 0.1% Mean | Mean raw score of top 0.1% candidates across all sessions |
| μ_session_0.1 | Session Top 0.1% Mean | Mean raw score of top 0.1% candidates in the specific session |
Breaking Down the Scaling Constant (K)
The scaling constant K in the simplified equation is actually:
K = (μ₀.₁ - G) / (μ_session_0.1 - G_session)
This ratio compares:
- Numerator: How far the overall top performers are from the overall average
- Denominator: How far the session's top performers are from that session's average
If top performers in your session scored relatively lower than in other sessions, this ratio becomes greater than 1, indicating upward scaling to compensate for the tougher paper.
Also Check:
- Academic and work-experience weightage in CAT 2025
- Important WAT topics for IIMs
- PI preparation tips and common interview questions for IIMs
- Complete the IIM admission process for 2026
Example: How CAT Scaled Score Normalisation Works
Step 1: Assume Raw Score and Session Stats
| Component | Meaning | Example Value |
|---|---|---|
| R | Your raw score in the section | 45 |
| G_session | Baseline for your slot = Mean + SD of your session | 30 |
| G | Overall baseline = Mean + SD across all slots | 35 |
| μ_session_0.1 | Mean of top 0.1% performers in your slot | 55 |
| μ₀.₁ | Mean of top 0.1% performers across all slots | 60 |
Step 2: Compute the Scaling Constant K
Formula:
K = (μ₀.₁ - G) / (μ_session_0.1 - G_session)
Substitute values:
K = ( 60-35) / (55-30)= 25/25=1
In this scenario, top performers in all slots performed similarly, so no scaling bias
Step 3: Apply Full Normalisation Formula

Substitute values:
R^= (45-30) x 1 + 35 = 15 + 35 = 50
Even though the candidate’s raw score was 45, the scaled score increased to 50 because:
- Their performance was above the slot baseline (30)
- The overall paper may have been slightly tougher in its slot
Let’s See a Case Where Scaling Helps More
If the afternoon slot was harder, top performers scored lower. Example:
| Component | Value |
|---|---|
| μ_session_0.1 | 50 (lower, because slot was harder) |
| G_session | 28 (also lower) |
| Others | Same as before |
Now recalculate K:
K = (60-35) / (50-28) = 25/22= 1.14
Now normalised score:
R^= ( 45-28) * 1.14 + 35 = 17 x 1.14 + 35= 19.38 +35 = 54.38
A 9.4 mark increase over the raw score, because the candidate’s slot was statistically tougher than others
Click here to find out which IIMs don’t consider work experience during admissions.

From Scaled Score to Percentile
Once scaled scores are calculated for all candidates, percentile determination follows the official methodology outlined in the CAT Scaled Score Calculation document:
Official Percentile Calculation Steps
| Action | Formula/Method |
|---|---|
| Count total candidates (N) | All candidates across three sessions |
| Assign ranks (r) based on scaled scores | Tied scores receive identical ranks; next rank skips accordingly |
| Calculate percentile | P = [(N - r) / N] × 100 |
| Round to two decimal places | ≥99.995 becomes 100; ≥99.985 but <99.995 becomes 99.99 |
Rank Assignment Logic
According to the official document, if two or more candidates obtain identical scaled scores, they receive the same rank. For example:
- Two candidates with the highest score both get rank 1
- The candidate(s) with the second-highest score get rank 3 (not rank 2)
Read:
Estimation Methodology for Score Calculators
Based on Collegedunia's consolidated data from Maruti Sir's video and internal analysis, score calculator accuracy depends on three key factors:
- Mean and Standard Deviation (G1 and G):
- With response sheets from approximately 80,000+ candidates, these statistical measures prove remarkably precise.
- According to the analysis, "From 80,000 to three lakhs, it is not going to change quite a lot."
- The K Constant:
- This requires identifying the top 0.1% performers across slots, approximately 300 candidates from a pool of 3 lakh test-takers.
- The challenge lies in accounting for submission rates, as not all toppers upload response sheets.
| Percentile Range | Total Candidates | Estimated Upload Ratio |
| 99.9% (Top 100) | 300 candidates | Around 2.0 (50% upload rate) |
| 99% (Top 1000) | 3,000 candidates | Around 2.5 (40% upload rate) |
| Overall Average | 3,00,000 candidates | Around 3.5 (28.5% upload rate) |
The Collegedunia analysis reveals that upload ratios are adjusted progressively, starting at approximately 2.0 for the top 100 candidates and gradually increasing to 3.5 for the entire candidate pool.
Also check:
- What 40 marks in CAT convert to in percentile
- Colleges accepting around 80 marks in CAT
- IIMs and non-IIMs that shortlist at 97 percentile
To sum up, the CAT scaling and normalisation system represents a statistical methodology designed to eliminate advantages or disadvantages arising from slot-specific difficulty variations. By measuring individual performance relative to slot averages and adjusting through carefully calculated constants, the process ensures that every candidate's scaled score accurately reflects their actual ability rather than the random difficulty of their assigned paper.
For CAT 2025 aspirants, understanding this mechanism provides valuable insight into how raw marks translate to final percentiles, helping them better interpret unofficial score predictions and prepare realistic expectations for admission opportunities at premier B-schools across India.
Related News:
Comments