


GRE 2024 Quantitative Reasoning Practice Test Set 1 Question Paper with Solutions PDF is available for download. The overall test time is about 1 hour and 58 minutes. GRE has total 5 sections:
- Analytical Writing (One "Analyze an Issue" task, Alloted time 30 minutes)
- Verbal Reasoning (Two Sections, with 12 questions and 15 questions respectively)
- Quantitative Reasoning (Two Sections, with 12 questions and 15 questions respectively)
GRE 2024 Qantitative Reasoning Practice Test Set 1 Question Paper with Solutions PDF
| GRE 2024 Quantitative Reasoning Set 1 Question Paper with Solutions PDF | Check Solutions |

Compare Quantity A and Quantity B, using additional information centered above the two quantities if such information is given, and select one of the four answer choices:
A symbol that appears more than once in a question has the same meaning throughout the question.
\[ 10^x = 10,000,000,000 \]
Compare Quantity A and Quantity B, using additional information centered above the two quantities if such information is given, and select one of the four answer choices:
A symbol that appears more than once in a question has the same meaning throughout the question.
\[ 10y + 20x = 50 \]
Compare Quantity A and Quantity B, using additional information centered above the two quantities if such information is given, and select one of the four answer choices:
A symbol that appears more than once in a question has the same meaning throughout the question.
Figure is not drawn to scale
Compare Quantity A and Quantity B, using additional information centered above the two quantities if such information is given, and select one of the four answer choices:
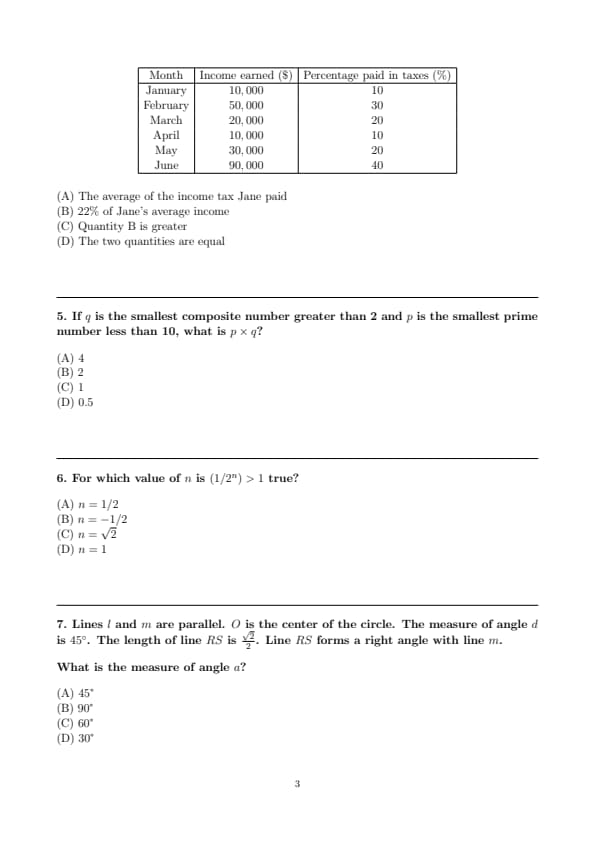
The following table displays the income Jane's business earned and the percentage of that income she paid in taxes for the first half of the year.

If \( q \) is the smallest composite number greater than 2 and \( p \) is the smallest prime number less than 10, what is \( p \times q \)?
For which value of \( n \) is \( (1/2^n) > 1 \) true?
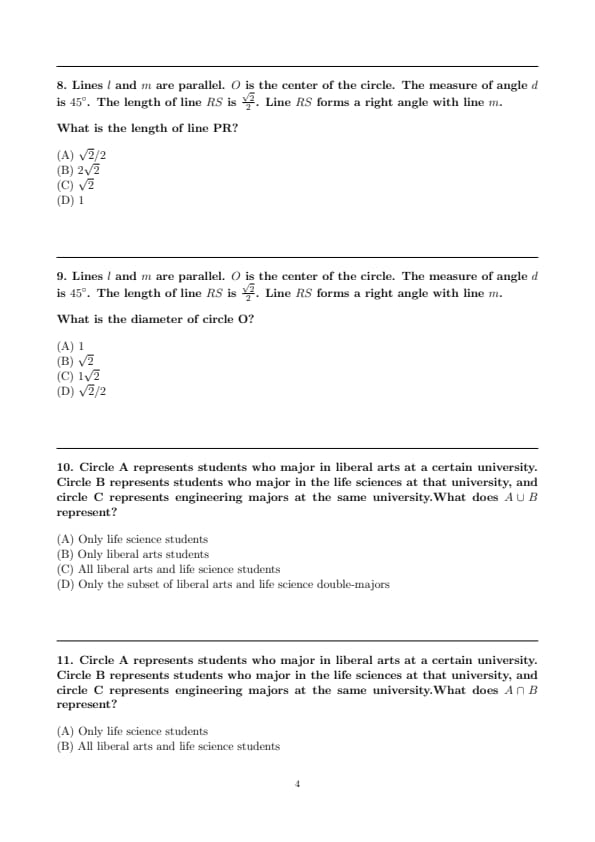
Lines \( l \) and \( m \) are parallel. \( O \) is the center of the circle. The measure of angle \( d \) is \( 45^\circ \). The length of line \( RS \) is \( \frac{\sqrt{2}}{2} \). Line \( RS \) forms a right angle with line \( m \).
What is the measure of angle \( a \)?
Lines \( l \) and \( m \) are parallel. \( O \) is the center of the circle. The measure of angle \( d \) is \( 45^\circ \). The length of line \( RS \) is \( \frac{\sqrt{2}}{2} \). Line \( RS \) forms a right angle with line \( m \).
What is the length of line PR?
Lines \( l \) and \( m \) are parallel. \( O \) is the center of the circle. The measure of angle \( d \) is \( 45^\circ \). The length of line \( RS \) is \( \frac{\sqrt{2}}{2} \). Line \( RS \) forms a right angle with line \( m \).
What is the diameter of circle O?
Circle A represents students who major in liberal arts at a certain university. Circle B
represents students who major in the life sciences at that university, and circle C represents
engineering majors at the same university.What does \( A \cup B \) represent?
Circle A represents students who major in liberal arts at a certain university. Circle B
represents students who major in the life sciences at that university, and circle C represents
engineering majors at the same university.What does \( A \cap B \) represent?
Compare Quantity A and Quantity B, using additional information centered above the two quantities if such information is given, and select one of the four answer choices:
\[ A \times B = (AB)^2 + (A + B)^2 \]
The electrical engineering department at a certain graduate school in the United States (US) has a total of 36 students. The department has twice as many male students as female students and three times as many international students as students who are US citizens.
Quantity A: The number of students who are US citizens
Quantity B: The number of female students
Compare Quantity A and Quantity B, using additional information centered above the two quantities if such information is given, and select one of the four answer choices:
R is the center of the circle below:
Quantity A: Half the circumference
Quantity B: The area of triangle QRS
Compare Quantity A and Quantity B, using additional information centered above the two quantities if such information is given, and select one of the four answer choices:
The graph below shows the gross domestic product (GDP) in trillions of US dollars for four countries between 2000 and 2008.
Quantity A: The combined GDP of Japan, China, and Canada in 2008
Quantity B: The GDP of the US in 2008


Comments