Muskan Shafi Education Content Expert
Education Content Expert
Graphical Representation of Motion is an easy and effective way to understand and analyse the motion of an object. It helps to calculate and get the basic information about the various physical quantities during the motion more quickly by representing the data in a graph.
- Motion is defined as the change in the position of an object with respect to time.
- The motion of an object can be represented easily on a graph to understand various related phenomena.
- Graphs offer an easy way to understand the relationship between two physical quantities.
- Line graphs are used to depict the motion of an object.
- The dependent quantity is plotted on the Y-axis, while the independent quantity is plotted on the X-axis.
Read More: NCERT Solutions for Class 9 Science Motion
Key Terms: Graphical Representation of Motion, Distance Time Graph, Velocity, Velocity Time Graph, Motion, Acceleration-Time Graph
Graphical Representation of Motion
[Click Here for Sample Questions]
Graphical Representation of Motion is the representation of the motion of an object using line graphs. It is a method of representing a set of variables graphically with the help of a line graph where one physical quantity depends on the other physical quantity.
- It is a convenient and effective way to describe the nature of the motion of an object.
- it makes analysing the change in numerous physical quantities for an object in motion simple.
- Graphs are extremely beneficial when studying the linear motion of an object.

The three main types of graphs covered under Graphical Representation of Motion are:
- Distance-Time Graph
- Velocity-Time Graph
- Acceleration-Time Graph
Read More:
Distance-Time Graph
[Click Here for Sample Questions]
Distance is the overall distance travelled by an object.
- It is measured in units of ‘meters’.
- Distance is directly proportional to the time taken.
- A distance-time graph is used to study the distance travelled by an object in a specific amount of time.
- The Y-axis (left) represents distance, while the X-axis represents time (bottom).
- The slope of a distance-time graph gives us the speed of the object.
- Distance-time graphs can be made for a uniform speed or for a non-uniform speed.
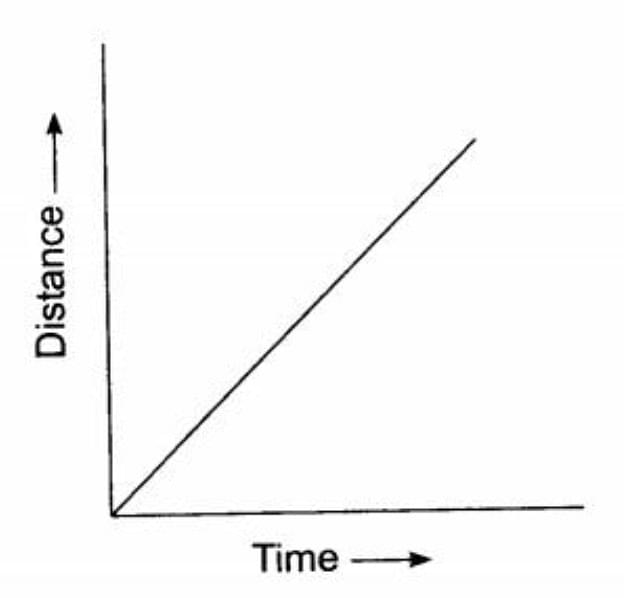
Distance-Time Graph for Uniform Motion
If an object is covering equal distances in equal time intervals, then it is said to have uniform motion. The distance-time graph for uniform motion is a straight line passing from the origin.
The distance-time graph for uniform motion is as follows:

Distance-Time Graph for Uniform Motion
Distance-Time Graph for Non-Uniform Motion
When an object covers unequal distances in equal intervals of time, it is said to be in non-uniform motion. The nature of such a graph shows a non-linear variation of the distance travelled by the object with time.
The distance-time graph for non-uniform motion is given as

Distance-Time Graph for Rest
When an object does not change its position with respect to time, it is said to be at rest. The distance-time graph for an object at rest will be a straight line parallel to the time axis as given below:

Read More: Motion Class 9 Important Questions
Velocity-Time Graph
[Click Here for Sample Questions]
Velocity-Time Graph describes the variation in velocity with time for an object moving in a straight line.
- Acceleration is the rate at which velocity varies with time.
- The slope of the velocity-time graph gives us the acceleration of an object.
- Velocity-Time Graph is a straight line in which the x-axis represents time, while the y-axis represents the velocity.
- They are popularly known as V-T graphs.
Acceleration = Change in Velocity / Time
| \(a = { \Delta\ v \over \Delta\ t}\) |
Velocity-Time Graph for Uniform Velocity
In the case of uniform velocity, the magnitude and direction of the object remain the same with time. The velocity-time graph for uniform velocity will be a straight line parallel to the time axis as the acceleration of the body is zero.

Velocity-Time Graph for Acceleration
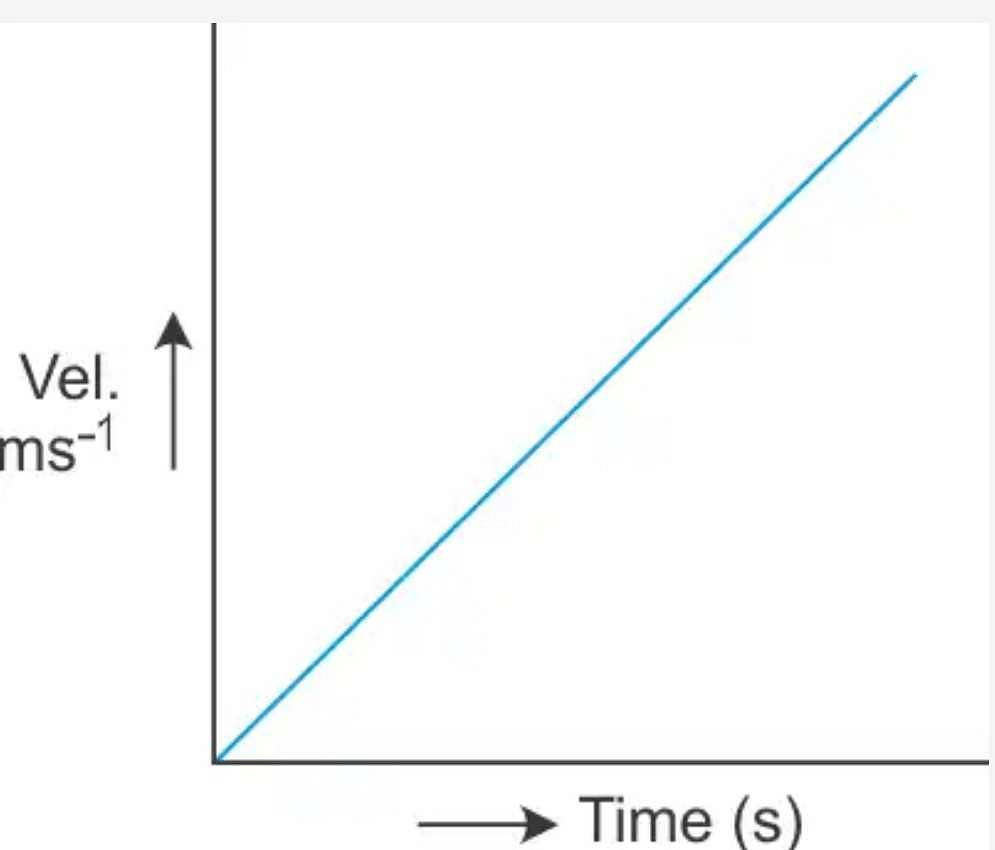
Velocity-time graph for an object whose velocity is increasing at a uniform rate is a straight line given as follows:

Velocity-Time Graph for Acceleration
Velocity-Time Graph for Retardation
Retardation is defined as the negative acceleration which happens when the velocity decreases with time. Velocity-time graph for an object whose velocity is decreasing at a uniform rate is as follows:

Acceleration-Time Graph
[Click Here for Sample Questions]
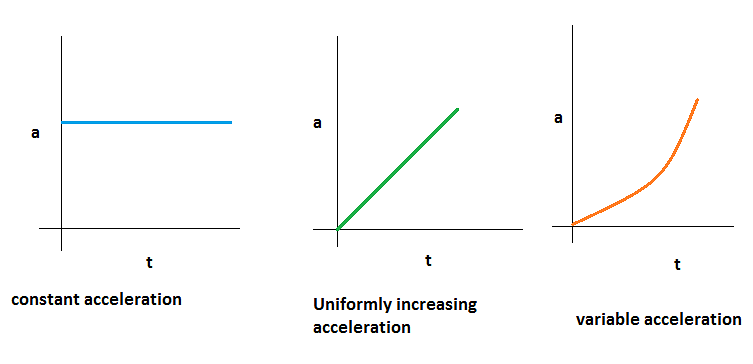
Acceleration time graph is used to calculate the change in velocity during a specified time interval.
- The time taken by the object is on the x-axis, and the acceleration of the item is on the y-axis.
- The area under the graph represents the change in the velocity of the object over the given period of time.

Acceleration-Time Graph
Check More:
Things to Remember
- Graphical Representation of Motion is a method of representing a data set pictorially with the help of a line graph.
- A graph depicts the relationship between two data sets, where one physical quantity depends on the other physical quantity.
- The distance-time graph shows how a body's displacement changes over time.
- The slope of the distance-time graph is used to calculate the velocity of the body.
- The slope of the velocity-time graph is used to calculate the acceleration of the body.
- A positive slope on a velocity-time graph indicates object acceleration.
- A negative slope indicates object deceleration or retardation.
Sample Questions
Ques. What are the benefits of Graphical Representation of Motion? (2 Marks)
Ans. The following are some of the benefits of Graphical Representation of Motion:
- The graphical representation of motion helps in the interpretation of information about an object's distance, speed, and acceleration at any given time.
- The displacement-time graph can quickly determine the velocity of a moving item.
Ques. What does linear motion look like on the graph? (2 Marks)
Ans. The graphical depiction of linear motion is a pictorial representation of the motion of a body traveling along a straight line. The displacement-time graph of a car traveling along a straight road at a constant speed in a straight line that is not parallel to the time axis, for example.
Ques. What role does a graphical representation have in describing an object's motion? (2 Marks)
Ans. The graphical representation of an object's motion not only makes it easier to comprehend the nature of the movement but also makes it simple to locate the various parameters by simply looking at the graph. The graph of the motion can be used to determine some of the values of various parameters. For example, if the graphs of two objects moving at the same constant velocity are plotted on the same distance-time graph, the item with the greatest slope is moving at a faster rate.
Ques. What are the different types of graphs in motion? (2 Marks)
Ans. The three basic types of graphical representations of motion are:
- Distance-Time Graph
- Velocity-Time Graph
- Acceleration-Time Graph
Ques. What's the difference between a distance-time graph and one that shows displacement over time? (2 Marks)
Ans. The most significant distinction between a distance-time graph and a displacement-time graph is that a distance-time graph always climbs and never decreases, whereas a displacement graph may go down.
Ques. What does an acceleration-time graph show? (2 Marks)
Ans. The acceleration of an object traveling in a straight line is displayed against time in this graph. Acceleration measurements are plotted on the y-axis, while time values are plotted on the x-axis.
Ques. What is a velocity-time graph? (1 Mark)
Ans. A velocity-time graph depicts how a moving object's velocity changes over time. The slope of a velocity-time graph represents the moving object's acceleration.
Ques. How to find the velocity of an object from the graphical representation of motion? (2 Marks)
Ques. Define uniform velocity and uniform acceleration. (2 Marks)
Ans. An object is said to move with uniform velocity if it covers equal displacement in equal intervals of time. Whereas, a body is said to move with uniform acceleration if equal changes in velocity take place in equal intervals of time.
Ques. Can there be zero displacement? (2 Marks)
Ans. Yes, displacement can be zero. The displacement of an object is the actual change in its position when it moves from one position to the other. Thus, if an object travels from point A to B and then returns back to point A again, then the total displacement is zero.
Check-Out:


Comments