


Bihar Board Class 12 Physics Practical Question Paper 2023 with Answer Key pdf is available for download here. The exam was conducted by Bihar School Examination Board (BSEB). The question paper comprised a total of 25 questions divided among 2 sections.
Bihar Board Class 12 Physics Practical Question Paper 2023 with Answer Key
| Bihar Board Class 12 Physics Question Paper with Answer Key | Check Solutions |

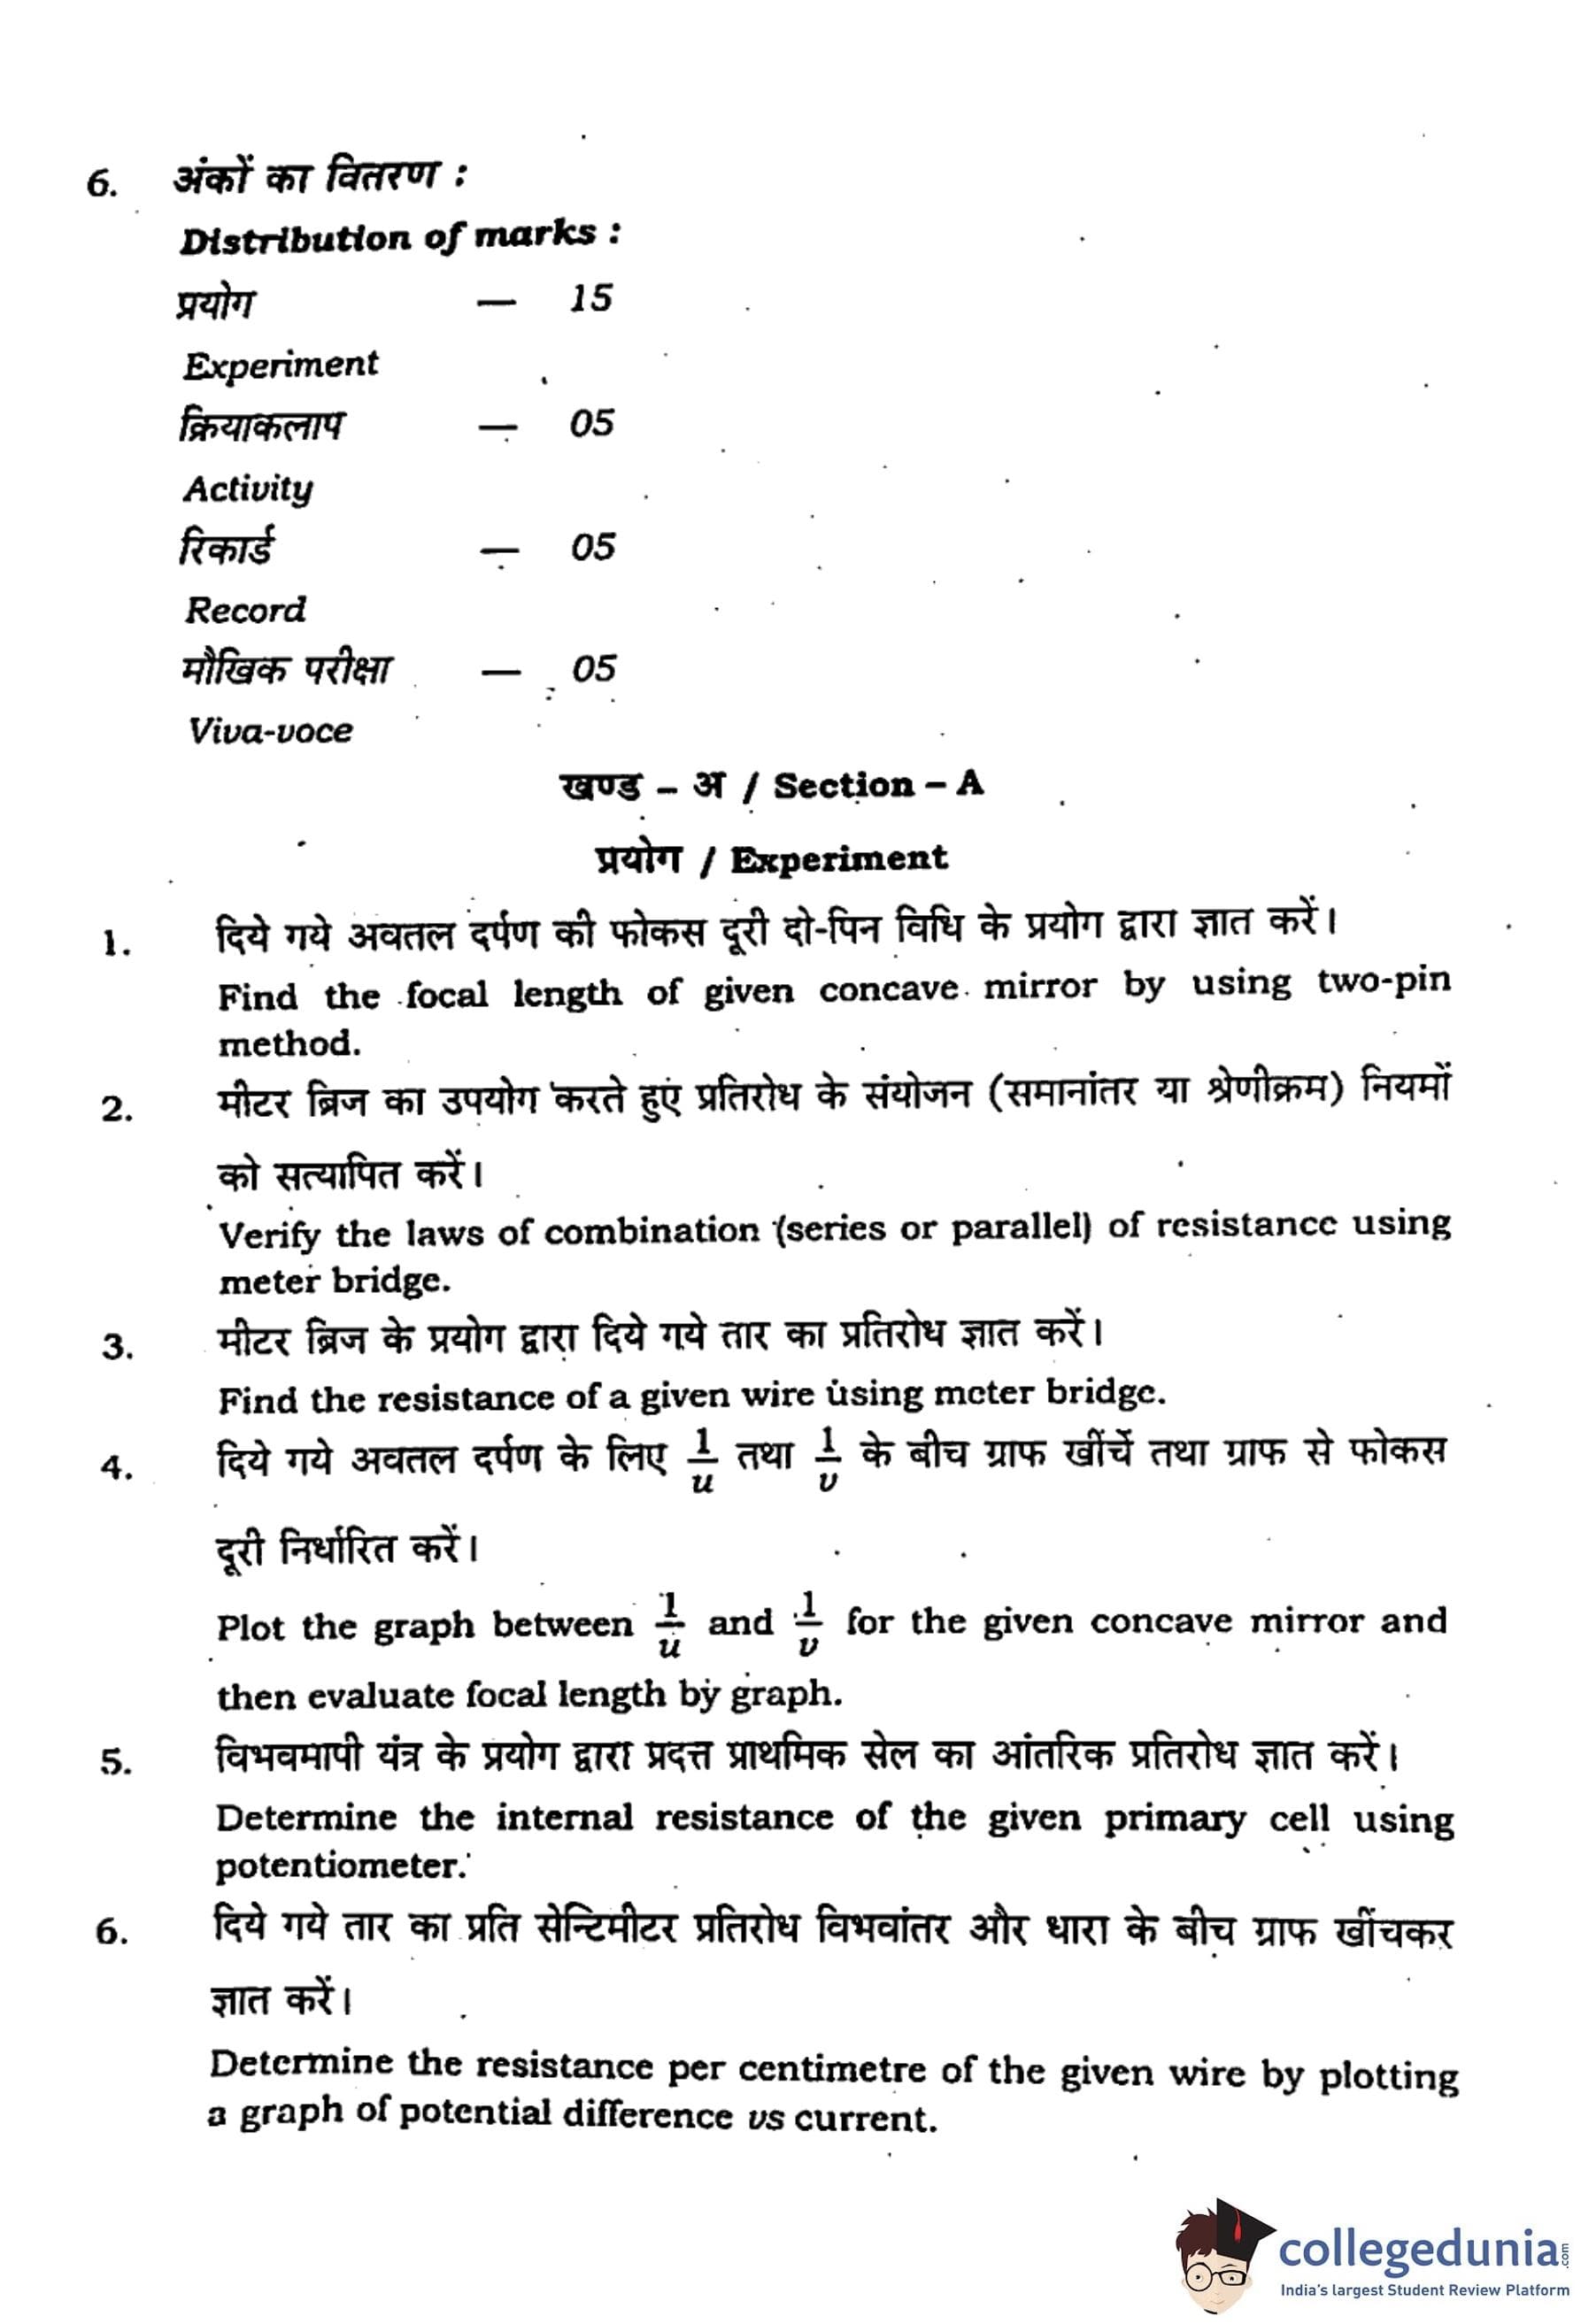
Find the focal length of given concave mirror by using two-pin method.
View Solution
Step 1: Understanding the Concept:
This experiment aims to determine the focal length of a concave mirror by measuring the object distance (u) and the corresponding image distance (v). The relationship between u, v, and the focal length (f) is given by the mirror formula. The "two-pin method" refers to using one pin as the object and another pin to locate the position of its real, inverted image by eliminating parallax.
Step 2: Key Formula and Apparatus:
Apparatus Required:
An optical bench, a concave mirror, a mirror holder, two optical needles (pins), and a meter scale.
Key Formula:The mirror formula is given by: \[ \frac{1}{f} = \frac{1}{v} + \frac{1}{u} \]
According to sign convention for a concave mirror forming a real image:
Object distance (u) is negative.
Image distance (v) is negative.
Focal length (f) is negative.
So, the formula becomes: \[ \frac{1}{-f} = \frac{1}{-v} + \frac{1}{-u} \implies \frac{1}{f} = \frac{1}{v} + \frac{1}{u} \]
From this, the focal length can be calculated as: \[ f = \frac{uv}{u+v} \]
Step 3: Detailed Procedure:
1. Preliminary Setup:
- First, find the approximate focal length (f) of the concave mirror by focusing the image of a distant object (like a tree) on a screen. The distance between the mirror and the screen gives a rough estimate of f.
- Mount the concave mirror on the holder and place it on the optical bench.
- Place one pin (the object pin, O) in front of the mirror at a distance approximately 1.5f from the mirror.
2. Locating the Image:
- Place the second pin (the image pin, I) on the other side of the object pin.
- Adjust the position of the image pin until there is no parallax between the tip of the image pin and the tip of the inverted image of the object pin. Parallax is removed when the image pin and the image of the object pin do not separate when you move your eye side-to-side.
3. Taking Measurements:
- Record the position of the mirror, the object pin (O), and the image pin (I) on the optical bench scale.
- Calculate the object distance, \( u = position of mirror - position of object pin \).
- Calculate the image distance, \( v = position of mirror - position of image pin \).
4. Repeating the Experiment:
- Repeat the experiment for at least 4-5 different values of u, by moving the object pin further away from the mirror. For each position of u, locate the corresponding image position v.
5. Observation Table:
\begin{tabularx\textwidth{|l|X|X|X|X|X|X
\hline
S.No. & Position of & Position of & Position of & Object Distance & Image Distance
& Mirror (cm) & Object Pin (cm) & Image Pin (cm) & u (cm) & v (cm)
\hline
1 & & & & &
2 & & & & &
3 & & & & &
4 & & & & &
5 & & & & &
\hline
\end{tabularx
Step 4: Calculation and Final Answer:
For each set of u and v, calculate the focal length f using the formula \( f = \frac{uv}{u+v} \).
Finally, calculate the mean value of the focal length from all the readings.
\[ f_{mean} = \frac{f_1 + f_2 + f_3 + ...}{n} \]
The mean value is the focal length of the given concave mirror.
Quick Tip: To remove parallax effectively, ensure that the tips of the object pin, image pin, and the principal axis of the mirror are at the same horizontal level. Always keep your eye at a distance of at least 30 cm from the pin while checking for parallax.
Verify the laws of combination (series or parallel) of resistance using meter bridge.
View Solution
Step 1: Understanding the Concept:
The experiment involves first measuring the individual resistances of two wires, say \(R_1\) and \(R_2\), using a meter bridge. Then, these wires are connected first in series and then in parallel, and their equivalent resistances (\(R_s\) and \(R_p\)) are measured. The experimental results are then compared with the theoretical values calculated using the laws of combination of resistances.
Step 2: Key Formula and Apparatus:
Apparatus Required:
A meter bridge, a galvanometer, a resistance box, two unknown resistance wires, a primary cell (Leclanche cell or battery eliminator), a jockey, a key, and connecting wires.
Key Formula:
1. Meter Bridge Principle: It is based on the balanced Wheatstone bridge principle. If S is the resistance from the resistance box in the right gap and R is the unknown resistance in the left gap, and the balancing length from the left end is l, then: \[ R = S \left( \frac{l}{100 - l} \right) \]
2. Law of Series Combination: The theoretical equivalent resistance is the sum of individual resistances. \[ R_s (theoretical) = R_1 + R_2 \]
3. Law of Parallel Combination: The reciprocal of the theoretical equivalent resistance is the sum of the reciprocals of individual resistances. \[ \frac{1}{R_p (theoretical)} = \frac{1}{R_1} + \frac{1}{R_2} \implies R_p (theoretical) = \frac{R_1 R_2}{R_1 + R_2} \]
Step 3: Detailed Procedure:
Part A: Measuring Individual Resistances \(R_1\) and \(R_2\)
- Set up the circuit as per the diagram for a meter bridge.
- Connect the first resistance wire (\(R_1\)) in the left gap and the resistance box (S) in the right gap.
- Take out a suitable resistance from the resistance box S. Find the balancing length \(l_1\) by sliding the jockey.
- Calculate \(R_1 = S \left( \frac{l_1}{100 - l_1} \right)\). Take multiple readings and find the mean \(R_1\).
- Repeat the process for the second resistance wire to find the mean value of \(R_2\).
Part B: Verifying Series Combination
- Connect the two wires \(R_1\) and \(R_2\) in series and place this combination in the left gap of the meter bridge.
- Measure the equivalent resistance \(R_s (experimental)\) using the same procedure as in Part A.
- Calculate the theoretical value \(R_s (theoretical) = R_1 + R_2\).
- Compare the experimental and theoretical values. A small percentage difference is expected due to experimental errors.
Part C: Verifying Parallel Combination
- Now, connect the two wires \(R_1\) and \(R_2\) in parallel and place this combination in the left gap.
- Measure the equivalent resistance \(R_p (experimental)\).
- Calculate the theoretical value \(R_p (theoretical) = \frac{R_1 R_2}{R_1 + R_2}\).
- Compare the experimental and theoretical values.
Step 4: Result:
The experimental values of series resistance (\(R_s\)) and parallel resistance (\(R_p\)) are found to be in close agreement with their theoretical values. This verifies the laws of combination of resistances.
Quick Tip: For best results, choose the known resistance S from the resistance box such that the balancing point is near the center of the wire (between 40 cm and 60 cm). This minimizes the percentage error in the measurement. Always clean the ends of connecting wires with sandpaper to ensure proper electrical contact.
Find the resistance of a given wire using meter bridge.
View Solution
Step 1: Understanding the Concept:
A meter bridge is a practical application of the Wheatstone bridge, used to measure an unknown resistance. It consists of a one-meter long wire of uniform cross-section stretched on a wooden board. When the bridge is balanced, the ratio of resistances in two arms is equal to the ratio of their corresponding balancing lengths.
Step 2: Key Formula and Apparatus:
Apparatus Required:
A meter bridge, a galvanometer, a resistance box, the given wire whose resistance is to be measured, a primary cell, a jockey, a key, and connecting wires.
Key Formula:
The working principle is the balanced Wheatstone bridge condition. If R is the unknown resistance in the left gap, S is a known resistance from a resistance box in the right gap, and l is the balancing length from the left end (A), then: \[ \frac{R}{S} = \frac{Resistance of wire of length l}{Resistance of wire of length (100 - l)} \]
Since the wire has uniform resistance per unit length, this simplifies to: \[ \frac{R}{S} = \frac{l}{100 - l} \]
Therefore, the unknown resistance is: \[ R = S \left( \frac{l}{100 - l} \right) \]
Step 3: Detailed Procedure:
1. Circuit Setup:
- Assemble the circuit as shown in the standard meter bridge diagram.
- Connect the given wire of unknown resistance (R) in the left gap and the resistance box (S) in the right gap of the meter bridge.
- Connect the galvanometer between the central terminal of the bridge and the jockey.
- The primary circuit consists of a cell and a key connected across the ends of the meter bridge wire.
2. Taking Measurements:
- Close the key to allow current to flow.
- Take out a suitable known resistance (e.g., 2 \(\Omega\)) from the resistance box S.
- Gently tap the jockey at one end (A) and then the other end (B) of the wire. The galvanometer should show deflections in opposite directions. This confirms the connections are correct.
- Slide the jockey along the wire to find the null point, where the galvanometer shows zero deflection. This is the balancing length, l.
- Record the value of S and l.
3. Repeating for Accuracy:
- Repeat the experiment for at least four different values of S.
- For each set, calculate the unknown resistance R using the formula.
- It is also good practice to interchange the positions of R and S and repeat the measurements to eliminate any end errors.
Step 4: Calculation and Final Answer:
Calculate the mean of all the values of R obtained.
\[ R_{mean} = \frac{R_1 + R_2 + R_3 + ...}{n} \]
The result is stated as: "The resistance of the given wire is \(R_{mean} \pm \Delta R\), where \(\Delta R\) is the mean absolute error."
Quick Tip: Do not slide the jockey roughly on the wire as it can damage the wire and make its cross-section non-uniform. Press it gently. Take the readings quickly after closing the key to avoid heating the bridge wire, which would change its resistance.
Plot the graph between \( \frac{1}{u} \) and \( \frac{1}{v} \) for the given concave mirror and then evaluate focal length by graph.
View Solution
Step 1: Understanding the Concept:
This experiment is a graphical method to determine the focal length of a concave mirror. It uses the data of object distance (u) and image distance (v) obtained from the two-pin method. By plotting \( \frac{1}{v} \) against \( \frac{1}{u} \), we can use the intercepts of the resulting straight-line graph to calculate the focal length, which often provides a more accurate result than averaging individual calculations.
Step 2: Key Formula and Apparatus:
Apparatus Required:
The same as for the two-pin method: an optical bench, a concave mirror, a mirror holder, two optical needles (pins), and a meter scale. Also, a graph paper is needed.
Key Formula:
The mirror formula is: \[ \frac{1}{f} = \frac{1}{v} + \frac{1}{u} \]
This can be rearranged into the form of a straight-line equation \( y = mx + c \): \[ \frac{1}{v} = -\frac{1}{u} + \frac{1}{f} \]
Comparing this with \( y = mx + c \), we have:
- \( y = \frac{1}{v} \)
- \( x = \frac{1}{u} \)
- Slope \( m = -1 \)
- Y-intercept \( c = \frac{1}{f} \)
When \( \frac{1}{v} = 0 \), we get the X-intercept as \( \frac{1}{u} = \frac{1}{f} \).
Step 3: Detailed Procedure:
1. Data Collection:
- Perform the experiment to find the focal length of the concave mirror using the two-pin method (as in Question 1).
- Obtain at least 5-6 sets of readings for object distance (u) and the corresponding image distance (v).
2. Data Processing:
- For each pair of (u, v), calculate their reciprocals: \( x = \frac{1}{u} \) and \( y = \frac{1}{v} \).
- Tabulate the results.
\begin{tabular{|c|c|c|c|c|
\hline
S.No. & u (cm) & v (cm) & \(x = \frac{1}{u}\) (cm\(^{-1}\)) & \(y = \frac{1}{v}\) (cm\(^{-1}\))
\hline
1 & & & &
2 & & & &
3 & & & &
4 & & & &
5 & & & &
\hline
\end{tabular
3. Plotting the Graph:
- Choose a suitable scale for both axes on the graph paper.
- Plot the graph with \( \frac{1}{u} \) along the X-axis and \( \frac{1}{v} \) along the Y-axis.
- The plotted points should lie on a straight line. Draw the best-fit straight line passing through these points.
- The line will have a negative slope and will intersect both the positive X and Y axes.
Step 4: Calculation from Graph and Final Answer:
1. Finding Intercepts:
- Find the Y-intercept (OA) where the line cuts the Y-axis (\( \frac{1}{u} = 0 \)).
- Find the X-intercept (OB) where the line cuts the X-axis (\( \frac{1}{v} = 0 \)).
2. Calculating Focal Length:
- From the Y-intercept: \( OA = \frac{1}{f} \implies f_1 = \frac{1}{OA} \).
- From the X-intercept: \( OB = \frac{1}{f} \implies f_2 = \frac{1}{OB} \).
- The focal length of the mirror is the mean of these two values:
\[ f = \frac{f_1 + f_2}{2} \]
The result is stated as: "The focal length of the concave mirror as determined from the graph is f cm."
Quick Tip: When drawing the graph, choose scales that utilize at least two-thirds of the graph paper area for better accuracy. The best-fit line should be drawn such that there is an equal distribution of points on either side of the line. Do not force the line to pass through the origin.
Determine the internal resistance of the given primary cell using potentiometer.
View Solution
Step 1: Understanding the Concept:
A potentiometer can be used to compare EMFs of two cells and also to find the internal resistance of a cell. The principle is that the potential drop across any portion of the potentiometer wire is directly proportional to the length of that portion, provided the wire is of uniform cross-section and a constant current flows through it. By balancing the EMF (\(\epsilon\)) and the terminal potential difference (V) of the cell against the potential drop on the wire, we can find the internal resistance.
Step 2: Key Formula and Apparatus:
Apparatus Required:
A potentiometer, a primary cell (whose internal resistance is to be determined), a driver cell (battery), a resistance box, a galvanometer, a rheostat, two one-way keys, a jockey, and connecting wires.
Key Formula:
The internal resistance (r) of a cell is given by: \[ r = \left( \frac{\epsilon}{V} - 1 \right) R \]
Using the potentiometer principle, \( \epsilon \propto l_1 \) and \( V \propto l_2 \), where \(l_1\) is the balancing length for the EMF (open circuit) and \(l_2\) is the balancing length for the terminal voltage (closed circuit with external resistance R).
The formula becomes: \[ r = \left( \frac{l_1}{l_2} - 1 \right) R \]
Step 3: Detailed Procedure:
1. Circuit Setup:
- Set up the primary circuit by connecting the driver cell, key \(K_1\), and rheostat in series with the potentiometer wire.
- Set up the secondary circuit by connecting the positive terminal of the experimental cell to the same end of the potentiometer wire as the positive terminal of the driver cell. Connect its negative terminal to the jockey through a galvanometer.
- Connect a resistance box (R) and a key (\(K_2\)) in parallel with the experimental cell.
2. Taking Measurements:
- Close key \(K_1\) and keep key \(K_2\) open.
- Slide the jockey along the potentiometer wire to find the null point where the galvanometer shows zero deflection. Let this balancing length be \(l_1\). This corresponds to the EMF (\(\epsilon\)) of the cell.
- Now, take out a small resistance (e.g., 10 \(\Omega\)) from the resistance box (R) and close the key \(K_2\). This draws current from the cell.
- Again, find the null point by sliding the jockey. Let this new balancing length be \(l_2\). This corresponds to the terminal potential difference (V) across the cell. Note that \(l_2\) will be less than \(l_1\).
3. Repeating for Accuracy:
- Repeat the experiment for 3-4 different values of R from the resistance box. For each R, find the corresponding \(l_2\) (while \(l_1\) remains constant).
Step 4: Calculation and Final Answer:
For each set of R and \(l_2\), calculate the internal resistance r using the formula: \[ r = R \left( \frac{l_1}{l_2} - 1 \right) \]
Calculate the mean of all the values of r.
\[ r_{mean} = \frac{r_1 + r_2 + r_3 + ...}{n} \]
The result is stated as: "The internal resistance of the given primary cell is \(r_{mean} \, \Omega\)."
Quick Tip: Crucially, the EMF of the driver cell must be greater than the EMF of the experimental cell; otherwise, a null point will not be obtained. Always connect the positive terminals of both the driver cell and the experimental cell to the same end (the 'zero' end) of the potentiometer wire.
Determine the resistance per centimetre of the given wire by plotting a graph of potential difference vs current.
View Solution
Step 1: Understanding the Concept:
According to Ohm's Law, the potential difference (V) across the ends of a conductor is directly proportional to the current (I) flowing through it, provided the temperature and other physical conditions remain unchanged. Mathematically, V = IR, where R is the resistance. A graph of V versus I for an ohmic conductor is a straight line passing through the origin. The slope of this graph gives the resistance of the conductor. The resistance per unit length can then be found by dividing the total resistance by the length of the wire.
Step 2: Key Formula and Apparatus:
Apparatus Required:
A resistance wire, a battery eliminator, a DC voltmeter (0-5V), a DC ammeter (0-500mA), a rheostat, a plug key, a meter scale, and connecting wires.
Key Formula:
1. From Ohm's Law: \( R = \frac{V}{I} \)
2. From the graph, Resistance \( R = Slope = \frac{\Delta V}{\Delta I} \)
3. Resistance per centimetre \( r = \frac{R}{L} \), where L is the length of the wire in cm.
Step 3: Detailed Procedure:
1. Circuit Connection: Assemble the circuit by connecting the resistance wire, battery, ammeter, rheostat, and key in series. Connect the voltmeter in parallel across the resistance wire.
2. Data Collection:
- Ensure the pointers of the ammeter and voltmeter are at their zero marks.
- Insert the key. Adjust the rheostat slider so that a small current flows through the circuit.
- Record the readings of the ammeter (I) and the voltmeter (V).
- Gradually move the slider of the rheostat to increase the current in steps and record the corresponding V and I readings for at least five different settings.
3. Measurement of Length: Measure the length (L) of the resistance wire used in the circuit using a meter scale.
Step 4: Graph and Calculation:
1. Plotting: Plot a graph with potential difference V along the Y-axis and current I along the X-axis, choosing a suitable scale. The graph should be a straight line passing through the origin.
2. Calculating Resistance (R): Find the slope of the V-I graph. The slope represents the resistance R of the wire. \[ R = Slope = \frac{BC}{AC} = \frac{\Delta V}{\Delta I} \, \Omega \]
3. Calculating Resistance per Centimetre (r): Calculate the resistance per centimetre using the measured length L. \[ r = \frac{R}{L} \, \Omega/cm \]
The result is stated as the resistance per centimetre of the given wire.
Quick Tip: To minimize errors, ensure all electrical connections are clean and tight. Take readings promptly after closing the key to prevent the wire from heating up, as an increase in temperature would change its resistance. Always check for and correct any zero error in the voltmeter and ammeter before starting.
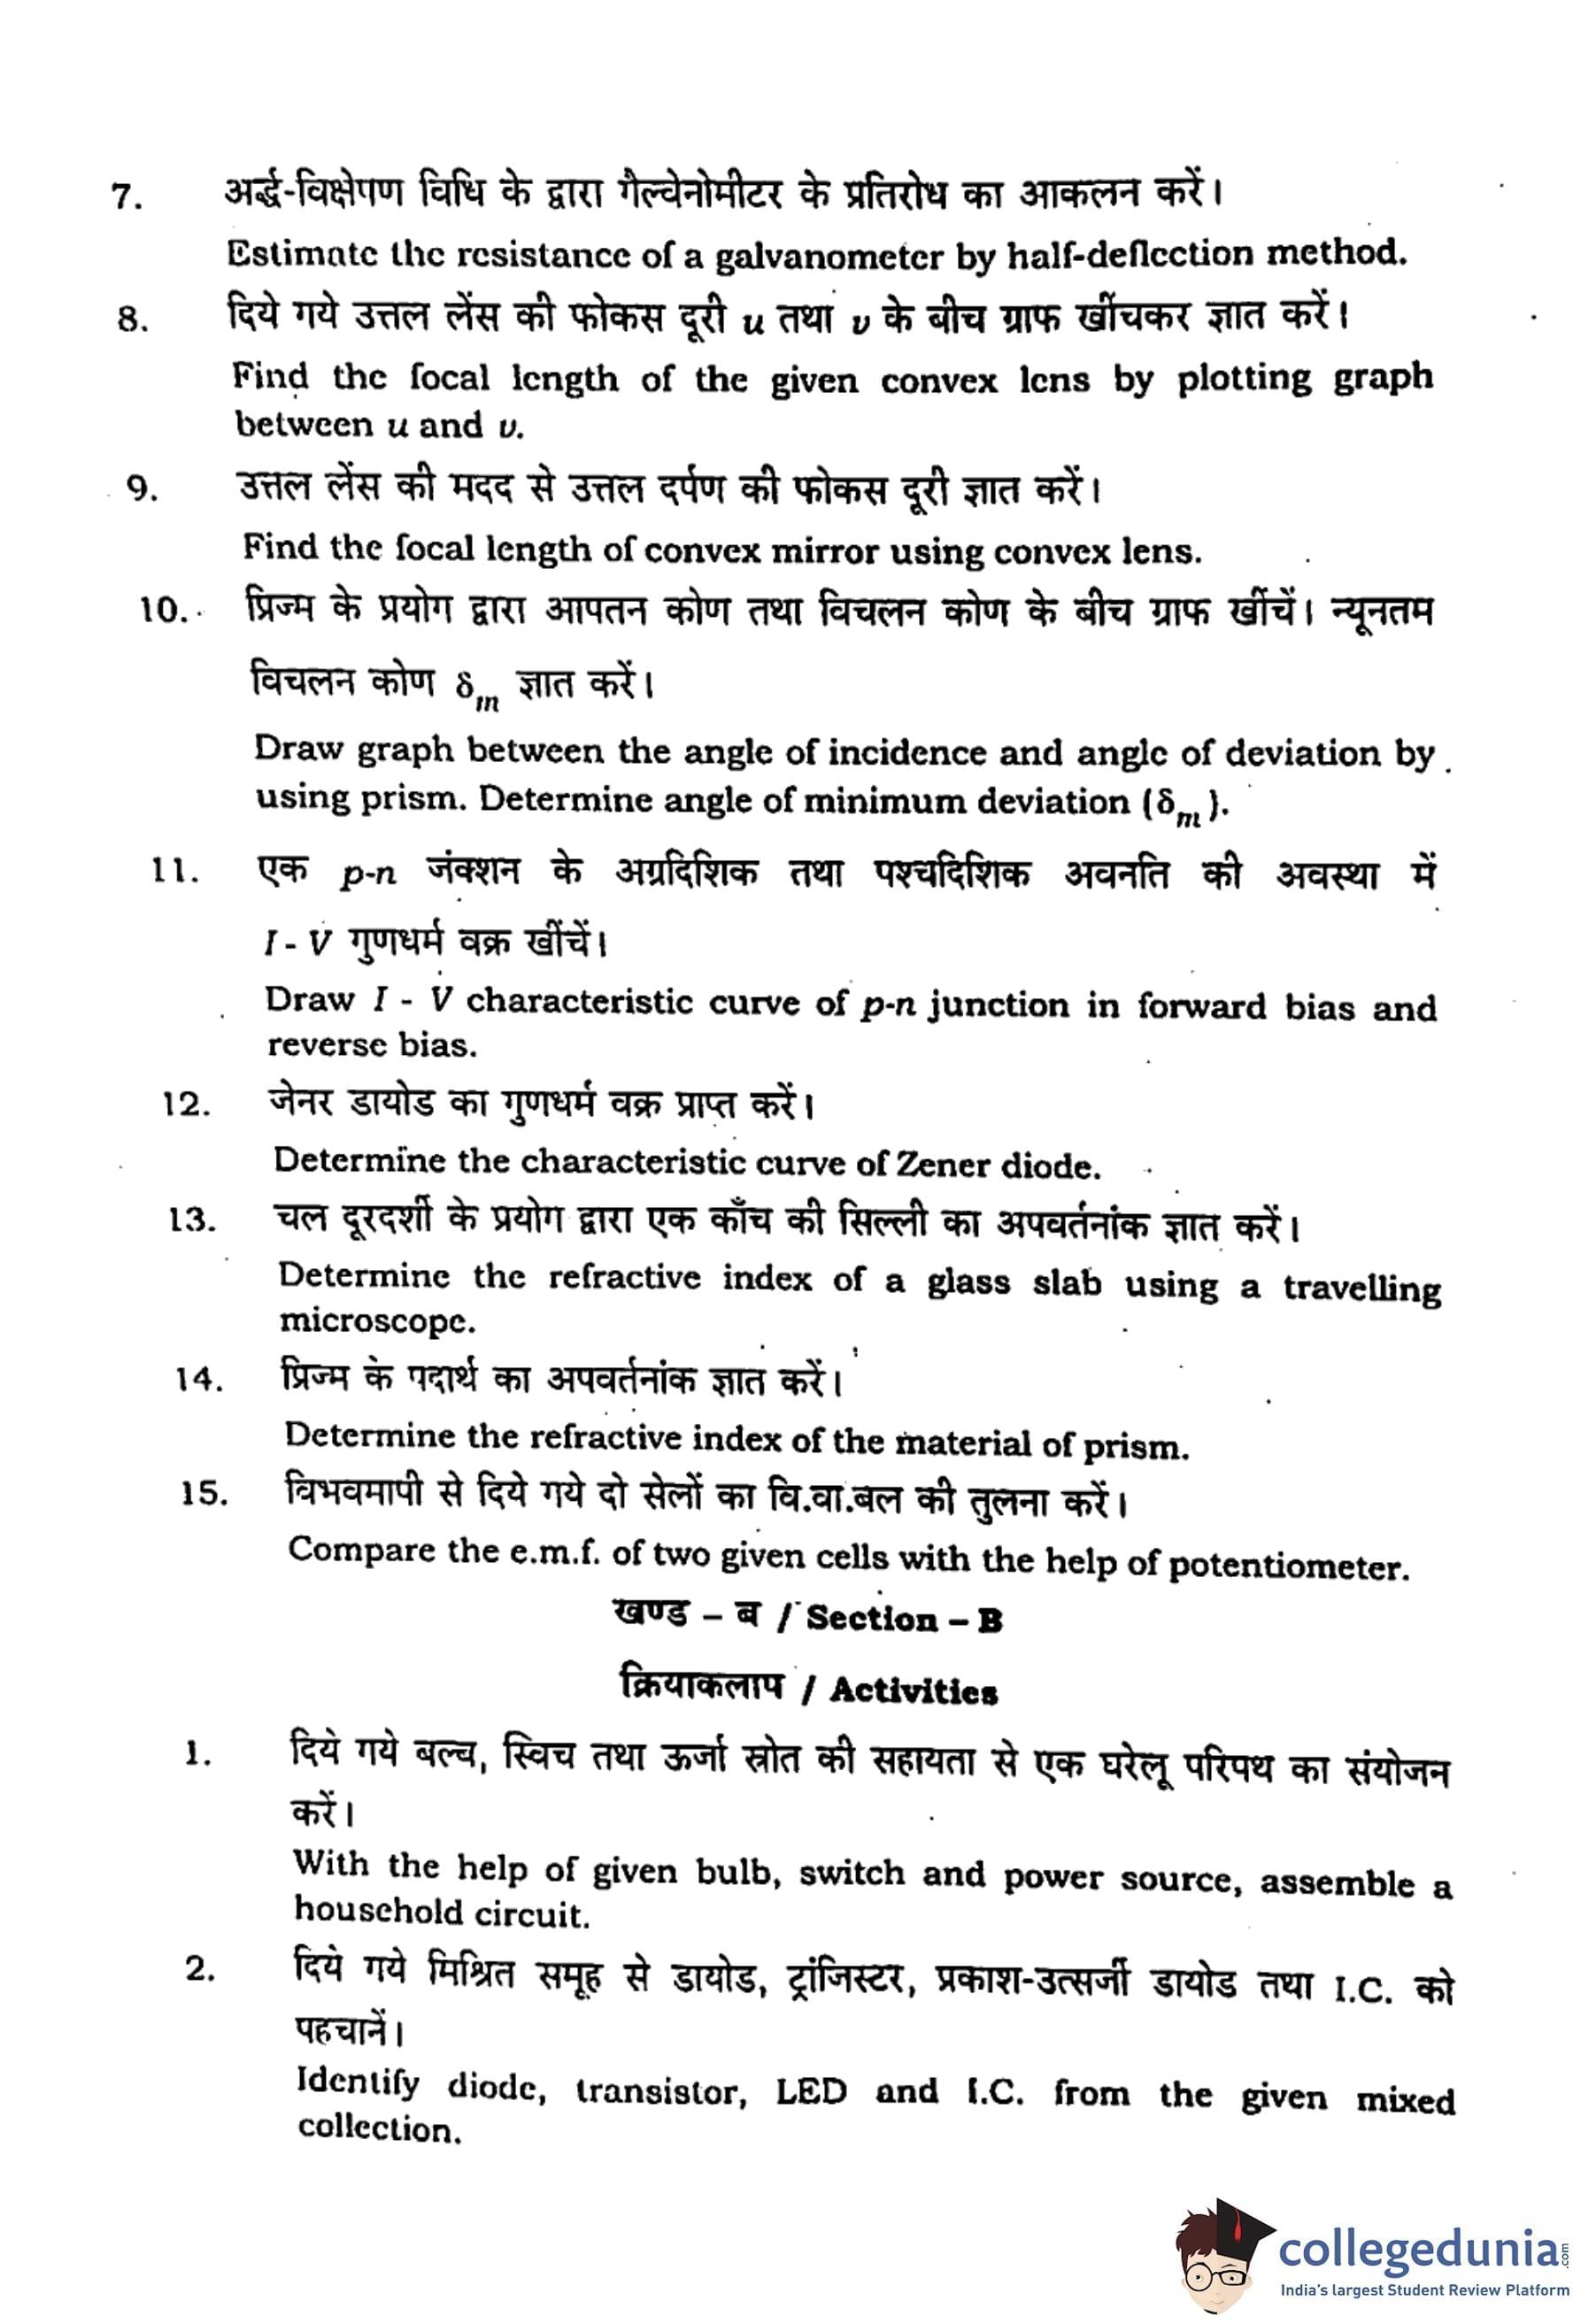
Estimate the resistance of a galvanometer by half-deflection method.
View Solution
Step 1: Understanding the Concept:
The half-deflection method is a technique to determine the resistance of a galvanometer. The main circuit consists of a cell, a high resistance box (R), and the galvanometer (G). A shunt resistance (S) is then connected in parallel with the galvanometer. The value of R is adjusted to get a full-scale or large deflection. Then, S is adjusted until the galvanometer deflection is halved. Under the condition that R is very large, the galvanometer resistance G is approximately equal to the shunt resistance S.
Step 2: Key Formula and Apparatus:
Apparatus Required:
A galvanometer, a battery or cell, two resistance boxes (one of high range, \(\sim 10000 \, \Omega\), and one of low range, \(\sim 200 \, \Omega\)), two one-way keys, and connecting wires.
Key Formula:
The accurate formula for the galvanometer resistance is: \[ G = \frac{R \cdot S}{R - S} \]
Where R is the high resistance connected in series, and S is the shunt resistance connected in parallel.
If R is much larger than S (\(R \gg S\)), then \(R - S \approx R\), and the formula simplifies to the approximation: \[ G \approx S \]
Step 3: Detailed Procedure:
1. Initial Circuit Setup: Connect the cell, the high resistance box (R), and the galvanometer (G) in series using key \(K_1\).
2. Getting Full Deflection: Take out a high resistance (e.g., 5000 \(\Omega\)) from the resistance box R. Close key \(K_1\) and note the deflection \(\theta\) in the galvanometer. Adjust R such that the deflection is large and is an even number of divisions (e.g., 30 divisions).
3. Applying Shunt: Connect the low resistance box (S) in parallel with the galvanometer through a second key \(K_2\).
4. Getting Half Deflection: Close key \(K_2\). Adjust the value of S from the resistance box until the deflection in the galvanometer becomes exactly half of the initial deflection, i.e., \(\theta/2\).
5. Recording Values: Record the values of R and S. Repeat the experiment for different values of R and find the corresponding S.
Step 4: Calculation:
For each set of readings, calculate the galvanometer resistance G using the formula \( G = \frac{R \cdot S}{R - S} \).
Find the mean of the calculated values of G. \[ G_{mean} = \frac{G_1 + G_2 + G_3}{3} \]
The mean value is the resistance of the given galvanometer.
Quick Tip: The resistance R should be chosen high enough not only to protect the galvanometer from excessive current but also to make the approximation \(G \approx S\) more accurate. A deflection that is large and easily divisible by two (e.g., 30 or 40 divisions) makes the experiment easier and more precise.
Find the focal length of the given convex lens by plotting graph between u and v.
View Solution
Step 1: Understanding the Concept:
For a convex lens forming a real image, the object distance (u), image distance (v), and focal length (f) are related by the lens formula. A graph plotted between u and v is a rectangular hyperbola. From this graph, the focal length can be determined because, for a convex lens, when the object is placed at a distance of 2f from the optical center, a real image of the same size is formed at a distance of 2f on the other side. Therefore, the point on the graph where u = v corresponds to u = v = 2f.
Step 2: Key Formula and Apparatus:
Apparatus Required:
An optical bench, a convex lens, a lens holder, two optical needles (one for the object, one for the image), and a meter scale.
Key Formula:
Lens formula: \( \frac{1}{f} = \frac{1}{v} - \frac{1}{u} \)
From the u-v graph, at the point of intersection P with the line u=v, we have: \[ u_P = v_P = 2f \]
Therefore, \( f = \frac{u_P}{2} = \frac{v_P}{2} \).
Step 3: Detailed Procedure:
1. Rough Focal Length: Find the approximate focal length of the lens by focusing the image of a distant object (like a window) on a screen.
2. Setup: Mount the lens on the holder on the optical bench. Place the object needle at a distance greater than 2f from the lens.
3. Data Collection:
- Adjust the position of the image needle on the other side of the lens until parallax between the tip of the image needle and the real, inverted image of the object needle is removed.
- Record the positions of the object needle, lens, and image needle.
- Calculate the object distance u (distance between object needle and lens) and image distance v (distance between image needle and lens).
- Repeat the process for 5-6 different values of u, moving the object needle away from the lens.
Step 4: Graph and Calculation:
1. Plotting: Plot a graph with u on the X-axis and v on the Y-axis. The graph will be a curve (a rectangular hyperbola).
2. Finding 2f: Draw a line that passes through the origin at an angle of 45° to the axes (the line u = v). This line will intersect the u-v curve at a point P.
3. Reading Coordinates: Read the coordinates of the point P from the graph. Let them be \((u_P, v_P)\). At this point, \(u_P = v_P\).
4. Calculating Focal Length: Calculate the focal length using the relation: \[ f = \frac{u_P}{2} \quad or \quad f = \frac{v_P}{2} \]
The average of these gives the focal length of the lens.
Quick Tip: To ensure the accuracy of the u-v graph, take readings for object positions both between f and 2f, and beyond 2f. Removing parallax accurately is the key to obtaining good data points for the graph. The tip of the needles and the optical center of the lens should be at the same height.
Find the focal length of convex mirror using convex lens.
View Solution
Step 1: Understanding the Concept:
A convex mirror always forms a virtual image, which cannot be located directly. This experiment uses a convex lens to first form a real image. This real image then acts as a virtual object for the convex mirror. By adjusting the convex mirror's position, the rays are made to reflect back along their incident path, forming a final image at the same location as the original object. This occurs when the rays incident on the convex mirror are directed towards its center of curvature.
Step 2: Key Formula and Apparatus:
Apparatus Required:
An optical bench, a convex mirror, a convex lens, a mirror holder, a lens holder, an optical needle (object pin), and a meter scale.
Key Formula:
The focal length (f) of a spherical mirror is half its radius of curvature (R). \[ f = \frac{R}{2} \]
Step 3: Detailed Procedure:
1. Setup without Mirror: Mount the convex lens on the optical bench. Place an object pin (O) in front of the lens. Adjust its position to form a clear, real, and inverted image (I) on the other side. Note the position of the image I by using another needle and removing parallax.
2. Introducing the Mirror: Place the convex mirror on a holder and position it between the convex lens and the image position I. The reflecting surface of the mirror should face the lens.
3. Retracing Path: Adjust the position of the convex mirror along the optical bench until the light rays, after reflecting from the mirror, retrace their path back through the lens and form a final image at the same position as the original object pin O. This is confirmed by removing the parallax between the object pin and its image.
4. Locating Center of Curvature: In this adjusted position, the light rays from the lens are incident normally on the convex mirror. This means they are converging towards the center of curvature (C) of the mirror. Thus, the position of the image I (found in step 1) is the location of the center of curvature C of the mirror.
5. Measurement: Record the position of the convex mirror. The distance between the pole of the convex mirror and the position of image I is the radius of curvature (R).
Step 4: Calculation:
Calculate the focal length of the convex mirror using the measured radius of curvature R. \[ f = \frac{R}{2} \]
Repeat the experiment two to three times for different object positions and find the mean focal length.
Quick Tip: The convex lens chosen for this experiment should have a focal length smaller than the radius of curvature of the convex mirror. This ensures that a real image can be formed by the lens at a position that can coincide with the mirror's center of curvature.
Draw graph between the angle of incidence and angle of deviation by using prism. Determine angle of minimum deviation (\(\delta_m\)).
View Solution
Step 1: Understanding the Concept:
When a ray of light passes through a prism, it undergoes refraction at two surfaces and deviates from its path. The angle of deviation (\(\delta\)) is the angle between the extended incident ray and the emergent ray. The value of \(\delta\) depends on the angle of incidence (i). As 'i' increases, \(\delta\) first decreases, attains a minimum value (\(\delta_m\)) at a specific angle of incidence, and then increases again. The plot of \(\delta\) versus i is a characteristic U-shaped curve.
Step 2: Apparatus:
Apparatus Required:
A glass prism, a drawing board, white sheets of paper, drawing pins or tape, a protractor, a sharp pencil, and several all-pins.
Step 3: Detailed Procedure:
1. Setup: Fix a sheet of white paper on the drawing board. Place the prism on it and trace its triangular outline, label it ABC.
2. Drawing Rays:
- Draw a normal NN' to the face AB at a point P.
- Draw an incident ray QP making an angle of incidence i (e.g., 35°) with the normal.
- Fix two pins vertically on this incident ray.
3. Locating Emergent Ray: Look for the images of these two pins through the other face AC. Fix two more pins, R and S, such that they appear to be in a straight line with the images of the first two pins.
4. Measuring Deviation:
- Remove the prism and pins. Join the points R and S to draw the emergent ray.
- Extend the incident ray QP forward and the emergent ray RS backward. They meet at a point, and the angle between them is the angle of deviation \(\delta\). Measure this angle using a protractor.
5. Repeating: Repeat the experiment for different values of the angle of incidence, such as 40°, 45°, 50°, 55°, and 60°, and measure the corresponding angle of deviation for each case.
Step 4: Graph and Result:
1. Plotting: Plot a graph with the angle of incidence (i) on the X-axis and the angle of deviation (\(\delta\)) on the Y-axis.
2. Finding \(\delta_m\): The plotted points will form a smooth U-shaped curve. The lowest point on this curve corresponds to the angle of minimum deviation.
3. Determining \(\delta_m\): Draw a horizontal tangent at the bottom of the curve. The point where this tangent touches the curve gives the value of \(\delta_m\) on the Y-axis.
The result is stated as: "The angle of minimum deviation (\(\delta_m\)) from the graph is ..... degrees."
Quick Tip: For best accuracy, use a sharp pencil for tracing rays and a protractor with clear markings. When aligning the pins, close one eye and ensure there is no parallax between them. The distance between the pins should be reasonably large (about 5-8 cm) to define the ray direction accurately.
Draw I - V characteristic curve of p-n junction in forward bias and reverse bias.
View Solution
Step 1: Understanding the Concept:
The I-V characteristic of a p-n junction diode describes its behavior under different biasing conditions.
Forward Bias: When the p-side is connected to the positive terminal of a DC source and the n-side to the negative, the diode is forward-biased. The potential barrier is reduced, and a significant current (in mA) flows once the applied voltage exceeds the knee voltage (\(\sim\)0.7V for Si, \(\sim\)0.3V for Ge).
Reverse Bias: When the polarity is reversed (p-side to negative, n-side to positive), the diode is reverse-biased. The potential barrier increases, and only a very small leakage current (in \(\mu\)A) due to minority carriers flows, until the breakdown voltage is reached.
Step 2: Apparatus:
Apparatus Required:
A p-n junction diode, a variable DC power supply (0-3V for forward, 0-30V for reverse), a DC voltmeter, a milliammeter (mA), a microammeter (\(\mu\)A), a key, and connecting wires.
Step 3: Detailed Procedure:
Part A: Forward Bias Characteristics
1. Circuit: Connect the power supply, key, milliammeter, and diode in series. Connect the voltmeter in parallel across the diode. Ensure the p-side of the diode is connected to the positive terminal of the supply.
2. Readings: Start with zero voltage. Gradually increase the forward voltage (Vf) in small steps (e.g., 0.1 V). For each Vf, record the corresponding forward current (If) from the milliammeter. Note the sharp increase in current after the knee voltage.
Part B: Reverse Bias Characteristics
1. Circuit: Reverse the connections of the diode and the power supply. Replace the milliammeter with a microammeter to measure the small reverse current.
2. Readings: Increase the reverse voltage (Vr) in larger steps (e.g., 1 V or 2 V). For each Vr, record the corresponding reverse current (Ir) from the microammeter. The current will be very small and almost constant. (Do not exceed the breakdown voltage of the diode).
Step 4: Graph:
1. Plotting: Plot the collected data on a graph paper. Use the first quadrant for forward bias (Vf vs If) and the third quadrant for reverse bias (Vr vs Ir). The voltage is on the X-axis and the current on the Y-axis.
2. The Curve:
- The forward bias curve will be almost flat until the knee voltage, after which it will rise steeply.
- The reverse bias curve will be a nearly horizontal line very close to the voltage axis, indicating a very small, constant reverse saturation current.
Quick Tip: Use appropriate ranges for the meters. A voltmeter of 0-3V and a milliammeter are suitable for forward bias, while a voltmeter of 0-30V and a microammeter are needed for reverse bias. Be cautious not to apply a reverse voltage beyond the diode's breakdown rating to prevent permanent damage.
Determine the characteristic curve of Zener diode.
View Solution
Step 1: Understanding the Concept:
A Zener diode is a special type of p-n junction diode designed to operate in the reverse breakdown region. In forward bias, it behaves like a normal diode. In reverse bias, it allows a very small leakage current until the applied voltage reaches the Zener voltage (Vz). At this point, Zener breakdown occurs, and the current increases sharply while the voltage across the diode remains almost constant at Vz. This property is used for voltage regulation.
Step 2: Apparatus:
Apparatus Required:
A Zener diode, a variable DC power supply (0-15V), a DC voltmeter, a DC milliammeter, a current-limiting resistor (\(\sim\)1 k\(\Omega\)), a key, and connecting wires.
Step 3: Detailed Procedure:
Part A: Forward Bias Characteristics
1. Circuit: Connect the Zener diode in a forward-biased configuration (p-side to positive terminal). The circuit is identical to that of a normal p-n diode.
2. Readings: Increase the forward voltage in small steps and record the corresponding forward current.
Part B: Reverse Bias Characteristics
1. Circuit: Connect the Zener diode in reverse bias (p-side to negative terminal). Importantly, connect a current-limiting resistor in series with the diode to protect it from excessive current after breakdown. Connect the voltmeter in parallel across the Zener diode.
2. Readings: Slowly increase the reverse voltage from the power supply. Record the reverse voltage (V) and the corresponding reverse current (I). The current will be negligible at first. As the voltage approaches the Zener voltage (Vz), the current will start to increase. Take several readings in this region. Past Vz, the voltage will remain almost constant while the current increases sharply.
Step 4: Graph and Result:
1. Plotting: Plot the I-V graph. The forward bias curve is in the first quadrant, and the reverse bias curve is in the third quadrant.
2. The Curve: The reverse bias curve will be nearly flat until it reaches the breakdown region, where it bends sharply downwards into an almost vertical line.
3. Finding Zener Voltage (Vz): The voltage at which the current starts to increase rapidly is the Zener breakdown voltage (Vz). This is read from the graph at the "knee" of the reverse characteristic curve.
The result is stated as: "The Zener breakdown voltage (Vz) for the given diode is ..... V."
Quick Tip: The series resistor in the reverse bias circuit is absolutely essential. Without it, the current would become very large after breakdown, destroying the Zener diode. Choose a resistor value that limits the maximum current to the diode's rated value (e.g., for a 5.1V, 0.5W Zener, max current is \(\sim\)100 mA).
Determine the refractive index of a glass slab using a travelling microscope.
View Solution
Step 1: Understanding the Concept:
The refractive index (\(\mu\)) of a medium is defined as the ratio of the speed of light in vacuum to the speed of light in the medium. It can also be expressed as the ratio of the real depth to the apparent depth of an object viewed through the medium. A travelling microscope is a precision instrument used for measuring small distances, making it ideal for measuring the real and apparent depths of a glass slab.
Step 2: Key Formula and Apparatus:
Apparatus Required:
A travelling microscope, a rectangular glass slab, and a fine marker or lycopodium powder.
Key Formula:
Refractive Index \( \mu = \frac{Real Depth}{Apparent Depth} \)
In terms of microscope readings: \[ \mu = \frac{R_3 - R_1}{R_3 - R_2} \]
where,
\(R_1\) = Microscope reading when focused on a mark without the slab.
\(R_2\) = Microscope reading when focused on the image of the mark seen through the slab.
\(R_3\) = Microscope reading when focused on the top surface of the slab.
Step 3: Detailed Procedure:
1. Reading R1: Place a mark (e.g., an ink cross) on a piece of paper on the base of the microscope. Adjust the microscope to focus sharply on this mark. Record the reading on the vertical vernier scale. This is \(R_1\).
2. Reading R2: Carefully place the glass slab over the ink mark without disturbing the setup. The mark will appear to be raised. Raise the microscope tube until the image of the mark is in sharp focus again. Record this new reading. This is \(R_2\).
3. Reading R3: Sprinkle a small amount of lycopodium powder or chalk dust on the top surface of the glass slab. Raise the microscope further to bring the powder particles into sharp focus. Record this reading. This is \(R_3\).
Step 4: Calculation:
1. Calculate the real depth of the glass slab: \( Real Depth = R_3 - R_1 \).
2. Calculate the apparent depth of the mark: This is given by the shift, which is \(R_1 - R_2\), but the depth itself in terms of readings is \(R_3 - R_2\).
3. Calculate the refractive index using the formula: \[ \mu = \frac{R_3 - R_1}{R_3 - R_2} \]
Repeat the procedure two or three times to find the mean value of \(\mu\).
Quick Tip: To ensure accuracy, always move the microscope in one direction (preferably upwards) when focusing to avoid backlash error in the screw mechanism. Use the fine adjustment knob for the final sharp focus and ensure that there is no parallax between the cross-wires of the eyepiece and the image being viewed.
Determine the refractive index of the material of prism.
View Solution
Step 1: Understanding the Concept:
The refractive index of a prism material can be determined accurately using a spectrometer. This method involves measuring two key angles: the angle of the prism (A), which is the angle between the two refracting faces, and the angle of minimum deviation (\(\delta_m\)), which is the smallest possible angle of deviation for light passing through the prism. These quantities are related by the prism formula.
Step 2: Key Formula and Apparatus:
Apparatus Required:
A spectrometer, a glass prism, a source of monochromatic light (e.g., a sodium vapour lamp), and a reading lens.
Key Formula:
The prism formula for refractive index is: \[ \mu = \frac{\sin\left(\frac{A + \delta_m}{2}\right)}{\sin\left(\frac{A}{2}\right)} \]
Step 3: Detailed Procedure:
Part A: Measuring the Angle of the Prism (A)
1. Perform the initial adjustments of the spectrometer (leveling, focusing telescope and collimator).
2. Place the prism on the prism table with its refracting edge facing the collimator.
3. Turn the telescope to one side to receive the light reflected from one refracting face. Center the slit image on the vertical cross-wire. Record the reading from the vernier scale.
4. Turn the telescope to the other side to receive light reflected from the second refracting face. Again, center the slit and record the reading.
5. The difference between these two readings is equal to 2A. Thus, A can be calculated.
Part B: Measuring the Angle of Minimum Deviation (\(\delta_m\))
1. Place the prism on the table so that light from the collimator falls on one face and emerges from the other.
2. Locate the refracted image of the slit with the telescope.
3. Rotate the prism table slowly while observing the image. The image will move, reverse its direction, and move back. The position where it reverses direction is the position of minimum deviation.
4. Set the telescope cross-wire on the slit image at this turning point. Record the reading.
5. Remove the prism and move the telescope to view the direct image of the slit from the collimator. Record this reading.
6. The difference between the reading for the deviated ray and the direct ray gives the angle of minimum deviation, \(\delta_m\).
Step 4: Calculation:
Substitute the measured values of A and \(\delta_m\) into the prism formula to calculate the refractive index \(\mu\).
Quick Tip: Using a monochromatic light source is essential for this experiment as it produces a single, sharp spectral line (image of the slit), making accurate measurements of angles possible. If white light were used, the image would be a dispersed spectrum, and a clear angle of deviation could not be measured.
Compare the e.m.f. of two given cells with the help of potentiometer.
View Solution
Step 1: Understanding the Concept:
A potentiometer is a device used for accurately measuring potential differences. It operates on the principle that the potential drop across any length of a uniform wire is directly proportional to that length when a constant current flows through it. By balancing the e.m.f. of a cell against the potential drop across a certain length of the potentiometer wire, we can find a "balancing length". By comparing the balancing lengths for two different cells, we can compare their e.m.f.s.
Step 2: Key Formula and Apparatus:
Apparatus Required:
A potentiometer, a driver cell (battery), two primary cells whose e.m.f.s are to be compared (\(\epsilon_1, \epsilon_2\)), a two-way key, a galvanometer, a rheostat, a one-way key, a jockey, and connecting wires.
Key Formula:
If \(l_1\) is the balancing length for the cell with e.m.f. \(\epsilon_1\) and \(l_2\) is the balancing length for the cell with e.m.f. \(\epsilon_2\), then according to the potentiometer principle: \[ \epsilon_1 = k l_1 \quad and \quad \epsilon_2 = k l_2 \]
where k is the potential gradient. The ratio of the e.m.f.s is therefore: \[ \frac{\epsilon_1}{\epsilon_2} = \frac{l_1}{l_2} \]
Step 3: Detailed Procedure:
1. Primary Circuit Setup: Connect the driver cell, rheostat, and a one-way key (\(K_1\)) in series with the potentiometer wire.
2. Secondary Circuit Setup: Connect the positive terminals of both given cells (\(\epsilon_1\) and \(\epsilon_2\)) to the high potential end A (the zero end) of the potentiometer. Connect their negative terminals to the terminals 1 and 2 of a two-way key. The common terminal of the two-way key is connected to the jockey through a galvanometer.
3. Finding Balancing Length for \(\epsilon_1\): Close key \(K_1\). Insert the plug into the two-way key to connect cell \(\epsilon_1\) into the circuit. Slide the jockey along the wire to find the null point (where the galvanometer shows zero deflection). Measure the balancing length \(l_1\) from end A.
4. Finding Balancing Length for \(\epsilon_2\): Without changing the rheostat setting, remove the plug for \(\epsilon_1\) and insert it to connect cell \(\epsilon_2\). Find the new null point and measure the balancing length \(l_2\).
Step 4: Calculation:
Calculate the ratio of the e.m.f.s using the measured balancing lengths. \[ \frac{\epsilon_1}{\epsilon_2} = \frac{l_1}{l_2} \]
Repeat the experiment by changing the current in the primary circuit using the rheostat and find the mean value of the ratio.
Quick Tip: For the experiment to work, the e.m.f. of the driver cell must be greater than the e.m.f. of both cells being compared. Also, ensure all positive terminals are connected to one common point (the high potential end of the potentiometer). Do not slide the jockey along the wire, as it can scrape it and alter its uniformity; tap it gently at different points.
With the help of given bulb, switch and power source, assemble a household circuit.
View Solution
Step 1: Understanding the Concept:
A simple household circuit consists of a power source, a switch to control the flow of current, and a load (the bulb) that consumes electrical energy. The components are connected in series, meaning the current flows through each component one after the other. The switch, when open, breaks the circuit, stopping the current flow and turning the bulb off. When closed, it completes the circuit, allowing current to flow and the bulb to light up.
Step 2: Apparatus Required:
- An electric bulb with a holder
- A single-pole switch
- A power source (like a battery, battery eliminator, or a safe low-voltage AC source)
- Connecting wires
Step 3: Circuit Diagram and Procedure:
Circuit Diagram:
\begin{circuitikz \draw
(0,0) to[battery1, l=\text{Power Source] (4,0)
to[short] (4,2)
to[opening switch, l=\text{Switch] (2,2)
to[lamp, l=\text{Bulb] (0,2)
to[short] (0,0);
\end{circuitikz
Procedure:
1. Safety First: Ensure the power source is turned off or disconnected before making any connections.
2. Connect the Source to Switch: Take one connecting wire and connect it from the positive terminal of the power source to one of the terminals on the switch.
3. Connect Switch to Bulb: Take another wire and connect it from the second terminal of the switch to one of the terminals on the bulb holder.
4. Complete the Circuit: Take a third wire and connect it from the other terminal of the bulb holder back to the negative terminal of the power source. This completes the series circuit.
5. Testing: Turn on the power source. The bulb should be off. Now, close the switch (flick it to the 'ON' position). The circuit is now complete, and the bulb should light up. Open the switch (flick to 'OFF'), and the bulb should turn off.
Step 4: Result:
A simple household circuit was successfully assembled. The switch correctly controls the operation of the bulb, demonstrating the basic principle of a series electrical circuit.
Quick Tip: Always double-check your connections before turning on the power. Ensure that there are no exposed wires touching each other to prevent a short circuit. For household-level demonstrations, always use a low-voltage power source (like 6V or 12V) instead of the mains supply for safety.
Identify diode, transistor, LED and I.C. from the given mixed collection.
View Solution
Step 1: Understanding the Components:
- Diode: A two-terminal electronic component that conducts current primarily in one direction. It has an anode (+) and a cathode (-).
- Transistor: A three-terminal semiconductor device used to amplify or switch electronic signals. Common types are Bipolar Junction Transistors (BJT) which have a Base, Collector, and Emitter.
- LED (Light Emitting Diode): A special type of diode that emits light when current flows through it. It also has two terminals, an anode and a cathode.
- I.C. (Integrated Circuit): A set of electronic circuits on one small flat piece (or "chip") of semiconductor material. It typically has multiple pins (legs) and is housed in a black rectangular package.
Step 2: Identification by Physical Appearance:
- Diode: Look for a small cylindrical component with two leads. It usually has a black body with a silver or white band on one end, which indicates the cathode (negative) side.
- Transistor: Look for a component with three leads (legs). It often has a flat face and a semi-circular body, typically black in color. Part numbers are printed on the flat face.
- LED: Look for a small, transparent or colored plastic bulb with two leads. One lead is typically longer than the other; the longer lead is the anode (+). The base of the bulb might have a flat side, which indicates the cathode (-).
- I.C.: Look for a black, rectangular "chip" with multiple pins arranged in two parallel rows. There is usually a notch or a dot at one end to indicate pin 1.
Step 3: Identification using a Multimeter (in Diode Test Mode):
- Diode/LED: Connect the multimeter probes to the two leads. In one direction (red probe to anode, black to cathode), the multimeter will show a small voltage reading (forward bias). In the reverse direction, it will show an open circuit ('OL'). An LED will also light up faintly when forward-biased.
- Transistor: Use the multimeter to find the 'base' terminal. The base will show a diode-like connection to the other two terminals (collector and emitter). For an NPN transistor, the base is P-type; connecting the red probe to the base and the black probe to the other two terminals will show a reading. For a PNP transistor, the base is N-type, so the black probe must be connected to the base.
- I.C.: An I.C. cannot be easily tested with a multimeter without knowing its internal circuit diagram (datasheet). Identification is primarily by its physical appearance and the part number printed on it.
Quick Tip: When identifying components, start with a visual inspection. The number of leads is a major clue: 2 for diodes/LEDs, 3 for transistors, and many more for ICs. The markings and shapes are also unique identifiers.
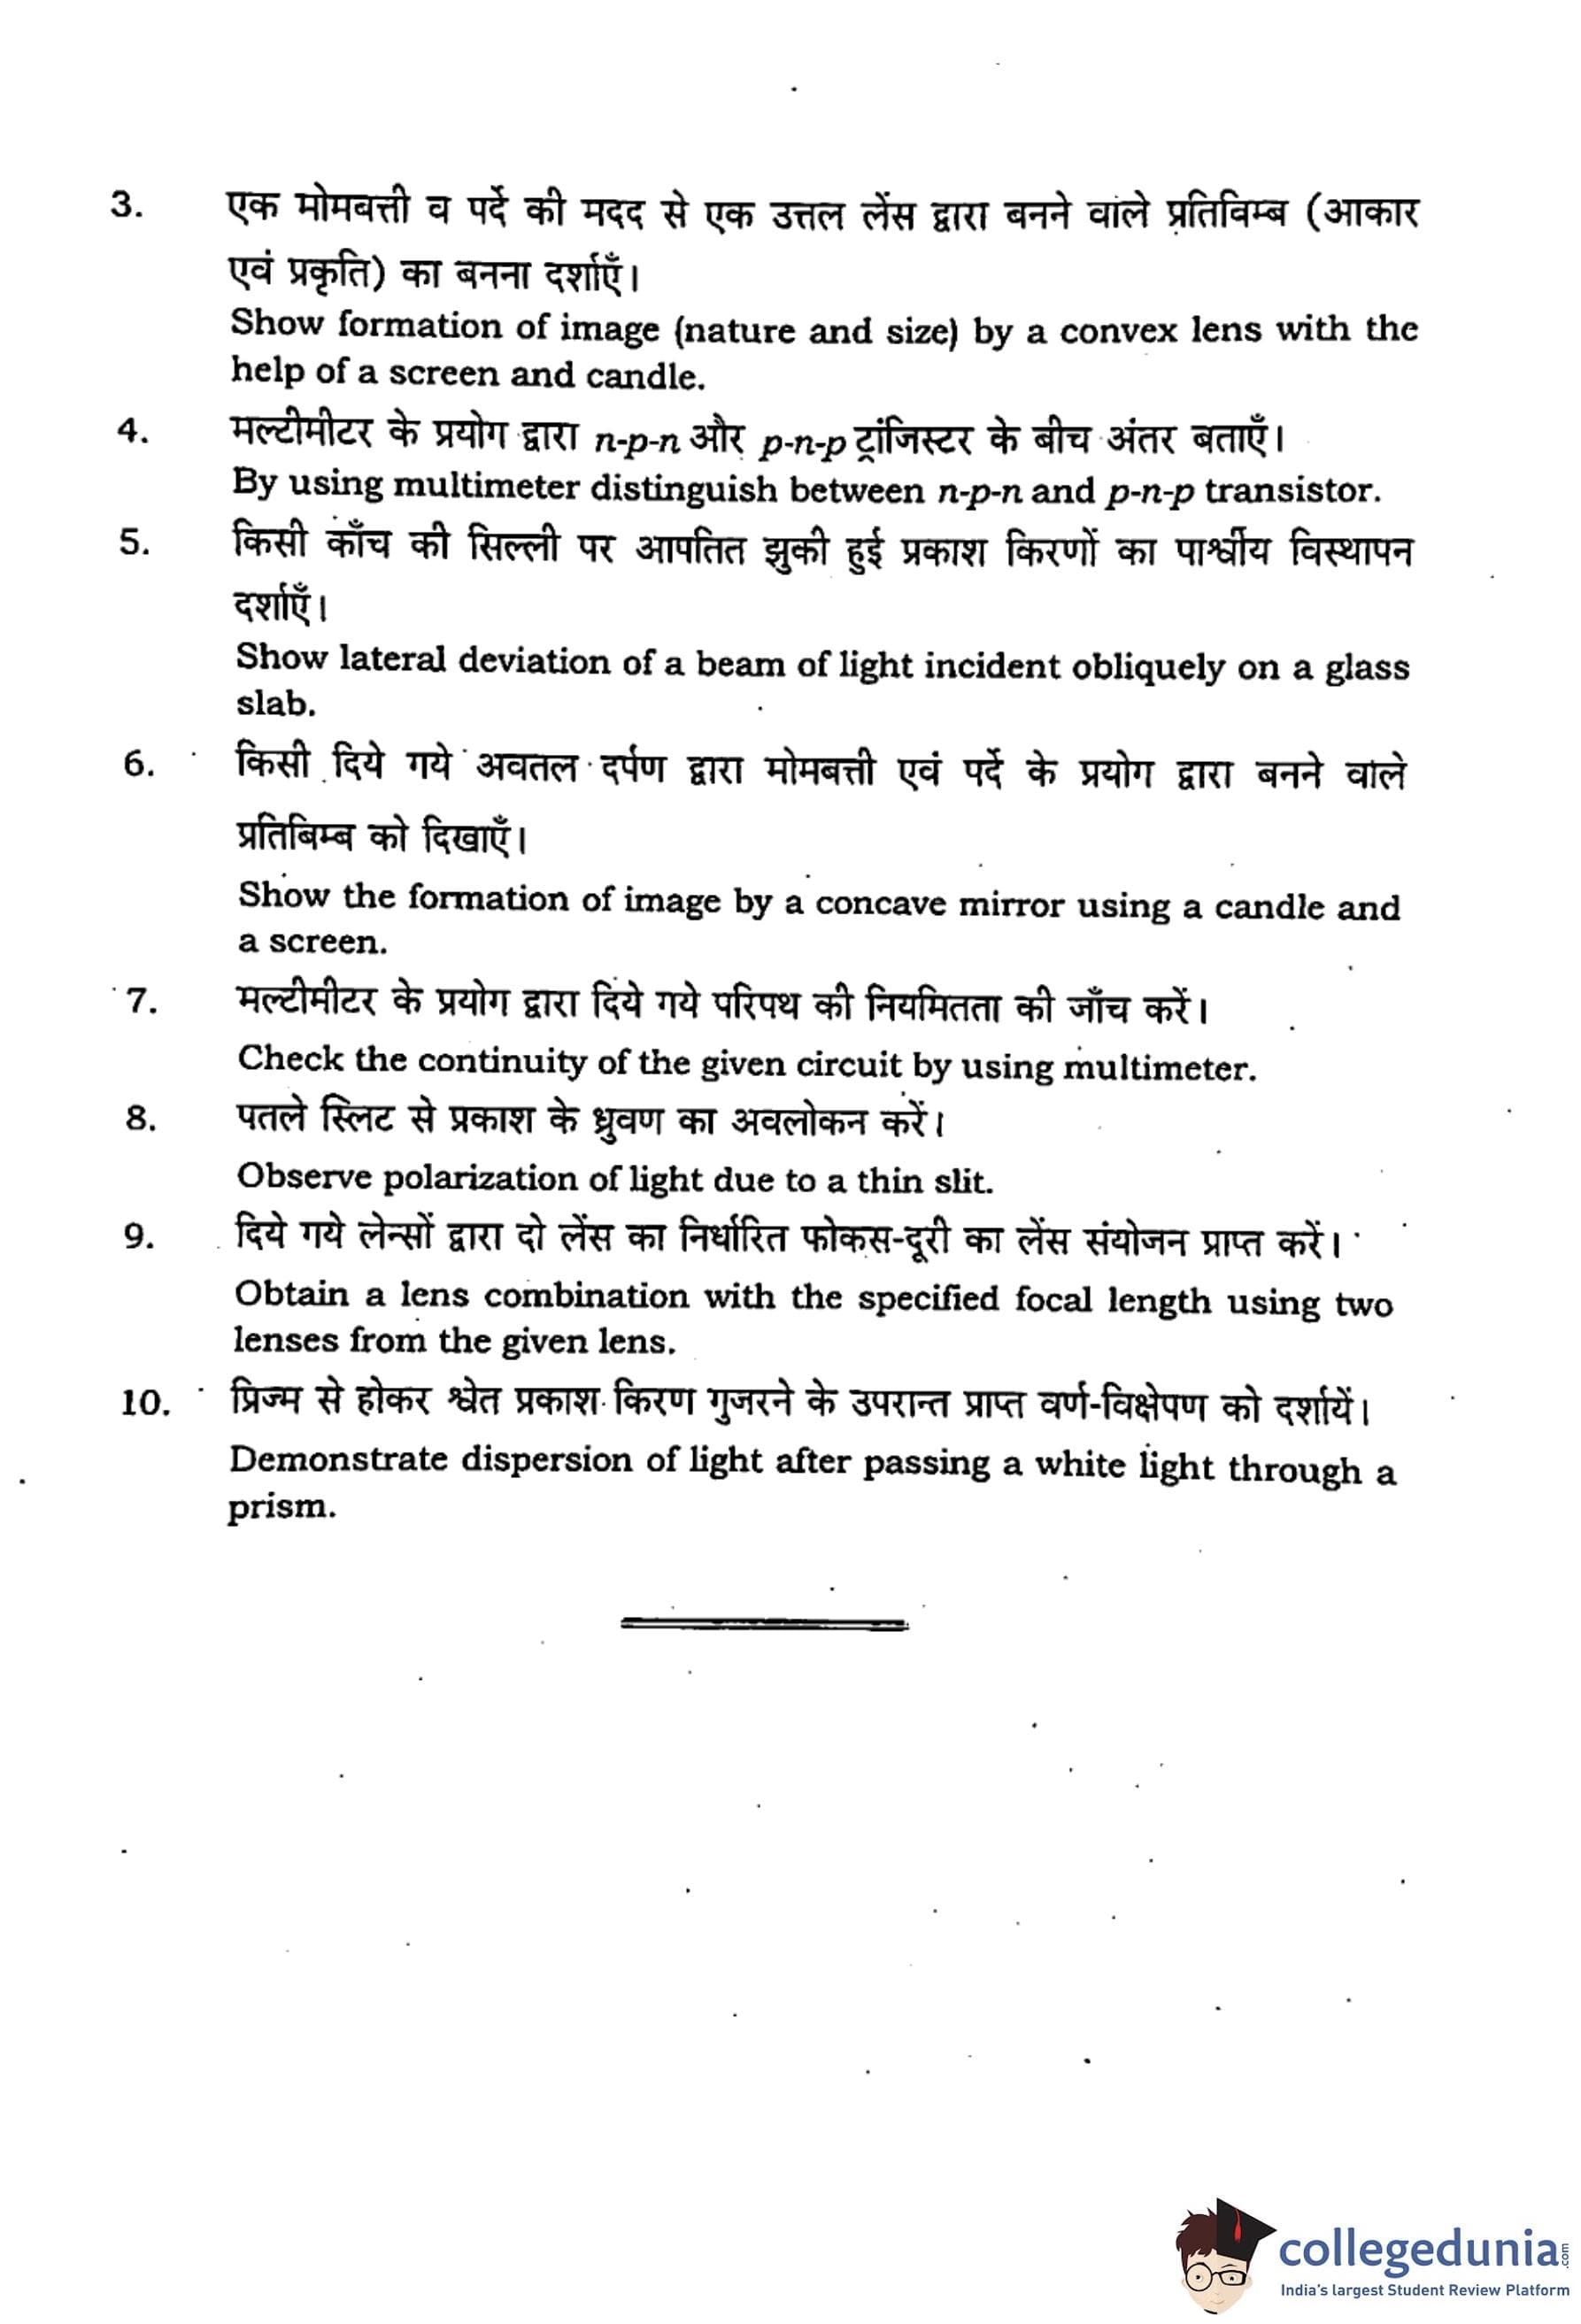
Show formation of image (nature and size) by a convex lens with the help of a screen and candle.
View Solution
Step 1: Understanding the Concept:
A convex lens is a converging lens. When an object (like a candle flame) is placed in front of it, the lens can form a real, inverted image on a screen placed on the other side, provided the object is placed outside the focal length. The size and position of the image depend on the object's distance from the lens.
Step 2: Apparatus Required:
- A convex lens with a lens holder
- A candle
- A white screen (a piece of white cardboard or a wall)
- A meter scale or optical bench
Step 3: Ray Diagram and Procedure:
Ray Diagram (for object beyond 2F):
\begin{tikzpicture[scale=0.8]
% Axes
\draw[->] (-5,0) -- (5,0) node[below] {Principal Axis;
\draw[->] (0,-2.5) -- (0,2.5);
% Lens
\draw[thick] (0,2) .. controls (0.2,0) .. (0,-2);
\draw[thick] (0,2) .. controls (-0.2,0) .. (0,-2);
\node at (0.3, 2.2) {L;
% Foci
\node[below] at (-2,0) {\(F_1\); \fill (-2,0) circle (1.5pt);
\node[below] at (2,0) {\(F_2\); \fill (2,0) circle (1.5pt);
\node[below] at (-4,0) {\(2F_1\); \fill (-4,0) circle (1.5pt);
\node[below] at (4,0) {\(2F_2\); \fill (4,0) circle (1.5pt);
% Object
\draw[thick, ->, color=blue] (-4.5,0) -- (-4.5,1.5) node[above] {Object;
% Rays
\draw[->, color=red] (-4.5,1.5) -- (0,1.5);
\draw[->, color=red, dashed] (0,1.5) -- (2,0);
\draw[->, color=red] (2,0) -- (4.5, -1.25);
\draw[->, color=green] (-4.5,1.5) -- (0,0);
\draw[->, color=green] (0,0) -- (4.5,-1.25);
% Image
\draw[thick, ->, color=blue] (3.6,0) -- (3.6,-1.2) node[below] {Image;
\end{tikzpicture
Procedure:
1. Setup: Place the convex lens in its holder on a table. Light the candle and place it in front of the lens. Place the screen on the other side of the lens.
2. Case 1: Object far away (beyond 2F): Place the candle at a distance significantly greater than twice the focal length of the lens. Move the screen back and forth until a sharp, clear image of the candle flame is formed on it.
3. Case 2: Object at 2F: Place the candle at a distance equal to twice the focal length. Adjust the screen to get a sharp image.
4. Case 3: Object between F and 2F: Move the candle closer to the lens, to a position between F and 2F. Again, adjust the screen to get a sharp image.
Step 4: Observation:
- Case 1 (Object beyond 2F): The image formed is real (can be captured on a screen), inverted (upside down), and diminished (smaller than the object).
- Case 2 (Object at 2F): The image formed is real, inverted, and of the same size as the object.
- Case 3 (Object between F and 2F): The image formed is real, inverted, and magnified (larger than the object).
This demonstrates how the nature and size of the image change with the object's position.
Quick Tip: To get a sharp image, perform the experiment in a darkened room. This will make the candle flame's image more visible on the screen. The distance from the lens to the candle is the object distance (u), and the distance from the lens to the screen is the image distance (v).
By using multimeter distinguish between n-p-n and p-n-p transistor.
View Solution
Step 1: Understanding the Concept:
A Bipolar Junction Transistor (BJT) consists of three layers of semiconductor material. It can be of two types: NPN or PNP. Internally, a transistor can be thought of as two diodes connected back-to-back. The central region is the Base (B), and the outer regions are the Emitter (E) and Collector (C). We can use a multimeter in diode test mode or resistance mode to identify the base and determine the type.
- NPN: P-type base between two N-type regions. Current flows from Collector to Emitter.
- PNP: N-type base between two P-type regions. Current flows from Emitter to Collector.
Step 2: Apparatus Required:
- A digital multimeter with a diode test function or ohmmeter function.
- NPN and PNP transistors for testing.
Step 3: Detailed Procedure:
1. Set the Multimeter: Set the multimeter to the diode test mode. In this mode, the multimeter sends a small current through its probes and displays the voltage drop.
2. Identify the Base Terminal: A transistor has three terminals. The base is the terminal that shows a diode-like connection to the other two.
- Arbitrarily label the pins 1, 2, and 3.
- Place the positive (red) probe on pin 1. Touch the negative (black) probe to pin 2 and then to pin 3. If you get a voltage reading (typically 0.5V to 0.7V) in both cases, then pin 1 is the Base and the transistor is NPN (P-type base).
- If you get no reading, move the red probe to pin 2 and repeat. Then move to pin 3 and repeat.
- If no combination works, switch the probes. Place the negative (black) probe on pin 1. Touch the positive (red) probe to pin 2 and then to pin 3. If you get a reading in both cases, then pin 1 is the Base and the transistor is PNP (N-type base).
3. Confirm the Type:
- NPN Transistor: The base is found when the positive (red) probe is placed on it, and the negative (black) probe gives a reading on the other two pins. (Think: Positive on P-type base).
- PNP Transistor: The base is found when the negative (black) probe is placed on it, and the positive (red) probe gives a reading on the other two pins. (Think: Negative on N-type base).
Step 4: Result:
By following this procedure, one can first identify the base terminal of the transistor. Based on the polarity of the multimeter probes that results in two forward-biased readings from the base, the transistor can be distinguished as either NPN or PNP.
Quick Tip: To distinguish between the collector and emitter, one method is to look at the multimeter readings. The forward voltage drop between Base-Emitter (BE) is usually slightly higher than between Base-Collector (BC). However, the most reliable way is to check the transistor's datasheet using the part number printed on it.
Show lateral deviation of a beam of light incident obliquely on a glass slab.
View Solution
Step 1: Understanding the Concept:
When a ray of light passes obliquely through a rectangular glass slab with parallel faces, it emerges parallel to its original path. However, the emergent ray is shifted sideways. This perpendicular distance between the direction of the incident ray and the emergent ray is called lateral deviation or lateral shift. This phenomenon occurs due to refraction at the two parallel surfaces of the slab.
Step 2: Apparatus Required:
- A rectangular glass slab
- A drawing board and a sheet of white paper
- Drawing pins or tape
- Several all-pins
- A protractor and a ruler
Step 3: Ray Diagram and Procedure:
Ray Diagram:
\begin{tikzpicture[scale=1.2]
% Glass Slab
\draw[thick, fill=cyan!20] (0,0) rectangle (4,2.5);
\node at (2,1.25) {Glass;
% Incident Ray
\draw[thick, ->, red] (-1.5,3) -- (1,1.5);
\node[above, left, red] at (-0.5,2.5) {Incident Ray;
% Normal 1
\draw[dashed, gray] (1,3) -- (1,0);
% Refracted Ray
\draw[thick, ->, blue] (1,1.5) -- (3,0.5);
\node[below, blue] at (2,1) {Refracted Ray;
% Normal 2
\draw[dashed, gray] (3,2.5) -- (3, -0.5);
% Emergent Ray
\draw[thick, ->, red] (3,0.5) -- (5.5,-0.5);
\node[below right, red] at (4,0) {Emergent Ray;
% Extended Incident Ray
\draw[dashed, red] (1,1.5) -- (5.5,-0.2);
% Lateral Shift
\draw[<->, thick] (4.25, -0.35) -- (4.25, -0.05);
\node[right] at (4.25, -0.2) {Lateral Shift;
\end{tikzpicture
Procedure:
1. Setup: Fix the sheet of paper on the drawing board. Place the glass slab in the middle and trace its outline, labeling it ABCD.
2. Incident Ray: Remove the slab. Draw a line PQ that meets the face AB at an angle (the incident ray). Fix two pins, P1 and P2, vertically on this line.
3. Locating Emergent Ray: Place the slab back on its outline. Look through the opposite face CD and place two more pins, P3 and P4, such that they appear to be in a straight line with the images of pins P1 and P2.
4. Tracing the Path: Remove the slab and the pins. Join the points P3 and P4 to form the line RS, which is the emergent ray. Join the point Q on face AB to the point R on face CD. The path P-Q-R-S is the path of the light ray.
5. Observing Deviation: Extend the incident ray PQ forward with a dashed line. You will observe that the emergent ray RS is parallel to the extended incident ray. The perpendicular distance between these two parallel lines is the lateral deviation.
Step 4: Result:
The experiment demonstrates that a ray of light incident obliquely on a glass slab emerges parallel to its original path but is displaced laterally.
Quick Tip: To clearly observe the lateral shift, use a thicker glass slab and a larger angle of incidence (but less than 90 degrees). The greater the thickness and the angle of incidence, the greater the lateral deviation.
Show the formation of image by a concave mirror using a candle and a screen.
View Solution
Step 1: Understanding the Concept:
A concave mirror is a converging mirror. It can form a real, inverted image of an object placed in front of it, provided the object is placed beyond the focal point (F). This real image can be projected onto a screen. The size and location of the image depend on the object's distance from the mirror.
Step 2: Apparatus Required:
- A concave mirror with a holder
- A candle (as the object)
- A white screen
- A meter scale or optical bench
Step 3: Ray Diagram and Procedure:
Ray Diagram (Object between C and F):
\begin{tikzpicture[scale=0.8]
% Axis
\draw[->] (-7,0) -- (1,0) node[below] {Principal Axis;
% Mirror
\draw[thick] (-0.5, 2.5) arc (105:75:10);
\node[below] at (0,0) {P; \fill (0,0) circle (1.5pt);
% Foci
\node[below] at (-3,0) {F; \fill (-3,0) circle (1.5pt);
\node[below] at (-6,0) {C; \fill (-6,0) circle (1.5pt);
% Object
\draw[thick, ->, color=blue] (-4.5,0) -- (-4.5,2) node[above] {Object;
% Rays
\draw[->, color=red] (-4.5,2) -- (-1.1, 2); % Parallel ray
\draw[->, color=red] (-1.1,2) -- (-3,0); % Reflects through F
\draw[->, color=red, dashed] (-3,0) -- (-8.1,-4);
\draw[->, color=green] (-4.5,2) -- (-3,0); % Ray through F
\draw[->, color=green] (-3,0) -- (0,-2);
\draw[->, color=green] (0,-2) -- (-8.1,-4); % Reflects parallel
% Image
\draw[thick, ->, color=blue] (-8.1,0) -- (-8.1,-4) node[below] {Image;
\end{tikzpicture
Procedure:
1. Find Rough Focal Length: First, find the approximate focal length (f) of the mirror by focusing the image of a distant object (like a window) onto the screen. The distance from the mirror to the screen is roughly f. The center of curvature (C) is at 2f.
2. Setup: Place the concave mirror in its holder. Place the lit candle in front of it.
3. Case 1 (Object beyond C): Place the candle at a distance greater than 2f from the mirror. Place the screen between C and F and move it to get a sharp image.
4. Case 2 (Object at C): Place the candle at 2f. Move the screen to get a sharp image.
5. Case 3 (Object between C and F): Place the candle between f and 2f. Move the screen beyond C to get a sharp image.
Step 4: Observation:
- Case 1 (Object beyond C): A real, inverted, and diminished (smaller) image is formed on the screen between C and F.
- Case 2 (Object at C): A real, inverted image of the same size is formed at C.
- Case 3 (Object between C and F): A real, inverted, and magnified (larger) image is formed beyond C.
This demonstrates the different types of real images formed by a concave mirror.
Quick Tip: If the candle is placed within the focal length (u < f), no image will be formed on the screen because the image is virtual. You would need to look into the mirror to see the virtual, erect, and magnified image.
Check the continuity of the given circuit by using multimeter.
View Solution
Step 1: Understanding the Concept:
Continuity means there is a complete, unbroken path for current to flow. A continuity test is used to check for breaks in wires, fuses, or connections in a circuit. A multimeter in continuity mode sends a small current through the circuit and detects if it flows from one probe to the other. If the path is complete, the multimeter typically emits an audible beep and displays a low resistance value (close to 0 \(\Omega\)).
Step 2: Apparatus Required:
- A digital multimeter with a continuity function.
- The circuit to be tested.
Step 3: Detailed Procedure:
1. Safety First: Ensure that the circuit to be tested is de-energized. There should be no power source connected to it. Testing a live circuit for continuity can damage the multimeter and be dangerous.
2. Set the Multimeter: Turn the dial of the multimeter to the continuity setting. This is often indicated by a symbol that looks like a sound wave or a diode symbol.
3. Test the Multimeter: Before testing the circuit, touch the two probes of the multimeter together. It should beep, confirming that the multimeter itself is working correctly. The display should show a value very close to zero.
4. Test the Circuit: Place the two probes at the two points between which you want to check for continuity. For example, to check a single wire, place one probe at each end. To check a switch, place one probe on each terminal and operate the switch.
5. Interpret the Results:
- Beep and Low Reading (\(\sim 0 \, \Omega\)): This indicates good continuity. There is a complete path between the two points.
- No Beep and 'OL' (Overload/Open Loop): This indicates no continuity. There is a break in the circuit between the two points.
- No Beep and High Resistance Reading: This may indicate a poor connection or a component with high resistance in the path.
Step 4: Application:
This test can be used to check:
- If a wire is broken internally.
- If a fuse has blown.
- If a switch is working correctly (shows continuity when closed, and open circuit when open).
- If a solder joint is making a good connection.
Quick Tip: Never perform a continuity test on a live circuit. Always disconnect the power source first. If testing a component that is part of a larger circuit board, you may need to isolate it by desoldering one end to get an accurate reading, as other components in parallel can give a false continuity reading.
Observe polarization of light due to a thin slit.
View Solution
Step 1: Understanding the Concept:
This question might be slightly misstated, as a single thin slit is primarily known for causing \textit{diffraction, not significant polarization. Polarization is the phenomenon where light waves are restricted to oscillate in a single plane. While diffraction through a very narrow slit (comparable to the wavelength of light) can have minor polarization effects, the standard and most observable method to demonstrate polarization is by using polarizing filters (Polaroids). We will describe the observation using two polarizers, which is the standard demonstration.
Step 2: Apparatus Required:
- A source of unpolarized light (like a lamp or a torch).
- Two polarizing filters (often called Polaroids). These can be obtained from a physics kit or by using lenses from 3D movie glasses or some types of sunglasses.
Step 3: Detailed Procedure:
1. Setup: Hold one polarizing filter (let's call it the Polarizer, P1) in front of the light source. Look at the light source through this filter. You will see that the light passes through, but its intensity is reduced by about half. The light emerging from P1 is now plane-polarized.
2. Using the Second Filter: Now, take the second filter (let's call it the Analyzer, P2) and place it in front of the first one, between your eye and P1.
3. Observation 1 (Parallel Axes): Initially, align P2 such that it allows the maximum amount of light to pass through. In this position, the transmission axes of the two polarizers are parallel.
4. Observation 2 (Rotating the Analyzer): Slowly rotate the Analyzer (P2) while keeping the Polarizer (P1) fixed. As you rotate P2, you will observe that the intensity of the transmitted light gradually decreases.
5. Observation 3 (Crossed Axes): When the Analyzer has been rotated by 90 degrees from the initial position, the intensity of the light becomes zero (or very close to it), and you will see darkness. In this position, the axes of the two polarizers are perpendicular, and they are said to be "crossed".
6. Further Rotation: If you continue to rotate P2, the light intensity will start to increase again, becoming maximum at 180 degrees.
Step 4: Conclusion:
This experiment demonstrates the polarization of light. The first filter polarizes the unpolarized light. The second filter (Analyzer) is used to observe this polarization by controlling the amount of polarized light that passes through it, according to Malus's Law (\(I = I_0 \cos^2\theta\)). The fact that the light can be blocked completely by the second filter proves that it is a transverse wave and has been polarized.
Quick Tip: You can use an LCD screen (from a phone, calculator, or monitor) as a source of already polarized light. If you look at an LCD screen through a single polarizing filter and rotate the filter, you will see the screen's brightness change, even becoming completely black at a certain angle.
Obtain a lens combination with the specified focal length using two lenses from the given lens.
View Solution
Step 1: Understanding the Concept:
When two thin lenses are placed in contact, they behave as a single lens with an equivalent focal length (F) that depends on the individual focal lengths (\(f_1\) and \(f_2\)) of the two lenses. By choosing the right combination of lenses, a combination with a desired focal length can be created.
Step 2: Key Formula and Apparatus:
Apparatus Required:
- A collection of lenses (at least two, e.g., two convex lenses or one convex and one concave).
- An optical bench with lens holders.
- An object (like an illuminated screen or an optical needle).
- A screen to view the image.
Key Formula:
The formula for the equivalent focal length (F) of two thin lenses in contact is: \[ \frac{1}{F} = \frac{1}{f_1} + \frac{1}{f_2} \]
The power of the combination is \(P = P_1 + P_2\).
Step 3: Detailed Procedure:
1. Measure Individual Focal Lengths:
- First, determine the focal length of each of the two given lenses (\(f_1\) and \(f_2\)) individually. This can be done by finding the approximate focal length (focusing a distant object) or more accurately using the u-v method on an optical bench. Remember that focal length is positive for a convex lens and negative for a concave lens.
2. Calculate Theoretical Combined Focal Length:
- Let's say you have two convex lenses with \(f_1 = +20\) cm and \(f_2 = +30\) cm.
- The theoretical focal length of the combination would be:
\[ \frac{1}{F} = \frac{1}{20} + \frac{1}{30} = \frac{3 + 2}{60} = \frac{5}{60} = \frac{1}{12} \]
\[ F = +12 cm \]
- If one lens is convex (\(f_1 = +20\) cm) and one is concave (\(f_2 = -30\) cm):
\[ \frac{1}{F} = \frac{1}{20} - \frac{1}{30} = \frac{3 - 2}{60} = \frac{1}{60} \]
\[ F = +60 cm \]
3. Verify Experimental Combined Focal Length:
- Place the two lenses in contact with each other in a single holder on the optical bench. Treat this combination as a single lens.
- Place an object pin at a known distance 'u' from the combination.
- Locate the position of the real image formed on the other side using a screen or another needle (by removing parallax). Measure the image distance 'v'.
- Use the lens formula \( \frac{1}{F_{exp}} = \frac{1}{v} - \frac{1}{u} \) to calculate the experimental focal length of the combination.
Step 4: Result:
Compare the experimentally determined focal length (\(F_{exp}\)) with the theoretically calculated focal length (F). They should be approximately equal. This demonstrates how to obtain a lens combination with a specific, predictable focal length.
Quick Tip: The formula \( \frac{1}{F} = \frac{1}{f_1} + \frac{1}{f_2} \) is valid for lenses in contact. If there is a distance 'd' between the lenses, the formula becomes more complex: \( \frac{1}{F} = \frac{1}{f_1} + \frac{1}{f_2} - \frac{d}{f_1 f_2} \). For this experiment, ensure the lenses are as close together as possible.
Demonstrate dispersion of light after passing a white light through a prism.
View Solution
Step 1: Understanding the Concept:
Dispersion is the phenomenon of splitting of white light into its constituent colors when it passes through a transparent medium like a glass prism. This happens because the refractive index of the prism material is different for different wavelengths (colors) of light. According to Cauchy's relation, the refractive index is greater for shorter wavelengths (like violet) and smaller for longer wavelengths (like red). Therefore, violet light bends the most, and red light bends the least, separating the colors into a spectrum.
Step 2: Apparatus Required:
- A glass prism.
- A source of white light (a ray box with a narrow slit is ideal, but sunlight from a window or a torch can also be used).
- A white screen.
Step 3: Ray Diagram and Procedure:
Ray Diagram:
\begin{tikzpicture[scale=1.5]
% Prism
\draw[thick] (0,0) -- (2,3) -- (4,0) -- cycle;
% Incident White Light
\draw[thick, ->] (-1,1.8) -- (1,2.4);
\node[left] at (-1, 1.8) {White Light;
% Refraction and Dispersion
\coordinate (A) at (1,2.4);
\coordinate (B_red) at (2.8, 0.6);
\coordinate (B_violet) at (2.5, 1.2);
\draw[thick, red] (A) -- (B_red);
\draw[thick, violet] (A) -- (B_violet);
% Emergent Rays
\draw[thick, ->, red] (B_red) -- (5, -0.5);
\draw[thick, ->, violet] (B_violet) -- (5, 0.5);
% Screen and Spectrum
\draw[thick] (5.2, -1) -- (5.2, 1.5);
\node[right, red] at (5.2, -0.5) {Red;
\node[right, violet] at (5.2, 0.5) {Violet;
\node[rotate=90] at (5.4, 0) {Spectrum;
\end{tikzpicture
Procedure:
1. Setup: Perform the experiment in a dark room for the best visibility. Place the prism on a table.
2. Directing Light: Arrange the source of white light so that a narrow beam of light is incident on one of the refracting faces of the prism.
3. Positioning the Screen: Place a white screen on the other side of the prism, where the light emerges.
4. Observation: Adjust the angle of the incident beam and the position of the screen until a clear band of colors is observed on the screen. This band of colors is called a spectrum.
5. Identifying Colors: Observe the colors in the spectrum. You will see a continuous band starting from Red at the top (least deviated) and ending with Violet at the bottom (most deviated). The order of colors is Violet, Indigo, Blue, Green, Yellow, Orange, Red (VIBGYOR).
Step 4: Conclusion:
The experiment demonstrates that white light is a mixture of several colors. When it passes through a prism, the different colors travel at different speeds and are refracted at slightly different angles, causing them to separate and form a spectrum. This phenomenon is called dispersion.
Quick Tip: To get a sharp and clear spectrum, it is crucial to use a narrow beam of white light. If the beam is too wide, the colors will overlap, and the spectrum will be blurry. Using a ray box with a slit is the best way to achieve this.
Comments