


Content Writer | Updated On - Dec 16, 2025
A significant improvement was observed in the average CTC of the top 10 students, which rose from ₹13.2 LPA to ₹15.2 LPA. Check Full Report Here!
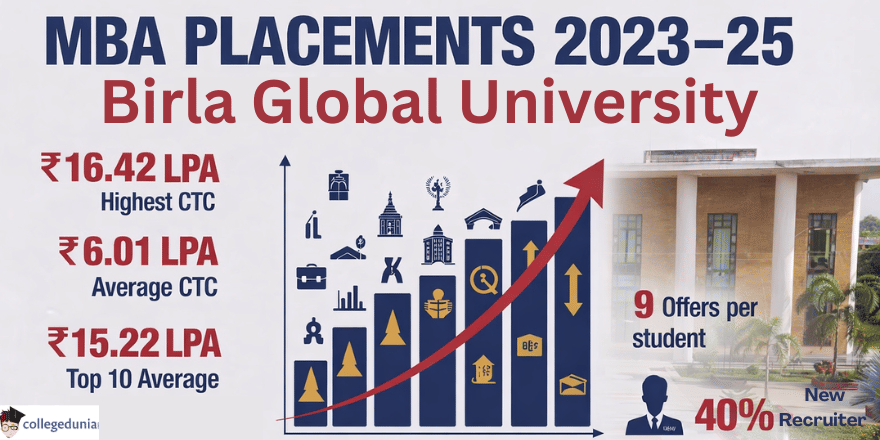
Birla Global University (BGU), Bhubaneswar, has officially released the MBA placement report for the 2023–25 batch, highlighting strong placement outcomes and consistent industry engagement. According to the placement data, the highest CTC offered during the 2023–25 MBA placements stood at ₹16.42 lakh per annum (LPA).
The average CTC recorded was ₹6.01 LPA, indicating stable compensation trends across participating recruiters. Notably, the average CTC of the top 10 students reached ₹15.2 LPA, showcasing high-value offers secured by top performers of the batch.
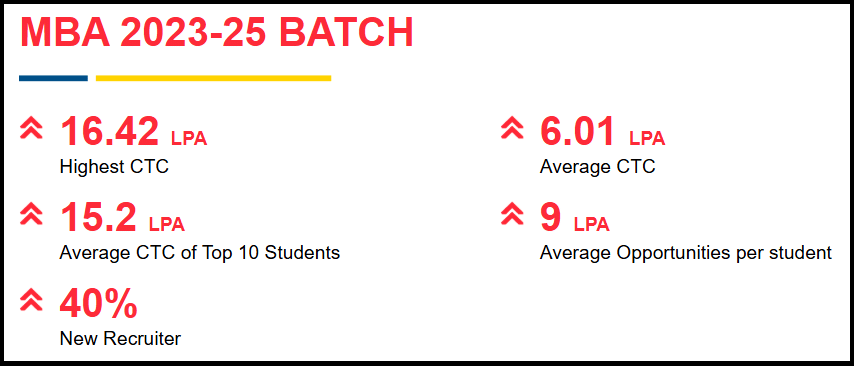
Image Source - Birla Global University Official Site
On average, each student received 9 LPA average placement opportunities, reflecting sustained recruiter interest and multiple role options across sectors. The university also reported a 40% increase in new recruiters, underlining expanding corporate partnerships and growing recognition of BGU’s MBA talent pool.
Birla Global University MBA Placement Report
| Particulars | Batch 2023–25 | Batch 2022-24 |
|---|---|---|
| Highest CTC | INR 16.42 LPA | INR 16.22 LPA |
| Average CTC | INR 6.01 LPA | INR 7.2 LPA |
| Average CTC of Top 10 Students | INR 15.2 LPA | INR 13.2 LPA |
| Average Opportunities per Student | INR 9 LPA | INR 8 LPA |
| Increase in New Recruiters | 40% | 40% |
Key Placement Comparison - MBA Batch 2025 vs 2024
The highest CTC increased marginally from ₹16.22 LPA in the 2022–24 batch to ₹16.42 LPA in the 2023–25 batch, marking an approximate 1.23% rise, indicating stable top-end compensation.
In contrast, the average CTC declined from ₹7.2 LPA to ₹6.01 LPA, reflecting a decrease of around 16.5%, suggesting a more moderate salary distribution across the batch.
A significant improvement was observed in the average CTC of the top 10 students, which rose from ₹13.2 LPA to ₹15.2 LPA. This represents a strong increase of approximately 15.15%, highlighting improved high-performer outcomes in the latest batch.
The average number of opportunities per student increased from 8 to 9, registering a growth of about 12.5%, indicating broader recruiter engagement and enhanced placement exposure for students.
The increase in new recruiters remained consistent at 40% across both batches, showing no percentage change.
Also Read

.jpeg?h=127&w=254&mode=stretch)
.jpeg?h=127&w=254&mode=stretch)

.jpeg?h=127&w=254&mode=stretch)


.jpeg?h=127&w=254&mode=stretch)

.jpeg?h=40&w=40&mode=stretch)
.jpeg?h=40&w=40&mode=stretch)

.jpeg?h=40&w=40&mode=stretch)

.jpeg?h=40&w=40&mode=stretch)


.jpeg?h=40&w=40&mode=stretch)


.jpeg?h=40&w=40&mode=stretch)

.jpeg?h=40&w=40&mode=stretch)
.jpeg?h=40&w=40&mode=stretch)


Comments