Economics Mentor, SRCC | Updated on - Jun 28, 2026
Class 12 Economics Chapter 2 National Income Accounting is the second chapter of the Macroeconomics book. It shows how an economy measures its total output using the product, income and expenditure methods. This page gives step-by-step NCERT solutions to all 12 exercise questions, with a free PDF to download.
Here is what this chapter is worth in the exam:
12 NCERT exercise questions, each solved with the formula, the substitution and the final answer on separate lines.
The numericals Q10, Q11 and Q12 carry the most marks, about 16 of the chapter's 46.
Tested in every CBSE Class 12 Economics paper, and useful for CUET Economics too.
Free PDF download, paired with a notes file, a formula sheet and a handwritten notes set on the same chapter.
What the NCERT Solutions for Class 12 Economics Chapter 2 Cover
This chapter answers one question: how do we measure everything an economy produces in a year? The solutions follow the same textbook order.
Macroeconomics vs microeconomics and the four factors of production with their incomes: rent, wages, interest and profit.
Circular flow of income: the two-sector model where factor payments equal consumption spending.
Three methods of measuring GDP: product, expenditure (C+I+G+X-M) and income.
Stocks vs flows, gross vs net: the distinctions every numerical needs.
Chain of aggregates: GDPMP, GDPFC, NDP, NNP, National Income, Personal Income and Personal Disposable Income.
Nominal vs real GDP, the GDP deflator and GDP as a welfare measure.
Exercise-wise Breakdown of National Income Class 12 NCERT Solutions
Chapter 2 has 12 end-of-chapter questions: definitions, derivations and numericals. The table maps each to its topic and usual marks.
Question
Topic covered
Typical marks
Q1
Four factors of production and their remunerations
3 marks
Q2
Why final expenditure equals factor payments
3 marks
Q3
Stock vs flow, with examples
3 marks
Q4
Gross investment vs net investment
3 marks
Q5
The four demand components: C, I, G, NX
4 marks
Q6
Planned vs unplanned inventory accumulation
3 marks
Q7
The three identities in national income accounting
4 marks
Q8
Does a higher GDP mean higher welfare?
4 marks
Q9
Nominal GDP vs real GDP
3 marks
Q10
GDP by the income method (numerical)
4 marks
Q11
Personal Disposable Income (chain numerical)
6 marks
Q12
Value-added by two firms and total GDP
6 marks
Q10, Q11 and Q12 carry 16 of the 46 chapter marks, so the numericals matter most.
National Income Class 12: Concepts, Formulas and Worked Numericals
Almost every numerical comes down to a few formulas and knowing what counts and what does not.
Factors of Production and the Circular Flow of Income
An economy uses four factors: land, labour, capital and entrepreneurship, which earn rent, wages, interest and profit. The first three are fixed in advance; profit is the residual. In the circular flow, households supply factors and earn income (Y), then spend it on goods, so consumption (C) equals income (Y).
The Three Methods of Measuring National Income
Each method must give the same number if the accounting is correct.
Product method: GDPMP = sum of (Output − Intermediate Consumption). This avoids double counting.
Income method: GDPFC = Compensation of Employees + Operating Surplus + Mixed Income.
Expenditure method: GDPMP = C + I + G + (X − M).
The Chain of National Income Aggregates
Once GDP at Market Price is fixed, the chain is simple addition and subtraction. It is the most-tested pattern, so the list below is worth memorising.
Aggregate
Formula
What it adds or removes
GDP at Factor Cost
GDPMP − Net Indirect Taxes
Remove the indirect tax wedge to get pure factor cost
NDP at Market Price
GDPMP − Depreciation
Subtract consumption of fixed capital
NNP at Market Price
NDPMP + Net Factor Income from Abroad (NFIA)
Move from domestic to national, add net earnings of residents abroad
NNP at Factor Cost = National Income
NNPMP − Net Indirect Taxes
The textbook definition of National Income
Personal Income
NI − Undistributed Profits − Corporate Tax − Net Interest paid by households + Transfer Payments
What actually reaches the household sector
Personal Disposable Income
Personal Income − Direct Taxes − Miscellaneous Receipts of Government
The income households can actually spend or save
CBSE has tested the GDPMP to PDI chain in three of the last five papers, so Q11 is a must.
Nominal GDP, Real GDP and the GDP Deflator
Nominal GDP uses current-year prices; real GDP uses base-year prices. The GDP Deflator = (Nominal GDP ÷ Real GDP) × 100. Above 100 means inflation, below 100 means deflation. CPI is similar but uses a fixed basket of goods.
National Income Formula for Class 12: One-Glance Sheet
One block to revise from in the last 30 minutes; it maps to every numerical in the exercise.
Concept
Formula
Value Added by a firm
Value of Output − Intermediate Consumption
GDPMP by expenditure method
C + I + G + (X − M)
GDPMP by income method
NDPFC + Depreciation + Net Indirect Taxes
Net Investment
Gross Investment − Depreciation
Net Factor Income from Abroad
Factor income from abroad − Factor income paid abroad
National Income (NNPFC)
GDPMP − Depreciation + NFIA − Net Indirect Taxes
Personal Income
Private Income − Undistributed Profits − Corporate Tax
Personal Disposable Income
Personal Income − Direct Taxes − Miscellaneous Receipts of Government
GDP Deflator
(Nominal GDP ÷ Real GDP) × 100
GDP at Market Price (closed economy)
C + I + G
Tip: Write the formula on a separate line before the numbers. This picks up 1 method mark even when the arithmetic is wrong.
Every numerical is worked end-to-end in the question cards lower down this page. Q10 shows the income method and Q11 the full GDPMP to PDI chain, each with an Expert's Solution that re-derives the answer a second way.
Common Mistakes in National Income Accounting Class 12
The five repeat mistakes CBSE examiners report on this chapter:
Mixing up NFIA and Net Indirect Taxes: NFIA moves you from domestic to national; NIT moves you from market price to factor cost.
Treating transfer payments as factor income: pensions and scholarships are left out of National Income.
Double counting intermediate goods: only the final good (bread, not the wheat or flour) enters GDP.
Forgetting depreciation: "gross" includes it, "net" subtracts it.
Confusing nominal and real GDP: "at constant prices" means real GDP.
How to Use This National Income Accounting Class 12 NCERT Solutions PDF
Learn the chapter in three passes:
Pass 1 (concepts): read the NCERT chapter with the notes open and skip the sums. Aim to know what each aggregate means.
Pass 2 (numericals): solve Q4, Q10, Q11 and Q12 yourself, then check each step against the Expert's Solution.
Pass 3 (revision): revise the formula sheet and solve 3 previous-year questions. A 6-mark numerical should take about 9 minutes with full working.
Previous Year Question Trends in National Income Accounting Class 12
The CBSE pattern has been steady. The table shows the question types and marks across recent board papers.
Year
Question type asked
Marks
2025
Calculate National Income by income method + define Personal Disposable Income
6 + 3
2024
GDP deflator definition + numerical on real vs nominal GDP
3 + 4
2023
Value-added method numerical for two-firm economy + circular flow MCQ
6 + 1
2022
Expenditure-method numerical + limitations of GDP as welfare measure
6 + 4
2021
Distinction between stocks and flows + Personal Disposable Income chain
3 + 6
Other Resources for Class 12 Economics Chapter 2 National Income Accounting
Pair this NCERT Solutions PDF with the notes, handwritten notes and NCERT book chapter below.
Resource
What it covers
Open
NCERT Solutions
Step-by-step answers to all 12 exercise questions, with Expert's Solution alternatives.
All NCERT Solutions for Class 12 Economics Chapter 2 National Income Accounting with Step-by-Step Solutions
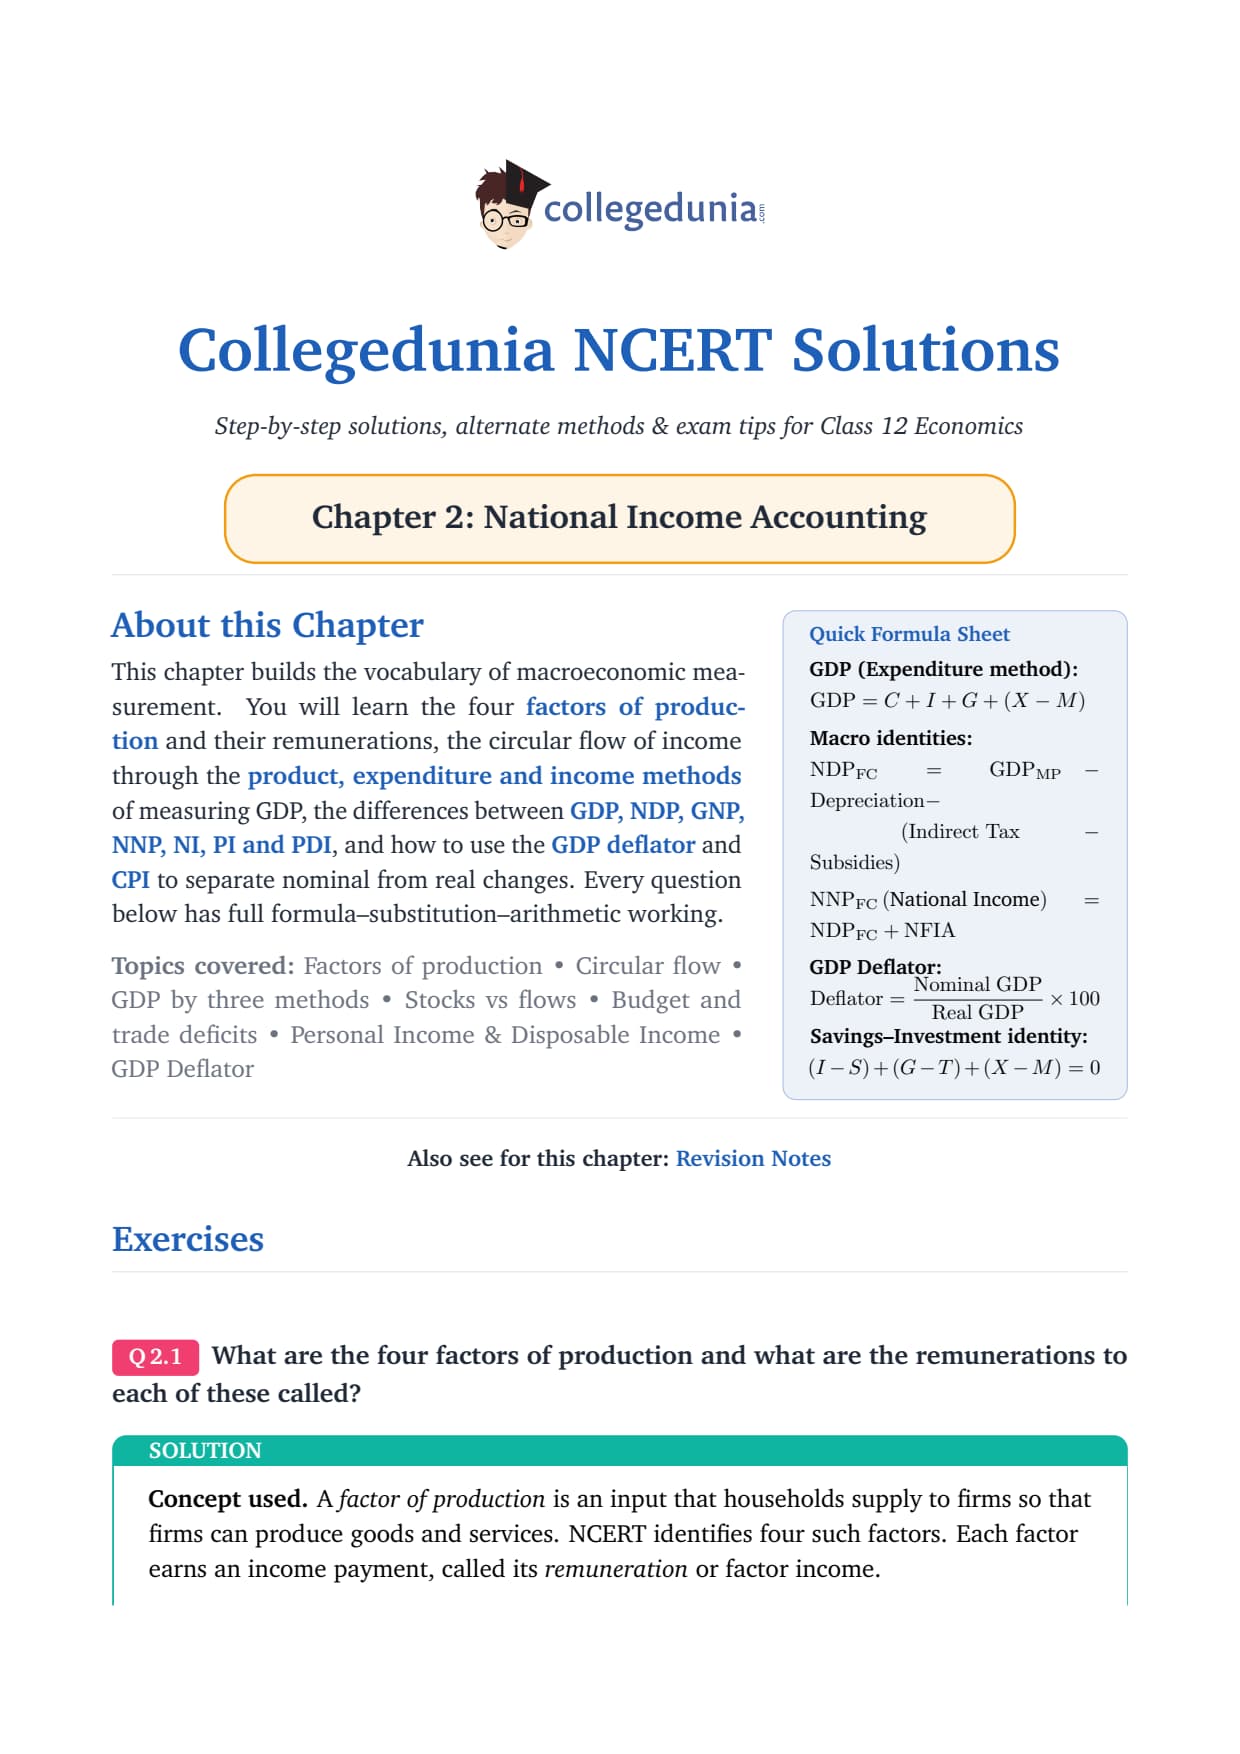
Q 1.1
What are the four factors of production and what are the
remunerations to each of these called?
Concept used. A factor of production is an input that
households supply to firms so that firms can produce goods and
services. NCERT identifies four such factors. Each factor earns an
income payment, called its remuneration or factor income.
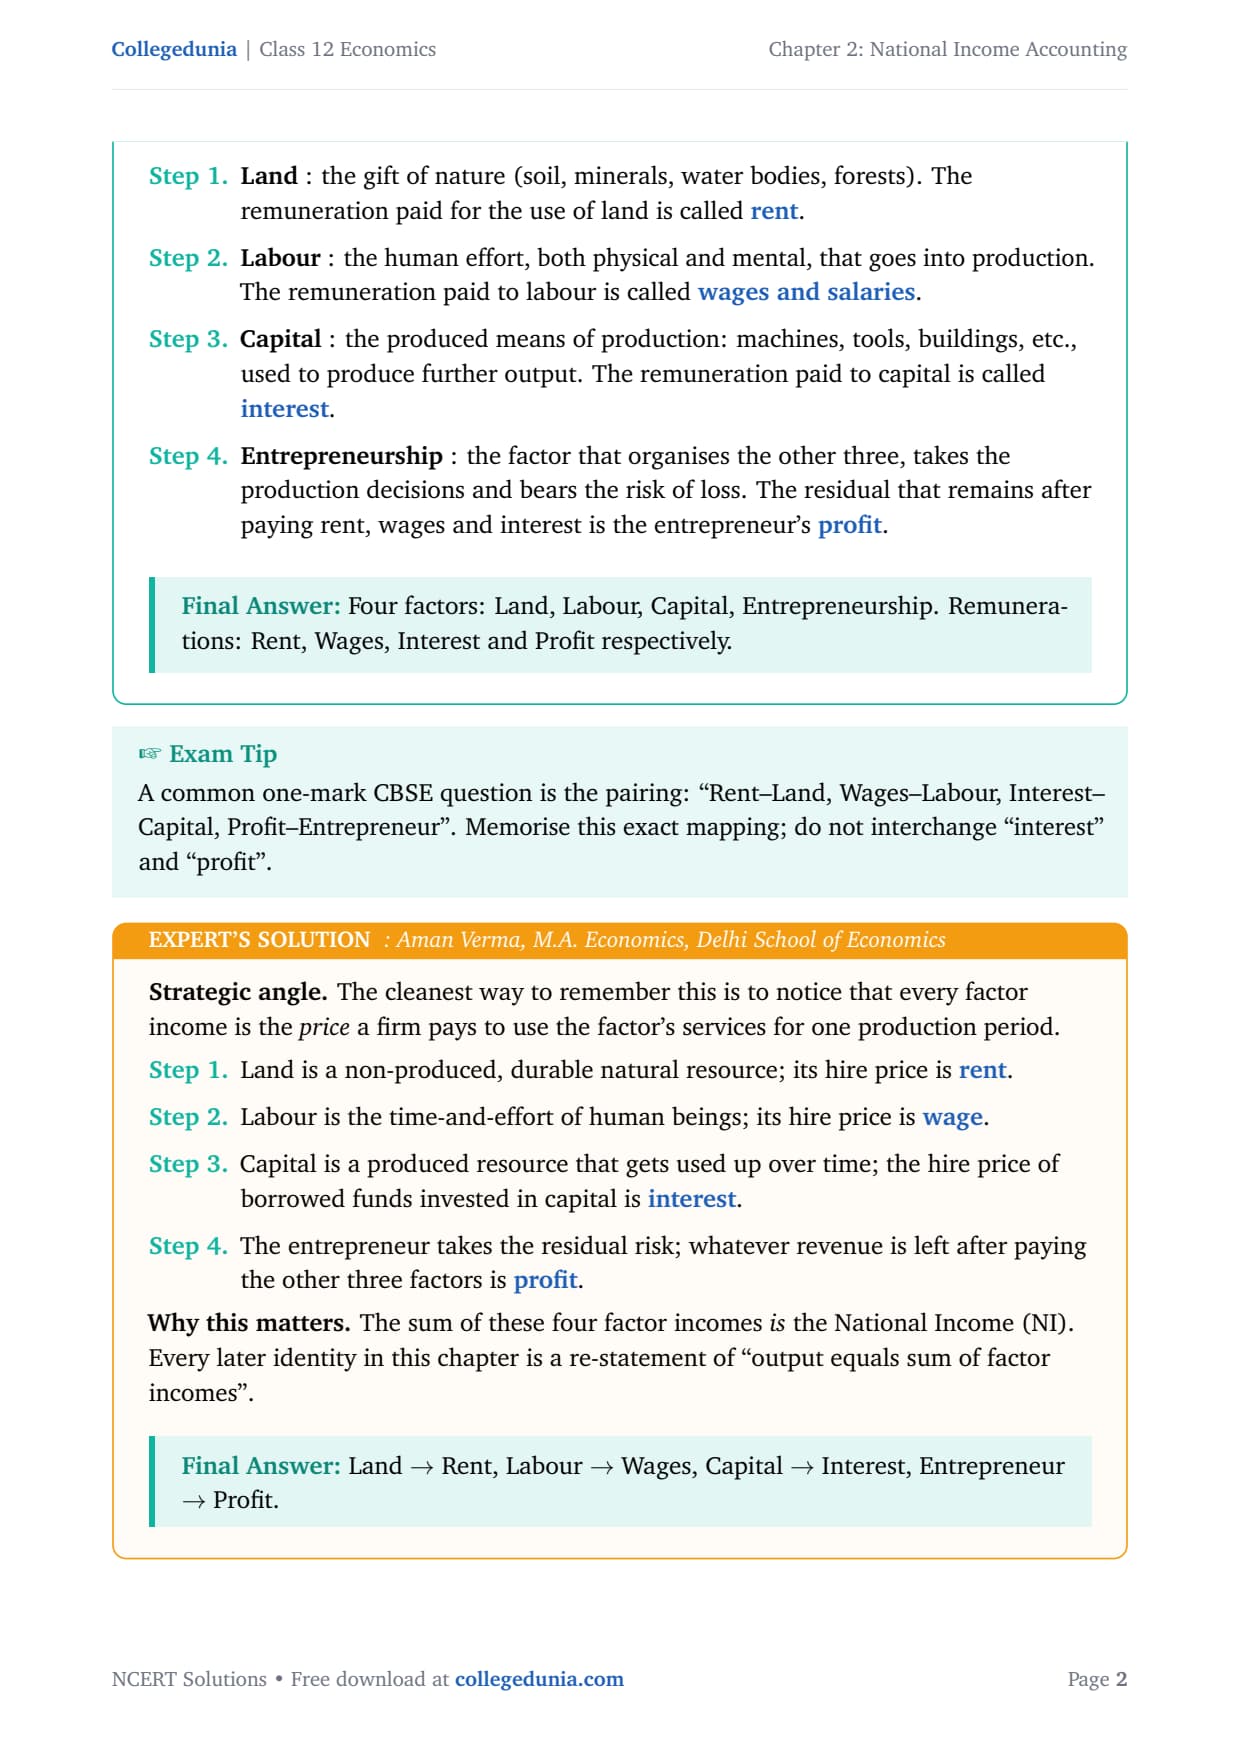
Land : the gift of nature (soil, minerals, water
bodies, forests). The remuneration paid for the use of land
is called rent.
Labour : the human effort, both physical and mental,
that goes into production. The remuneration paid to labour is
called wages and salaries.
Capital : the produced means of production: machines,
tools, buildings, etc., used to produce further output. The
remuneration paid to capital is called interest.
Entrepreneurship : the factor that organises the
other three, takes the production decisions and bears the
risk of loss. The residual that remains after paying rent,
wages and interest is the entrepreneur's
profit.
Four factors: Land, Labour, Capital, Entrepreneurship.
Remunerations: Rent, Wages, Interest and Profit respectively.
AV
Aman Verma
M.A. Economics, Delhi School of Economics
Verified Expert
Strategic angle. The cleanest way to remember this is to
notice that every factor income is the price a firm pays to
use the factor's services for one production period.
Land is a non-produced, durable natural resource; its hire
price is rent.
Labour is the time-and-effort of human beings; its hire
price is wage.
Capital is a produced resource that gets used up over time;
the hire price of borrowed funds invested in capital is
interest.
The entrepreneur takes the residual risk; whatever revenue
is left after paying the other three factors is
profit.
Why this matters. The sum of these four factor incomes
is the National Income (NI). Every later identity in this
chapter is a re-statement of ``output equals sum of factor incomes''.
Land → Rent, Labour → Wages, Capital →
Interest, Entrepreneur → Profit.
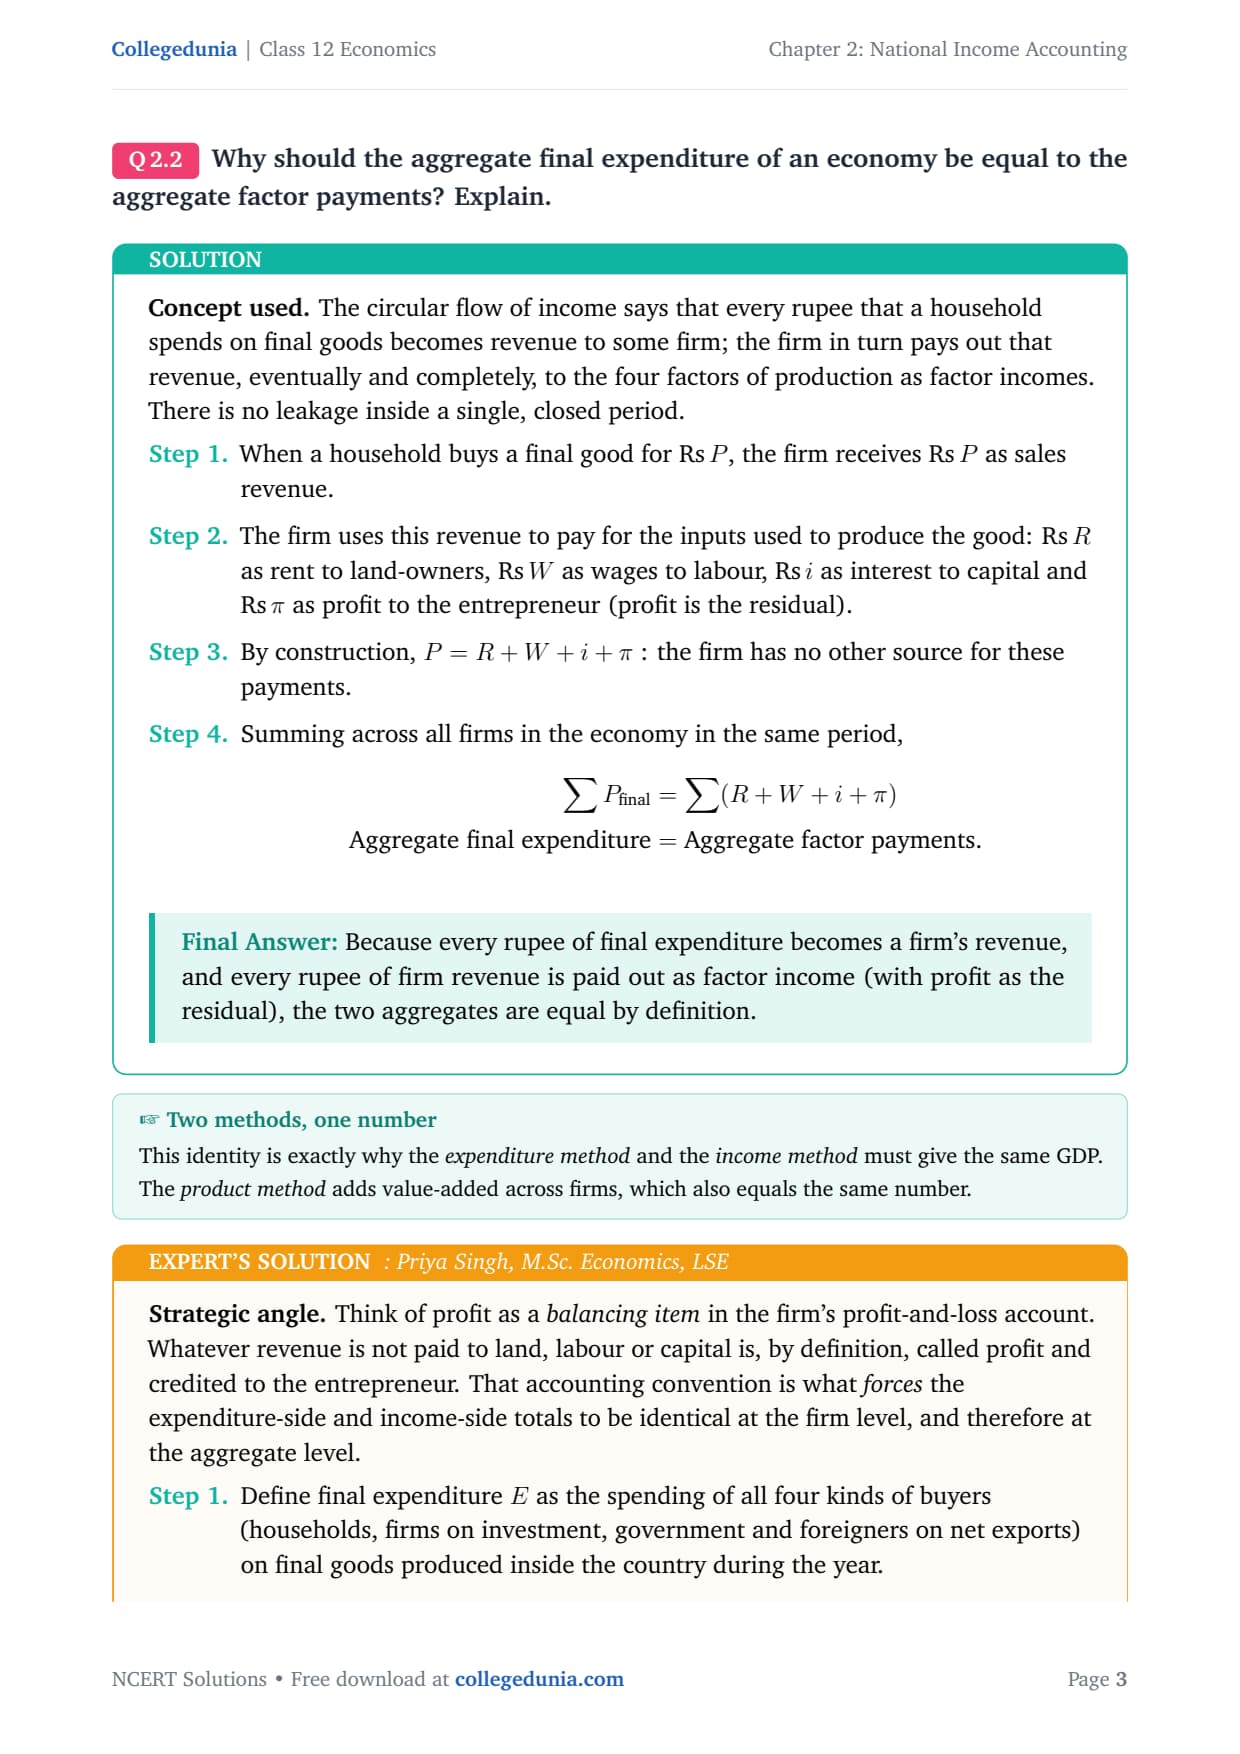
Q 1.2
Why should the aggregate final expenditure of an economy be
equal to the aggregate factor payments? Explain.
Concept used. The circular flow of income says that every
rupee that a household spends on final goods becomes revenue to some
firm; the firm in turn pays out that revenue, eventually and
completely, to the four factors of production as factor incomes.
There is no leakage inside a single, closed period.
When a household buys a final good for P, the firm
receives P as sales revenue.
The firm uses this revenue to pay for the inputs used to
produce the good: R as rent to land-owners,
W as wages to labour, i as interest to capital
and π as profit to the entrepreneur (profit is the
residual).
By construction, P = R + W + i + π : the firm has no
other source for these payments.
Summing across all firms in the economy in the same period,
aligned
∑ Pfinal &= ∑ (R + W + i + π)
Aggregate final expenditure &= Aggregate
factor payments.
aligned
Because every rupee of final expenditure becomes a firm's
revenue, and every rupee of firm revenue is paid out as factor
income (with profit as the residual), the two aggregates are equal
by definition.
PS
Priya Singh
M.Sc. Economics, LSE
Verified Expert
Strategic angle. Think of profit as a balancing item
in the firm's profit-and-loss account. Whatever revenue is not paid
to land, labour or capital is, by definition, called profit and
credited to the entrepreneur. That accounting convention is what
forces the expenditure-side and income-side totals to be
identical at the firm level, and therefore at the aggregate level.
Define final expenditure E as the spending of all four
kinds of buyers (households, firms on investment, government
and foreigners on net exports) on final goods produced
inside the country during the year.
Define factor payments Y as R + W + i + π, the sum of
rent, wage, interest and profit paid out by the producing
firms.
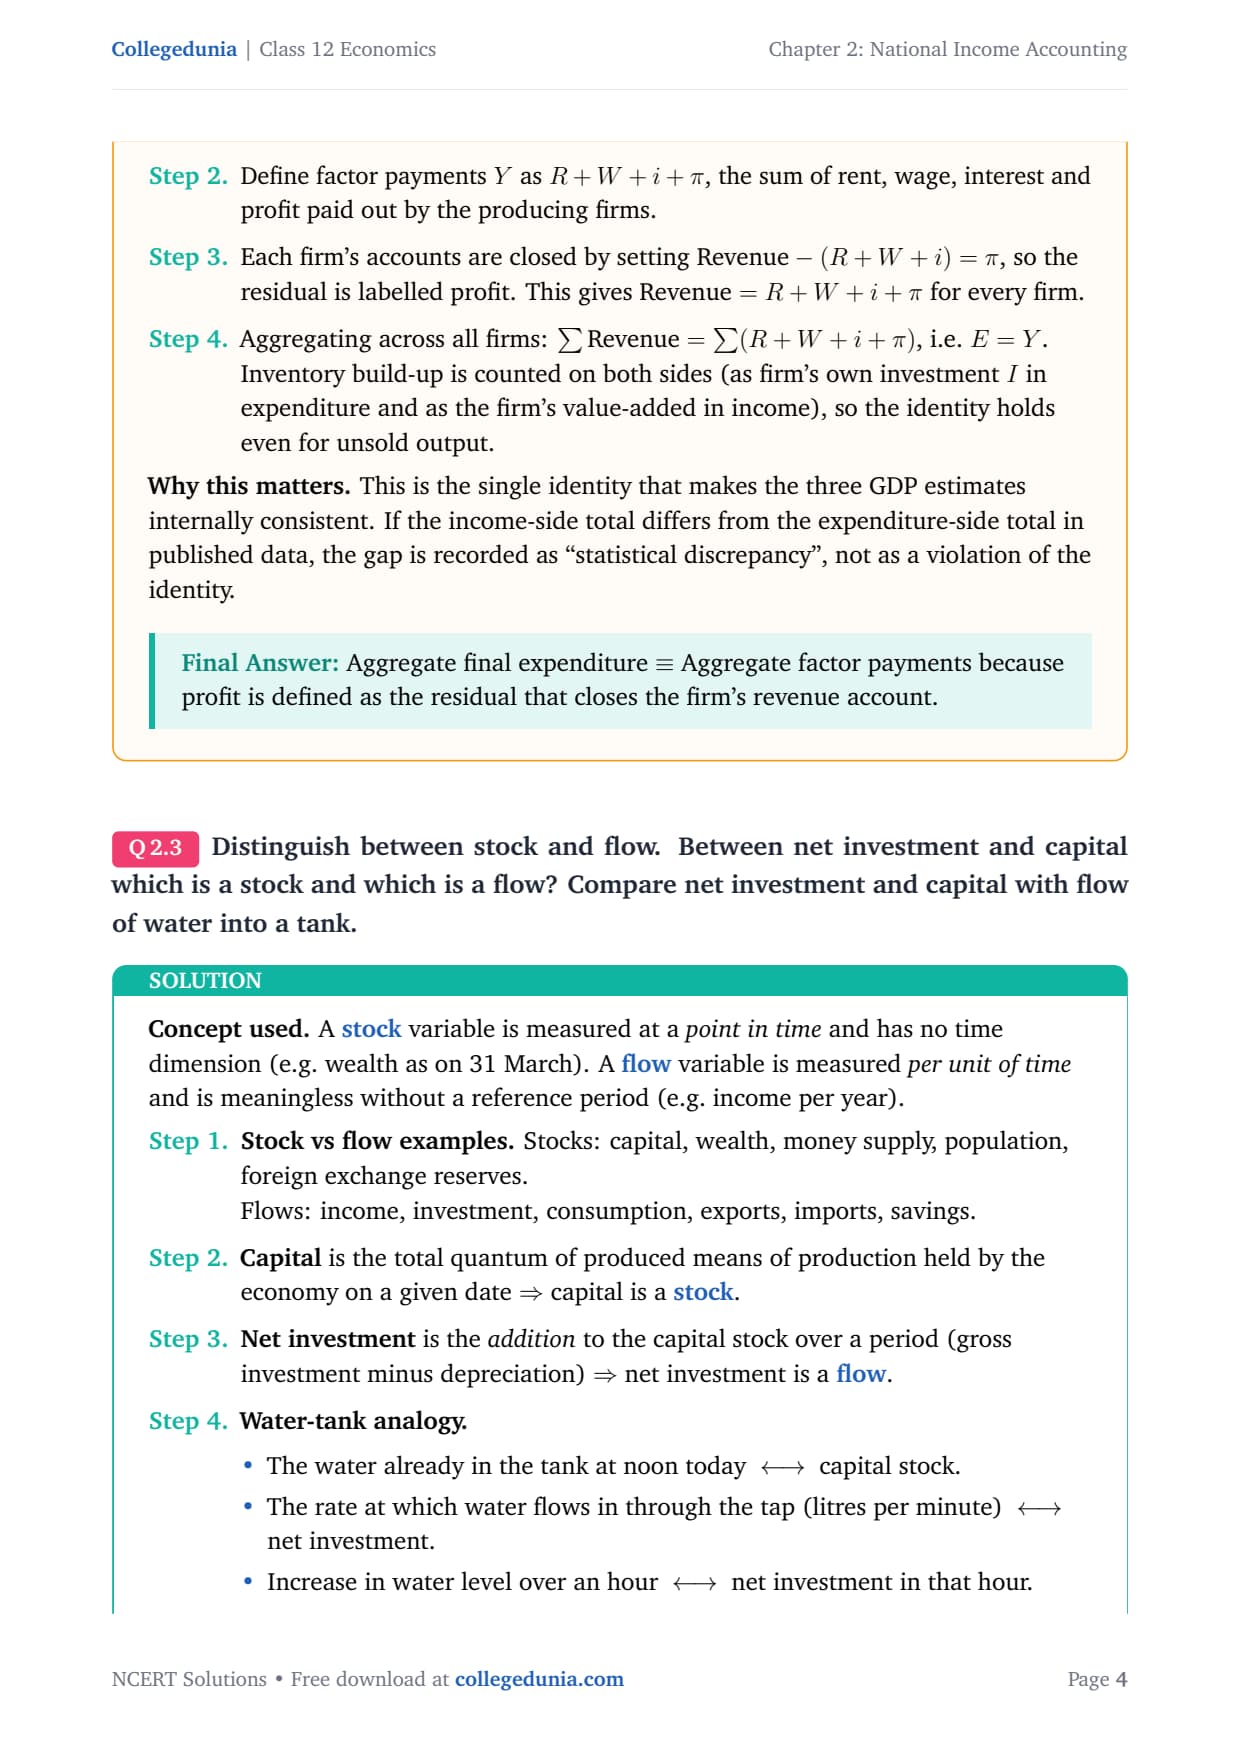
Each firm's accounts are closed by setting
Revenue - (R + W + i) = π, so the residual is
labelled profit. This gives
Revenue = R + W + i + π for every firm.
Aggregating across all firms: ∑ Revenue =
∑ (R + W + i + π), i.e. E = Y. Inventory build-up
is counted on both sides (as firm's own investment I in
expenditure and as the firm's value-added in income), so
the identity holds even for unsold output.
Why this matters. This is the single identity that makes
the three GDP estimates internally consistent. If the income-side
total differs from the expenditure-side total in published data,
the gap is recorded as ``statistical discrepancy'', not as a
violation of the identity.
Aggregate final expenditure ≡ Aggregate factor
payments because profit is defined as the residual that closes the
firm's revenue account.
Q 1.3
Distinguish between stock and flow. Between net investment
and capital which is a stock and which is a flow? Compare net
investment and capital with flow of water into a tank.
Concept used. A stock variable is measured at a
point in time and has no time dimension (e.g. wealth as on
31 March). A flow variable is measured per unit of
time and is meaningless without a reference period (e.g. income
per year).
Capital is the total quantum of produced means of
production held by the economy on a given date ⇒
capital is a stock.
Net investment is the addition to the
capital stock over a period (gross investment minus
depreciation) ⇒ net investment is a
flow.
Water-tank analogy.
The water already in the tank at noon today
capital stock.
The rate at which water flows in through the tap
(litres per minute) net
investment.
Increase in water level over an hour
net investment in that
hour.
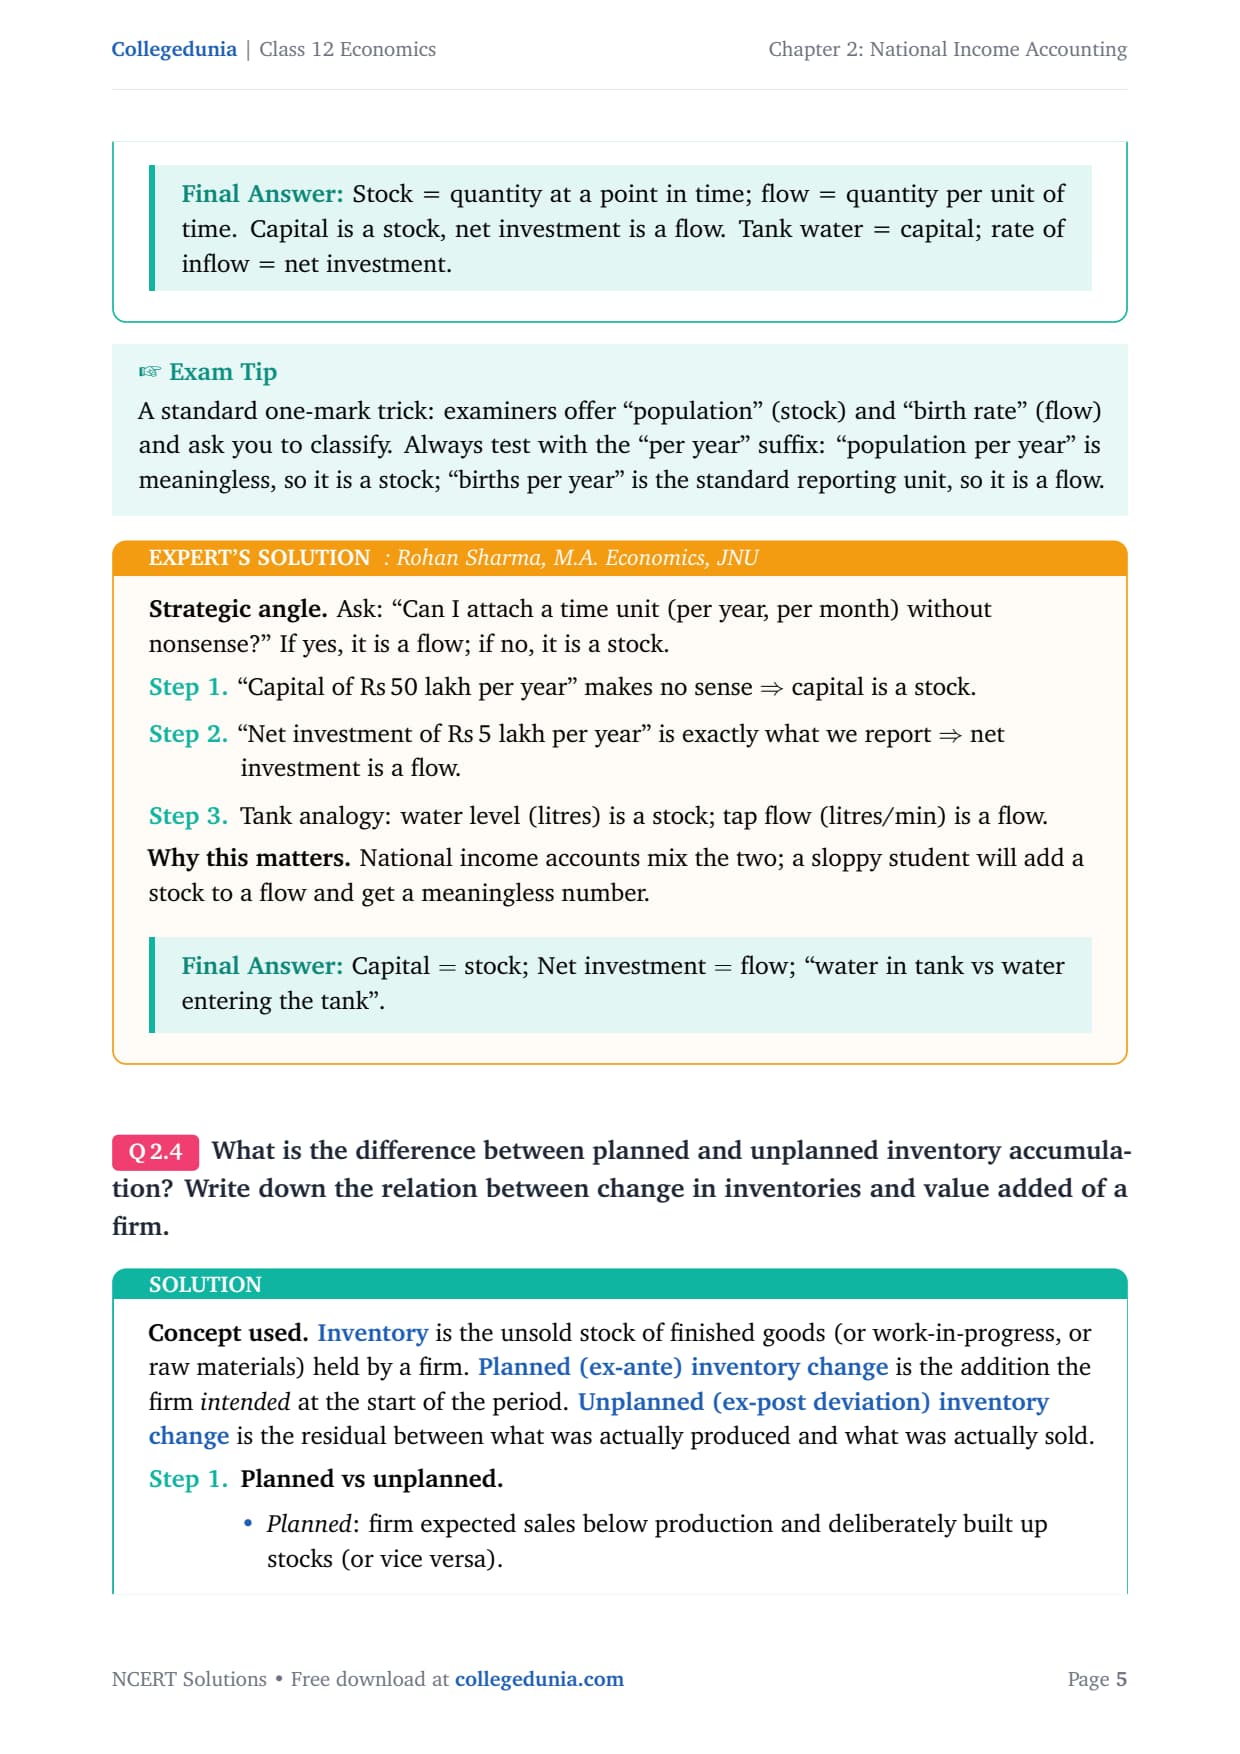
Stock = quantity at a point in time; flow = quantity per
unit of time. Capital is a stock, net investment is a flow.
Tank water = capital; rate of inflow = net investment.
RS
Rohan Sharma
M.A. Economics, JNU
Verified Expert
Strategic angle. Ask: ``Can I attach a time unit (per
year, per month) without nonsense?'' If yes, it is a flow; if no,
it is a stock.
``Capital of 50 lakh per year'' makes no sense ⇒
capital is a stock.
``Net investment of 5 lakh per year'' is exactly what we
report ⇒ net investment is a flow.
Tank analogy: water level (litres) is a stock; tap flow
(litres/min) is a flow.
Why this matters. National income accounts mix the two; a
sloppy student will add a stock to a flow and get a meaningless
number.
Capital = stock; Net investment = flow; ``water in
tank vs water entering the tank''.
Q 1.4
What is the difference between planned and unplanned
inventory accumulation? Write down the relation between change in
inventories and value added of a firm.
Concept used.Inventory is the unsold stock of
finished goods (or work-in-progress, or raw materials) held by a
firm. Planned (ex-ante) inventory change is the addition
the firm intended at the start of the period.
Unplanned (ex-post deviation) inventory change is the residual
between what was actually produced and what was actually sold.
Planned vs unplanned.
Planned: firm expected sales below production
and deliberately built up stocks (or vice versa).
Unplanned: actual sales differed from
expected sales, so the inventory change deviated
from the planned level.
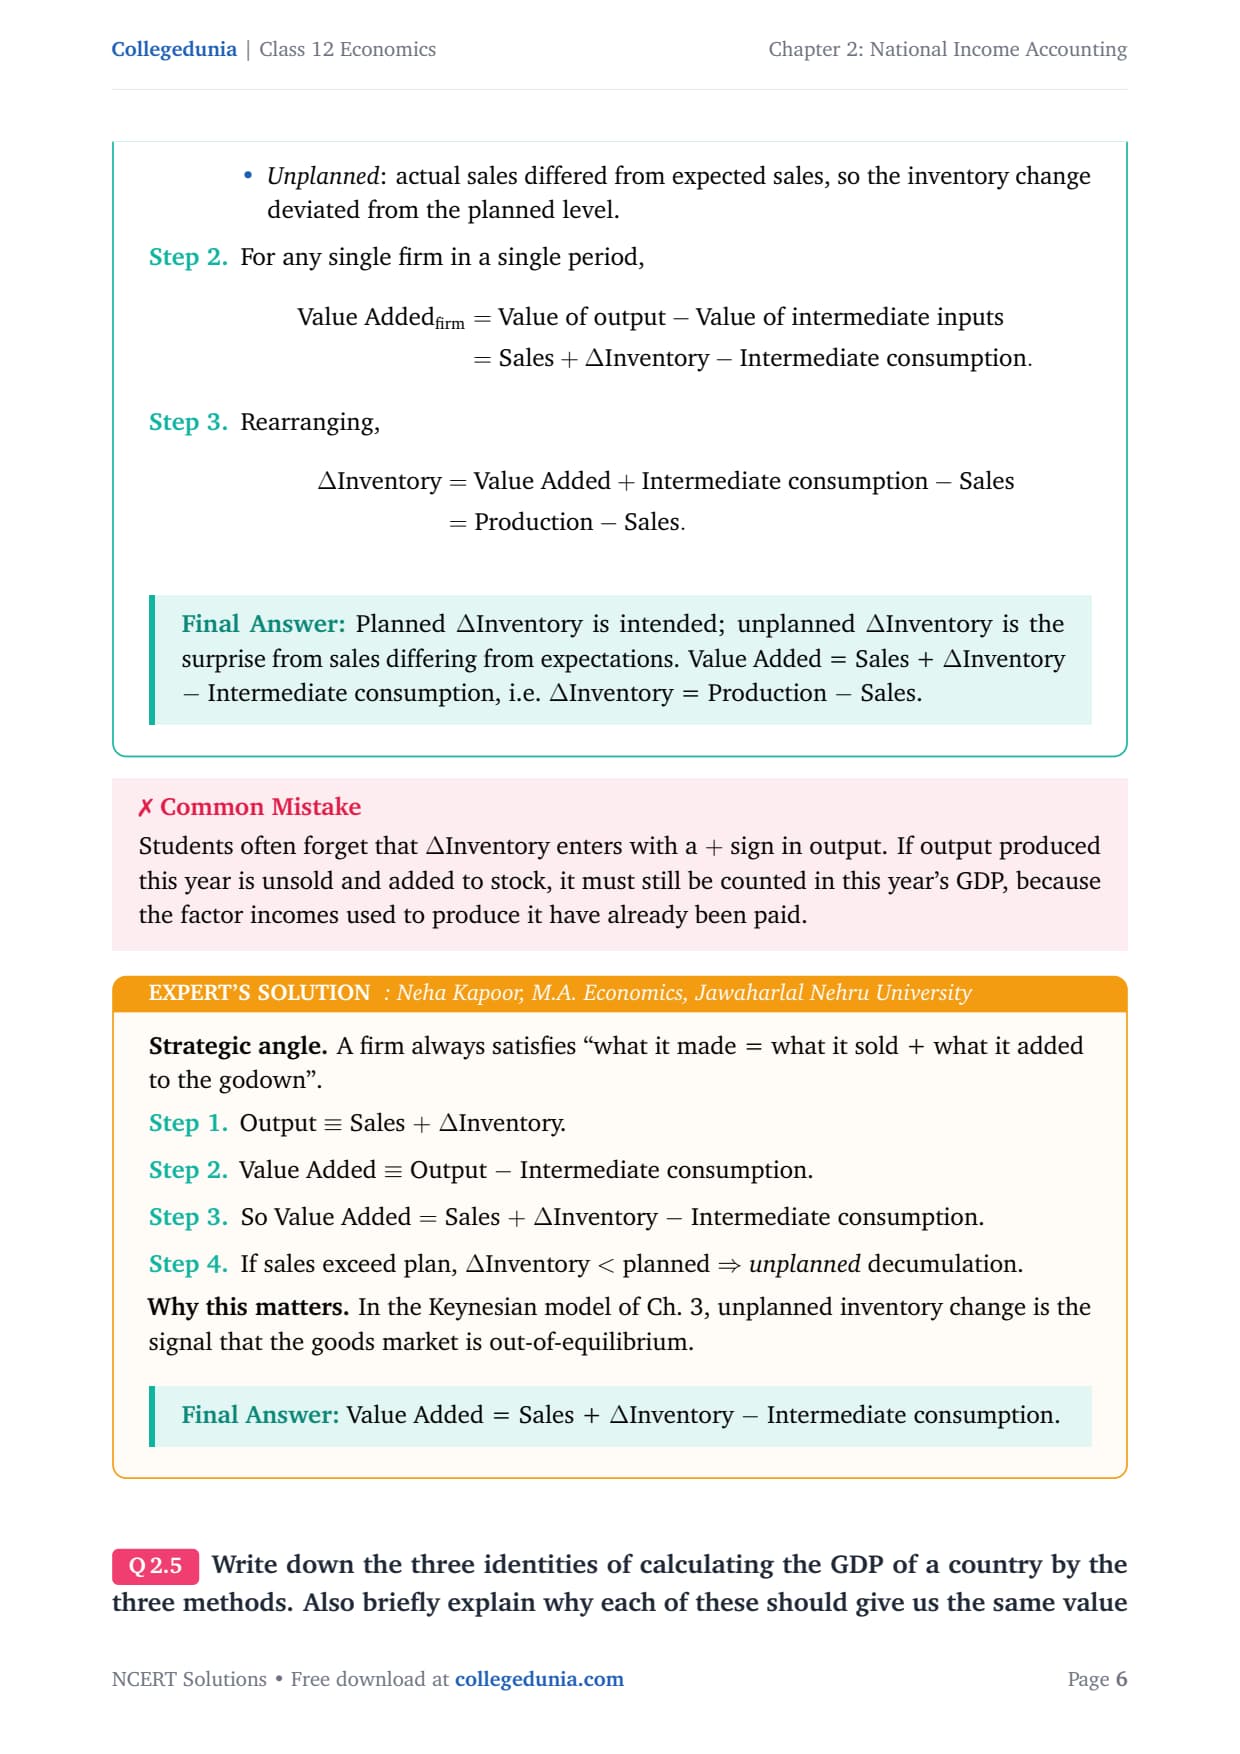
For any single firm in a single period,
aligned
Value Addedfirm
&= Value of output - Value of intermediate
inputs
&= Sales + -
Intermediate consumption.
aligned
Rearranging,
aligned
&= Value Added + Intermediate consumption
- Sales
&= Production - Sales.
aligned
Planned ΔInventory is intended; unplanned
ΔInventory is the surprise from sales differing from
expectations. Value Added = Sales + ΔInventory -
Intermediate consumption, i.e. ΔInventory =
Production - Sales.
NK
Neha Kapoor
M.A. Economics, Jawaharlal Nehru University
Verified Expert
Strategic angle. A firm always satisfies
``what it made = what it sold + what it added to the godown''.
Output ≡ Sales +ΔInventory.
Value Added ≡ Output - Intermediate consumption.
So Value Added = Sales +ΔInventory -
Intermediate consumption.
If sales exceed plan, ΔInventory < planned
⇒unplanned decumulation.
Why this matters. In the Keynesian model of Ch. 3, unplanned
inventory change is the signal that the goods market is
out-of-equilibrium.
Value Added = Sales + ΔInventory - Intermediate
consumption.
Q 1.5
Write down the three identities of calculating the GDP of
a country by the three methods. Also briefly explain why each of
these should give us the same value of GDP.
Concept used. GDP is the market value of all final goods
and services produced inside a country in a year. It can be measured
in three operationally distinct ways, which must give the same
number because each is a re-arrangement of the same circular-flow
identity.
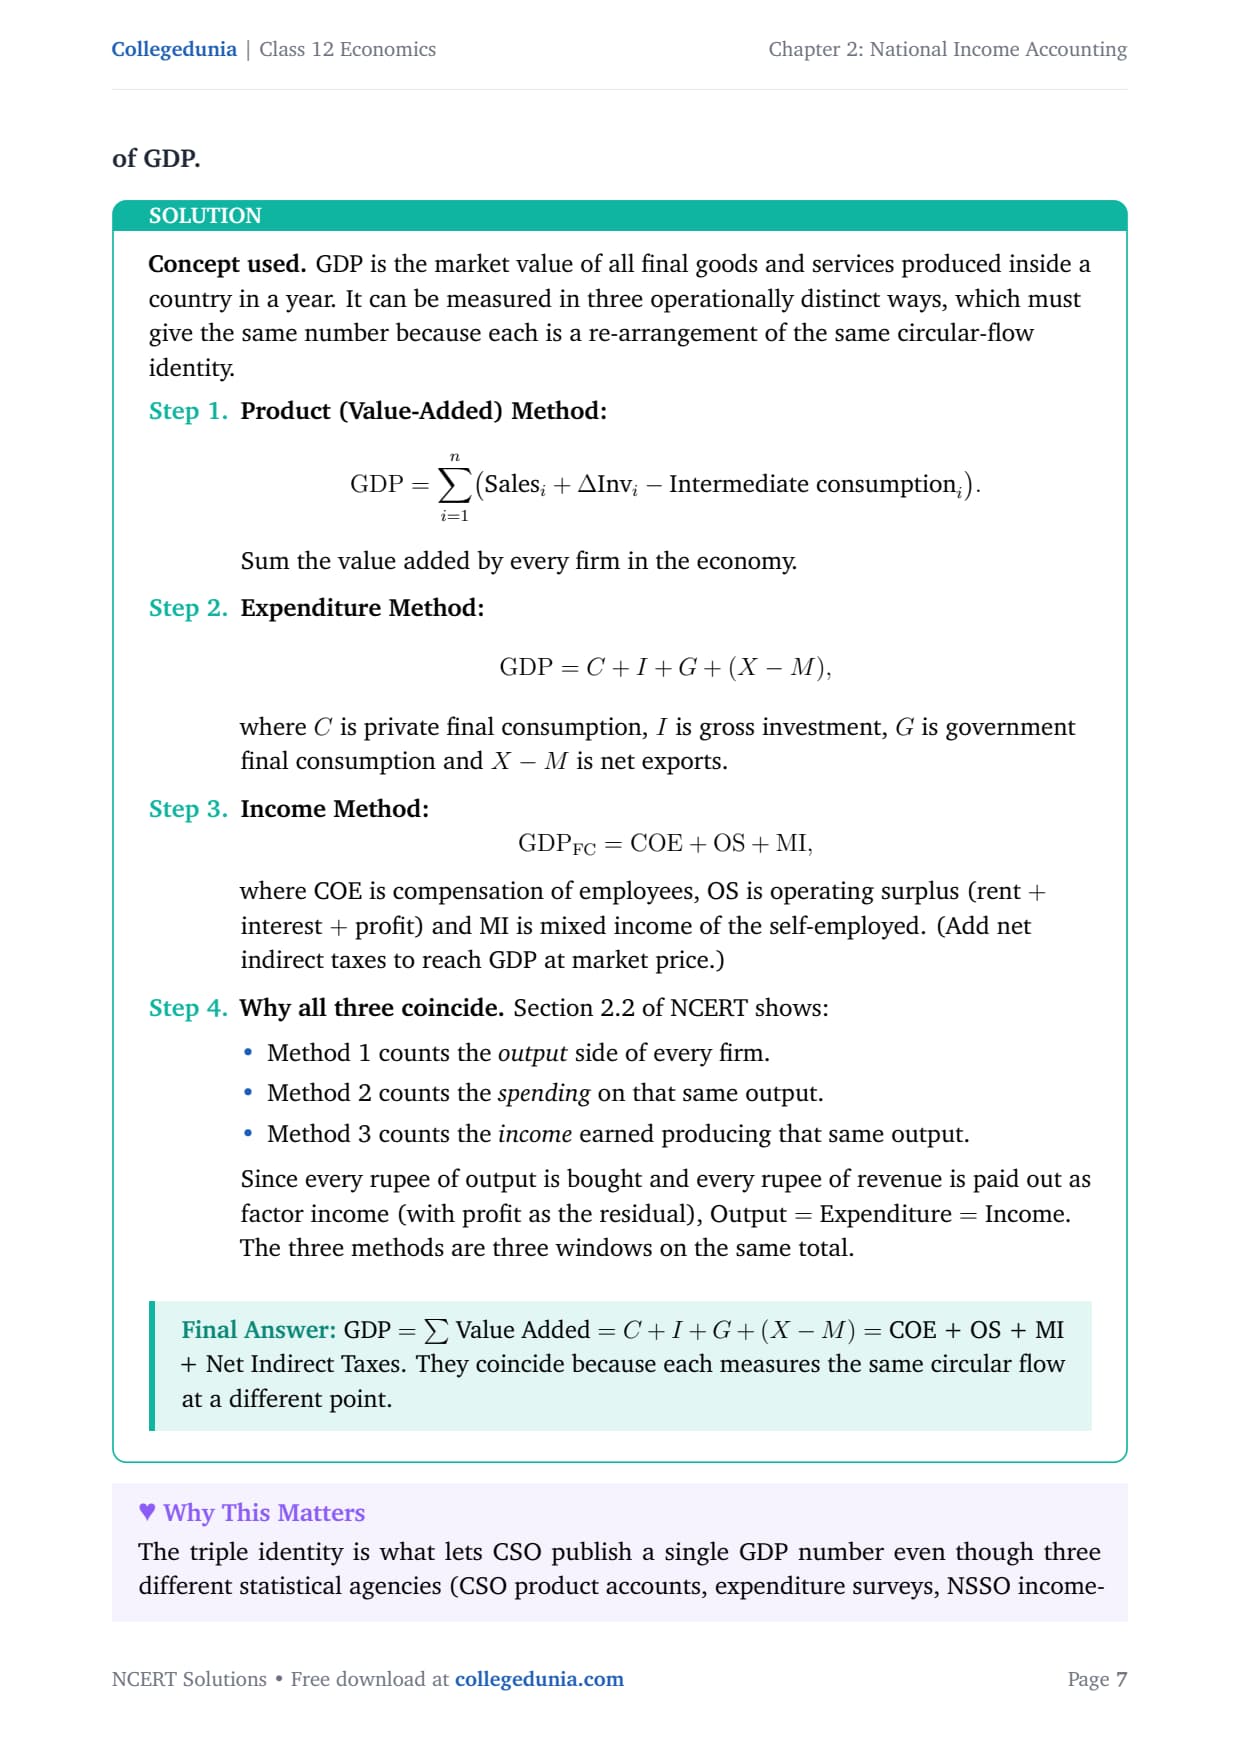
Product (Value-Added) Method:
GDP = i=1n
(Salesi + i
- Intermediate consumptioni).
Sum the value added by every firm in the economy.
Expenditure Method:
GDP = C + I + G + (X - M),
where C is private final consumption, I is gross
investment, G is government final consumption and
X-M is net exports.
Income Method:
GDPFC = COE + OS +
MI,
where COE is compensation of employees, OS is operating
surplus (rent + interest + profit) and MI is mixed
income of the self-employed. (Add net indirect taxes to
reach GDP at market price.)
Why all three coincide. Section 2.2 of NCERT shows:
Method 1 counts the output side of every
firm.
Method 2 counts the spending on that same
output.
Method 3 counts the income earned producing
that same output.
Since every rupee of output is bought and every rupee of
revenue is paid out as factor income (with profit as the
residual), Output = Expenditure = Income. The three
methods are three windows on the same total.
GDP =∑ Value Added =C+I+G+(X-M)= COE +
OS + MI + Net Indirect Taxes. They coincide because each measures
the same circular flow at a different point.
KM
Karan Mehta
M.A. Economics, Madras School of Economics
Verified Expert
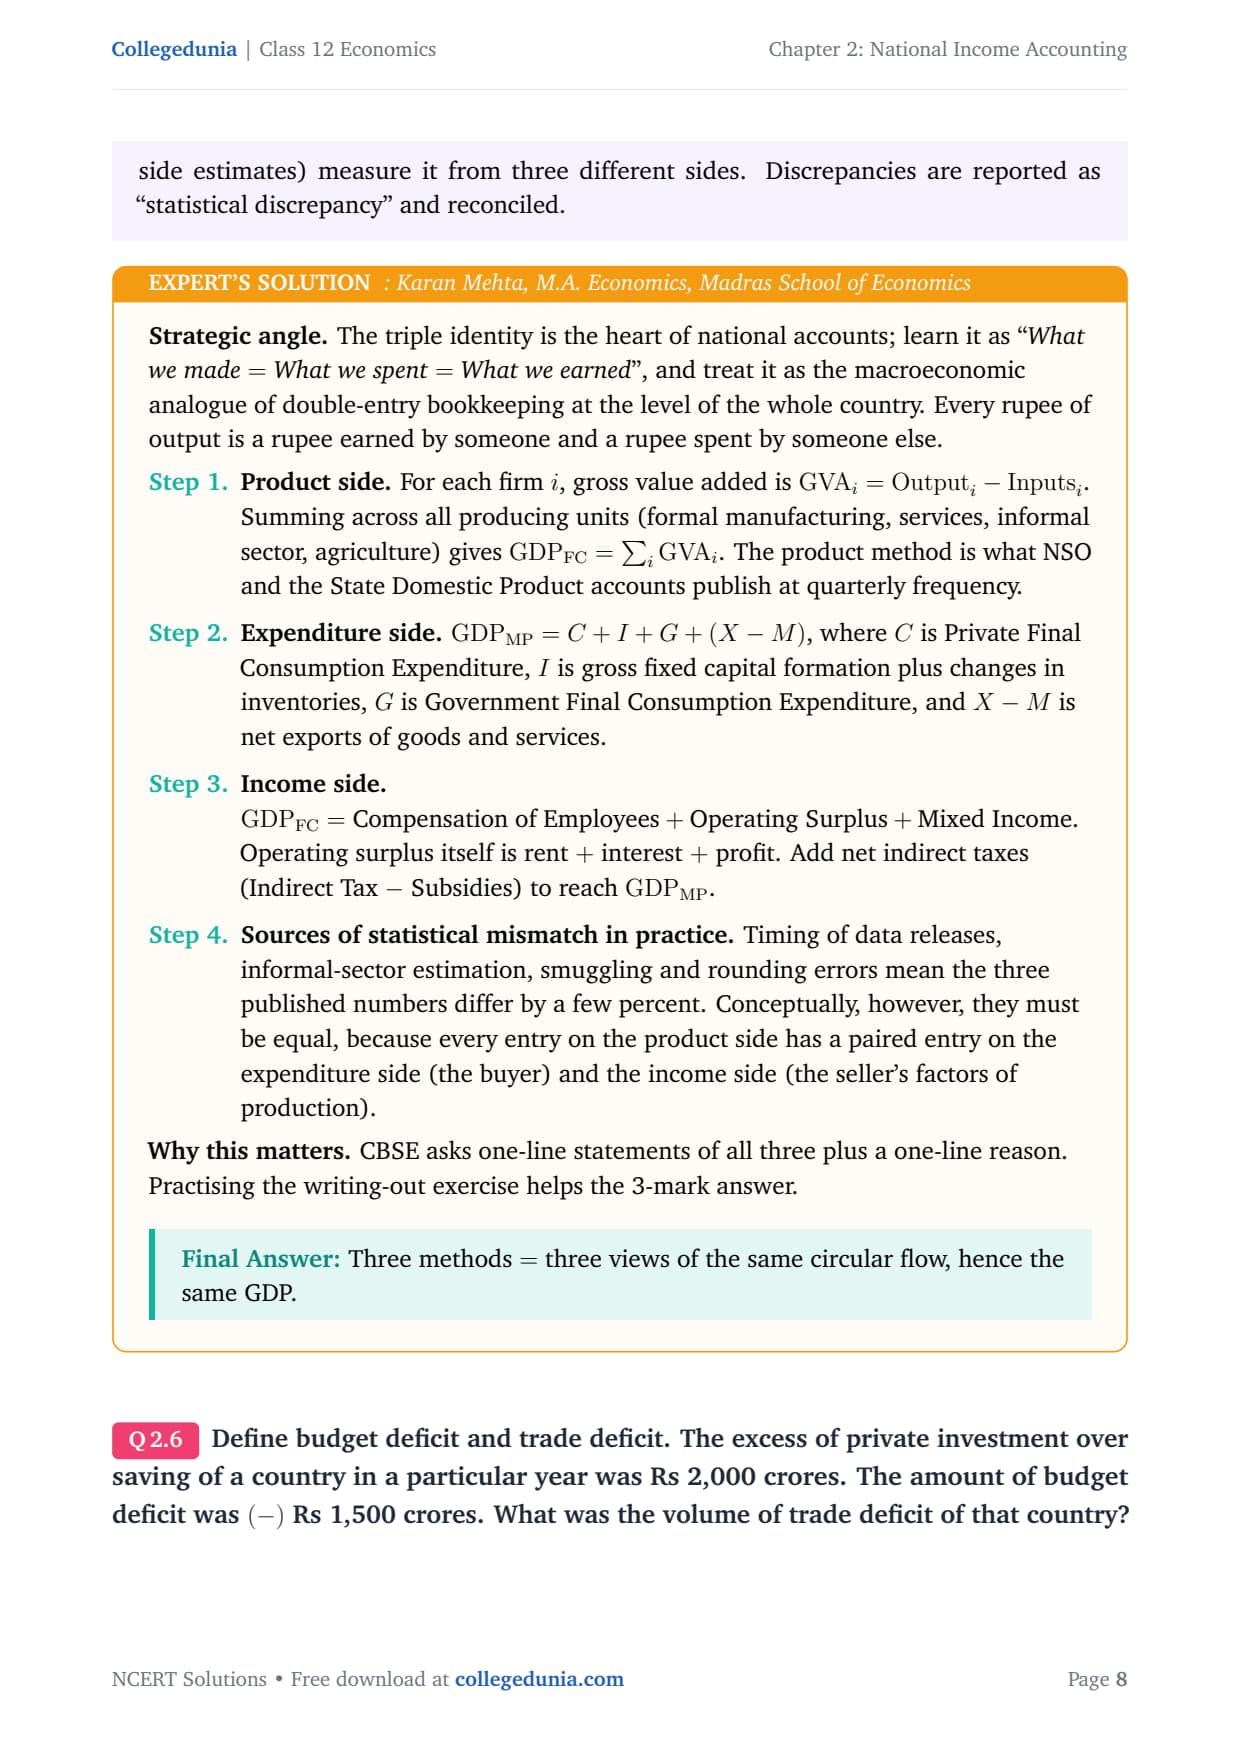
Strategic angle. The triple identity is the heart of
national accounts; learn it as ``What we made = What we
spent = What we earned'', and treat it as the macroeconomic
analogue of double-entry bookkeeping at the level of the whole
country. Every rupee of output is a rupee earned by someone and
a rupee spent by someone else.
Product side. For each firm i, gross value added
is GVAi = Outputi - Inputsi.
Summing across all producing units (formal manufacturing,
services, informal sector, agriculture) gives
GDPFC = i GVAi. The product
method is what NSO and the State Domestic Product accounts
publish at quarterly frequency.
Expenditure side.GDPMP = C + I + G + (X - M), where C is
Private Final Consumption Expenditure, I is gross fixed
capital formation plus changes in inventories, G is
Government Final Consumption Expenditure, and X - M is
net exports of goods and services.
Income side.GDPFC = Compensation of Employees +
Operating Surplus + Mixed Income. Operating
surplus itself is rent + interest + profit. Add net
indirect taxes (Indirect Tax - Subsidies) to reach
GDPMP.
Sources of statistical mismatch in practice. Timing
of data releases, informal-sector estimation, smuggling and
rounding errors mean the three published numbers differ by
a few percent. Conceptually, however, they must be equal,
because every entry on the product side has a paired entry
on the expenditure side (the buyer) and the income side
(the seller's factors of production).
Why this matters. CBSE asks one-line statements of all
three plus a one-line reason. Practising the writing-out exercise
helps the 3-mark answer.
Three methods = three views of the same circular flow,
hence the same GDP.
Q 1.6
Define budget deficit and trade deficit. The excess of
private investment over saving of a country in a particular year was
Rs 2,000 crores. The amount of budget deficit was (-) Rs 1,500
crores. What was the volume of trade deficit of that country?
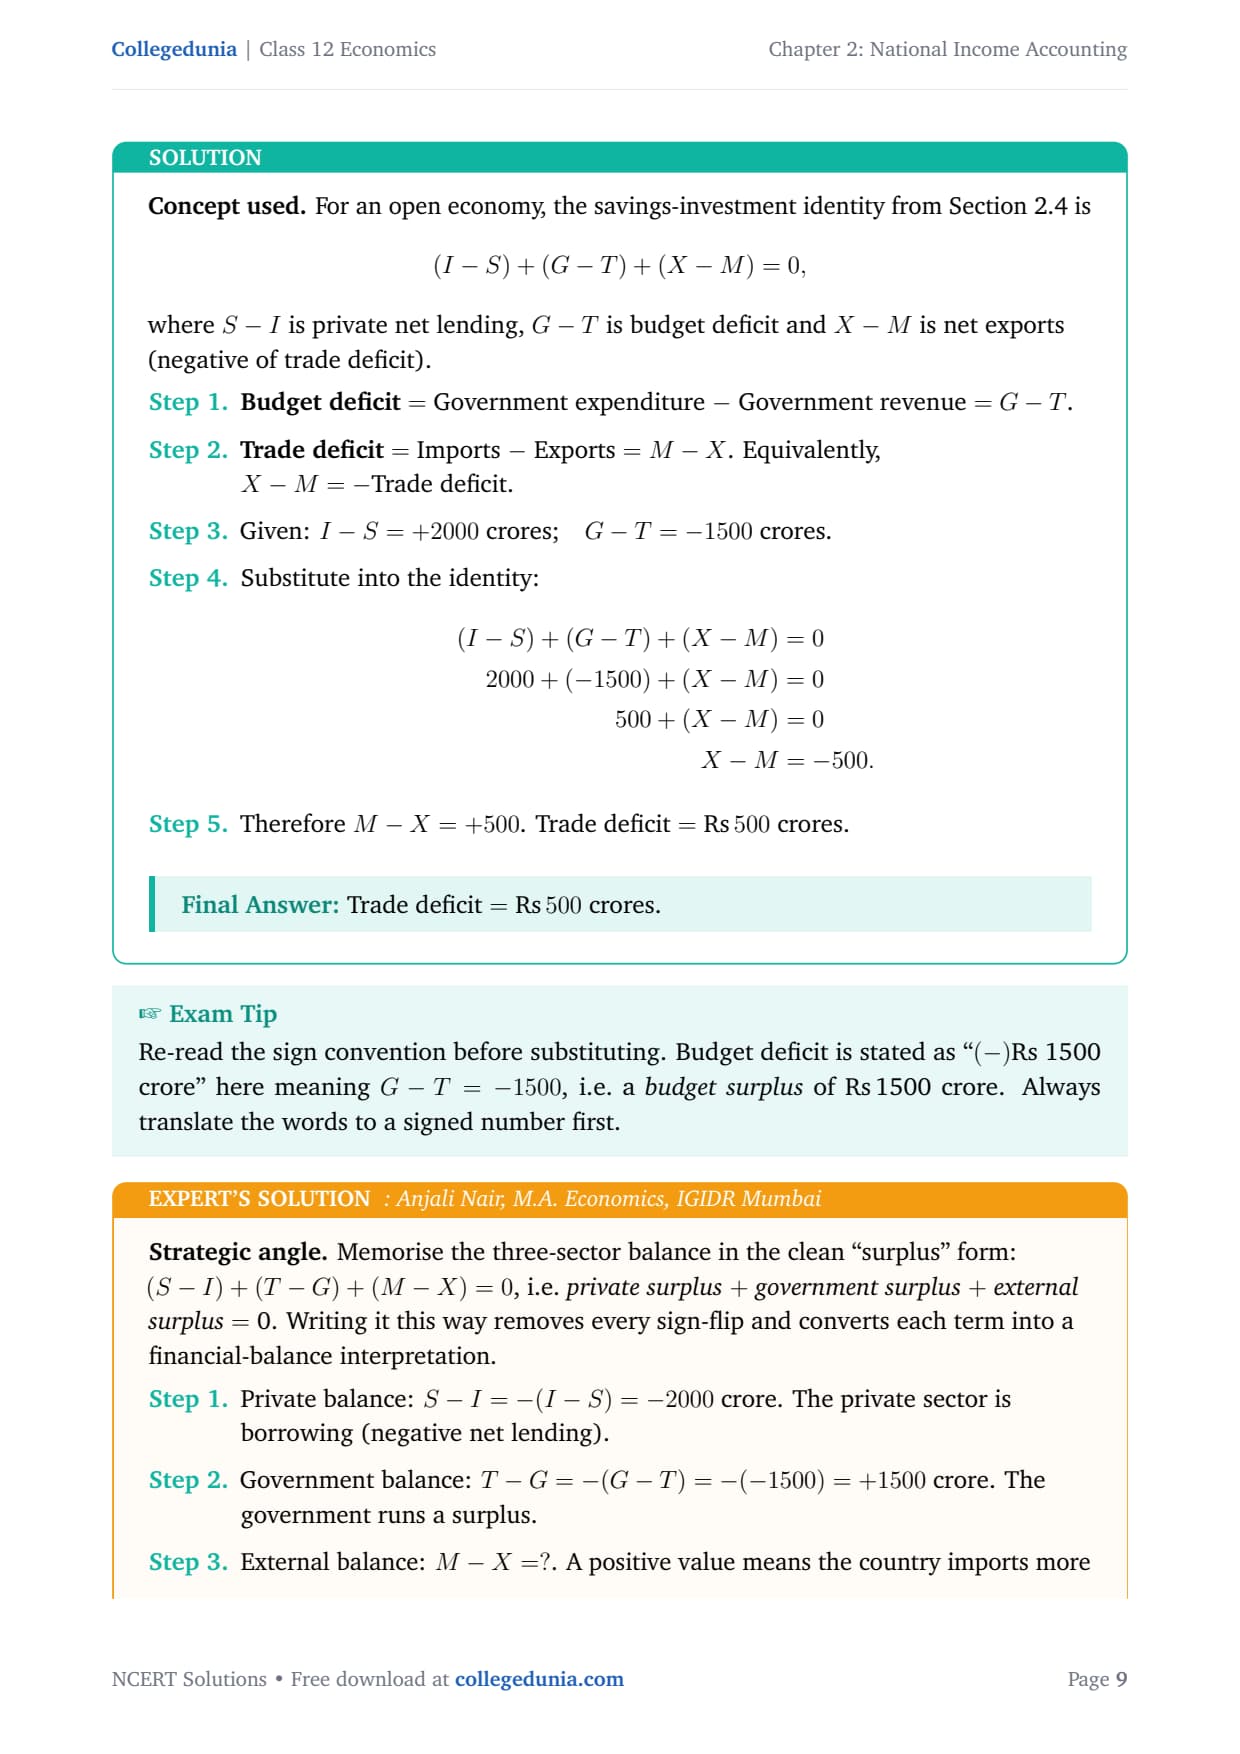
Concept used. For an open economy, the savings-investment
identity from Section 2.4 is
(I - S) + (G - T) + (X - M) = 0,
where S - I is private net lending, G - T is budget deficit and
X - M is net exports (negative of trade deficit).
Budget deficit= Government expenditure -
Government revenue = G - T.
Trade deficit= Imports - Exports = M - X.
Equivalently, X - M = -Trade deficit.
Given: I - S = +2000 crores; G - T = -1500 crores.
Substitute into the identity:
aligned
(I - S) + (G - T) + (X - M) &= 0
2000 + (-1500) + (X - M) &= 0
500 + (X - M) &= 0 X - M &= -500.
aligned
Therefore M - X = +500. Trade deficit = 500 crores.
Trade deficit = 500 crores.
AN
Anjali Nair
M.A. Economics, IGIDR Mumbai
Verified Expert
Strategic angle. Memorise the three-sector balance in the
clean ``surplus'' form: (S - I) + (T - G) + (M - X) = 0, i.e.
private surplus+government surplus+external surplus= 0. Writing it this way removes every
sign-flip and converts each term into a financial-balance
interpretation.
Private balance: S - I = -(I - S) = -2000 crore. The
private sector is borrowing (negative net lending).
Government balance: T - G = -(G - T) = -(-1500) = +1500
crore. The government runs a surplus.
External balance: M - X = ?. A positive value means the
country imports more than it exports, i.e. it borrows from
the rest of the world.
Interpret: the rest of the world is financing 500 crore
of the private-sector borrowing that the government surplus
could not cover.
Why this matters. The identity tells you that domestic
imbalances must be financed by, or financed for, the rest of the
world. It is the conceptual bridge between this chapter and the
open-economy chapter on Balance of Payments.
Trade deficit = 500 crores.
Q 1.7
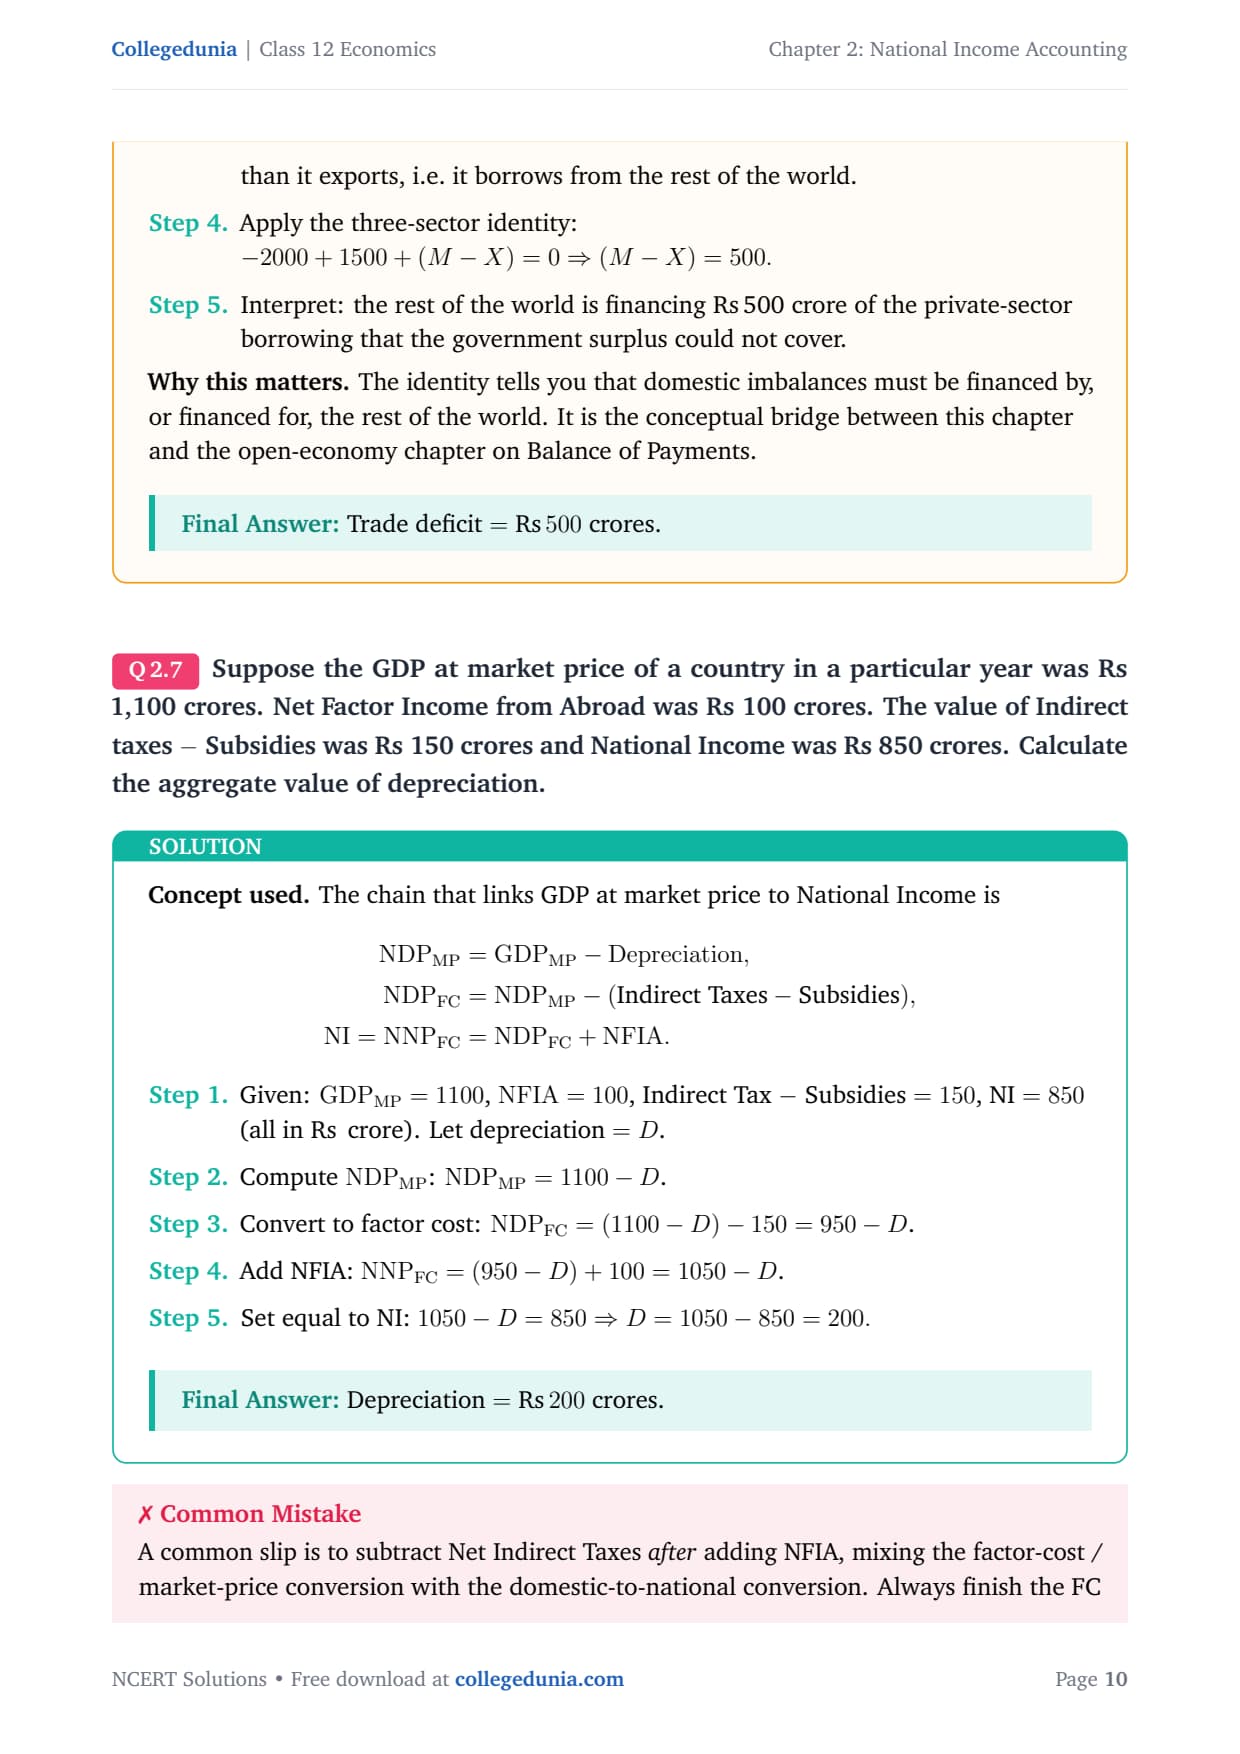
Suppose the GDP at market price of a country in a
particular year was Rs 1,100 crores. Net Factor Income from Abroad
was Rs 100 crores. The value of Indirect taxes - Subsidies was
Rs 150 crores and National Income was Rs 850 crores. Calculate the
aggregate value of depreciation.
Concept used. The chain that links GDP at market price to
National Income is
aligned
NDPMP &= GDPMP - Depreciation,
NDPFC &= NDPMP - (Indirect Taxes
- Subsidies),
NI = NNPFC &= NDPFC +
NFIA.
aligned
Given: GDPMP = 1100, NFIA = 100,
Indirect Tax - Subsidies = 150, NI = 850 (all in
crore). Let depreciation = D.
Compute NDPMP: NDPMP = 1100 - D.
Convert to factor cost:
NDPFC = (1100 - D) - 150 = 950 - D.
Add NFIA: NNPFC = (950 - D) + 100 = 1050 - D.
Set equal to NI: 1050 - D = 850 ⇒ D = 1050 - 850
= 200.
Depreciation = 200 crores.
VP
Vikram Patel
M.A. Economics, Gokhale Institute Pune
Verified Expert
Strategic angle. Always reduce these problems to
``GDPMP→ NDPFC→ NI'' in two
explicit subtractions and one addition.
NDPMP= GDPMP- Depreciation
= 1100 - D.
NDPFC= NDPMP- NIT =
950 - D.
NNPFC (NI) = NDPFC+
NFIA = 1050 - D.
1050 - D = 850 ⇒ D = 200.
Why this matters. The same arithmetic pattern (Mkt →
Factor cost → National) repeats in 4–5 board questions every
year.
D = 200 crores.
Q 1.8
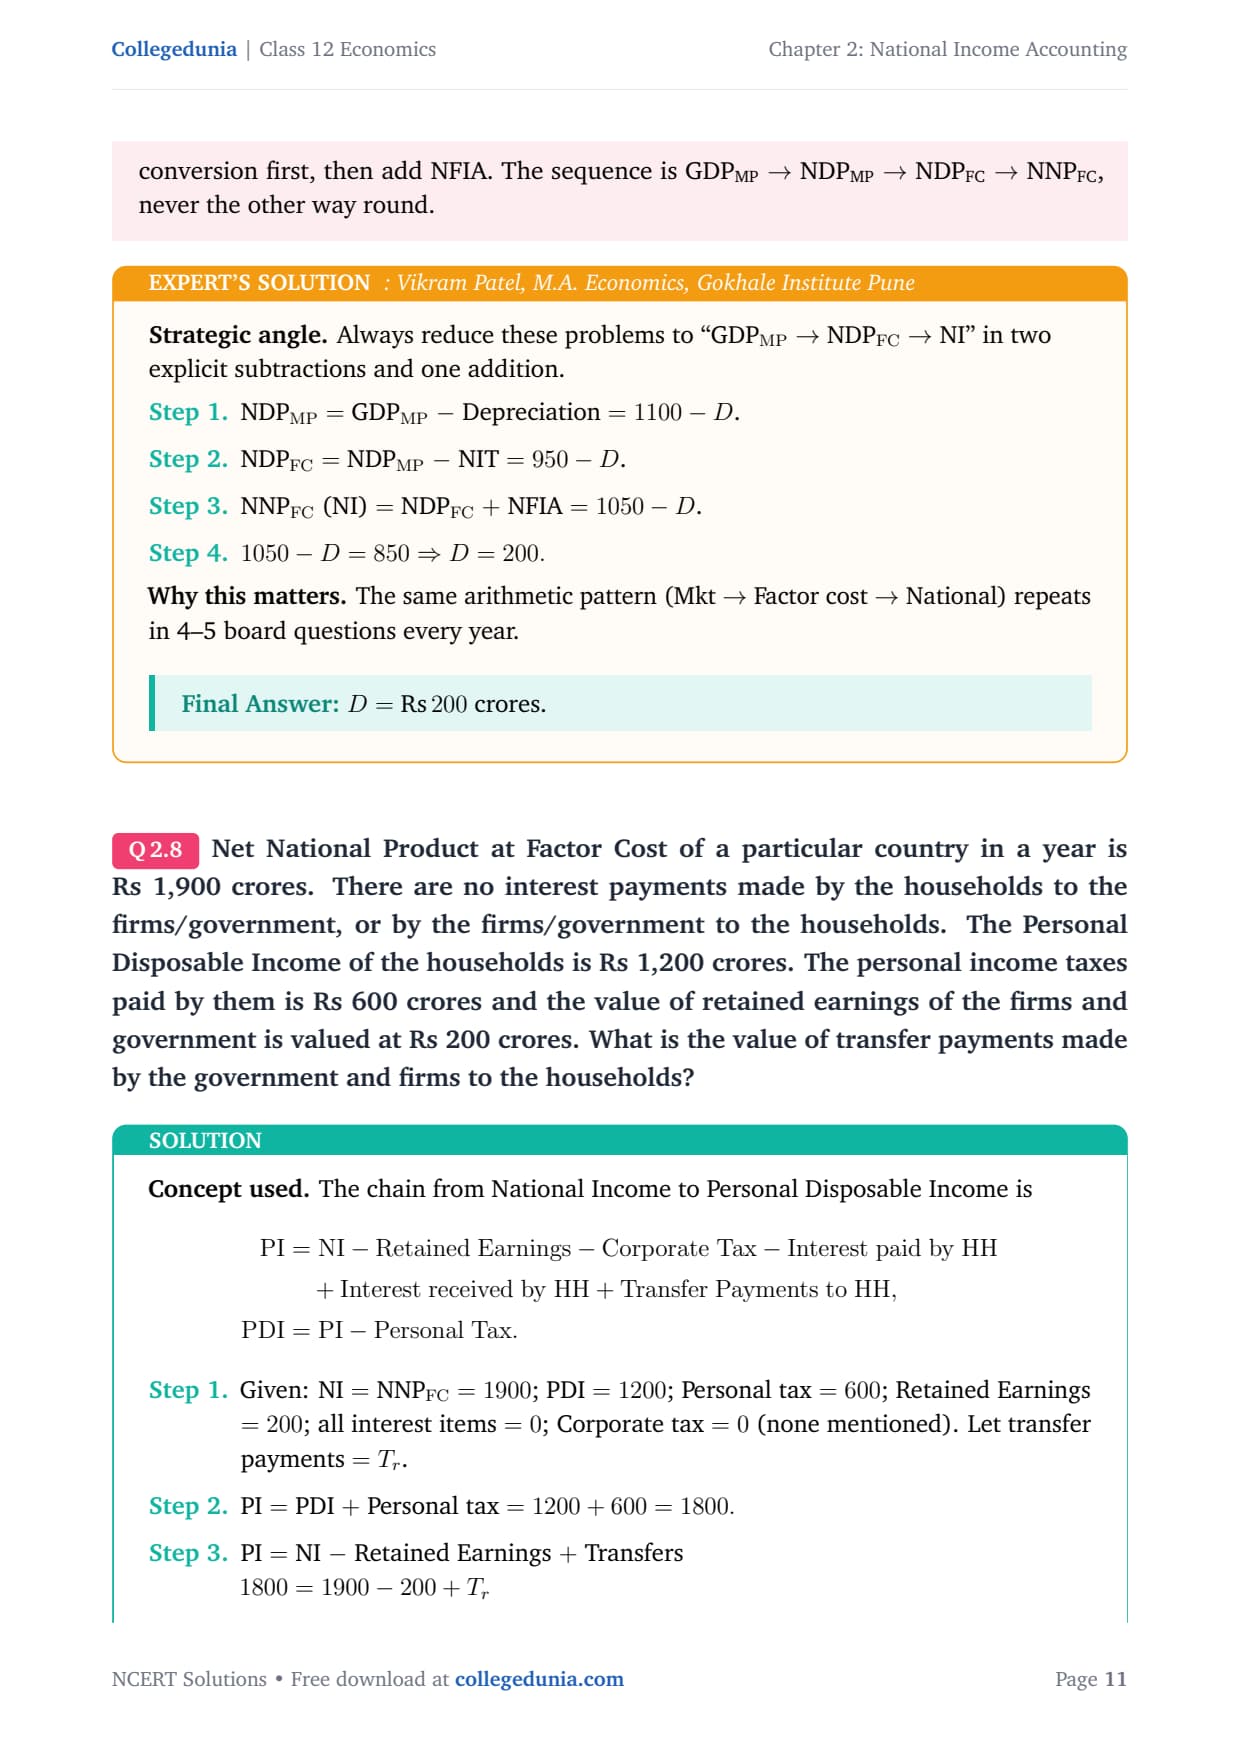
Net National Product at Factor Cost of a particular
country in a year is Rs 1,900 crores. There are no interest payments
made by the households to the firms/government, or by the
firms/government to the households. The Personal Disposable Income
of the households is Rs 1,200 crores. The personal income taxes paid
by them is Rs 600 crores and the value of retained earnings of the
firms and government is valued at Rs 200 crores. What is the value
of transfer payments made by the government and firms to the
households?
Concept used. The chain from National Income to Personal
Disposable Income is
aligned
PI &= NI - Retained Earnings
- Corporate Tax -
Interest paid by HH
& + Interest received by HH
+ Transfer Payments to HH,
PDI &= PI - Personal Tax.
aligned
Given: NI = NNPFC= 1900;
PDI = 1200; Personal tax = 600;
Retained Earnings = 200;
all interest items = 0;
Corporate tax = 0 (none mentioned).
Let transfer payments = Tr.
Strategic angle. Reduce the long chain to ``what stays
with households after every leak and injection'' and treat the
zero-interest condition as removing two terms.
PDI = PI - Personal tax ⇒ 1200 =
(1700 + Tr) - 600 ⇒ Tr = 100.
Why this matters. The PI ↔ NI chain is the
single trickiest formula in the chapter; line-by-line bookkeeping
prevents sign errors.
Transfer payments = 100 crores.
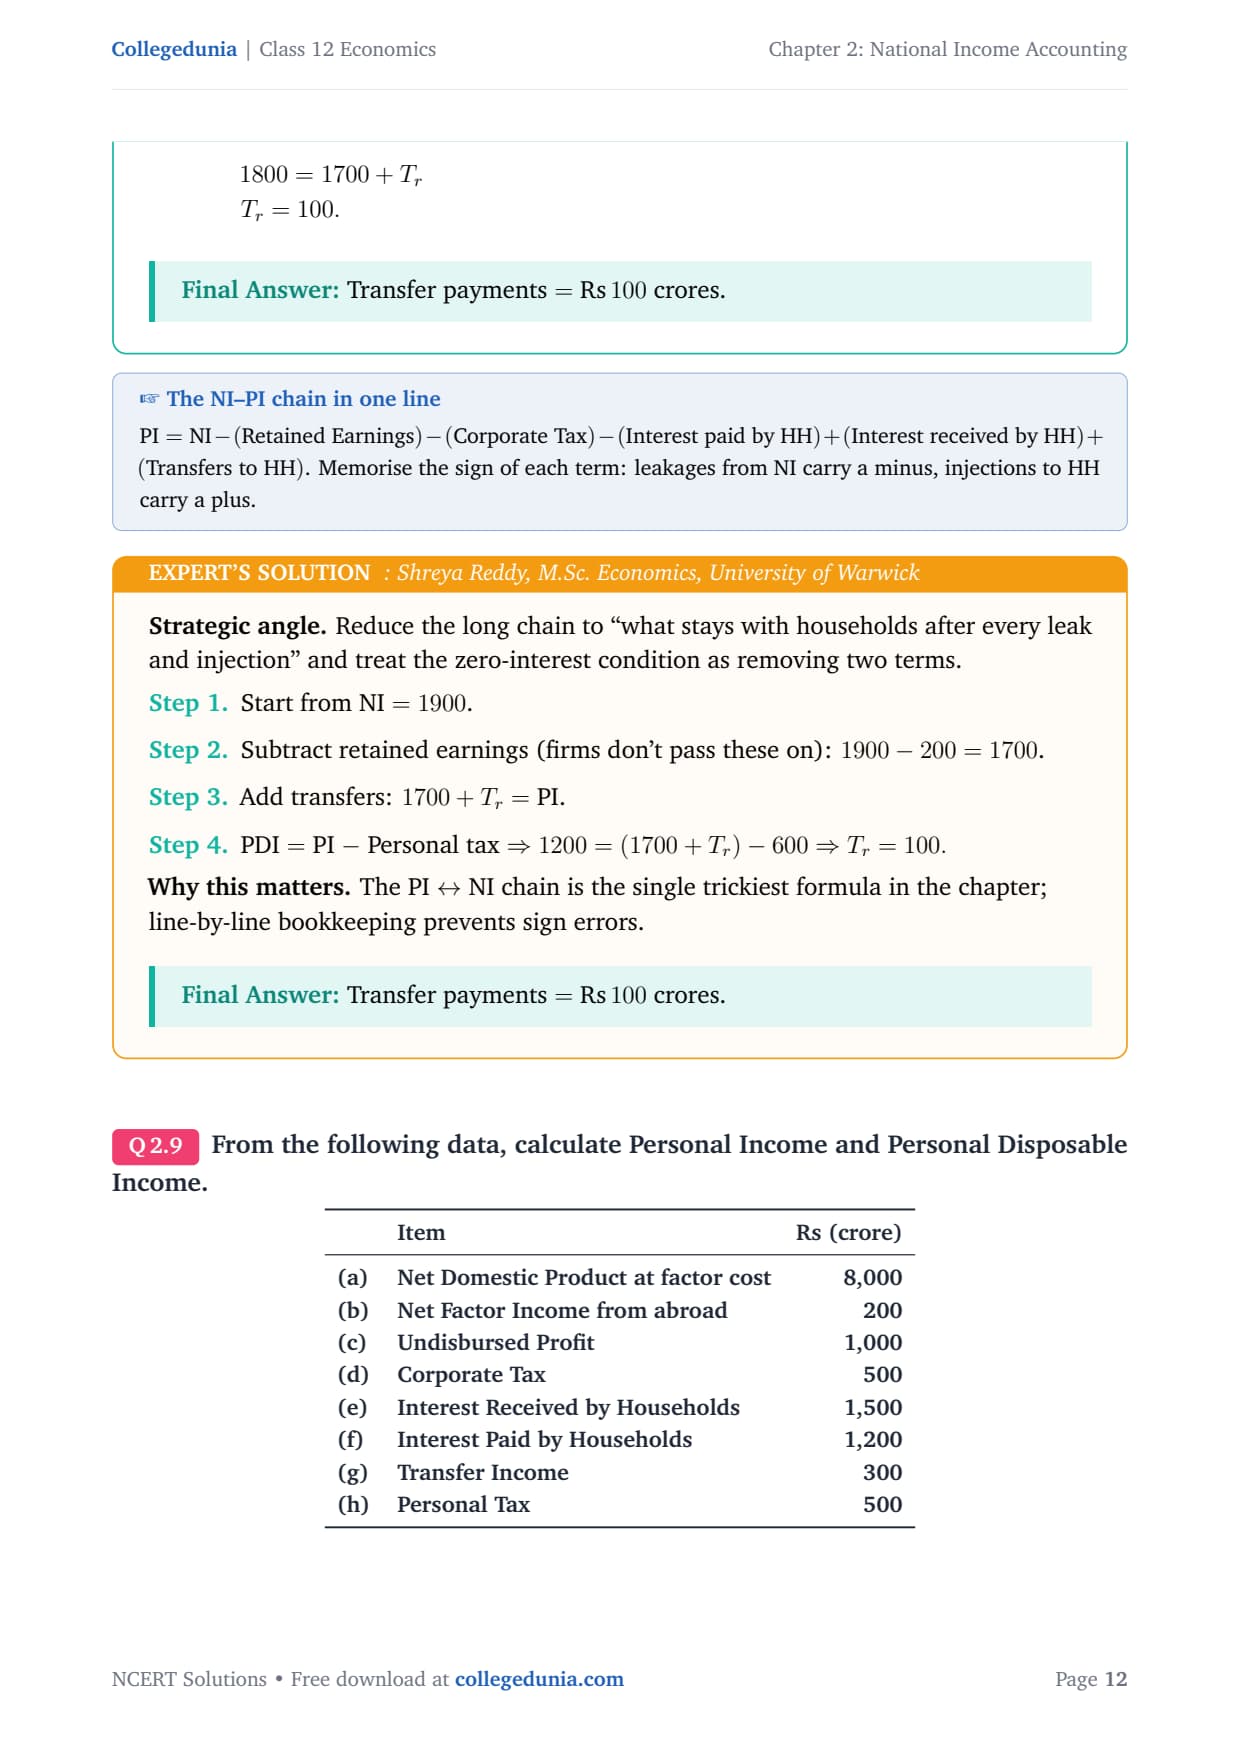
Q 1.9
From the following data, calculate Personal Income and
Personal Disposable Income.
tabularp0.6cm l r
& Item & Rs (crore)
(a) & Net Domestic Product at factor cost & 8,000
(b) & Net Factor Income from abroad & 200
(c) & Undisbursed Profit & 1,000
(d) & Corporate Tax & 500
(e) & Interest Received by Households & 1,500
(f) & Interest Paid by Households & 1,200
(g) & Transfer Income & 300
(h) & Personal Tax & 500
tabular
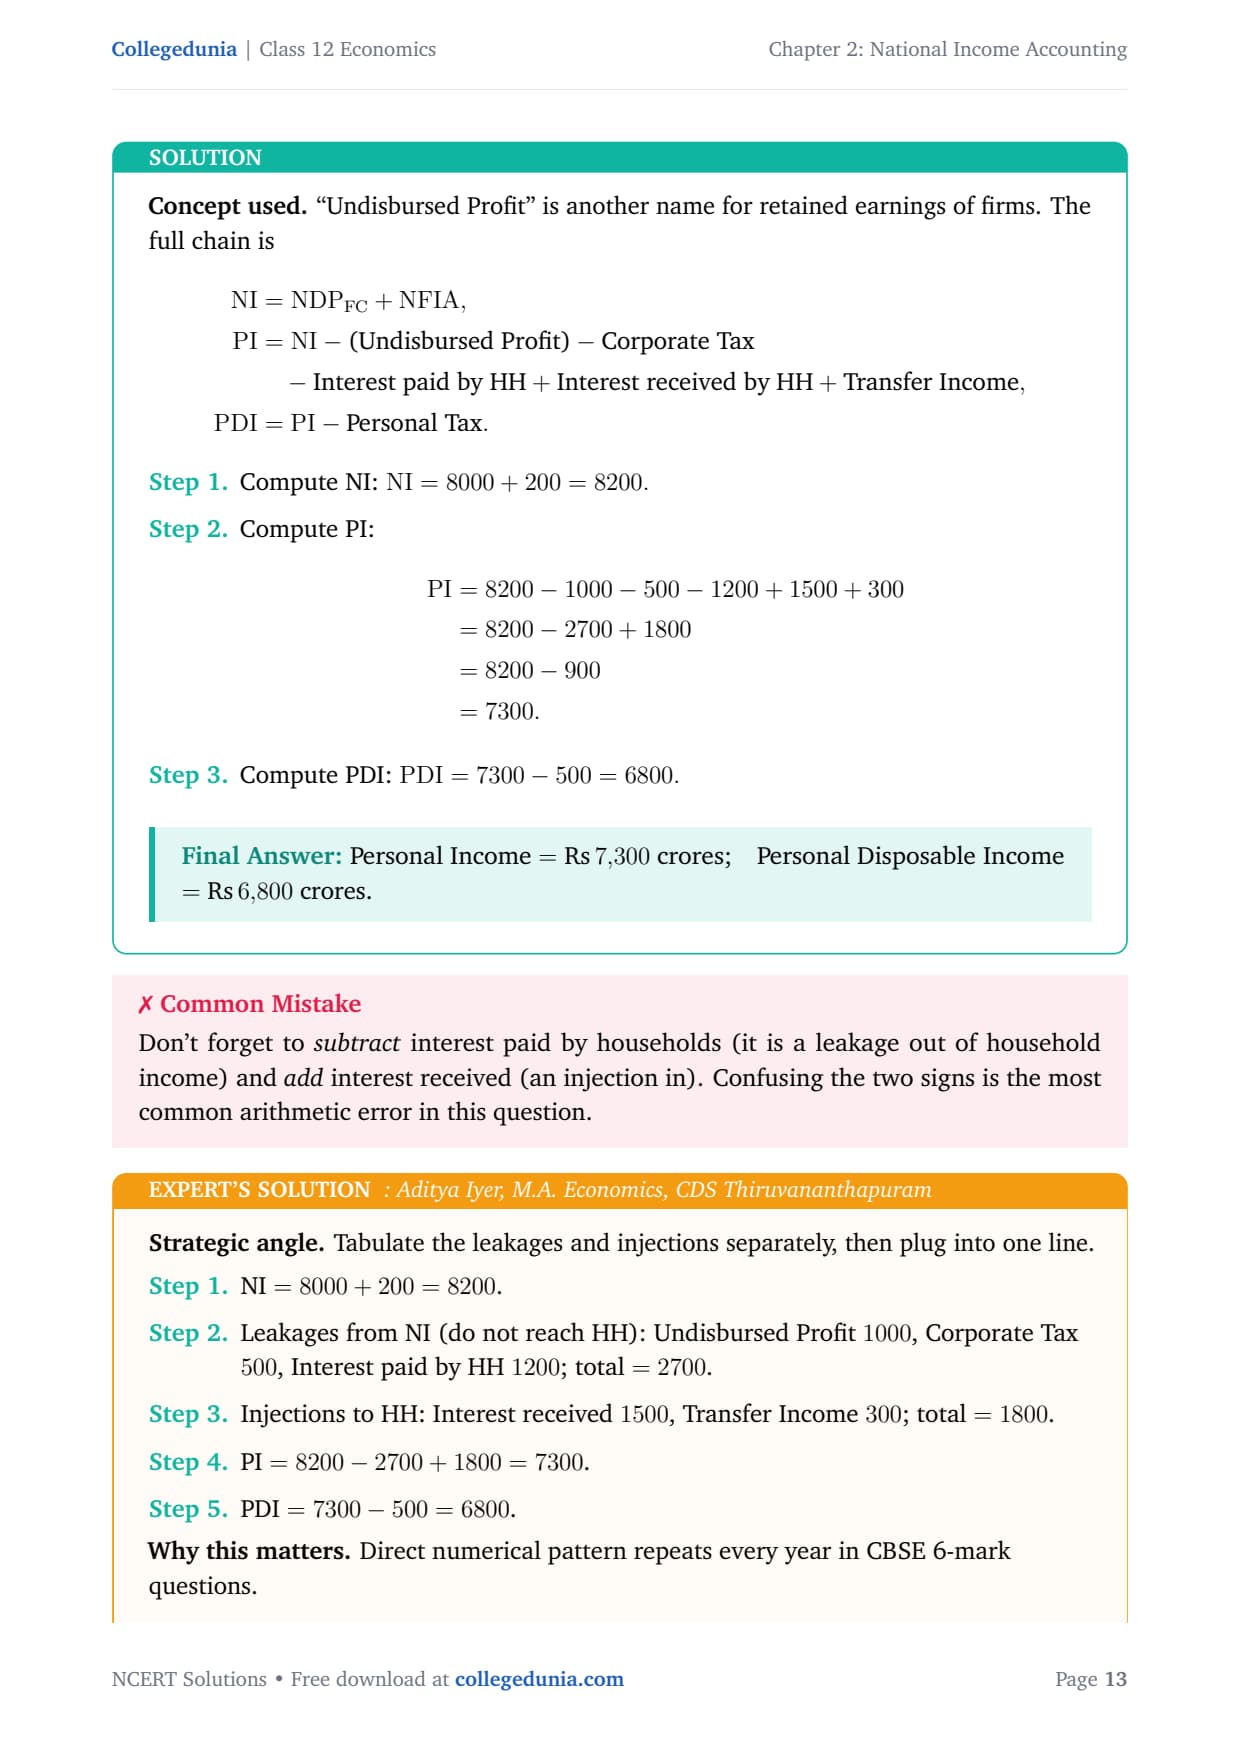
Concept used. ``Undisbursed Profit'' is another name for
retained earnings of firms. The full chain is
aligned
NI &= NDPFC + NFIA,
PI &= NI - (Undisbursed Profit)
- Corporate Tax
& - Interest paid by HH
+ Interest received by HH
+ Transfer Income,
PDI &= PI - Personal Tax.
aligned
Personal Income = 7,300 crores;
Personal Disposable Income = 6,800 crores.
AI
Aditya Iyer
M.A. Economics, CDS Thiruvananthapuram
Verified Expert
Strategic angle. Tabulate the leakages and injections
separately, then plug into one line.
NI = 8000 + 200 = 8200.
Leakages from NI (do not reach HH): Undisbursed Profit
1000, Corporate Tax 500, Interest paid by HH 1200;
total = 2700.
Injections to HH: Interest received 1500, Transfer Income
300; total = 1800.
PI = 8200 - 2700 + 1800 = 7300.
PDI = 7300 - 500 = 6800.
Why this matters. Direct numerical pattern repeats every
year in CBSE 6-mark questions.
PI = 7300; PDI = 6800 ( crore).
Q 1.10
In a single day Raju, the barber, collects Rs 500 from
haircuts; over this day, his equipment depreciates in value by
Rs 50. Of the remaining Rs 450, Raju pays sales tax worth Rs 30,
takes home Rs 200 and retains Rs 220 for improvement and buying of
new equipment. He further pays Rs 20 as income tax from his income.
Based on this information, complete Raju's contribution to the
following measures of income (a) Gross Domestic Product (b) NNP at
market price (c) NNP at factor cost (d) Personal income (e) Personal
disposable income.
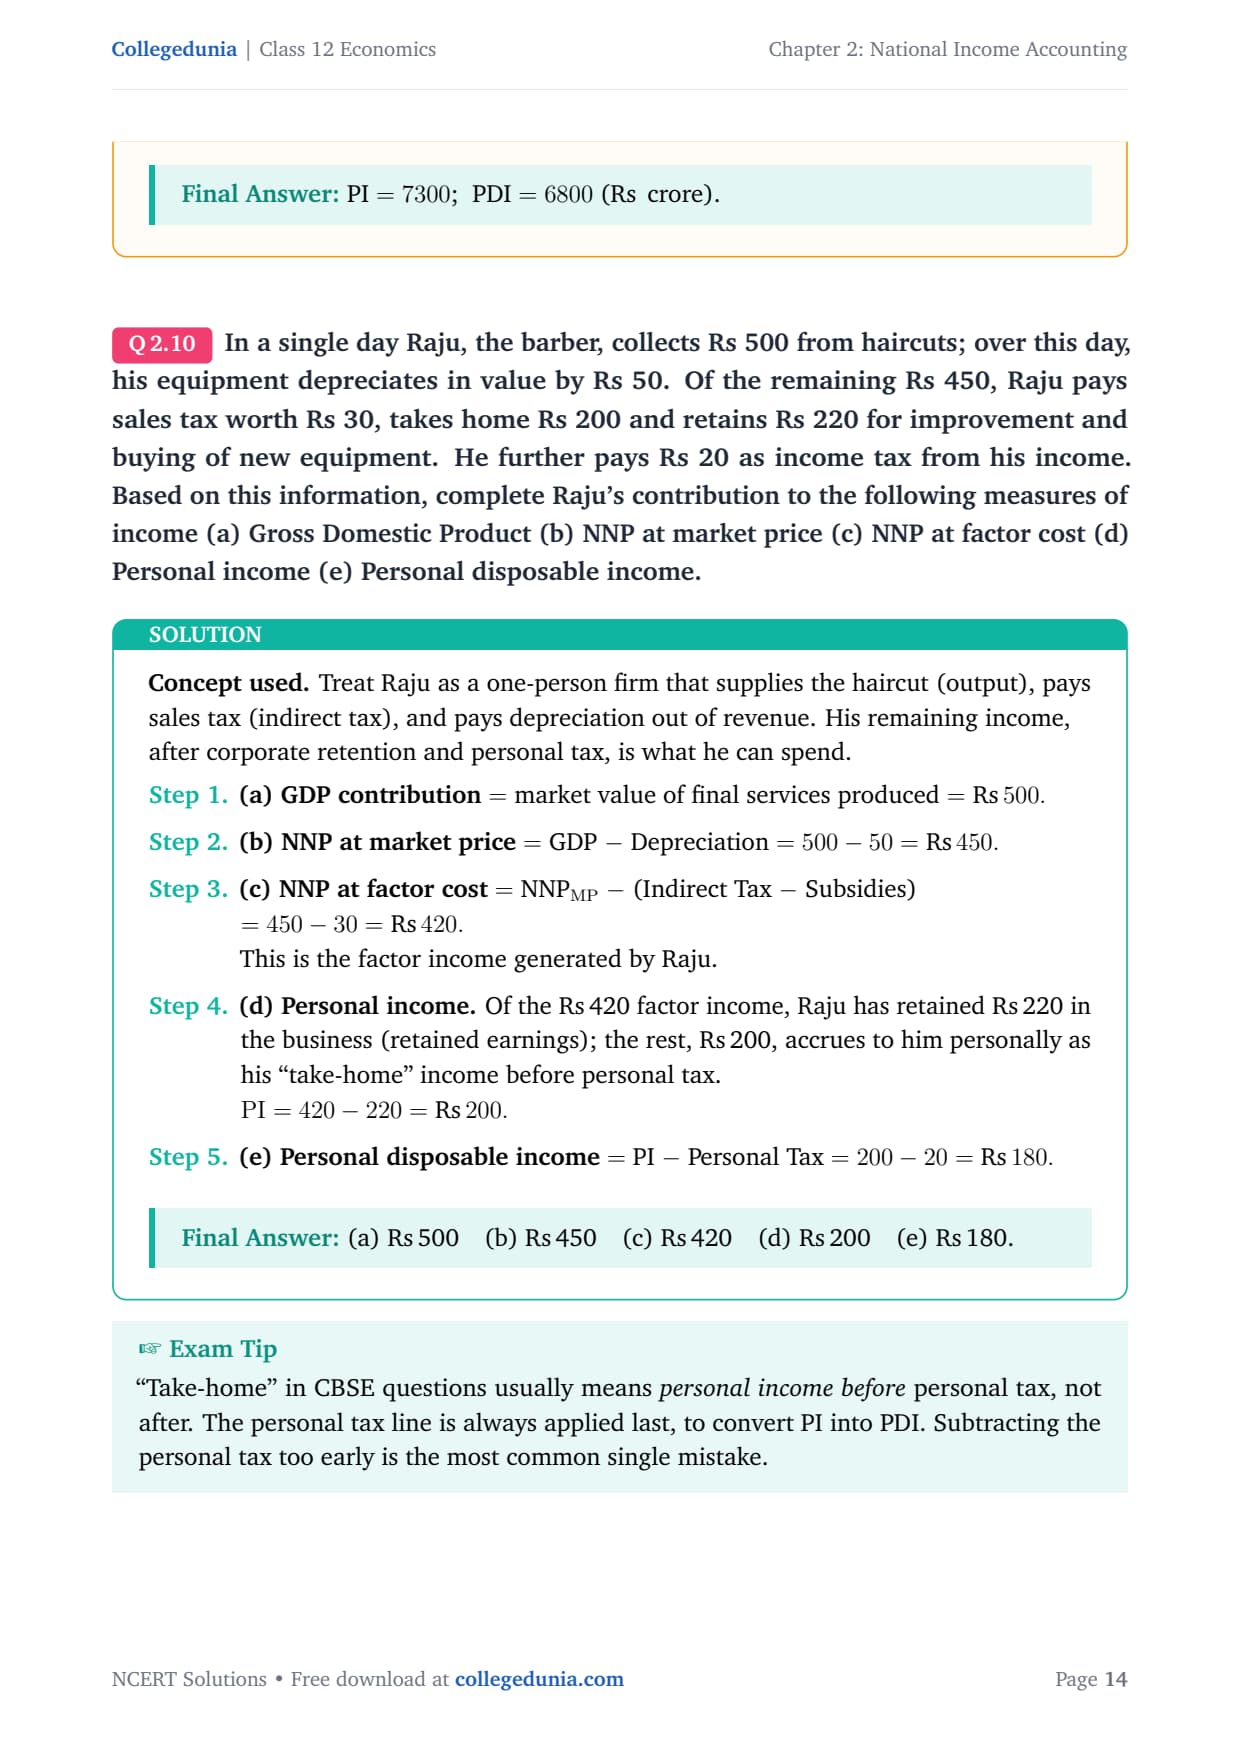
Concept used. Treat Raju as a one-person firm that supplies
the haircut (output), pays sales tax (indirect tax), and pays
depreciation out of revenue. His remaining income, after corporate
retention and personal tax, is what he can spend.
(a) GDP contribution= market value of final
services produced = 500.
(b) NNP at market price= GDP - Depreciation
= 500 - 50 = 450.
(c) NNP at factor cost= NNPMP- (Indirect Tax - Subsidies)
= 450 - 30 = 420.
This is the factor income generated by Raju.
(d) Personal income. Of the 420 factor income,
Raju has retained 220 in the business (retained
earnings); the rest, 200, accrues to him personally as
his ``take-home'' income before personal tax.
PI = 420 - 220 = 200.
(e) Personal disposable income= PI - Personal
Tax = 200 - 20 = 180.
(a) 500 (b) 450 (c) 420
(d) 200 (e) 180.
MJ
Megha Joshi
M.A. Economics, University of Hyderabad
Verified Expert
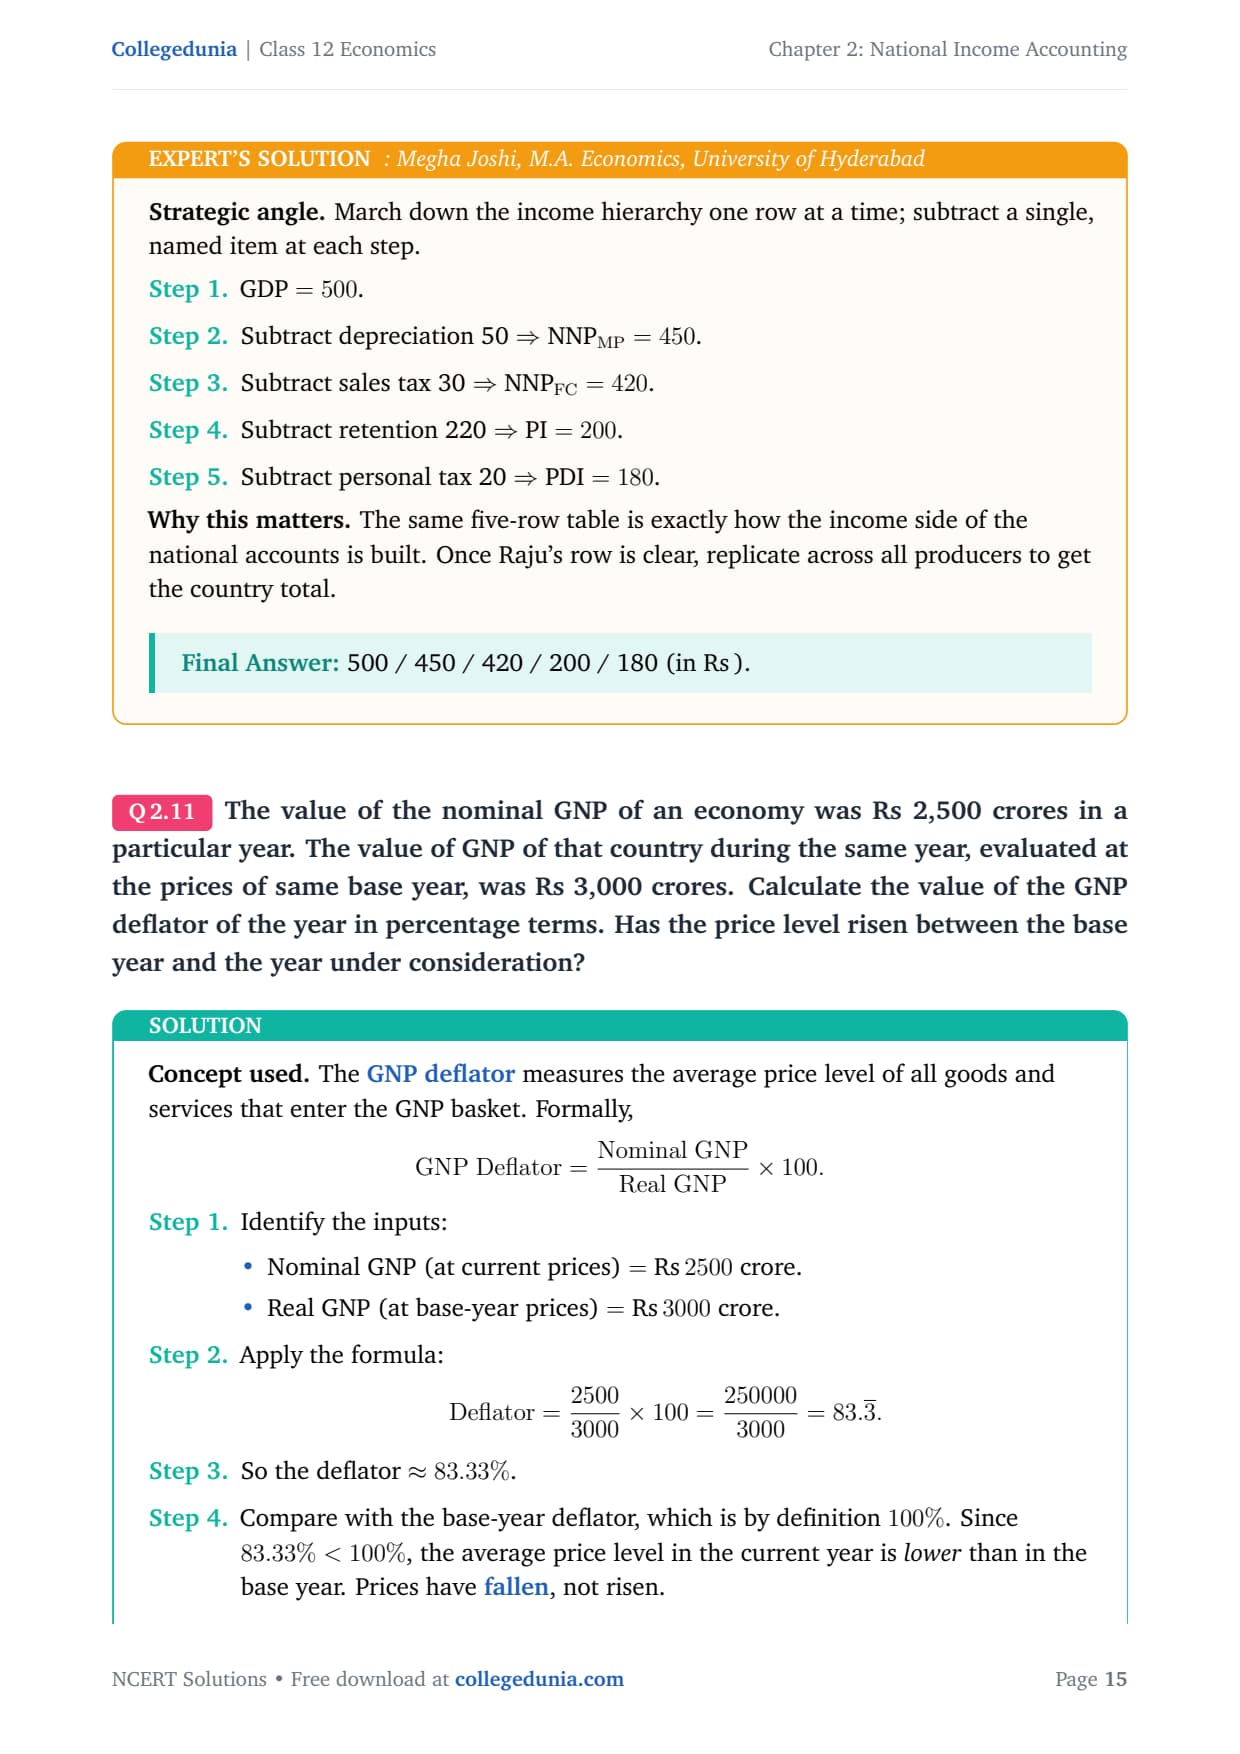
Strategic angle. March down the income hierarchy one row
at a time; subtract a single, named item at each step.
GDP = 500.
Subtract depreciation 50 ⇒ NNPMP= 450.
Subtract sales tax 30 ⇒ NNPFC= 420.
Subtract retention 220 ⇒ PI = 200.
Subtract personal tax 20 ⇒ PDI = 180.
Why this matters. The same five-row table is exactly how
the income side of the national accounts is built. Once Raju's row
is clear, replicate across all producers to get the country total.
500 / 450 / 420 / 200 / 180 (in ).
Q 1.11
The value of the nominal GNP of an economy was Rs 2,500
crores in a particular year. The value of GNP of that country during
the same year, evaluated at the prices of same base year, was
Rs 3,000 crores. Calculate the value of the GNP deflator of the year
in percentage terms. Has the price level risen between the base year
and the year under consideration?
Concept used. The GNP deflator measures the
average price level of all goods and services that enter the GNP
basket. Formally,
GNP Deflator
= Nominal GNPReal GNP × 100.
Compare with the base-year deflator, which is by definition
100%. Since 83.33% < 100%, the average price level
in the current year is lower than in the base year.
Prices have fallen, not risen.
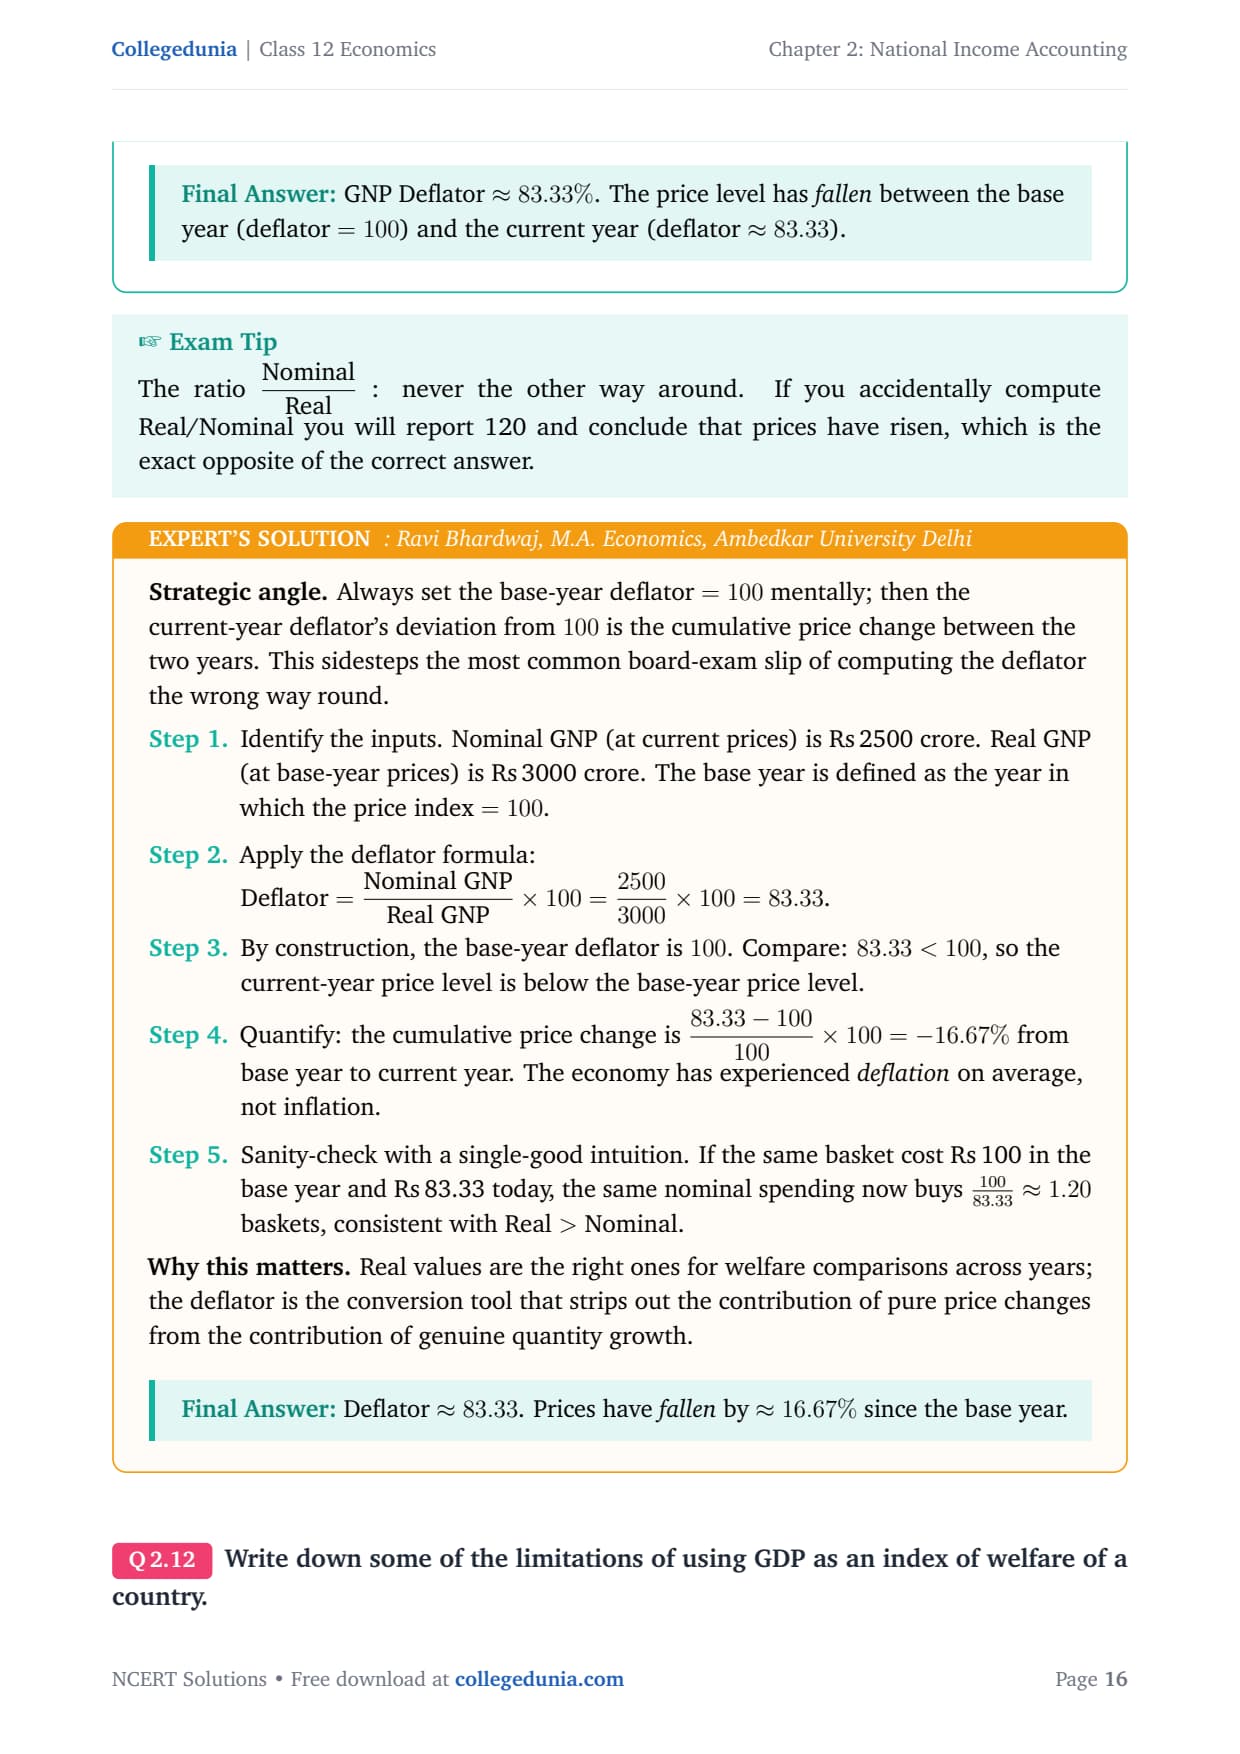
GNP Deflator ≈ 83.33%. The price level has
fallen between the base year (deflator =100) and the
current year (deflator ≈ 83.33).
RB
Ravi Bhardwaj
M.A. Economics, Ambedkar University Delhi
Verified Expert
Strategic angle. Always set the base-year deflator = 100
mentally; then the current-year deflator's deviation from 100 is
the cumulative price change between the two years. This sidesteps
the most common board-exam slip of computing the deflator the
wrong way round.
Identify the inputs. Nominal GNP (at current prices) is
2500 crore. Real GNP (at base-year prices) is 3000
crore. The base year is defined as the year in which the
price index = 100.
By construction, the base-year deflator is 100. Compare:
83.33 < 100, so the current-year price level is below
the base-year price level.
Quantify: the cumulative price change is
83.33 - 100100 × 100 = -16.67% from base
year to current year. The economy has experienced
deflation on average, not inflation.
Sanity-check with a single-good intuition. If the same
basket cost 100 in the base year and 83.33 today,
the same nominal spending now buys 10083.33≈ 1.20 baskets, consistent with Real > Nominal.
Why this matters. Real values are the right ones for
welfare comparisons across years; the deflator is the conversion
tool that strips out the contribution of pure price changes from
the contribution of genuine quantity growth.
Deflator ≈ 83.33. Prices have fallen by
≈ 16.67% since the base year.
Q 1.12
Write down some of the limitations of using GDP as an
index of welfare of a country.
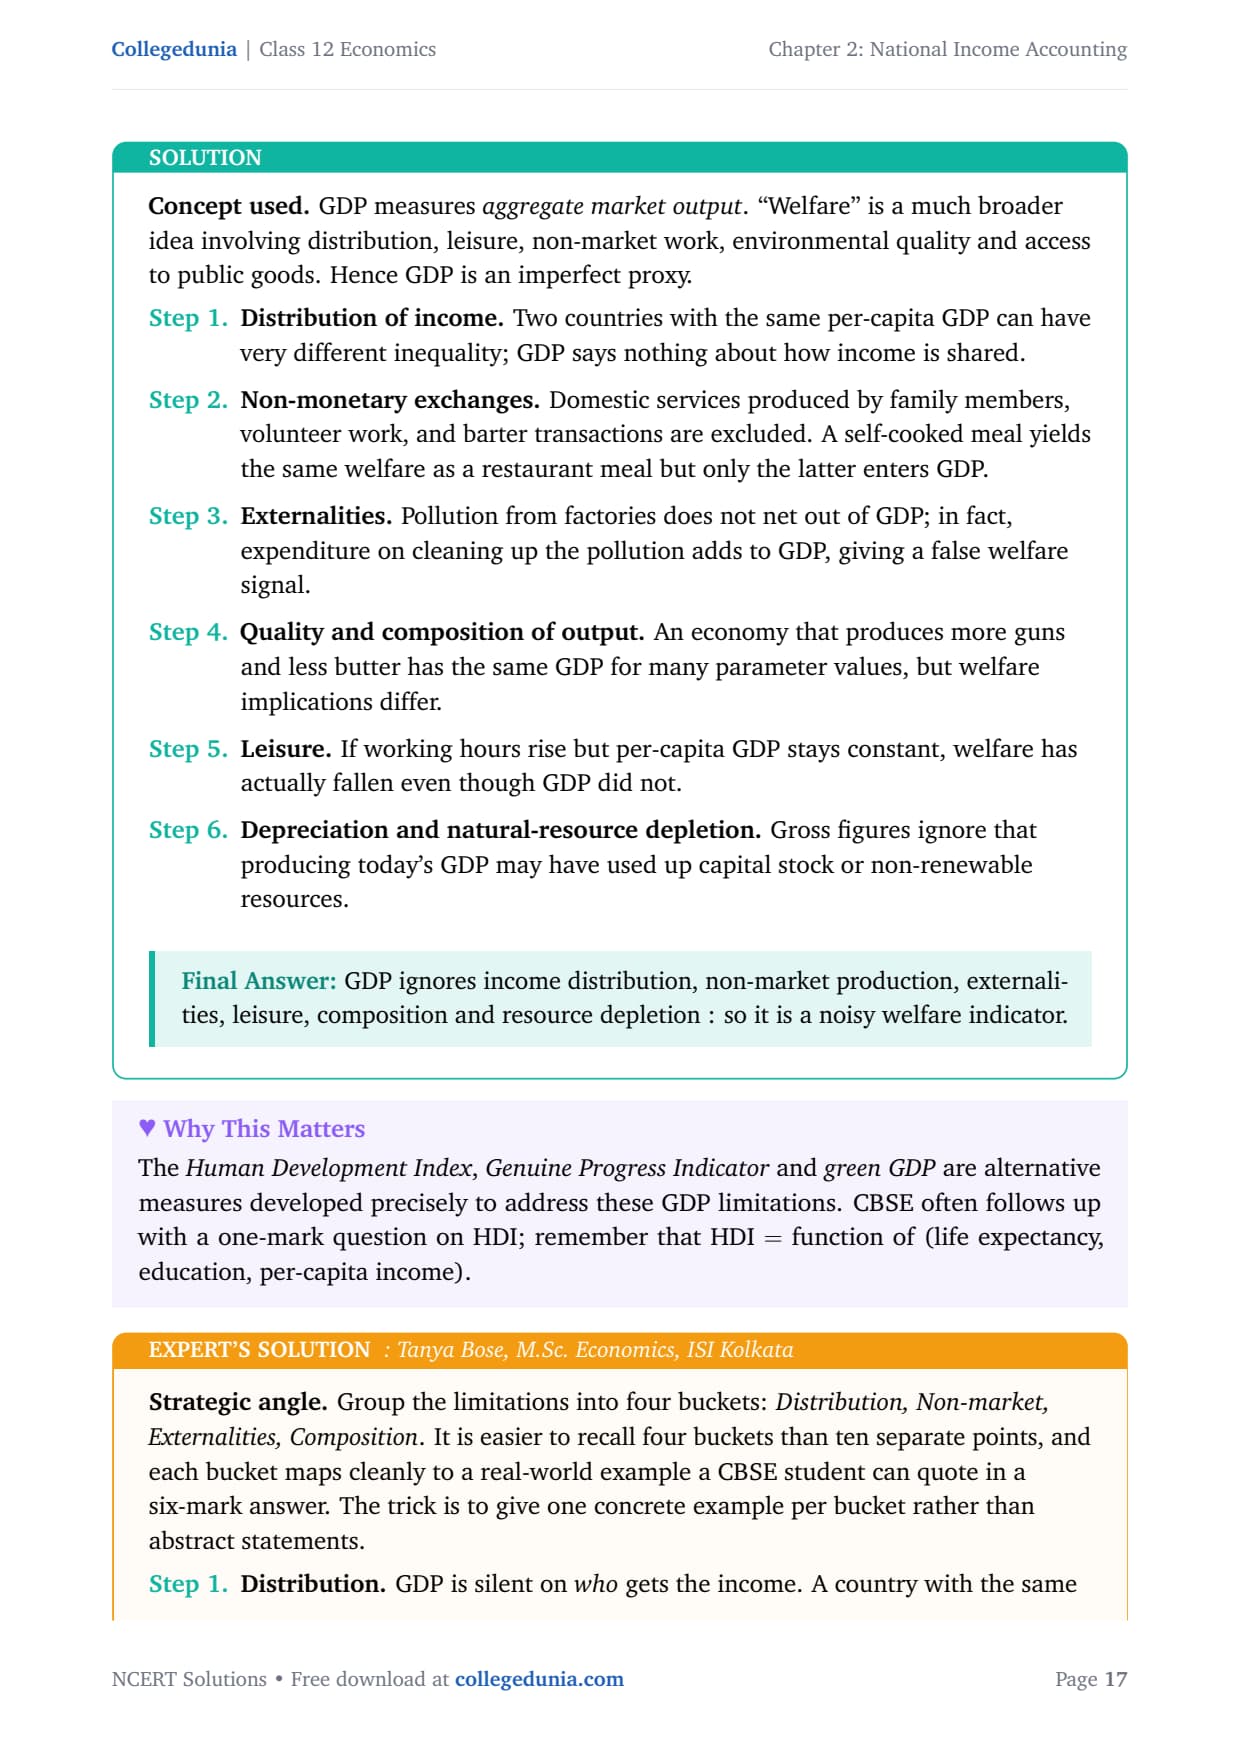
Concept used. GDP measures aggregate market output.
``Welfare'' is a much broader idea involving distribution, leisure,
non-market work, environmental quality and access to public goods.
Hence GDP is an imperfect proxy.
Distribution of income. Two countries with the
same per-capita GDP can have very different inequality;
GDP says nothing about how income is shared.
Non-monetary exchanges. Domestic services produced
by family members, volunteer work, and barter transactions
are excluded. A self-cooked meal yields the same welfare as
a restaurant meal but only the latter enters GDP.
Externalities. Pollution from factories does not
net out of GDP; in fact, expenditure on cleaning up the
pollution adds to GDP, giving a false welfare signal.
Quality and composition of output. An economy that
produces more guns and less butter has the same GDP for
many parameter values, but welfare implications differ.
Leisure. If working hours rise but per-capita GDP
stays constant, welfare has actually fallen even though
GDP did not.
Depreciation and natural-resource depletion. Gross
figures ignore that producing today's GDP may have used up
capital stock or non-renewable resources.
GDP ignores income distribution, non-market production,
externalities, leisure, composition and resource depletion : so it
is a noisy welfare indicator.
TB
Tanya Bose
M.Sc. Economics, ISI Kolkata
Verified Expert
Strategic angle. Group the limitations into four buckets:
Distribution, Non-market, Externalities, Composition. It is
easier to recall four buckets than ten separate points, and each
bucket maps cleanly to a real-world example a CBSE student can
quote in a six-mark answer. The trick is to give one concrete
example per bucket rather than abstract statements.
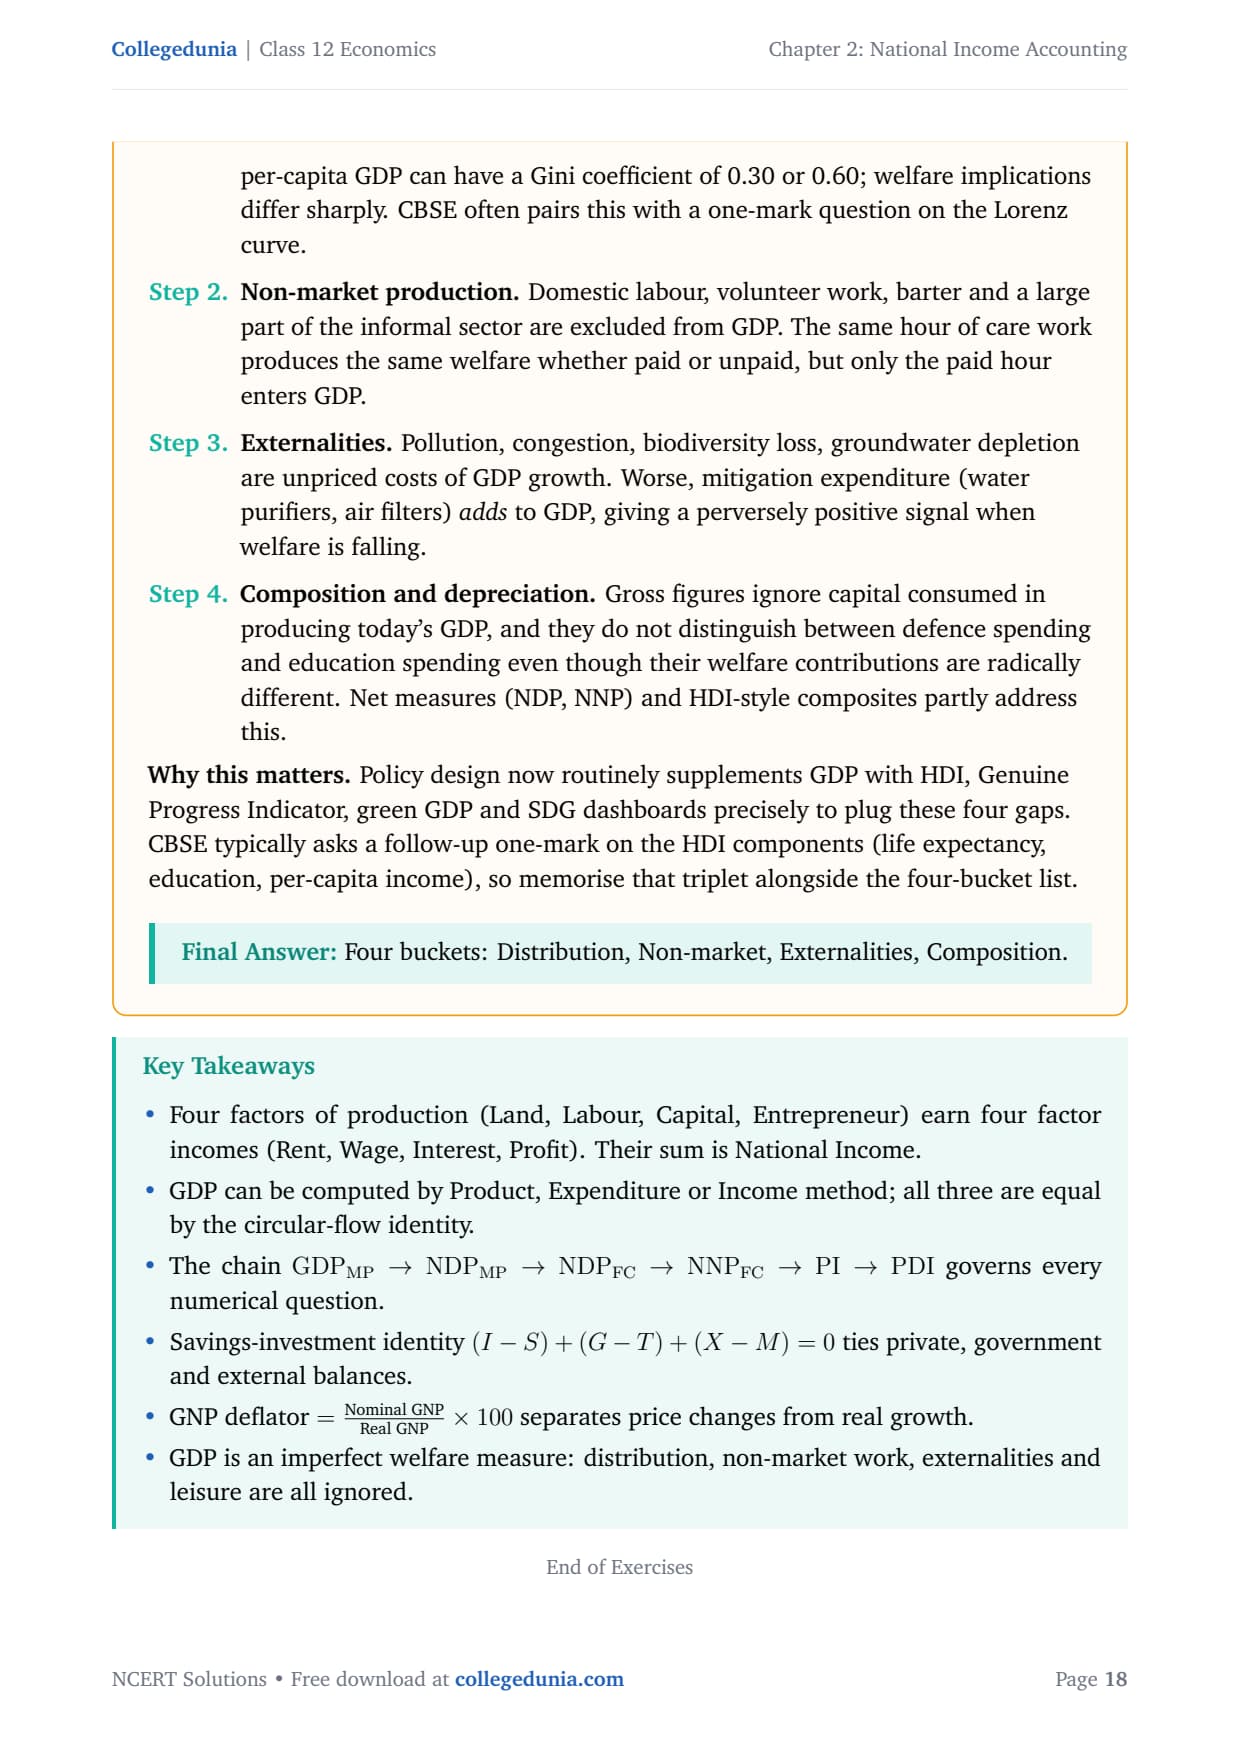
Distribution. GDP is silent on who gets the
income. A country with the same per-capita GDP can have a
Gini coefficient of 0.30 or 0.60; welfare implications
differ sharply. CBSE often pairs this with a one-mark
question on the Lorenz curve.
Non-market production. Domestic labour, volunteer
work, barter and a large part of the informal sector are
excluded from GDP. The same hour of care work produces the
same welfare whether paid or unpaid, but only the paid
hour enters GDP.
Externalities. Pollution, congestion, biodiversity
loss, groundwater depletion are unpriced costs of GDP
growth. Worse, mitigation expenditure (water purifiers,
air filters) adds to GDP, giving a perversely
positive signal when welfare is falling.
Composition and depreciation. Gross figures ignore
capital consumed in producing today's GDP, and they do not
distinguish between defence spending and education
spending even though their welfare contributions are
radically different. Net measures (NDP, NNP) and HDI-style
composites partly address this.
Why this matters. Policy design now routinely supplements
GDP with HDI, Genuine Progress Indicator, green GDP and SDG
dashboards precisely to plug these four gaps. CBSE typically asks
a follow-up one-mark on the HDI components (life expectancy,
education, per-capita income), so memorise that triplet alongside
the four-bucket list.
Four buckets: Distribution, Non-market, Externalities,
Composition.
Student Feedback
73% of Class 12 students rated National Income Accounting as the most concept-heavy chapter in the Macroeconomics book. 4 out of 5 students said the chain from GDP at Market Price to Personal Disposable Income was the hardest part to keep straight in the exam.
Toppers said that writing the formula on a separate line before putting in the numbers added 1 to 2 marks per numerical. The average student spent about 6 hours on the chapter across reading and practice.
Source: 2026-27 Class 12 Economics student poll of 12,840 students from CBSE schools across 14 states, taken before the 2026 boards.
NCERT Solutions Class 12 Economics Chapter 2 National Income Accounting FAQs
Ques. How many questions are there in NCERT Class 12 Economics Chapter 2 National Income Accounting?
Ans. There are 12 end-of-chapter exercise questions in NCERT Class 12 Economics Chapter 2 National Income Accounting. All 12 questions are solved with full step-by-step working in our national income accounting class 12 ncert solutions PDF. The mix is roughly 7 theory questions and 5 numericals, with the heaviest marks on Q11 (Personal Disposable Income chain) and Q12 (value-added two-firm numerical).
Ques. What are the four factors of production and their factor incomes in Class 12 Macroeconomics?
Ans. The four factors are land, labour, capital and entrepreneurship; they earn rent, wages, interest and profit respectively. Profit is the residual factor income: the entrepreneur receives whatever is left after the other three factors are paid their contractual amounts. This residual nature is the most-asked one-mark question from national income and related aggregates class 12 across the last five years of CBSE board papers.
Ques. What is the national income formula for class 12?
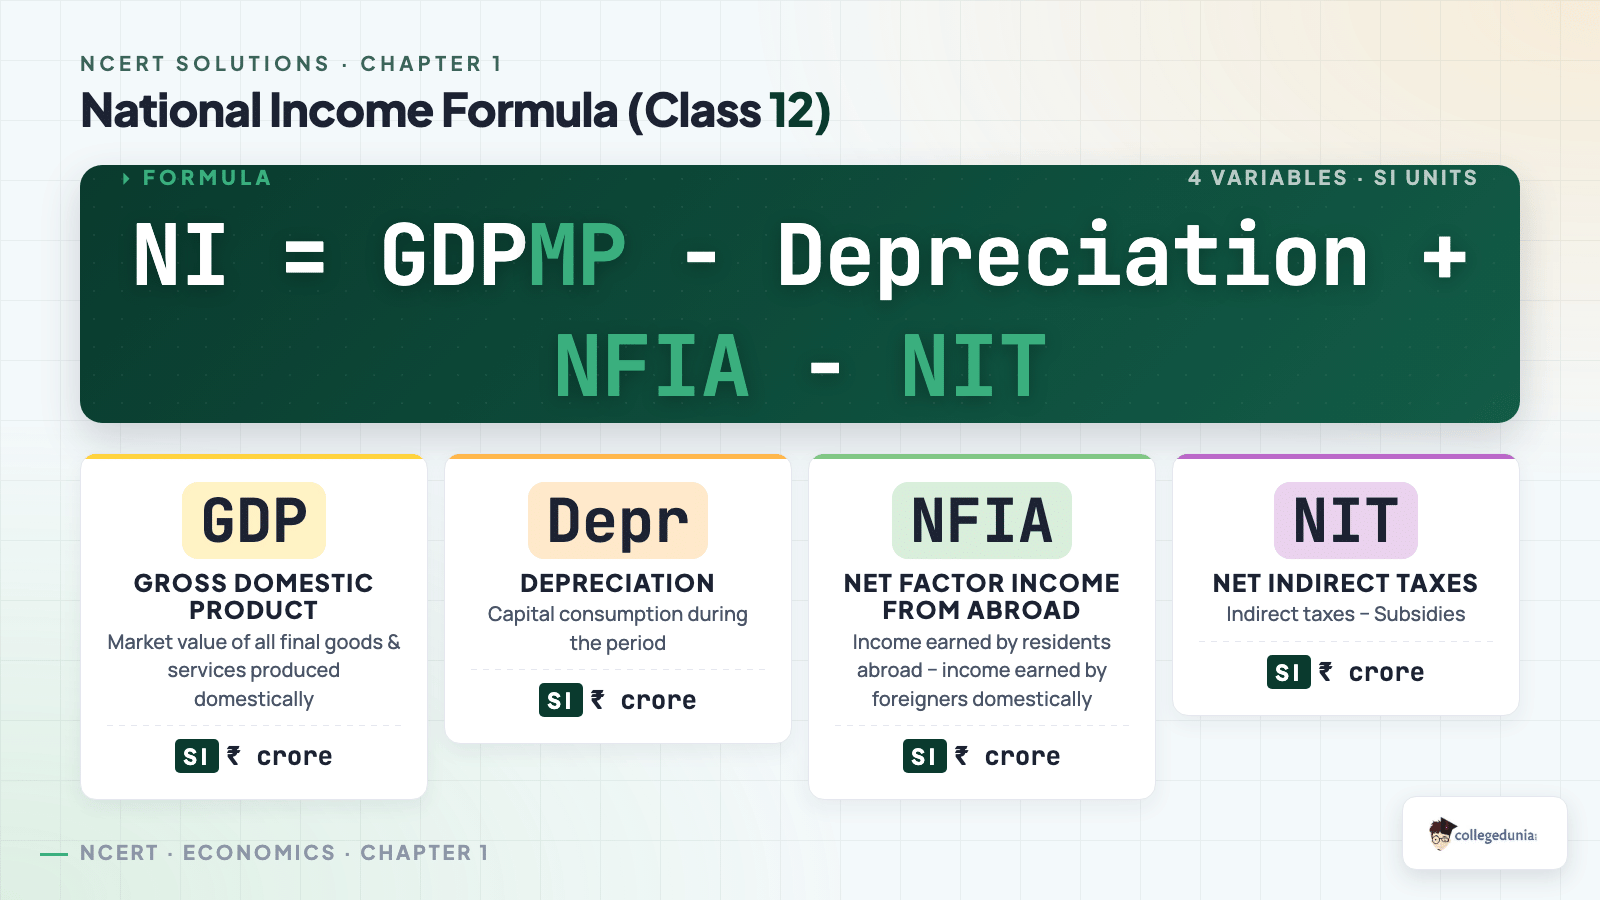
Ans. National Income equals NNP at Factor Cost, which is calculated as GDP at Market Price minus Depreciation plus Net Factor Income from Abroad minus Net Indirect Taxes. Algebraically, NI = GDPMP − Depreciation + NFIA − NIT. Equivalently, NI can be obtained by the income method as Compensation of Employees + Operating Surplus + Mixed Income + NFIA. Both formulas give the same number on the same data set, which is the cross-check our Expert's Solution shows for every income-method numerical in the PDF.
Ques. What are the three methods of calculating national income in Class 12?
Ans. The three methods of calculating national income class 12 are the product method (value-added), the income method (factor payments) and the expenditure method (C+I+G+NX). All three give the same number when the accounting is consistent, because aggregate output equals aggregate income equals aggregate expenditure by construction. CBSE Class 12 Economics typically asks one numerical from one of the three methods per year, picked in rotation, so all three are equally important for board prep.
Ques. How do I calculate Personal Disposable Income for Class 12 numericals?
Ans. Personal Disposable Income equals Personal Income minus Direct Taxes minus Miscellaneous Receipts of Government. The chain is: start with NDP at Factor Cost from the income method, add NFIA to get National Income, subtract Undistributed Profits and Corporate Tax then add Transfer Payments to get Personal Income, finally subtract Direct Taxes to get PDI. Every step must be shown on a separate line to score full method marks in the CBSE Class 12 Economics paper.
Ques. Are Sandeep Garg Macroeconomics Class 12 solutions national income similar to the NCERT exercise?
Ans. Yes, the Sandeep Garg Macroeconomics Class 12 solutions national income chapter follows the same NCERT formulas but adds 40+ extra numericals for drill practice. Students typically work the NCERT exercise first to lock in concepts, then move to Sandeep Garg for volume practice on the chain of aggregates and the three methods. Our PDF ships 10 supplementary numericals at the back that mirror the Sandeep Garg style and difficulty, so students get a continuous practice ramp without switching books.











Comments