




These Notes for Class 12 Computer Science Chapter 7 Understanding Data give you a fast, concept-first revision of the whole chapter, built on the latest 2026-27 CBSE syllabus. They explain what data is, how raw data becomes information and knowledge, the difference between structured and unstructured data, how data is collected, stored and processed, and the basic statistical techniques mean, median, mode, range and standard deviation.
- Every concept explained with a one-line meaning, a worked number example, and a clear table so you can revise the chapter in one sitting.
- Full coverage of data collection, storage, the IPO processing cycle, and the central-tendency versus variability measures that the CBSE board paper tests directly.
- Notes aligned with the 2026-27 CBSE Class 12 Computer Science syllabus and useful for JEE and CUET data questions; no NEET references because Computer Science is not a medical subject.
These Collegedunia revision notes are curated by Computer Science subject experts, according to the 2026-27 NCERT textbook, and refined against the last five years of CBSE Class 12 Computer Science board papers.
Student Feedback: What 11,800 students told us about this chapter
71% of Class 12 students said the hardest part was picking the right statistical technique for a worded question, not the formula itself. 4 out of 5 students told us a single keyword table (average to mean, spread to standard deviation) helped them lock these marks the night before the exam.
Toppers reported that listing the processing steps as a numbered pipeline earned full marks every time, and the average student spent 1 to 2 hours on these notes across the first read and the final revision.
Source: 2026-27 Class 12 Computer Science student poll. Sample of 11,800 students from CBSE schools across 13 states, conducted before the 2026 boards.
What the Notes for Class 12 Computer Science Chapter 7 Understanding Data Cover
This chapter answers one question: how do raw facts turn into something a person or a program can actually use to decide? These notes keep the NCERT order but compress it into revision-ready blocks, so you can read the whole chapter in one sitting and recall it fast in the exam.
- What data is: unorganised facts, figures and symbols that carry no conclusion until they are processed.
- The data ladder: data becomes information after processing, and information grows into knowledge that drives a decision.
- Types, collection and storage: structured versus unstructured data, how data is collected and cleaned, and where it is stored.
- Processing and statistics: the Input-Processing-Output cycle, and the measures mean, median, mode, range and standard deviation.
Source: Magnet Brains on YouTube
What Data Is: Data, Information and Knowledge in Class 12 Computer Science
Before anything else, fix the core definition. Data is a collection of characters, numbers and other symbols that represents the values of some situation or variable. On its own a single fact tells you very little; the value appears only after the data is gathered, processed and studied. A useful exam point is that data is plural and its singular form is datum.
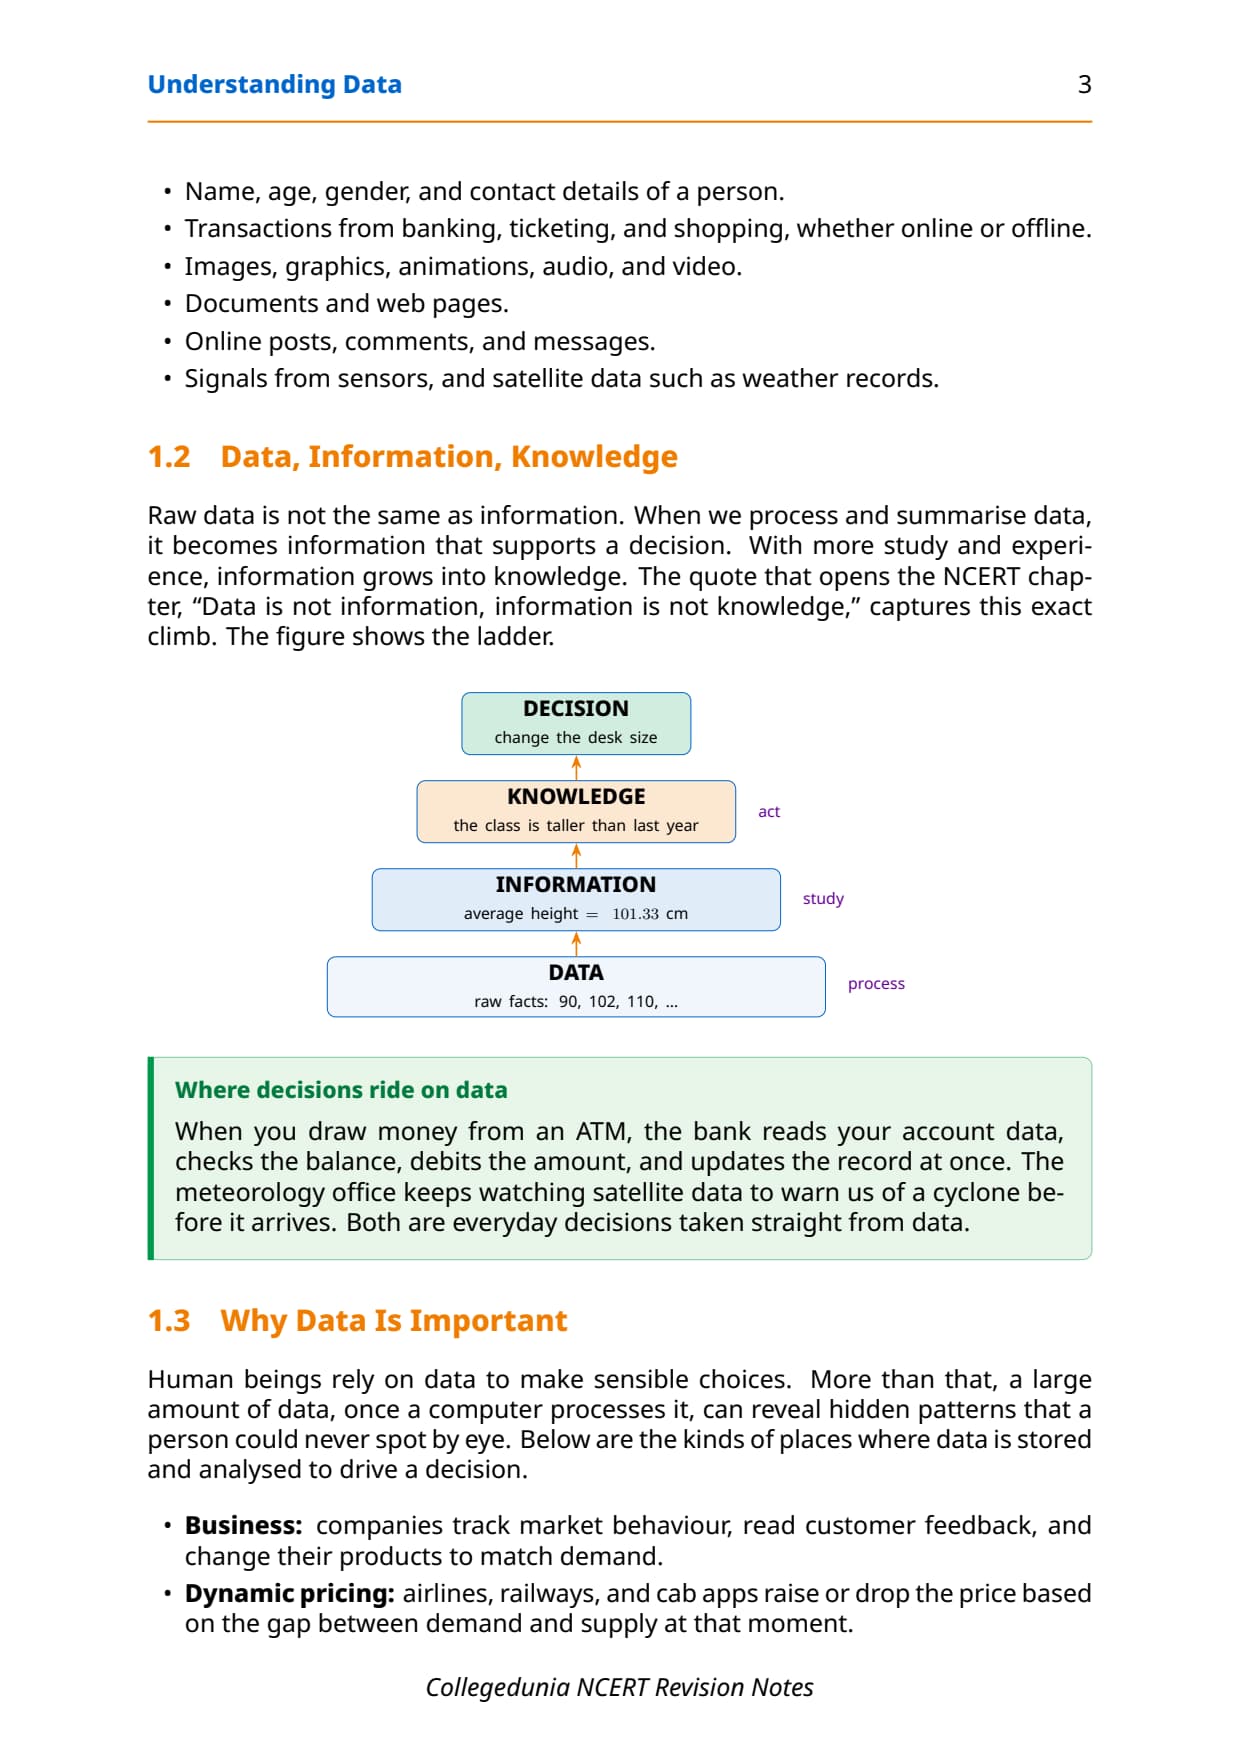
- Data: unorganised raw facts and figures, such as the heights 90, 102 and 110.
- Information: the result of processing data, such as the average height 101.33 cm.
- Knowledge: the understanding built from information, such as "the class is taller than last year".
The quote that opens the NCERT chapter, "Data is not information, information is not knowledge," captures the full climb. Raw data goes through processing to become information, then study turns information into knowledge, and knowledge drives a decision. When you draw money from an ATM, the bank reads your account data, checks the balance, debits the amount and updates the record at once: a decision taken straight from data.
Structured versus Unstructured Data with Examples
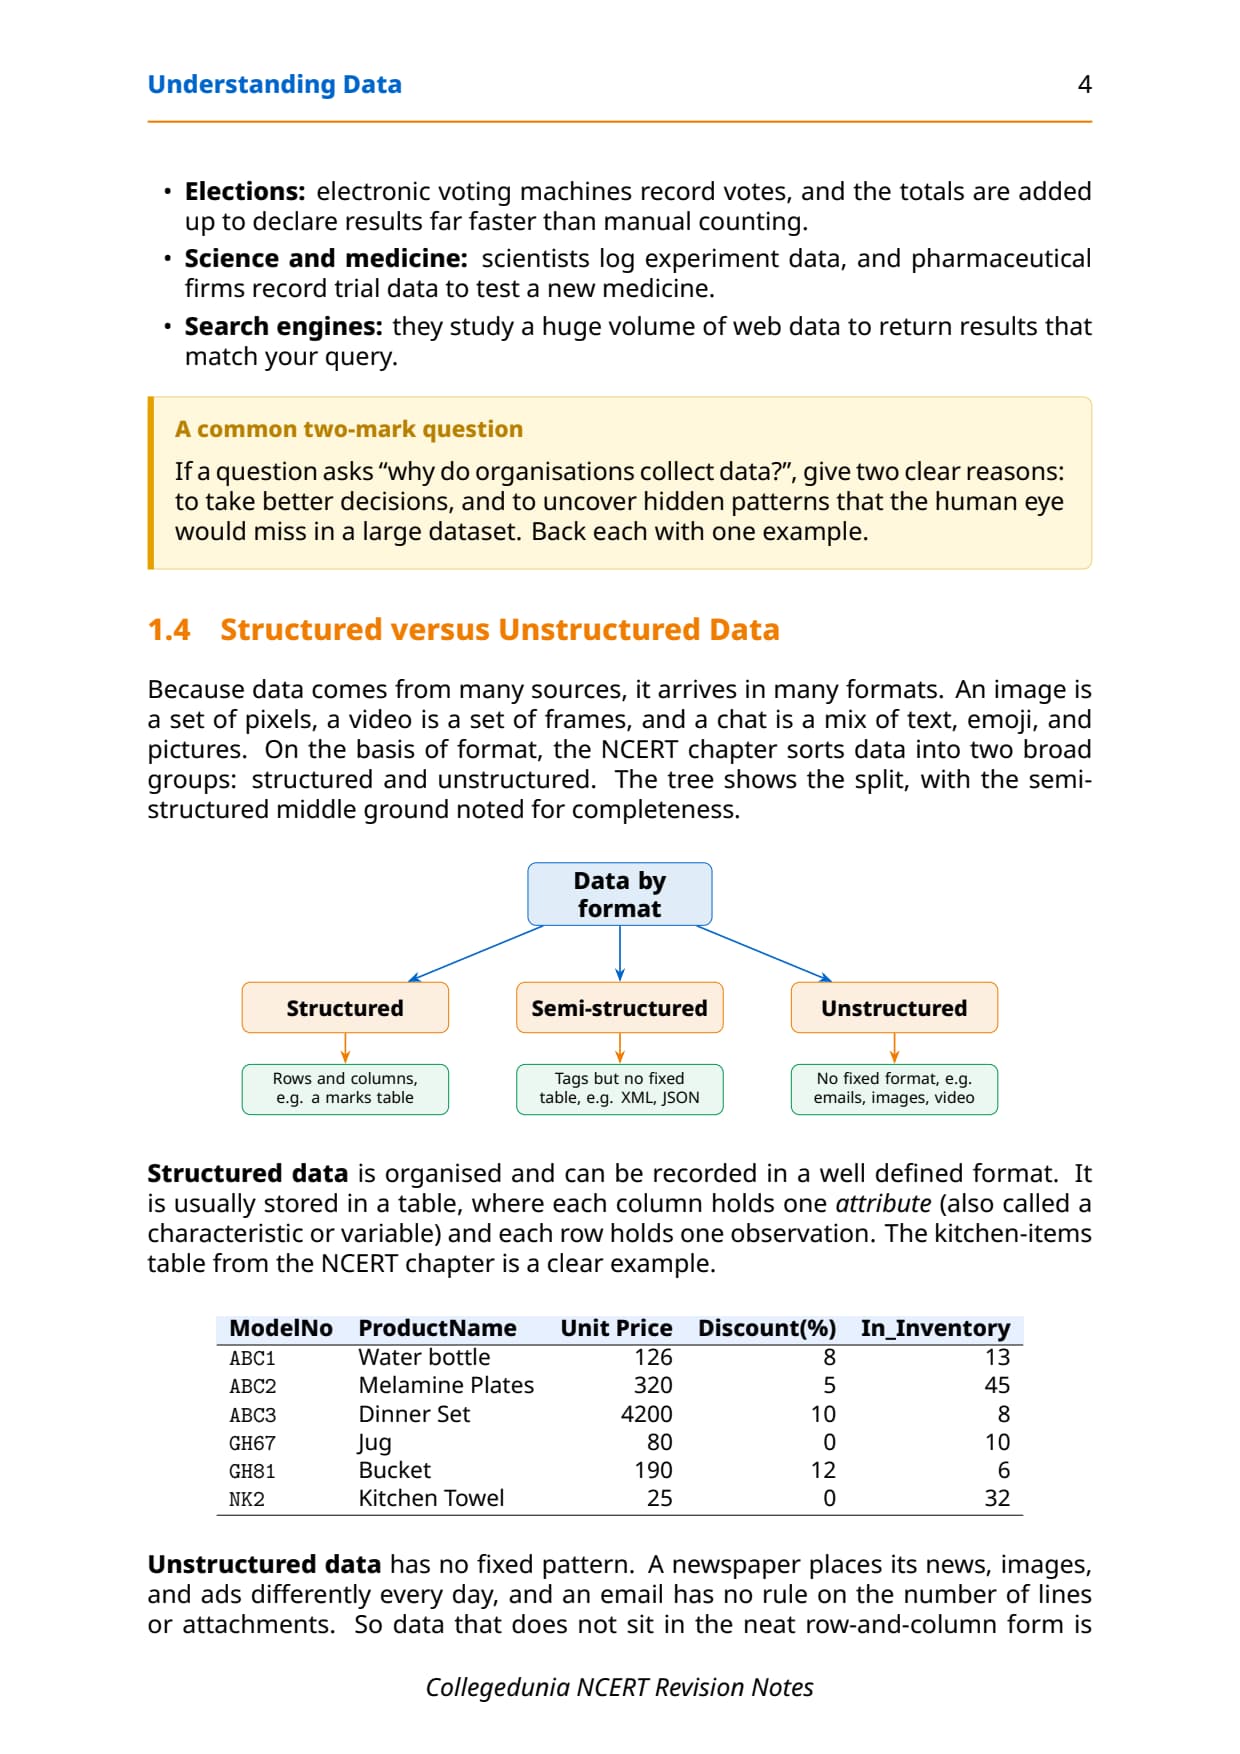
Because data comes from many sources, it arrives in many formats. An image is a set of pixels, a video is a set of frames, and a chat mixes text, emoji and pictures. On the basis of format, the NCERT chapter sorts data into two broad groups: structured and unstructured, with a semi-structured middle ground noted for completeness.
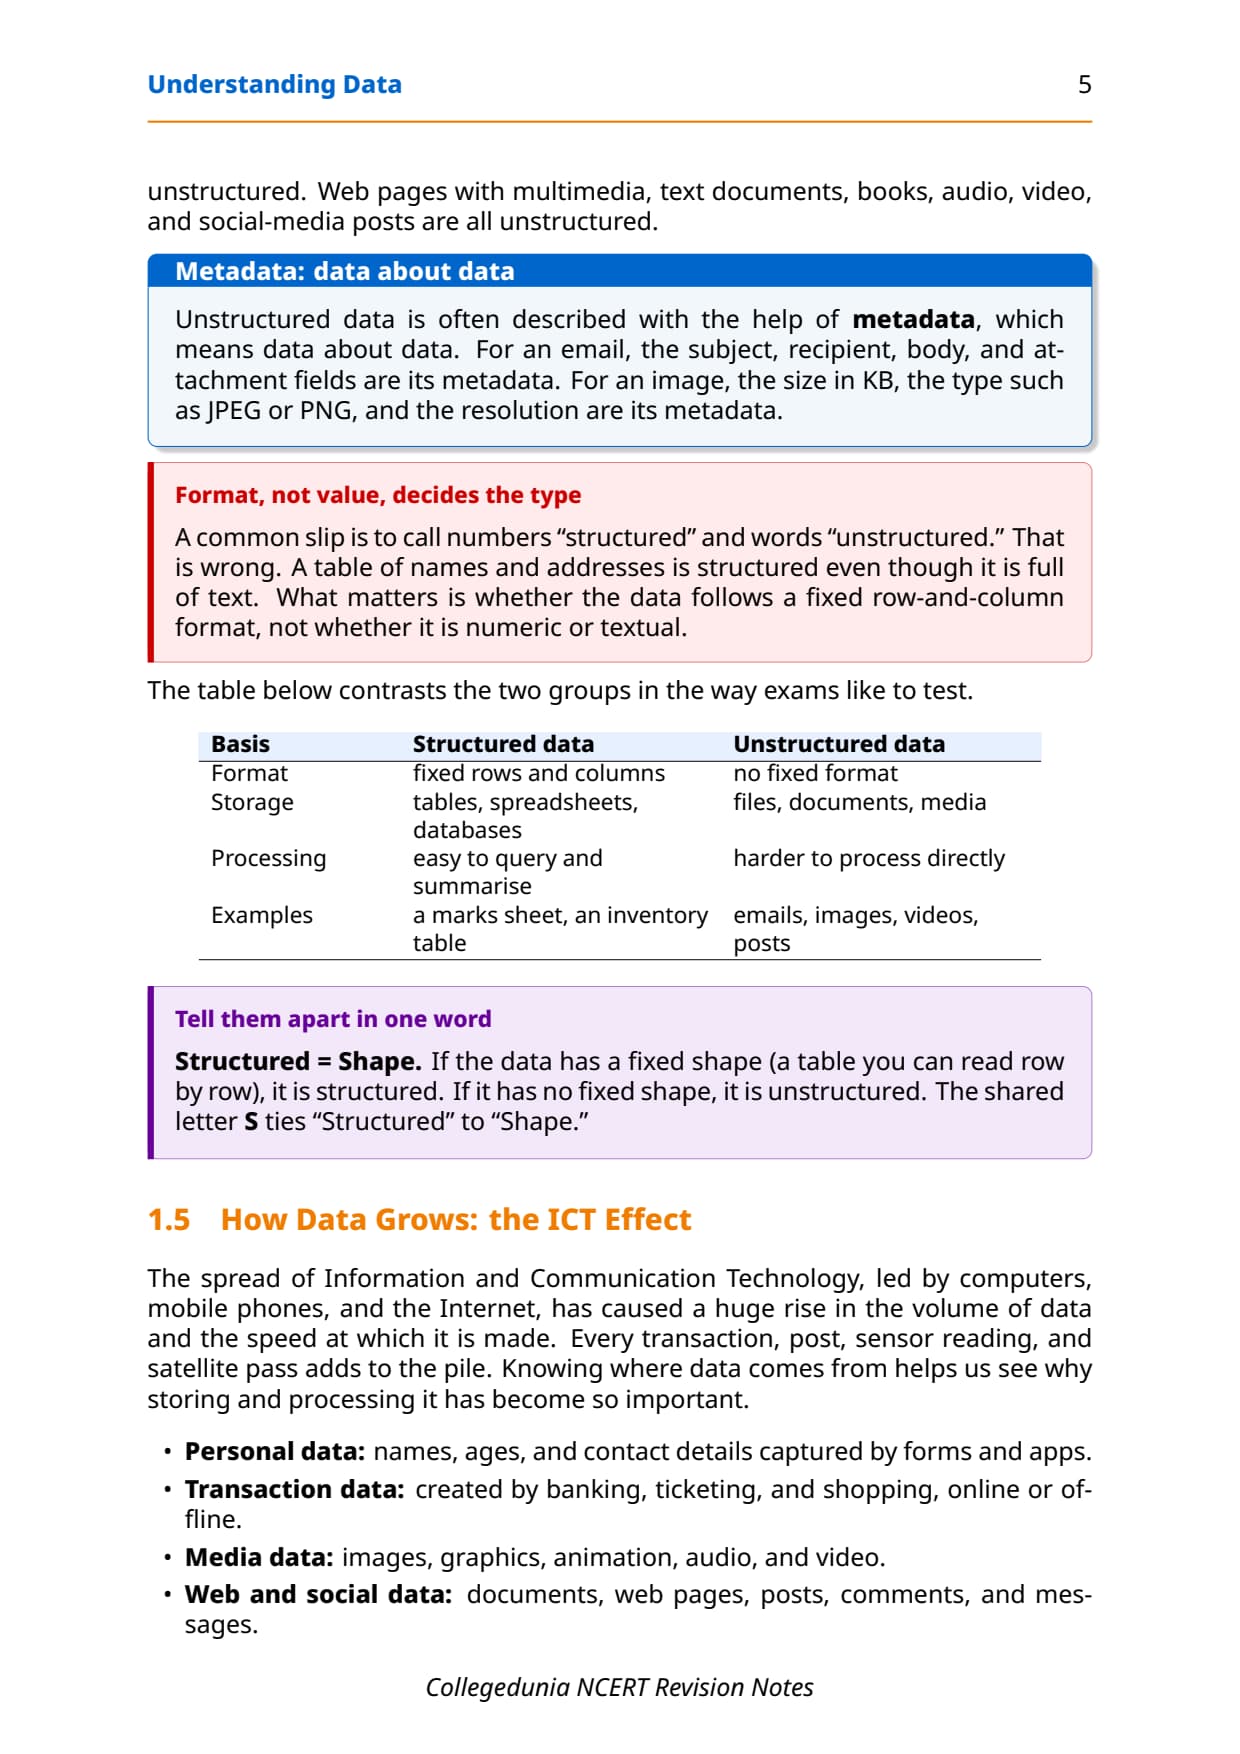
- Structured data: organised in a fixed row-and-column format, where each column holds one attribute and each row holds one observation. A marks table or an inventory table is structured.
- Unstructured data: has no fixed pattern. Emails, images, audio, video, web pages and social-media posts are all unstructured.
- Metadata: data about data, such as an email's subject and recipient, or an image's size, type and resolution.
A common slip is to call numbers "structured" and words "unstructured". That is wrong. A table of names and addresses is structured even though it is full of text. What matters is whether the data follows a fixed row-and-column format, not whether it is numeric or textual. The table below contrasts the two groups in the way exams like to test.
| Basis | Structured data | Unstructured data |
|---|---|---|
| Format | Fixed rows and columns | No fixed format |
| Storage | Tables, spreadsheets, databases | Files, documents, media |
| Processing | Easy to query and summarise | Harder to process directly |
| Examples | A marks sheet, an inventory table | Emails, images, videos, posts |
Data Collection: Sources, Modes and Cleaning
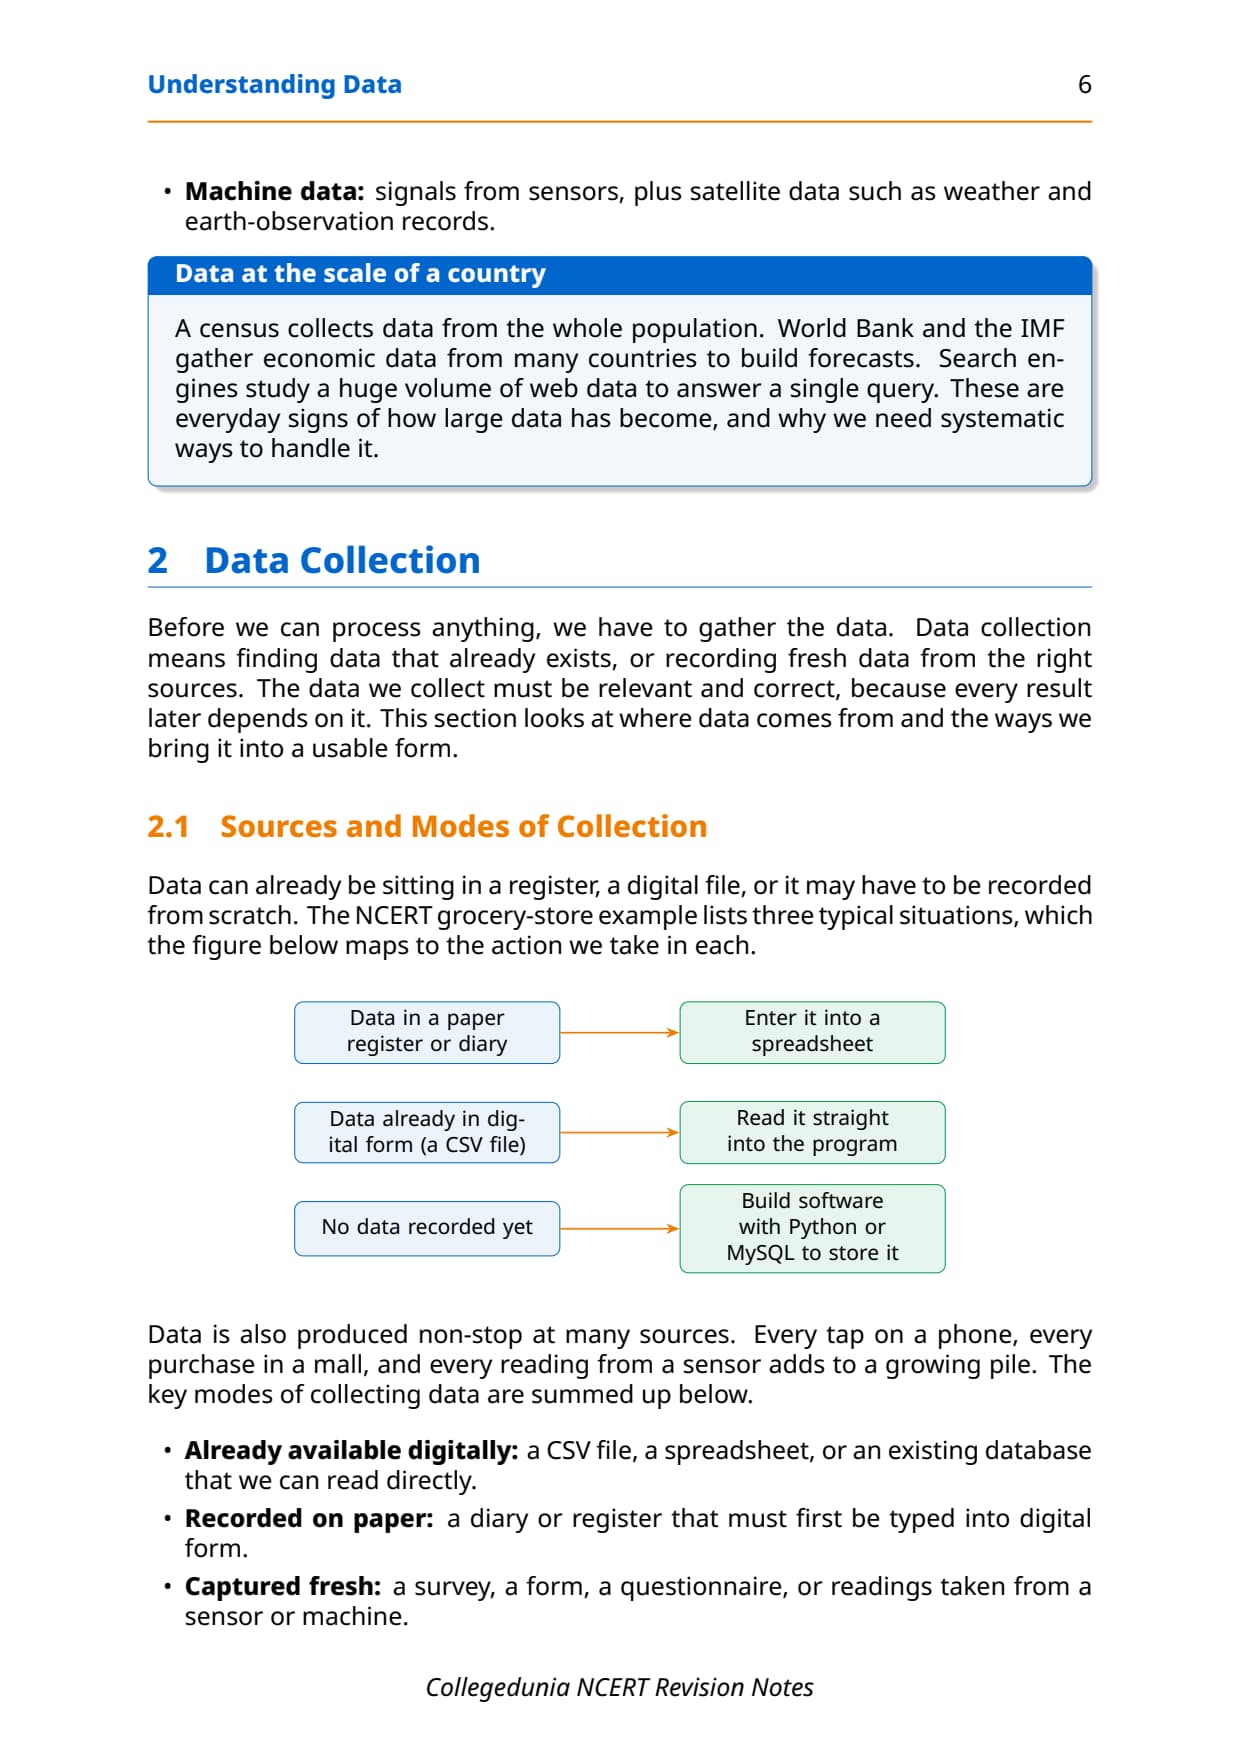
Before you can process anything, you have to gather the data. Data collection means finding data that already exists, or recording fresh data from the right sources. The data you collect must be relevant and correct, because every later result depends on it. The NCERT grocery-store example lists three typical situations.
- Already digital: a CSV file, a spreadsheet or an existing database you can read directly.
- Recorded on paper: a diary or register that must first be typed into digital form.
- Captured fresh: a survey, a form, a questionnaire, or readings taken from a sensor or machine.
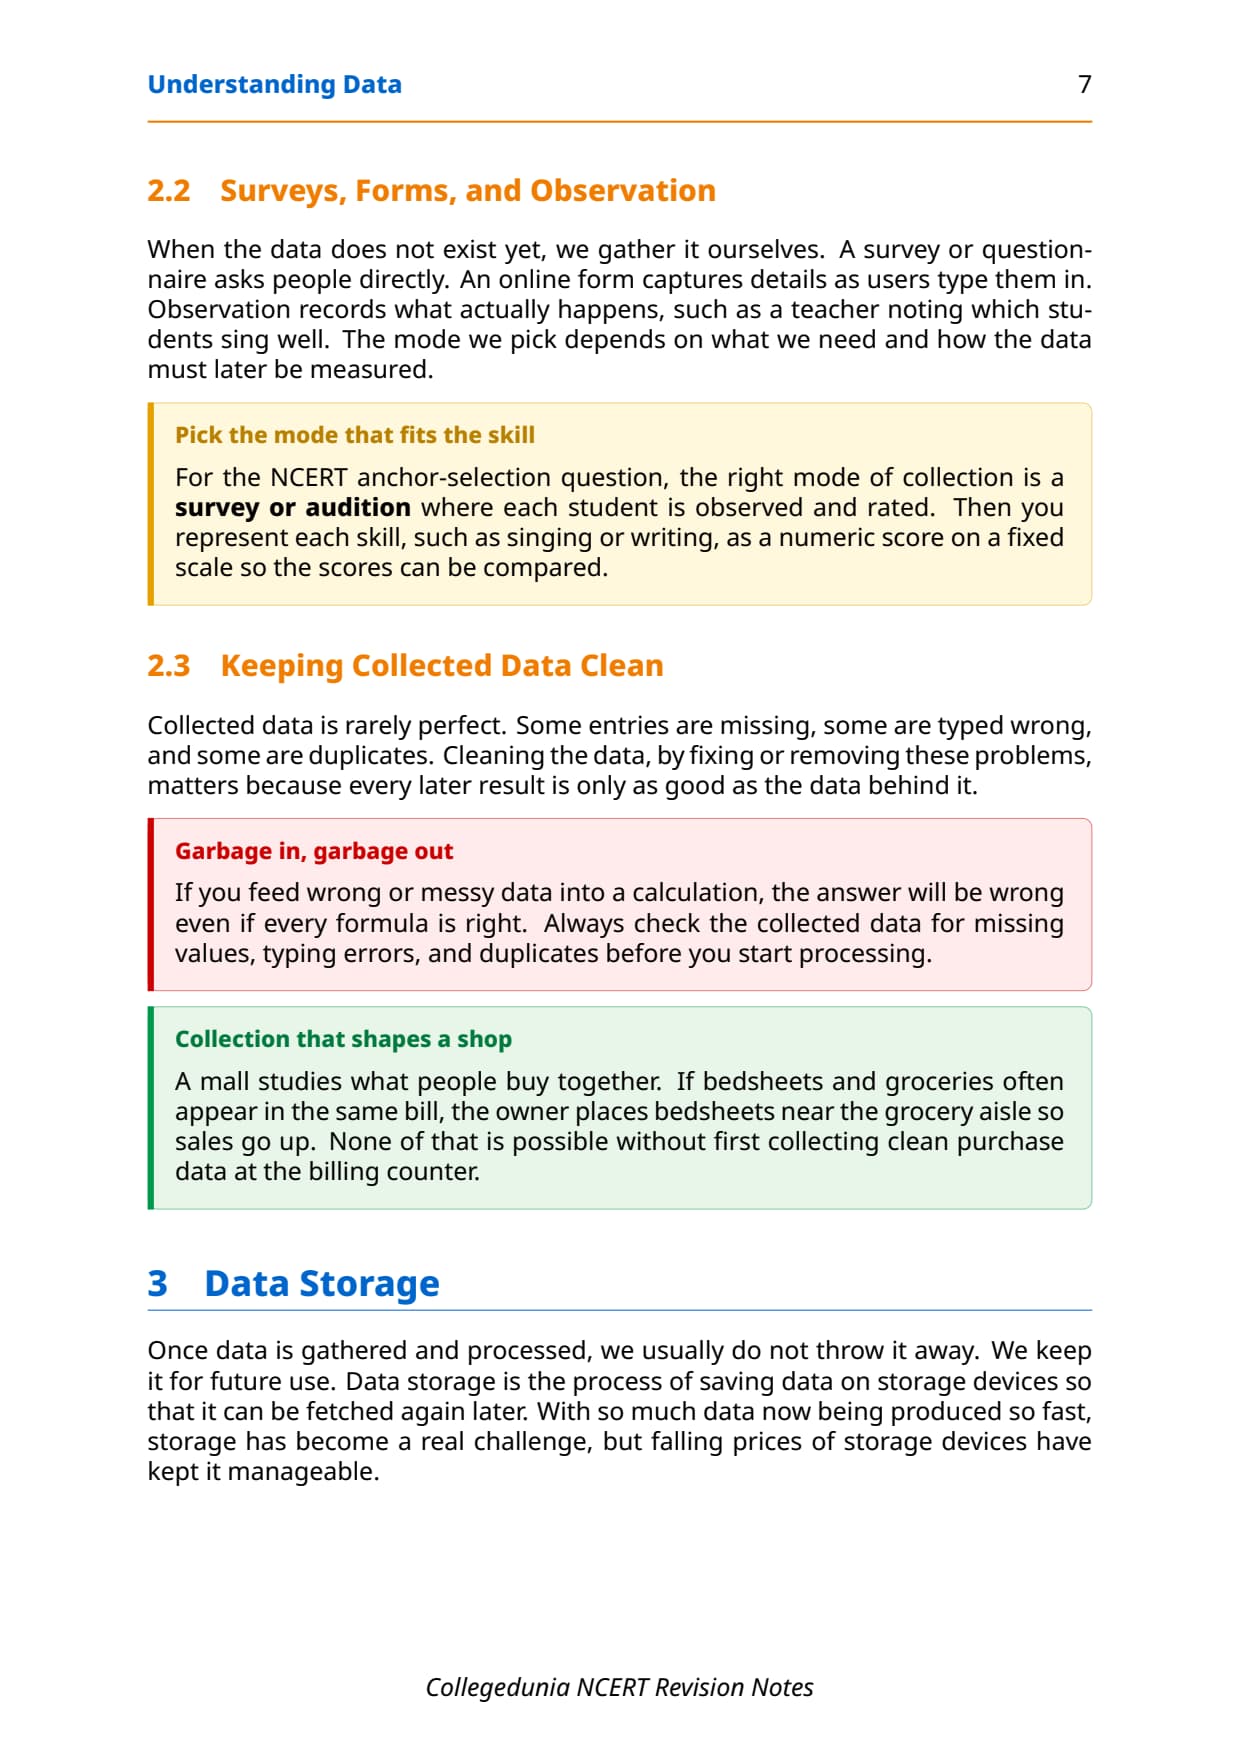
When data does not exist yet, you gather it yourself. A survey or questionnaire asks people directly, an online form captures details as users type them in, and observation records what actually happens, such as a teacher noting which students sing well. For the NCERT anchor-selection question, the right mode is a survey or audition where each student is observed and rated, and each skill is then written as a numeric score so the scores can be compared.
Collected data is rarely perfect. Some entries are missing, some are typed wrong, and some are duplicates. Cleaning the data, by fixing or removing these problems, matters because every later result is only as good as the data behind it. If you feed messy data into a calculation, the answer will be wrong even if every formula is right.
Data Storage Devices and the Limits of Files
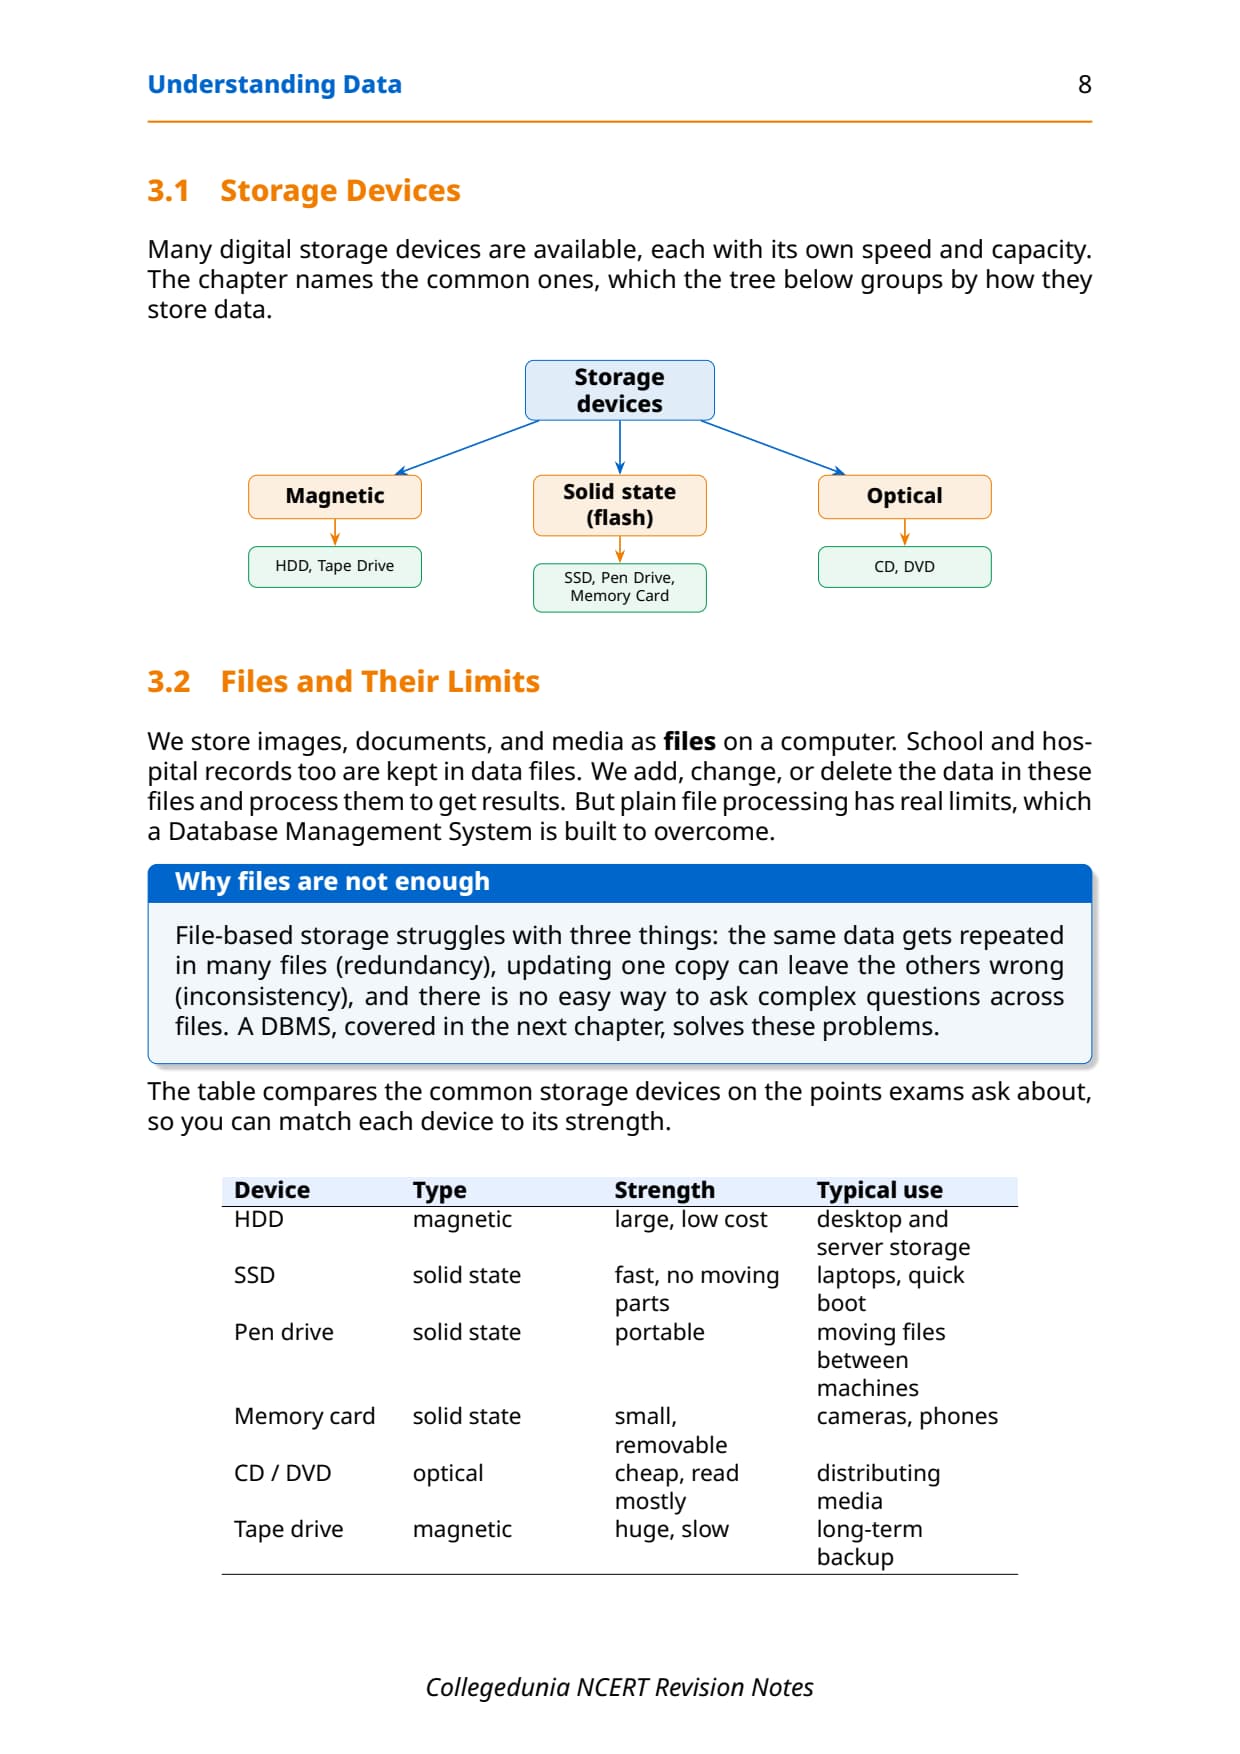
Once data is gathered and processed, you usually keep it for future use. Data storage is the process of saving data on storage devices so that it can be fetched again later. Storage devices fall into three families by how they store data, and each has its own speed and capacity.
| Device | Type | Strength | Typical use |
|---|---|---|---|
| HDD | Magnetic | Large, low cost | Desktop and server storage |
| SSD | Solid state | Fast, no moving parts | Laptops, quick boot |
| Pen drive | Solid state | Portable | Moving files between machines |
| Memory card | Solid state | Small, removable | Cameras, phones |
| CD / DVD | Optical | Cheap, read mostly | Distributing media |
| Tape drive | Magnetic | Huge, slow | Long-term backup |
We store images, documents and records as files on a computer. School and hospital records too are kept in data files. But plain file processing has real limits, which a Database Management System is built to overcome. File-based storage repeats the same data across many files (redundancy), an update can leave copies disagreeing (inconsistency), and there is no easy way to ask complex questions across files. The DBMS chapter then shows how a database removes each problem.
Data Processing and the Input Processing Output Cycle
We care about data because it holds facts that help us decide, but staring at a huge dataset tells us nothing. Data must be processed into a result, and only after studying that result do we reach a conclusion. Data processing follows a simple cycle: take in the data, work on it, and produce the result.
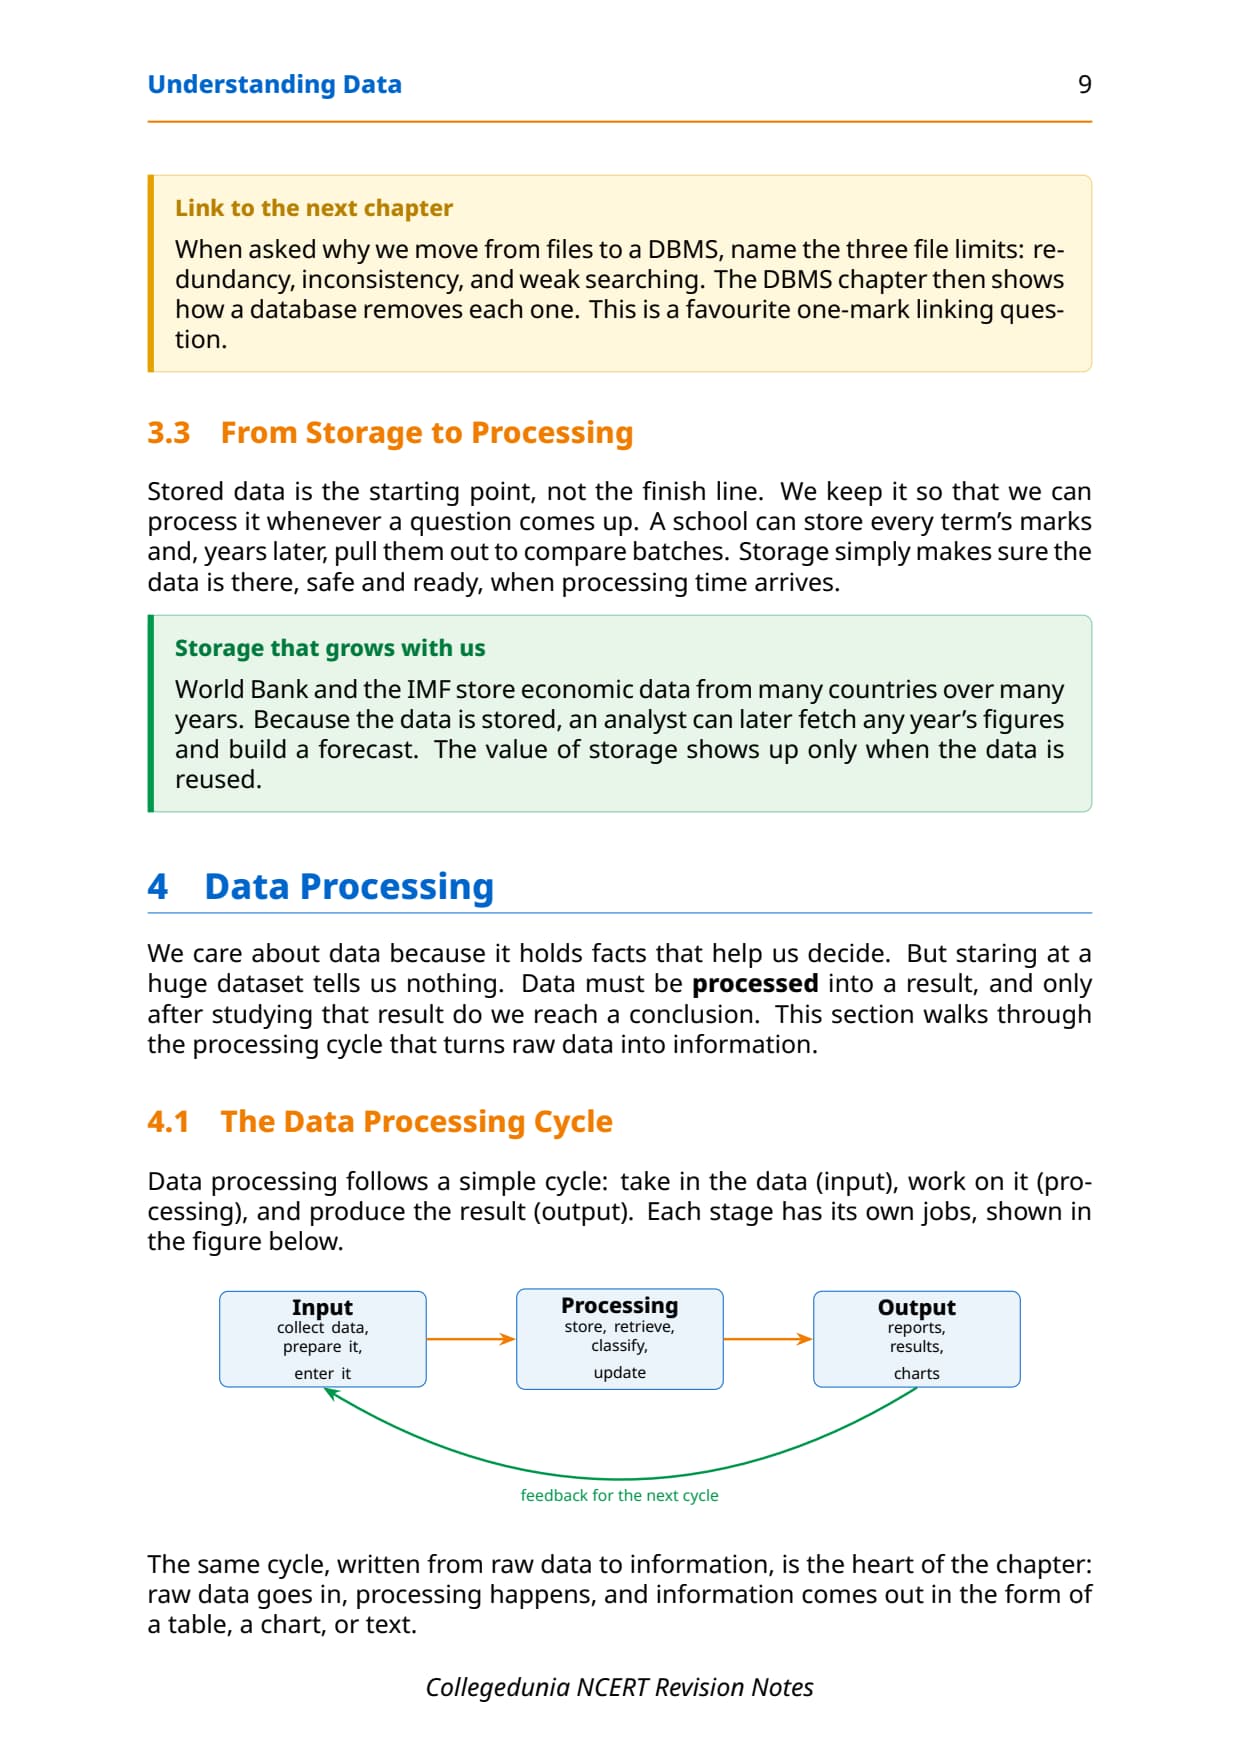
- Input: collect the data, prepare it, and enter it into the system.
- Processing: store, retrieve, classify, sort, filter and update the data.
- Output: produce reports, results, tables and charts that a person can read.
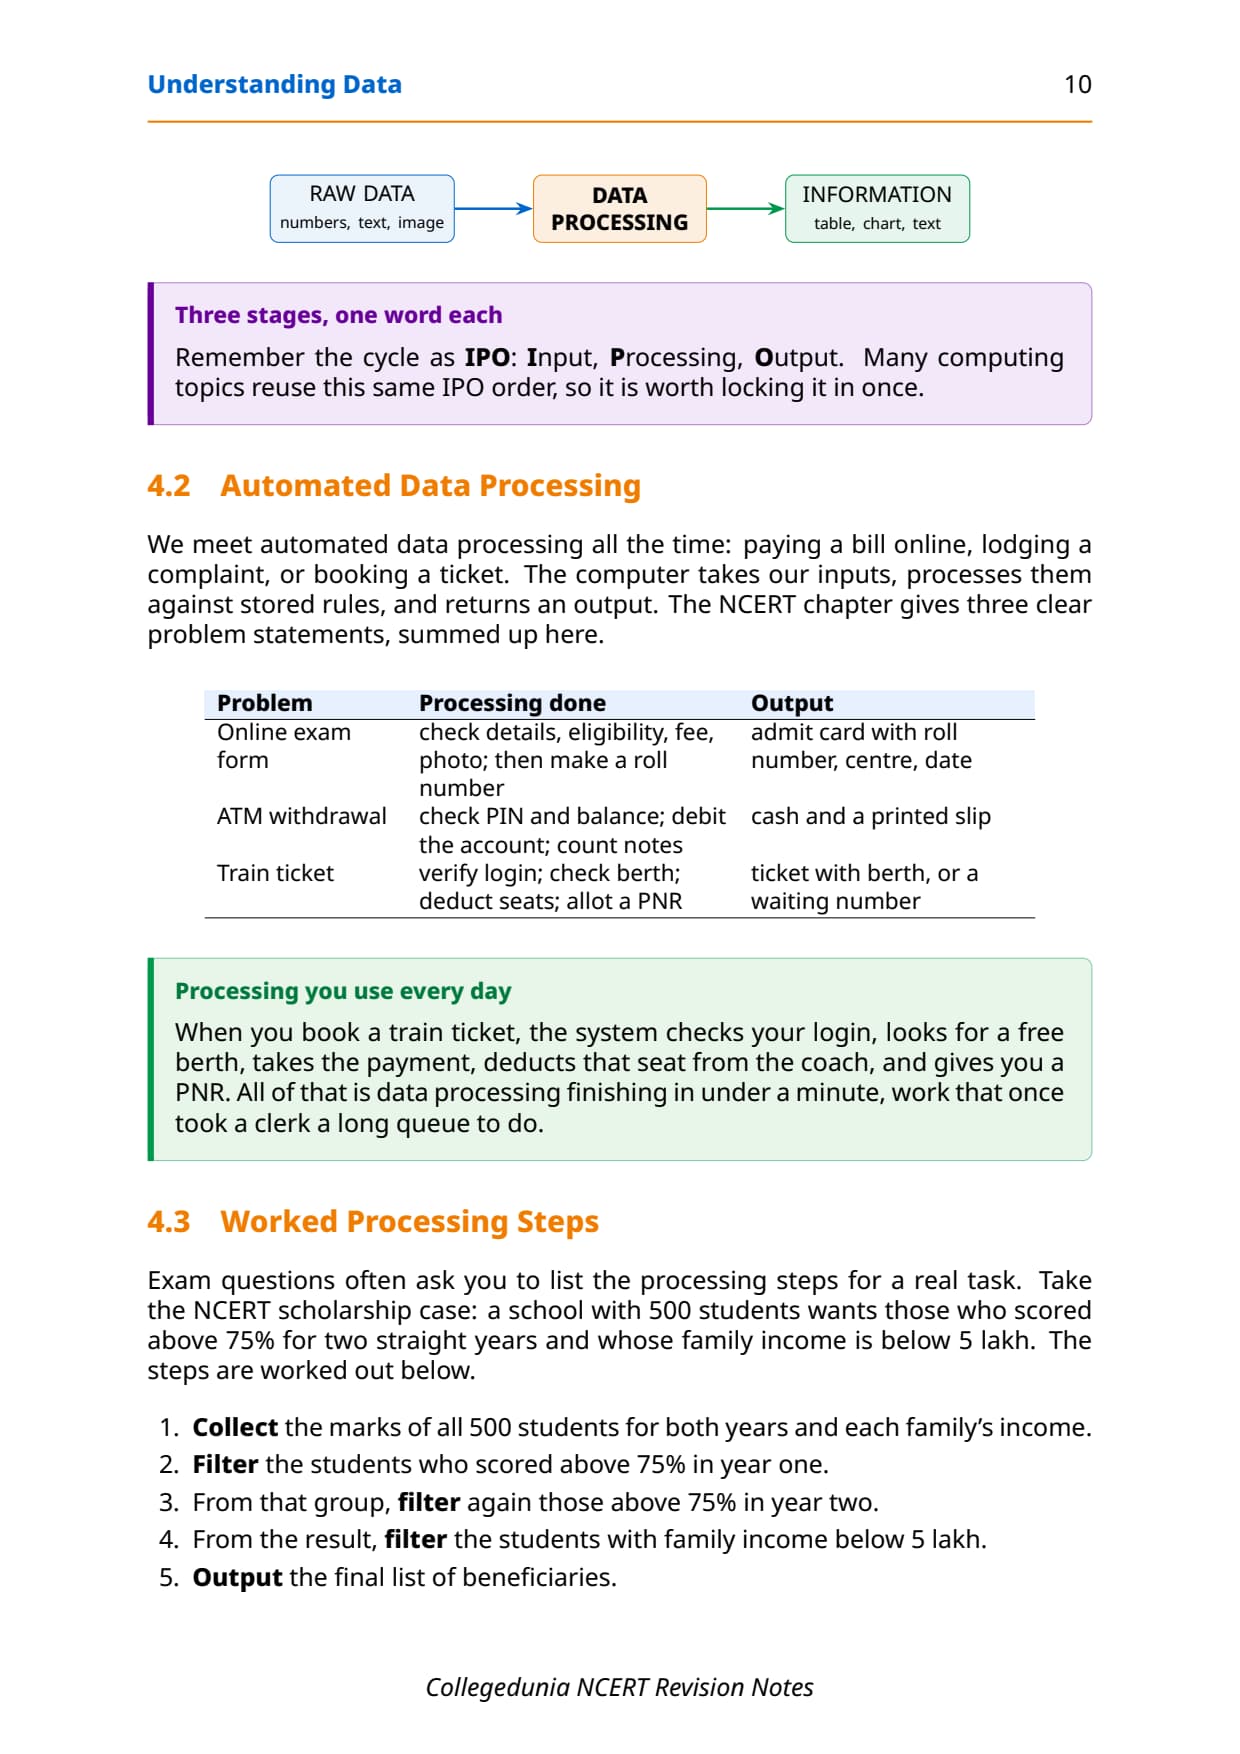
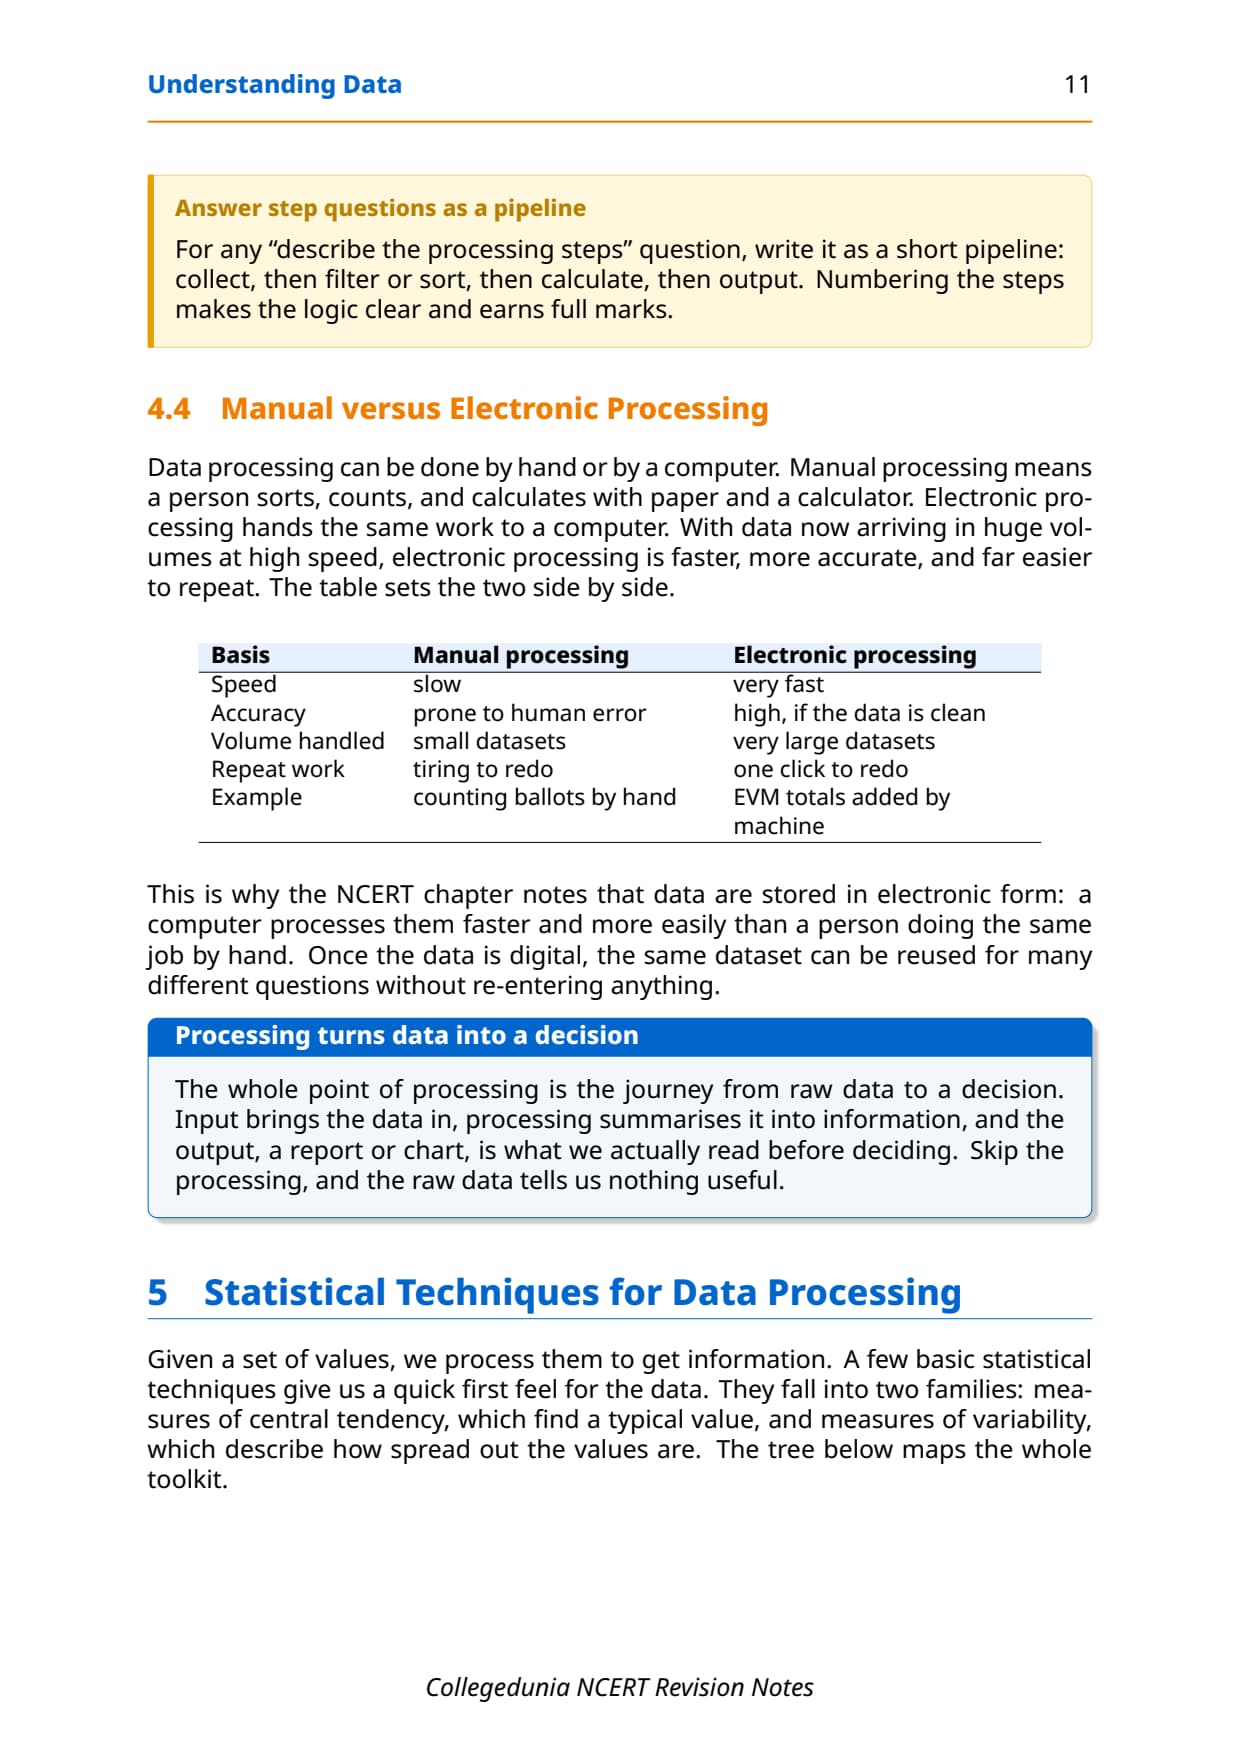
Remember this as IPO: Input, Processing, Output. Many computing topics reuse the same order. Automated data processing is everywhere: paying a bill online, booking a ticket, or withdrawing cash. The system takes your inputs, processes them against stored rules, and returns an output, work that once took a clerk a long queue to do.
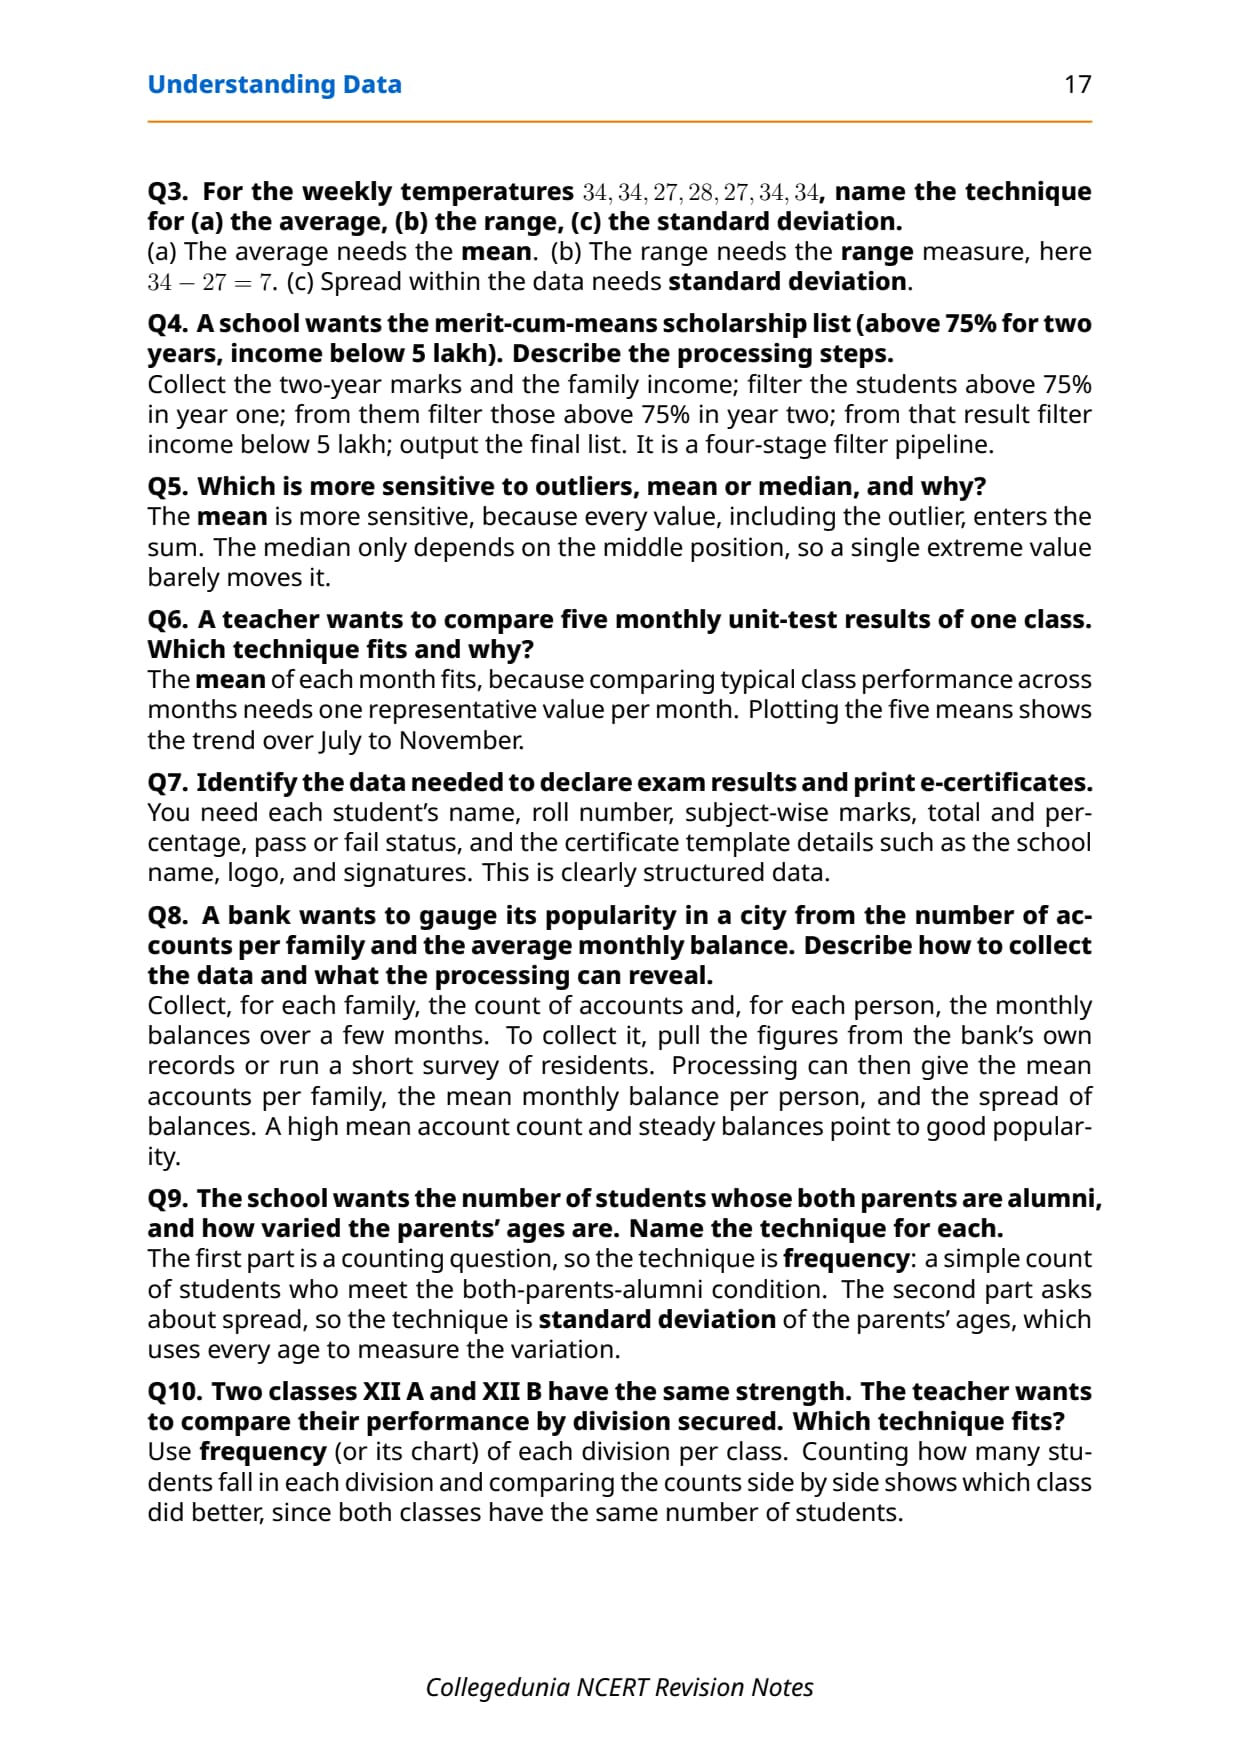
Exam questions often ask you to list the processing steps for a real task. Take the NCERT scholarship case: a school with 500 students wants those who scored above 75% for two straight years and whose family income is below 5 lakh. The answer is a clean filter pipeline.
- Collect the two-year marks of all 500 students and each family's income.
- Filter the students who scored above 75% in year one.
- From that group, filter again those above 75% in year two.
- From the result, filter the students with family income below 5 lakh.
- Output the final list of beneficiaries.
For students who like to see the same idea in code, a worked pipeline on a small list of student records reads exactly like the steps above. The filter conditions chain one after another, and only the rows that pass every check survive to the output list:
# students: list of (name, year1%, year2%, family_income)
students = [
    ("Asha", 82, 78, 410000),
    ("Ravi", 71, 90, 350000),
    ("Mira", 88, 80, 620000),
]

beneficiaries = []
for name, y1, y2, income in students:
    if y1 > 75 and y2 > 75 and income < 500000:
        beneficiaries.append(name)

print(beneficiaries)['Asha']Statistical Techniques: Mean, Median, Mode and Range in Class 12 Computer Science
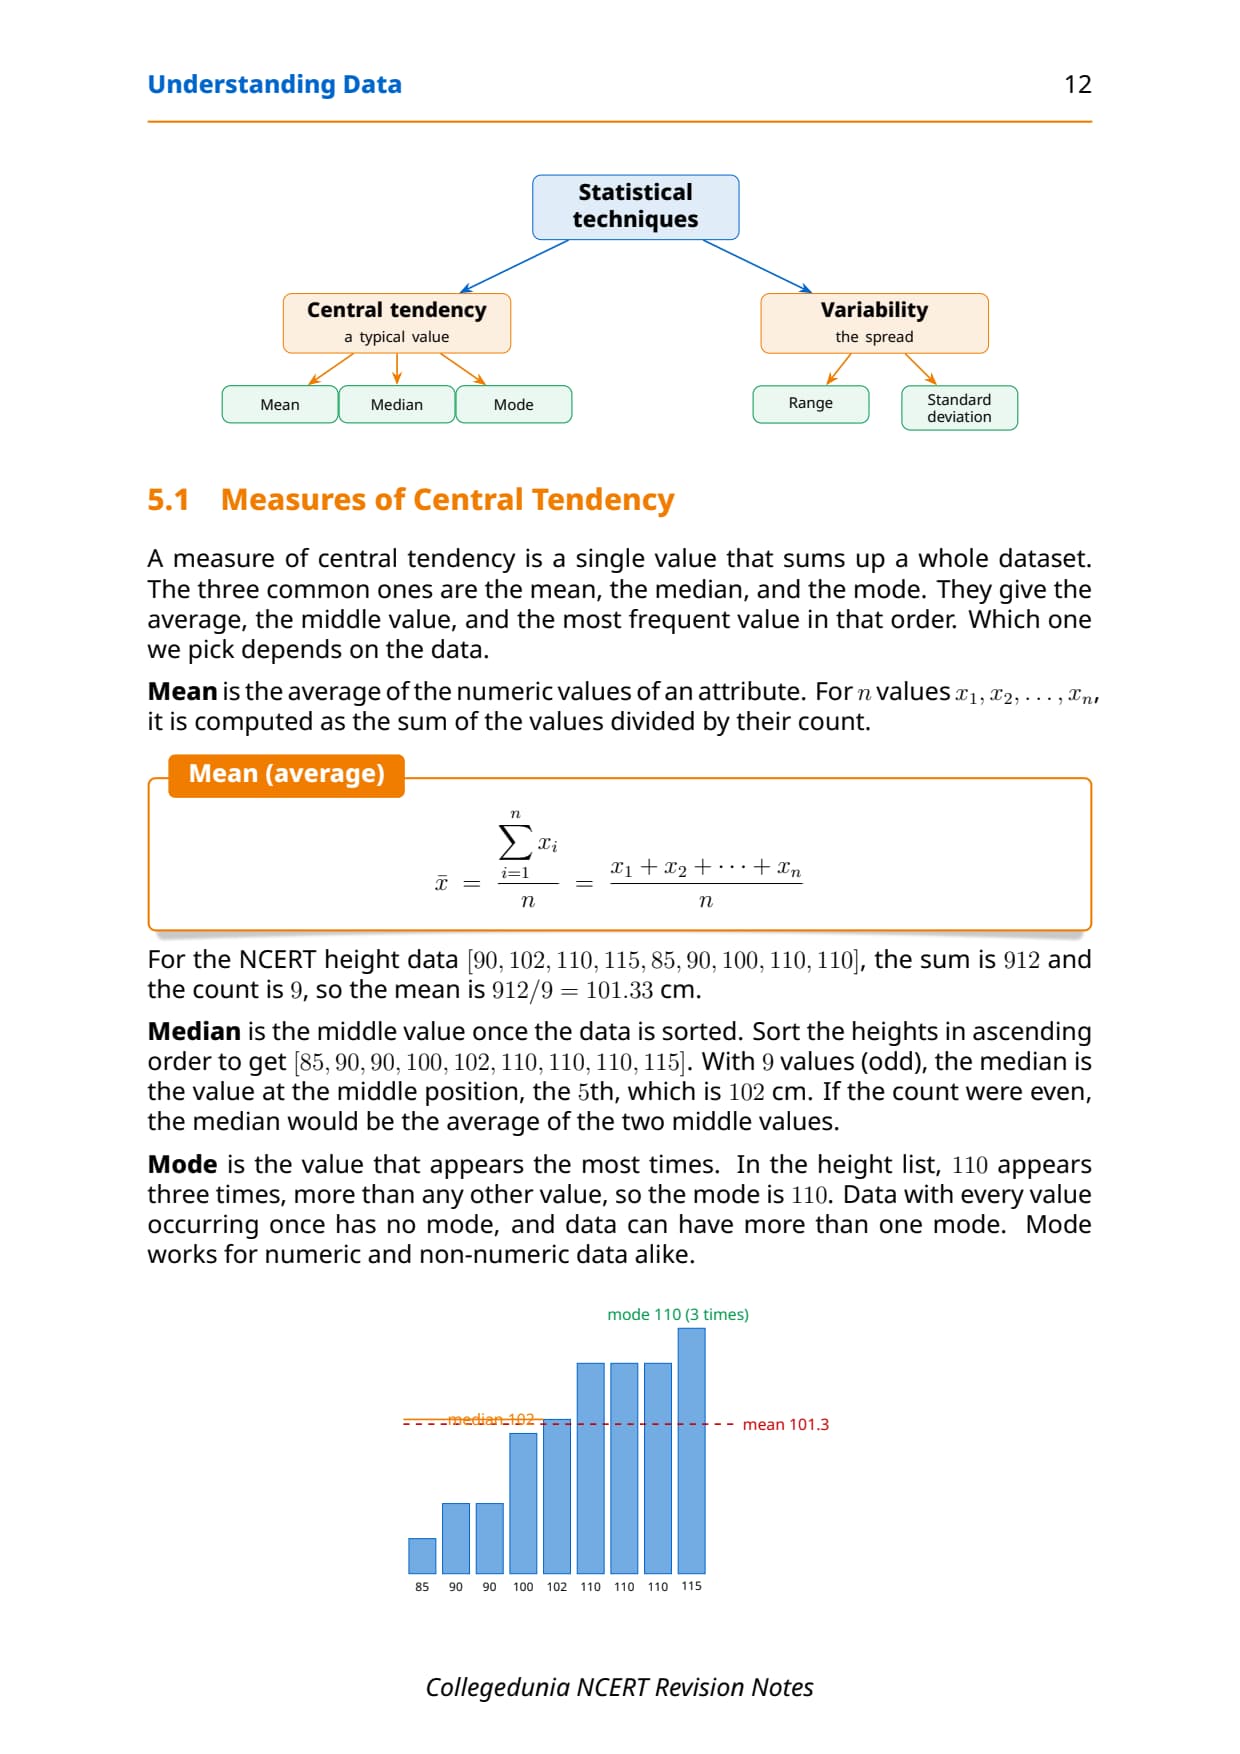
Given a set of values, we process them to get information. A few basic statistical techniques give a quick first feel for the data. They fall into two families: measures of central tendency, which find a typical value, and measures of variability, which describe how spread out the values are.
- Mean: the average, the sum of the values divided by their count.
- Median: the middle value once the data is sorted.
- Mode: the value that appears the most times.
- Range: the largest value minus the smallest value.
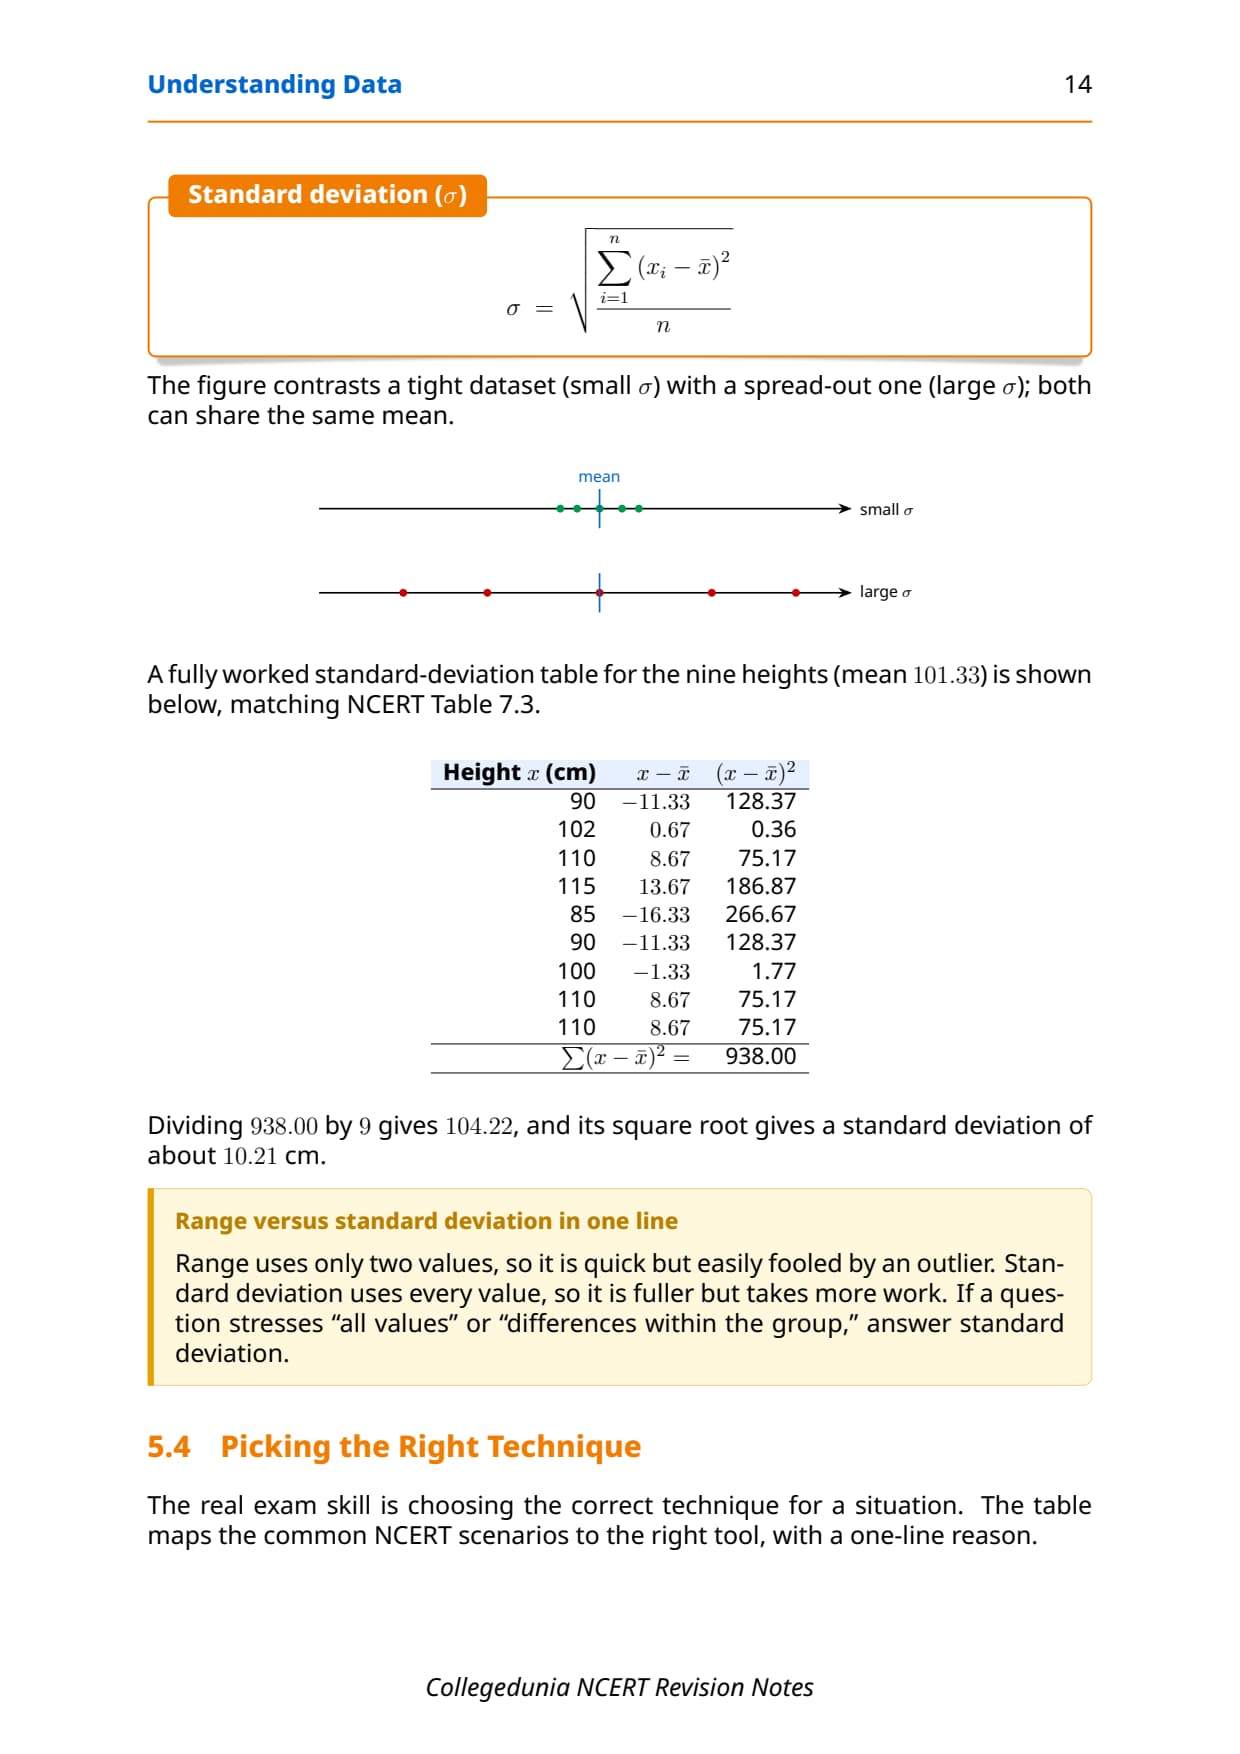
- Standard deviation: the spread of every value around the mean.
Work each one on the NCERT height data [90, 102, 110, 115, 85, 90, 100, 110, 110]. The sum is 912 over 9 values, so the mean is 912 / 9 = 101.33 cm. Sorting gives [85, 90, 90, 100, 102, 110, 110, 110, 115], so the median (the 5th of 9 values) is 102 cm. The value 110 appears three times, so the mode is 110. The range is 115 − 85 = 30 cm.
| Measure | What it finds | Formula in words | For the height data |
|---|---|---|---|
| Mean | The average value | Sum of values / count | 912 / 9 = 101.33 cm |
| Median | The middle value | Middle of sorted data | 102 cm |
| Mode | The most frequent value | Highest frequency | 110 (3 times) |
| Range | The spread, simply | Maximum − Minimum | 115 − 85 = 30 cm |
| Standard deviation | The spread, using all values | Root of mean squared difference | about 10.21 cm |
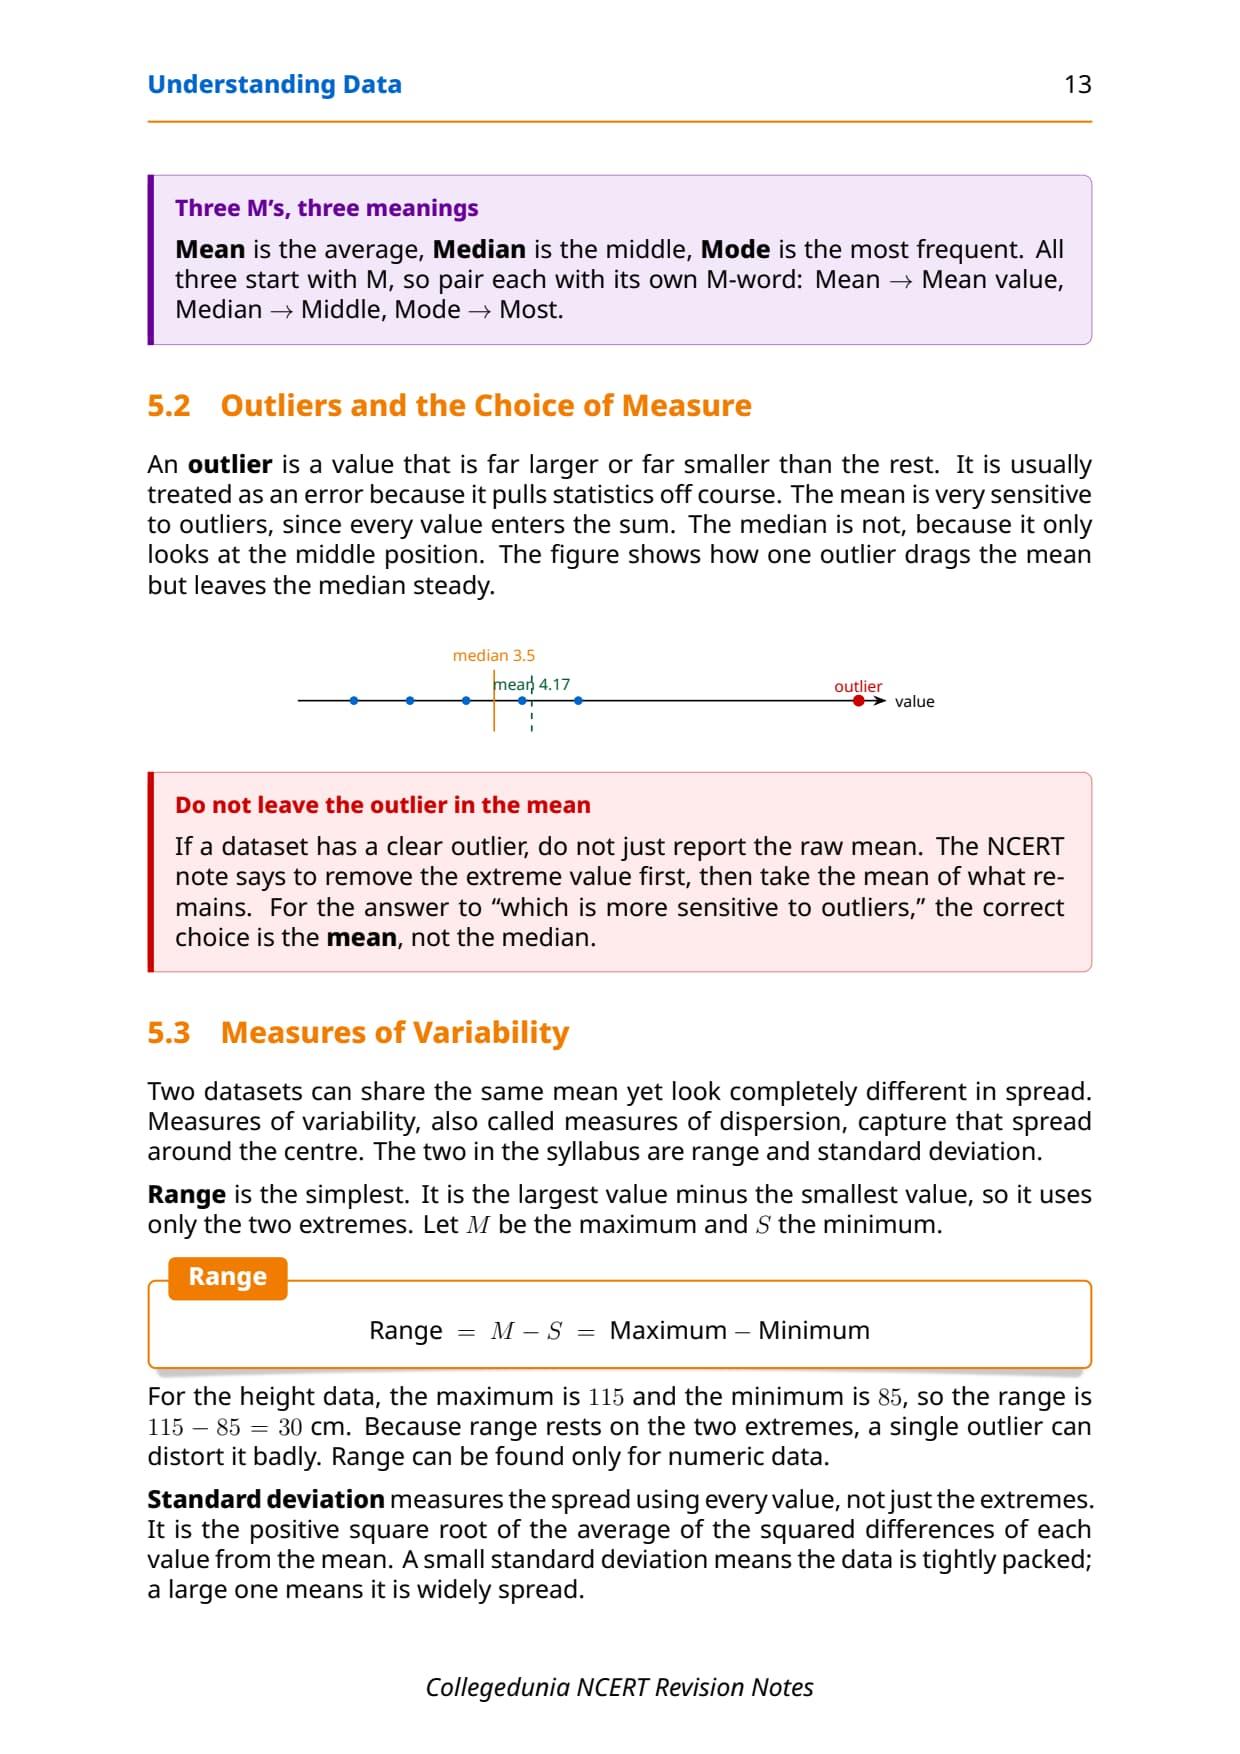
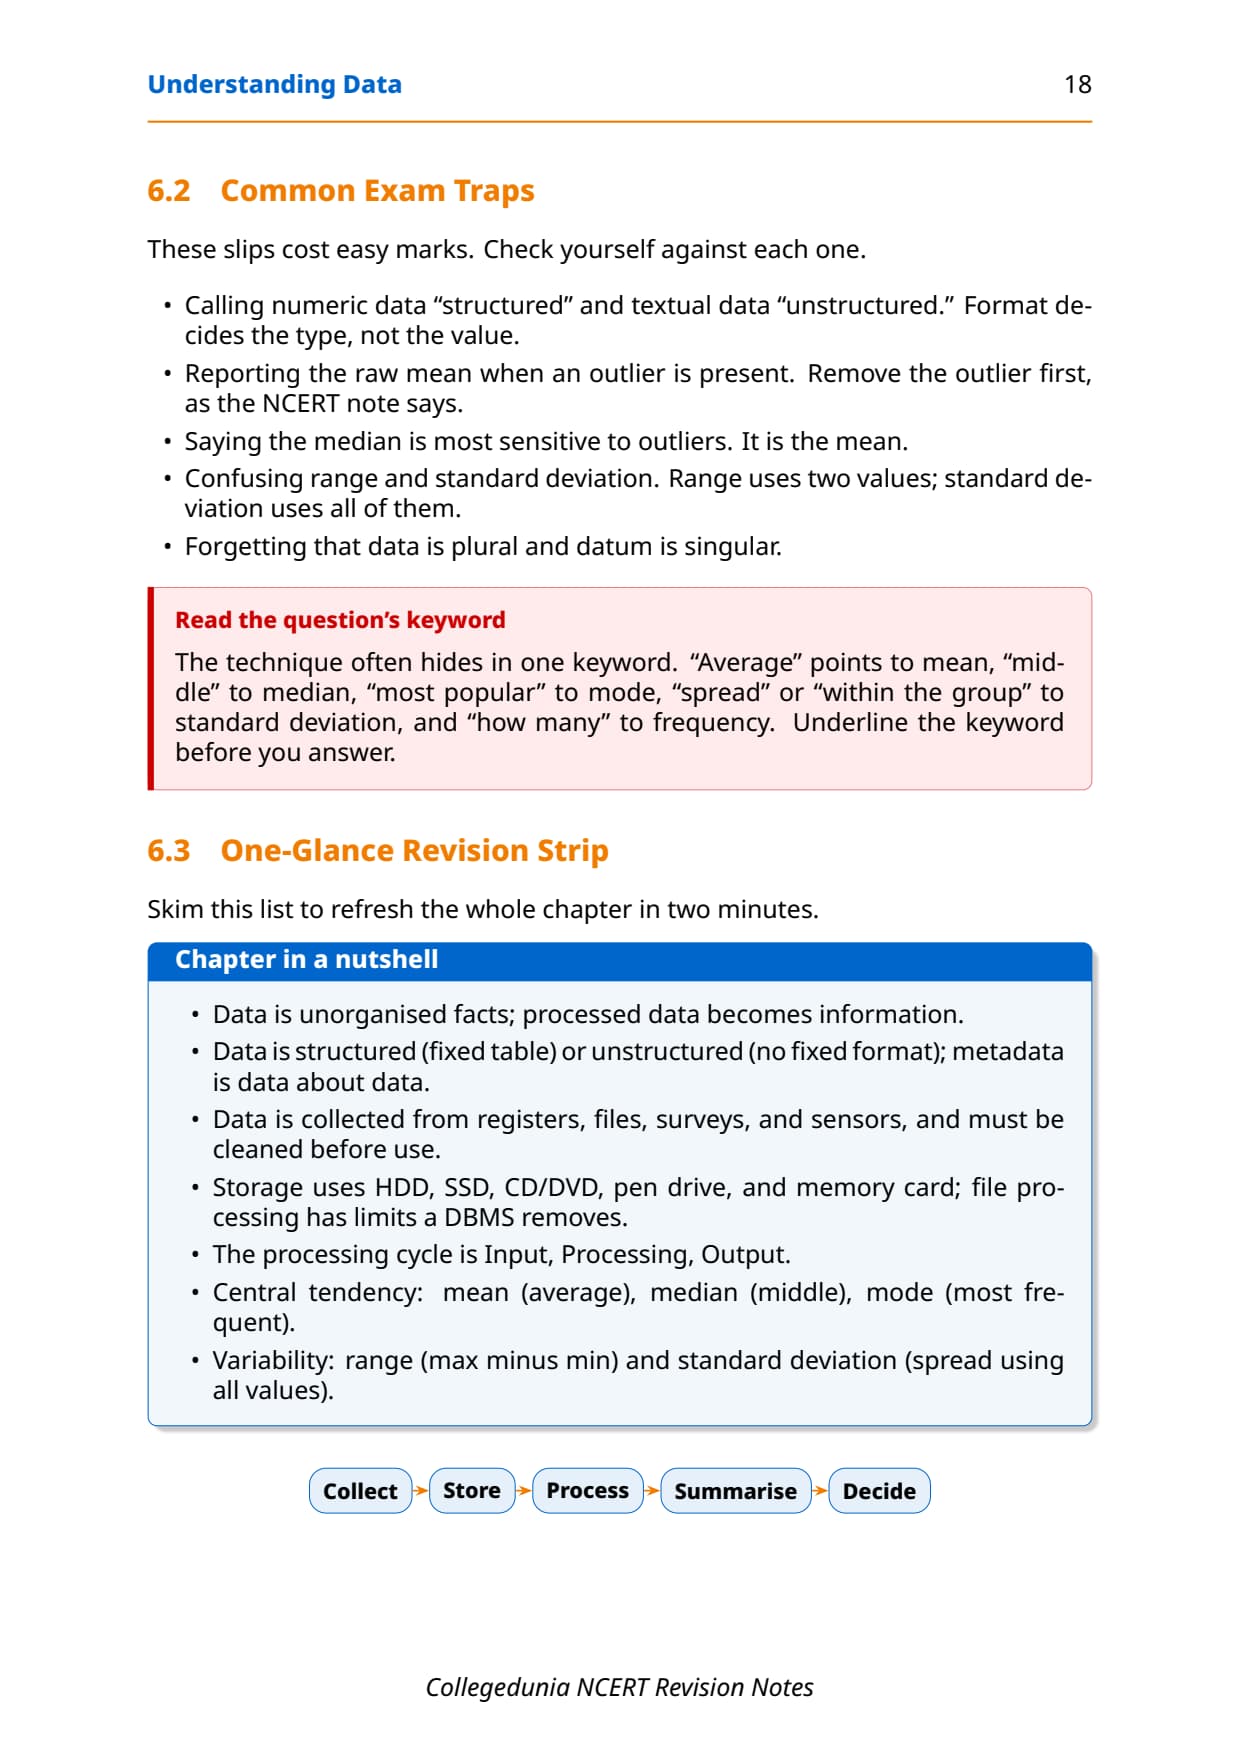
An outlier is a value far larger or far smaller than the rest, and it is usually treated as an error. The mean is very sensitive to outliers, because every value enters the sum, while the median is not, because it only looks at the middle position. The NCERT note says to remove an extreme value first, then take the mean of what remains.
Picking the Right Technique and Common Exam Traps
The real exam skill is choosing the correct technique for a worded situation. Most students lose marks here, not on the arithmetic. The technique usually hides in one keyword, so underline it before you answer. The table maps the common NCERT scenarios to the right tool, with a one-line reason.
| Scenario | Technique | Why |
|---|---|---|
| Average performance of a class in a test | Mean | A single typical value |
| Most popular car colour after a survey | Mode | Most frequent value |
| Range of weekly temperature | Range | Maximum minus minimum |
| Spread of parents' ages | Standard deviation | Variation across the group |
| How many students meet a condition | Frequency | A simple count of matching cases |
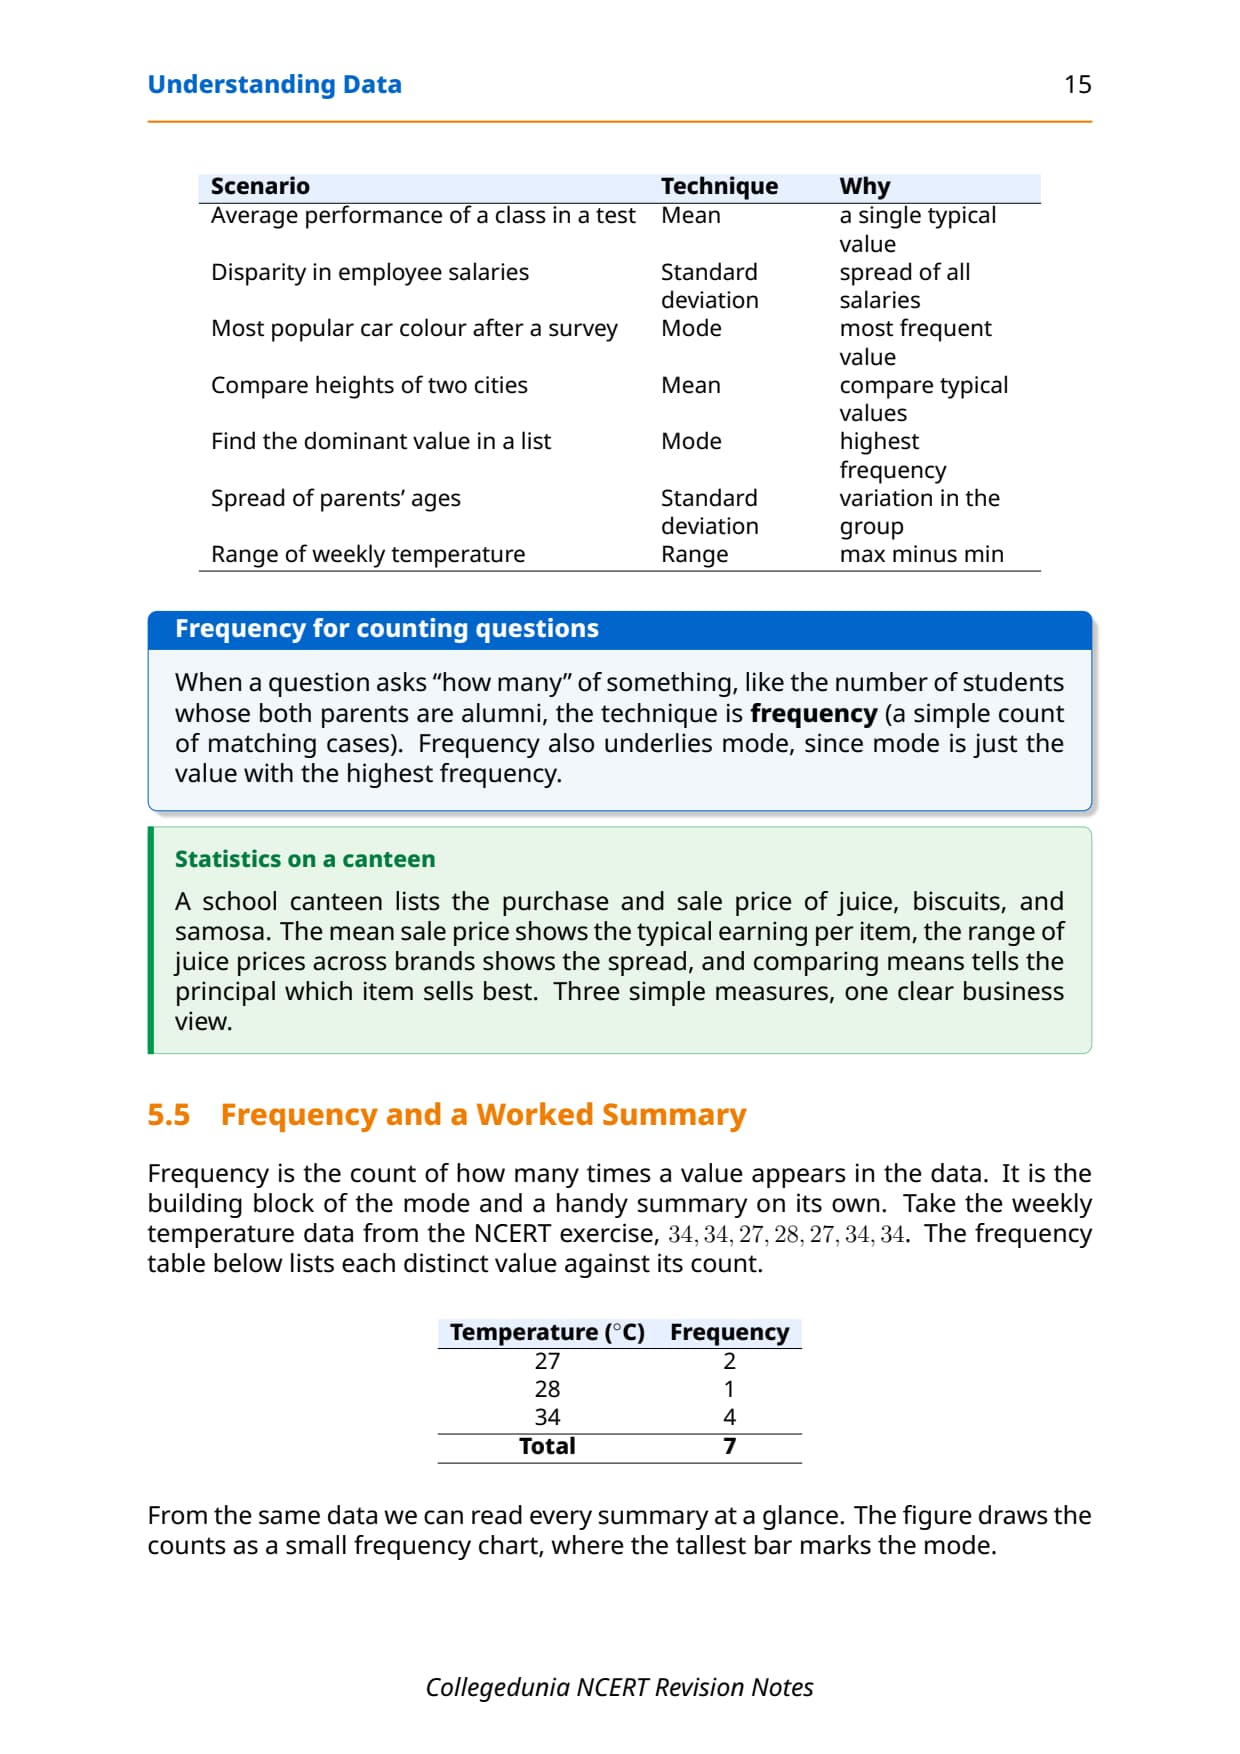
When a question asks "how many" of something, like the number of students whose both parents are alumni, the technique is frequency, a simple count of matching cases. Frequency also underlies mode, since mode is the value with the highest frequency. Apply this to the weekly temperatures 34, 34, 27, 28, 27, 34, 34: the frequency of 34 is 4, so the mode is 34, the mean is 218 / 7 = 31.14, and the range is 34 − 27 = 7.
The repeat-offender mistakes in Understanding Data board answers:
- Calling numbers structured and words unstructured: format decides the type, not the value.
- Reporting the raw mean with an outlier present: remove the extreme value first, as the NCERT note says.
- Saying the median is most sensitive to outliers: it is the mean that is sensitive, not the median.
- Confusing range and standard deviation: range uses two values, standard deviation uses all of them.
- Forgetting that data is plural: the singular form is datum.
How to Use the Understanding Data Notes PDF for Board Revision
Understanding Data is a short but concept-heavy chapter with no long programs to memorise. The best approach is two passes: one for the definitions and the data ladder, one for the statistical techniques and the keyword-to-technique mapping.
First pass: definitions and the data ladder
Read these notes and lock the labels: data, information, knowledge, structured, unstructured, metadata, and the IPO cycle. Say one line of meaning aloud for each so the words stick. Pay special attention to the difference between structured and unstructured data, the single most asked idea in this chapter.
Second pass: statistics and keyword mapping
Work the mean, median, mode, range and standard deviation on the NCERT height data by hand. Then drill the keyword table until "average" instantly means mean, "spread" means standard deviation, and "how many" means frequency. That single skill covers most of the marks the chapter carries.
JEE and CUET angle
For students preparing competitive exams, data handling and basic statistics appear in CUET Computer Science and in the general aptitude rounds of many tests. Mean, median, mode and the structured-versus-unstructured idea are exactly the kind of concept questions those papers reuse, so this revision doubles as competitive prep.
Previous Year Question Trends from the Understanding Data Chapter
The Understanding Data chapter is tested in CBSE board papers mainly through definition, type-identification and technique-choice questions, with a short processing-steps question. The table below maps the asked question types across recent board papers, so your revision can target the high-frequency areas.
| Year | Question type asked | Marks |
|---|---|---|
| 2025 | Differentiate structured and unstructured data with an example | 2 |
| 2024 | Identify the type of data in given scenarios; define metadata | 2 + 1 |
| 2023 | Name the statistical technique for given situations with reason | 3 |
| 2022 | Describe the data processing steps for a worded task | 3 |
| 2021 | Find the mean, median and mode of a small dataset | 2 + 2 |
Also Check: The full set of CBSE board paper questions for this chapter, with step-by-step answers, is included in the downloadable PDF above, updated for the 2026-27 cycle.
Other Resources for Class 12 Computer Science Chapter 7 Understanding Data
Pair these revision notes with the matching NCERT Solutions, handwritten notes and the official NCERT book chapter. All resources for Class 12 Computer Science Chapter 7 Understanding Data are linked below.
| Resource | What it covers | Open |
|---|---|---|
| Notes | Concept-first revision notes on data versus information, structured versus unstructured data, collection, storage, processing and statistics. | You are here |
| NCERT Solutions | Step-by-step answers to all exercise questions, with an Expert Solution for each. | Class 12 Computer Science Chapter 7 NCERT Solutions |
| Handwritten Notes | Scanned-style handwritten pages for last-minute board revision. | Class 12 Computer Science Chapter 7 Handwritten Notes |
| NCERT Book PDF | Official NCERT Computer Science Chapter 7 Understanding Data textbook in PDF form. | Class 12 Computer Science Chapter 7 NCERT Book PDF |
Notes for Class 12 Computer Science: All Chapters
Related Links: Use the table below to open the revision notes for the other chapters of Class 12 Computer Science, including the previous chapter Searching and the next chapter Database Concepts. Every chapter ships with the same concept-first notes style, full PDF download, and revision FAQ.
| Chapter | Notes link |
|---|---|
| Chapter 1 | Exception Handling in Python Notes |
| Chapter 2 | File Handling in Python Notes |
| Chapter 3 | Stack Notes |
| Chapter 4 | Queue Notes |
| Chapter 5 | Sorting Notes |
| Chapter 6 | Searching Notes |
| Chapter 7 | Understanding Data Notes (You are here) |
| Chapter 8 | Database Concepts Notes |
| Chapter 9 | Structured Query Language (SQL) Notes |
| Chapter 10 | Computer Networks Notes |
| Chapter 11 | Data Communication Notes |
| Chapter 12 | Security Aspects Notes |
Notes Class 12 Computer Science Chapter 7 Understanding Data FAQs
Ques. What does Chapter 7 Understanding Data cover in Class 12 Computer Science?
Ans. Chapter 7 covers what data is and how raw data becomes information and then knowledge that supports a decision. The notes explain structured versus unstructured data with examples, metadata, how data is collected from registers, files, surveys and sensors, how it is cleaned, where it is stored on devices such as HDD, SSD and pen drives, and the limits of file-based storage. They also cover the Input-Processing-Output data processing cycle and the basic statistical techniques mean, median, mode, range and standard deviation, all aligned with the 2026-27 CBSE syllabus.
Ques. What is the difference between structured and unstructured data?
Ans. Structured data is organised in a fixed row-and-column format, where each column holds one attribute and each row holds one observation, such as a student marks table or an inventory table. It is easy to query and summarise. Unstructured data has no fixed format and is harder to process directly, such as emails, images, audio, video, web pages and social-media posts. The deciding factor is the format, not whether the data is numeric or textual, so a table of names and addresses is still structured even though it is full of text.
Ques. What is the difference between data, information and knowledge?
Ans. Data is a collection of unorganised raw facts, figures and symbols, such as the heights 90, 102 and 110, which carry no conclusion on their own. Information is the result of processing that data, such as the average height 101.33 cm. Knowledge is the deeper understanding built from information through study and experience, such as the conclusion that the class is taller than last year, which can then drive a decision. The NCERT quote sums up the climb: data is not information, and information is not knowledge.
Ques. What is metadata in Class 12 Computer Science?
Ans. Metadata means data about data. It describes other data so the original can be found and understood. For an email, the subject, recipient, body and attachment fields are its metadata. For an image, the size in KB, the type such as JPEG or PNG, and the resolution are its metadata. Metadata is especially useful for describing unstructured data, which has no fixed format of its own, so the metadata gives it structure for searching and managing.
Ques. What is the data processing cycle?
Ans. The data processing cycle has three stages, remembered as IPO: Input, Processing and Output. In the Input stage the data is collected, prepared and entered. In the Processing stage the data is stored, retrieved, classified, sorted, filtered and updated. In the Output stage the result is produced as reports, tables and charts that a person can read. The output of one cycle can become feedback for the next cycle. The whole point is to turn raw data into information that supports a decision.
Ques. How do you choose between mean, median and mode?
Ans. All three are measures of central tendency, a single value that sums up a dataset. The mean is the average, the sum divided by the count, and it is best when you want a typical value but the data has no extreme outliers. The median is the middle value of the sorted data, and it is best when outliers are present because it is not pulled by extreme values. The mode is the most frequent value, and it is best for finding the most popular or common item, and it works for non-numeric data too. The keyword in the question usually points to the right one.
Ques. What is the difference between range and standard deviation?
Ans. Both are measures of variability that describe how spread out the data is. The range is the simplest, found as the maximum value minus the minimum value, so it uses only the two extremes and a single outlier can distort it badly. The standard deviation uses every value: it is the positive square root of the average of the squared differences of each value from the mean. A small standard deviation means the data is tightly packed and a large one means it is widely spread. If a question stresses all values or variation within the group, the answer is standard deviation.
Ques. How many pages is the Class 12th Computer Science Understanding Data Notes PDF?
Ans. The Understanding Data Notes PDF runs about 19 pages and covers the full chapter in concept-first revision blocks, with worked number examples, comparison tables, labelled diagrams of the data ladder and the IPO cycle, the statistical formulas, and a one-glance revision strip. The PDF is free to download for the 2026-27 session, and a green Handwritten Notes button on this page opens the scanned-style version for last-minute revision.
Ques. Are these Notes for Class 12 Computer Science Chapter 7 aligned with the 2026-27 syllabus?
Ans. Yes. This page reflects the current 2026-27 CBSE syllabus for Class 12 Computer Science. The Understanding Data chapter sits in the Database Management unit and leads into Database Concepts and SQL. These notes follow the NCERT textbook, covering data versus information, structured and unstructured data, data collection and cleaning, storage devices and file limits, the data processing cycle, and the statistical techniques mean, median, mode, range and standard deviation. The notes are useful for the CBSE board exam, and the same ideas help with CUET Computer Science and JEE-level aptitude questions.



Comments