



Market Equilibrium is the last chapter of the Class 12 Microeconomics book (Chapter 5 in the micro book). It explains how demand and supply set the price, and what price ceilings and price floors do. This page has the full revision notes and a free PDF to download.
Here is what this chapter is worth in the exam:
- CBSE Boards: about 8 to 10 marks across theory, shifts and price controls.
- CUET: 2 to 3 questions every year on equilibrium and price controls.
- Revision time: about 35 minutes with these notes.
What These Market Equilibrium Class 12 Notes Cover
The chapter puts demand and supply on one diagram and asks what price clears the market. That price is the equilibrium price, where quantity demanded equals quantity supplied. These notes cover six topics:
- Equilibrium with fixed firms (short run): where market demand meets market supply.
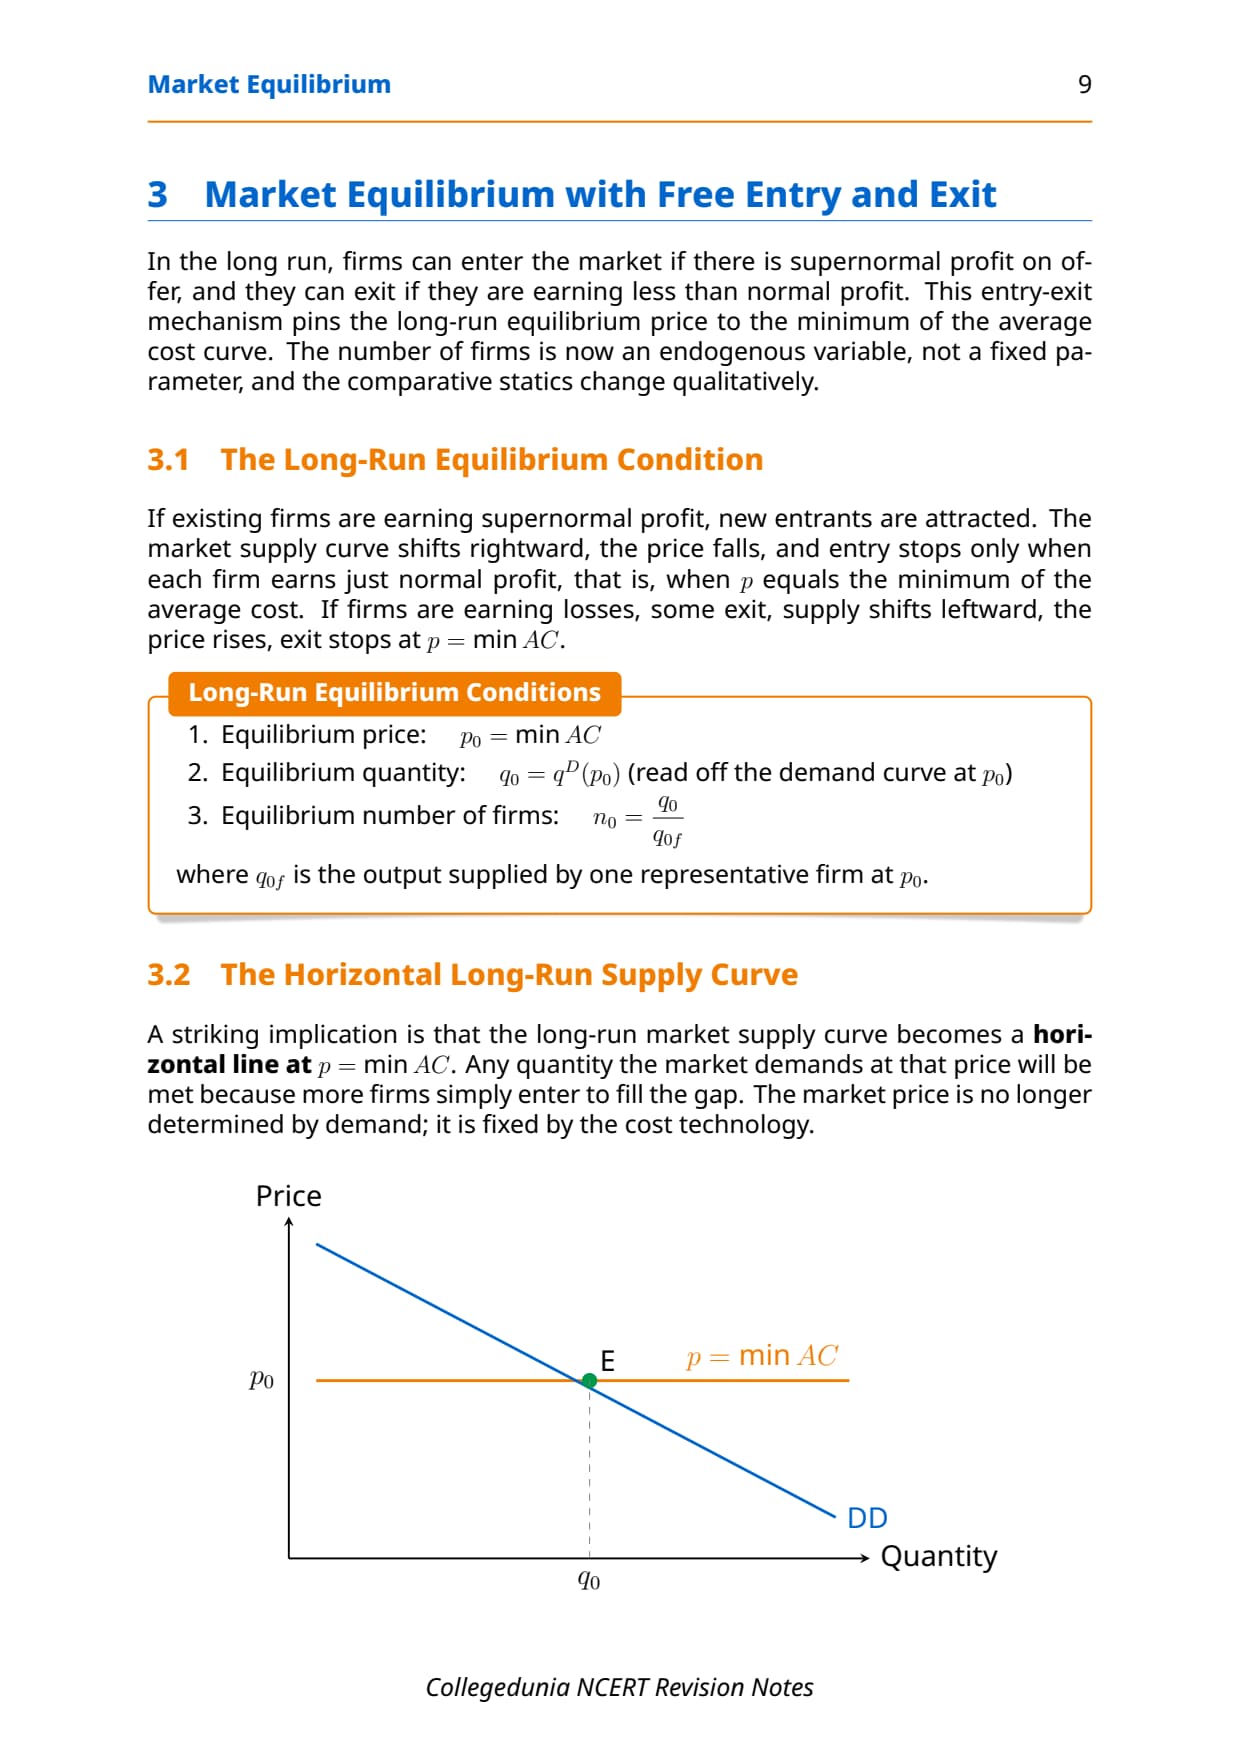
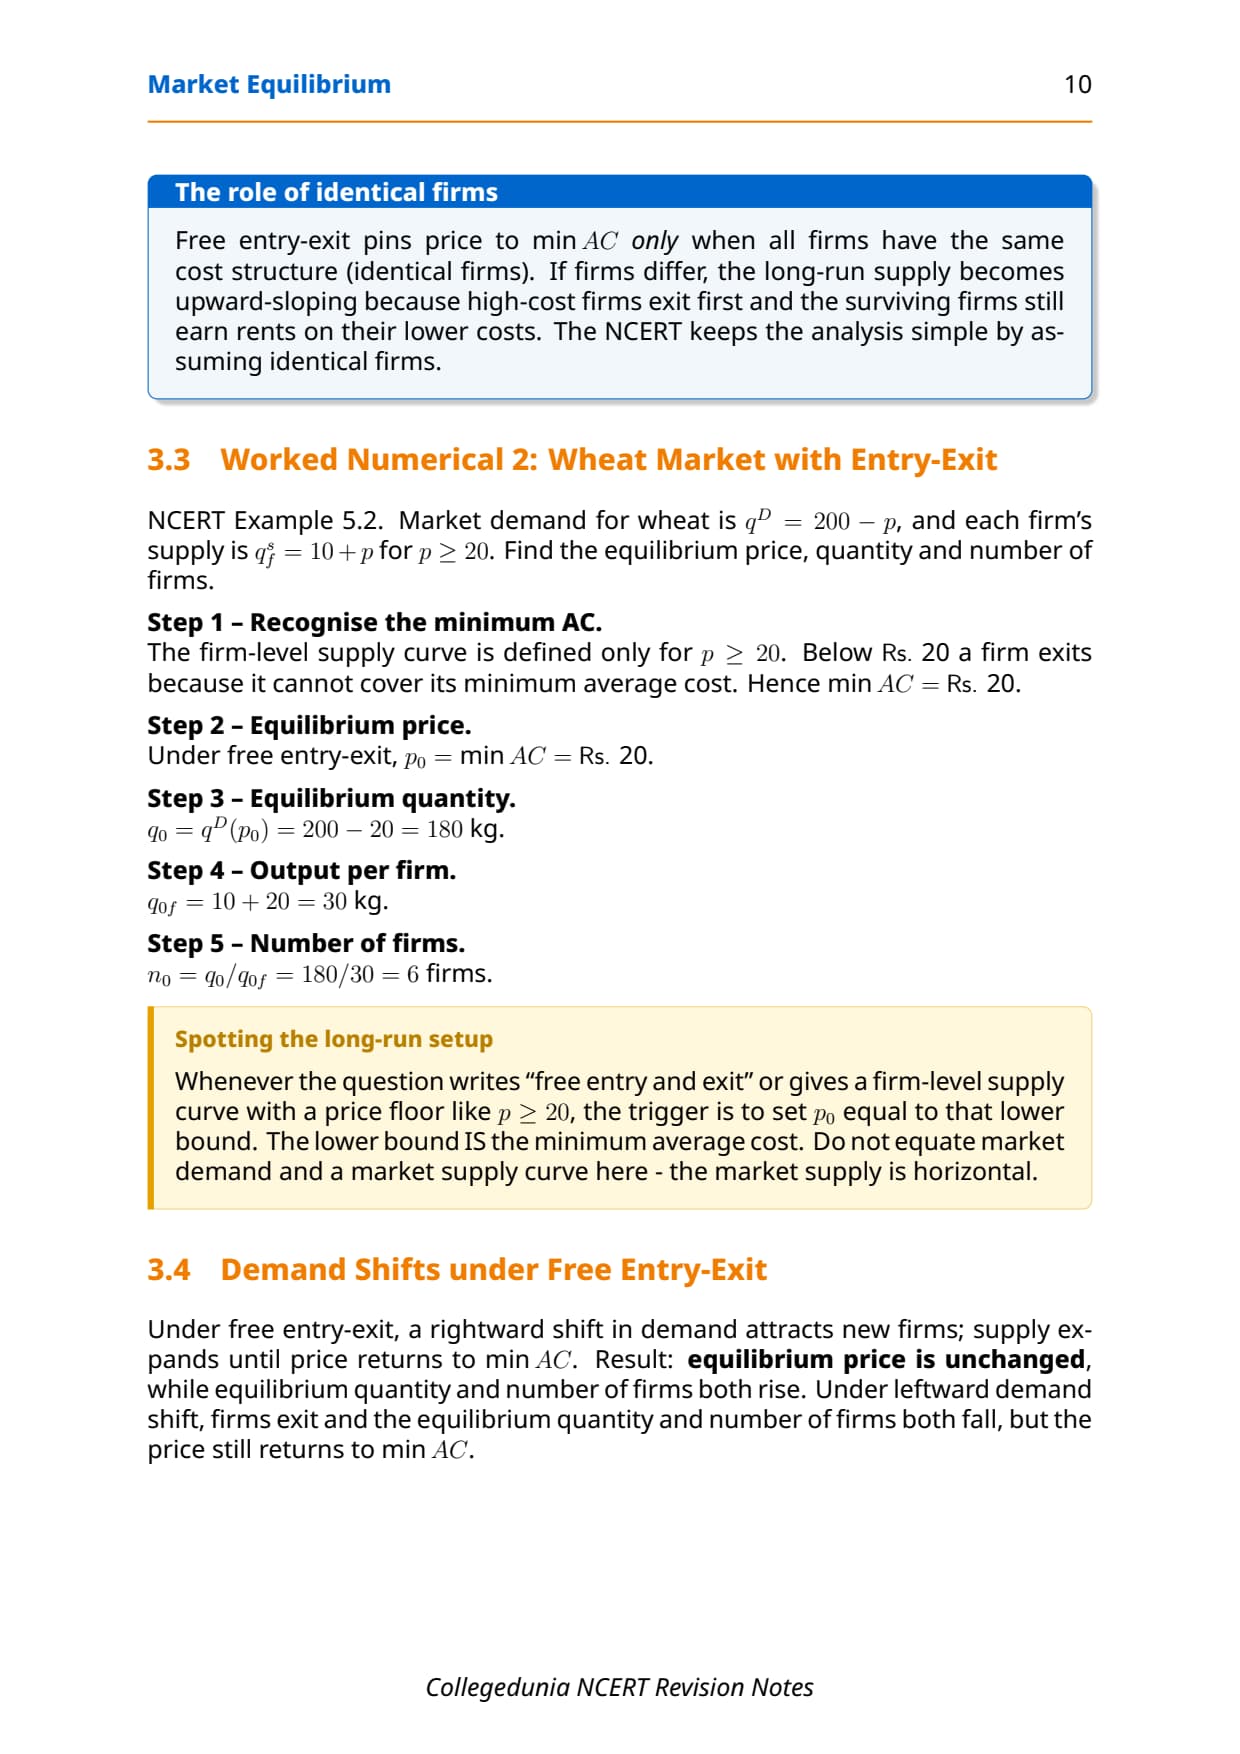
- Equilibrium with free entry and exit (long run): the zero-profit case.
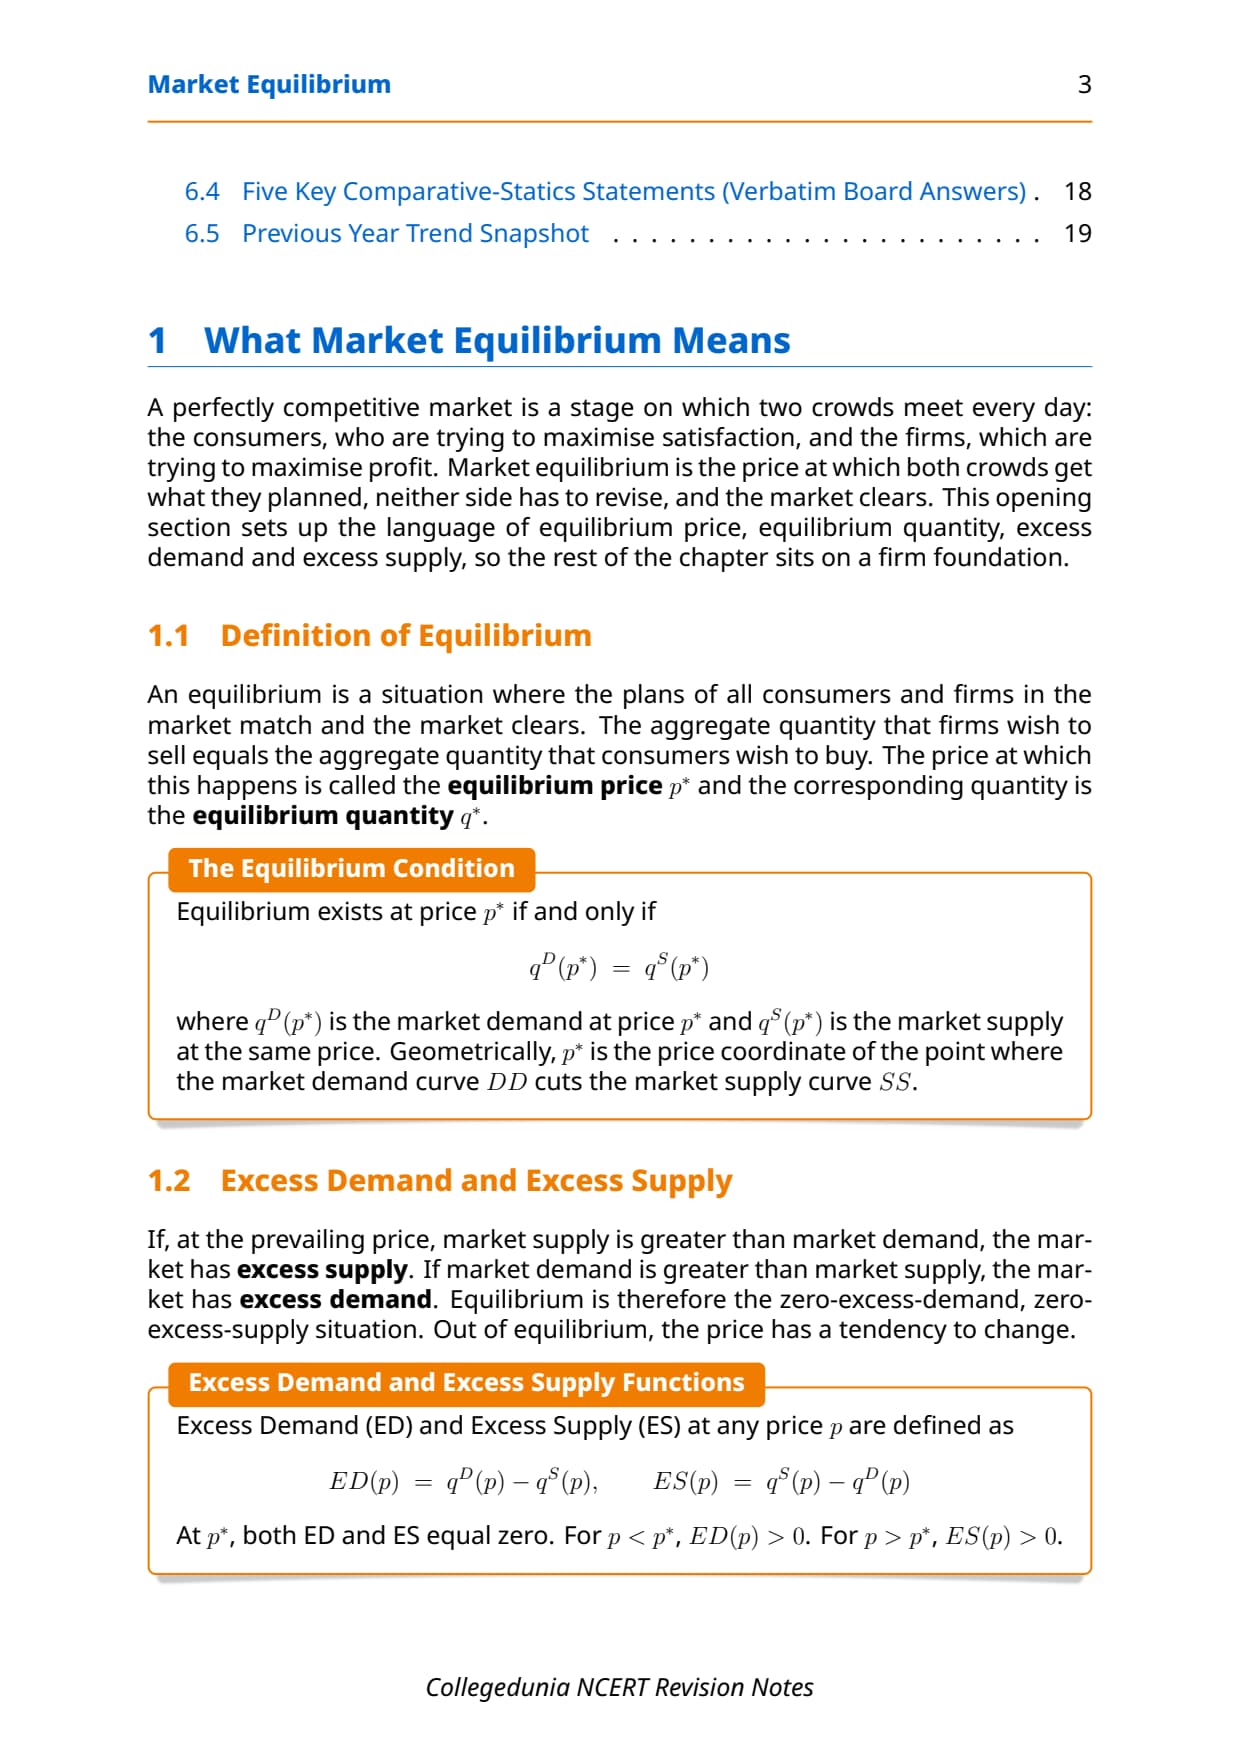
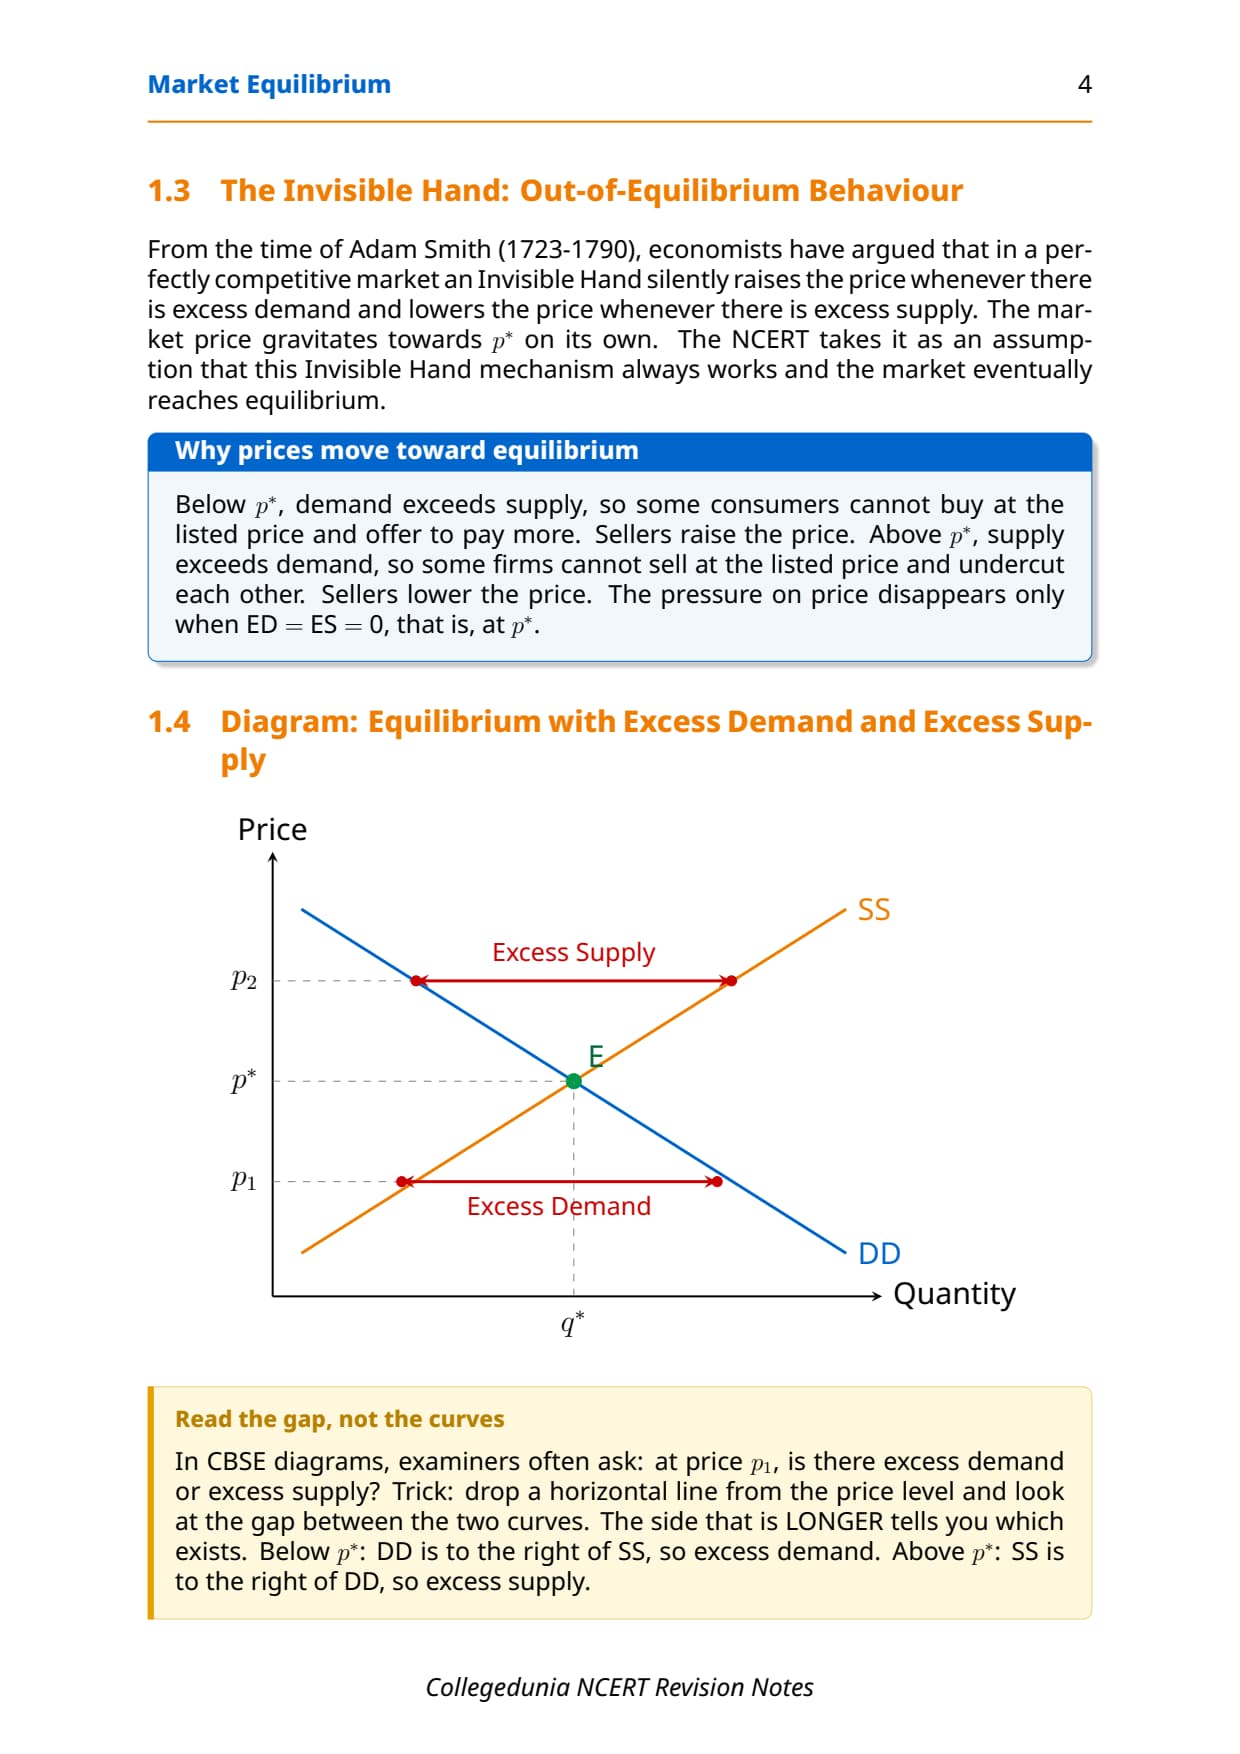
- Excess demand and excess supply: what pushes price back to P*.
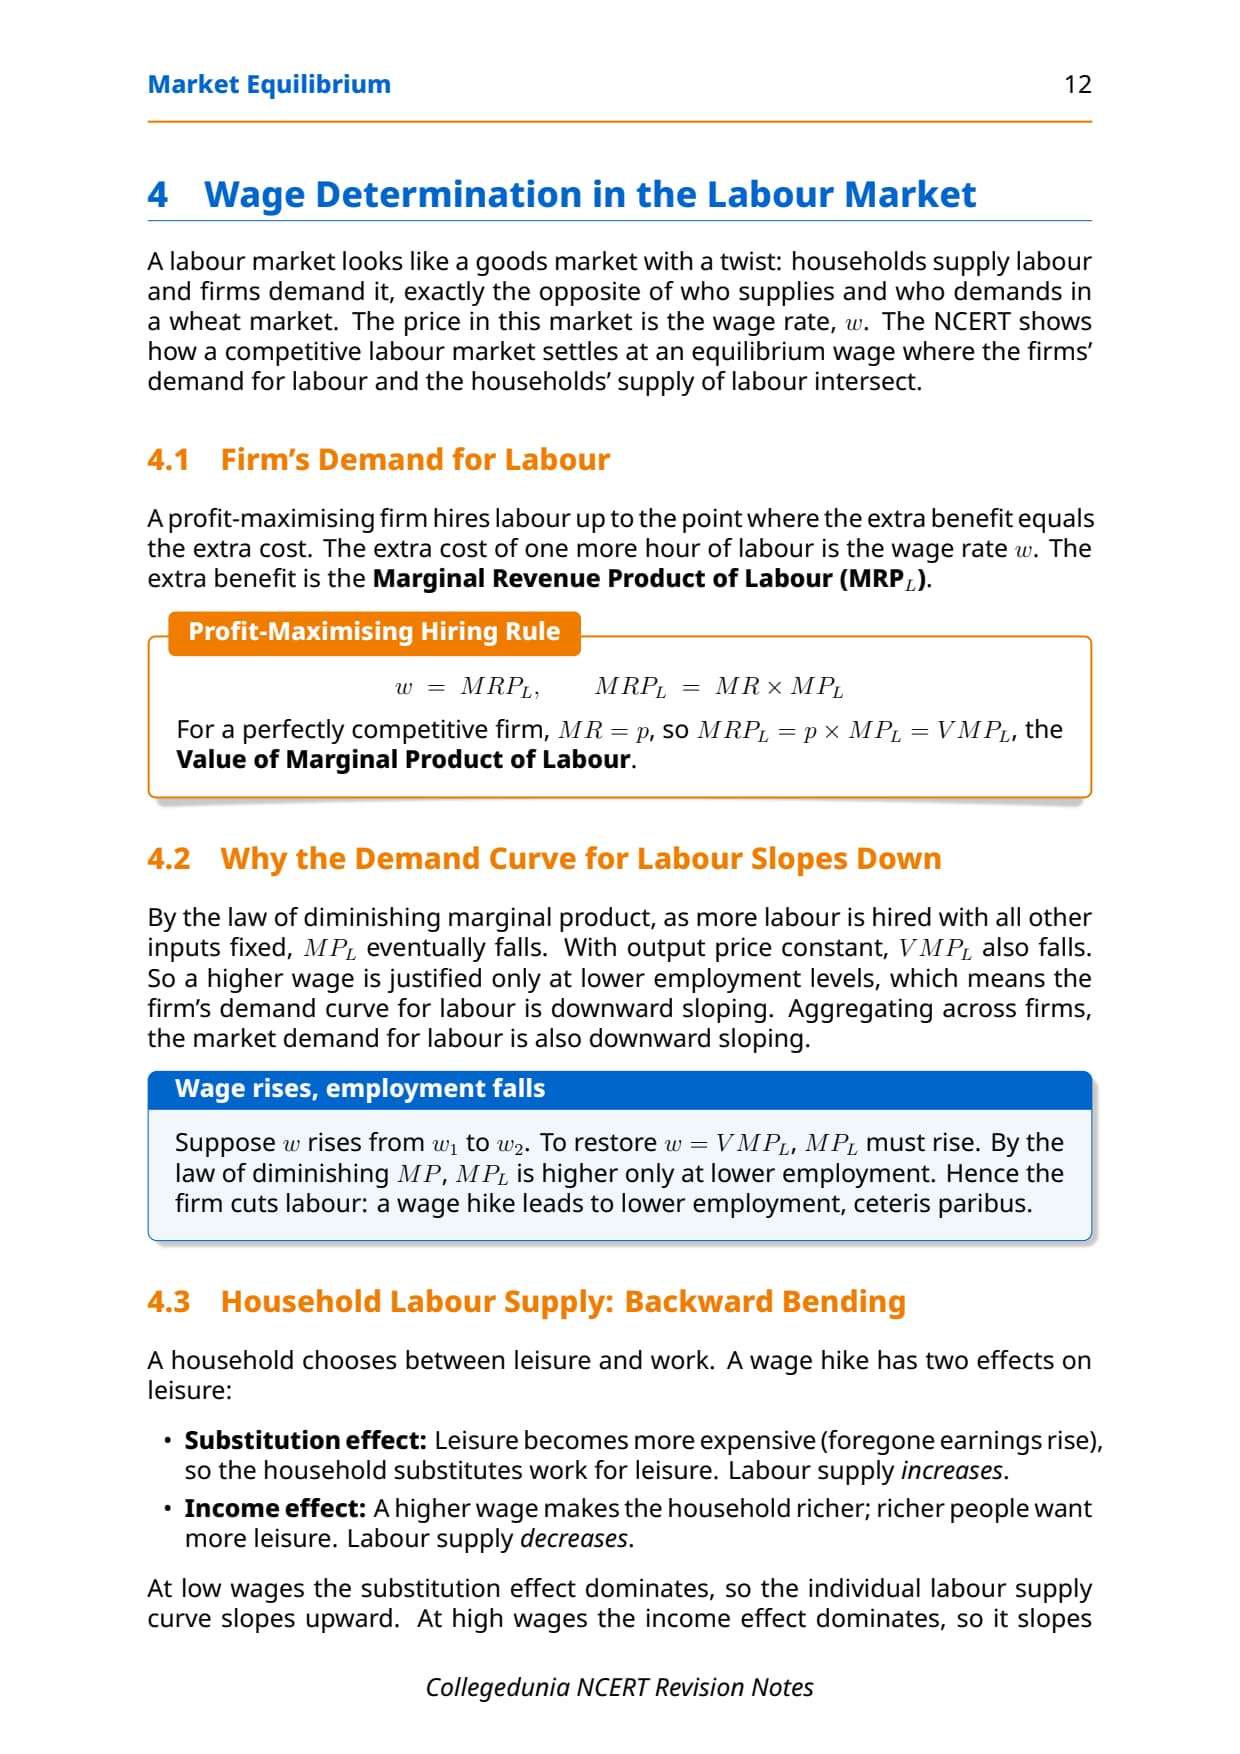
- Wage determination: the same idea applied to the labour market.
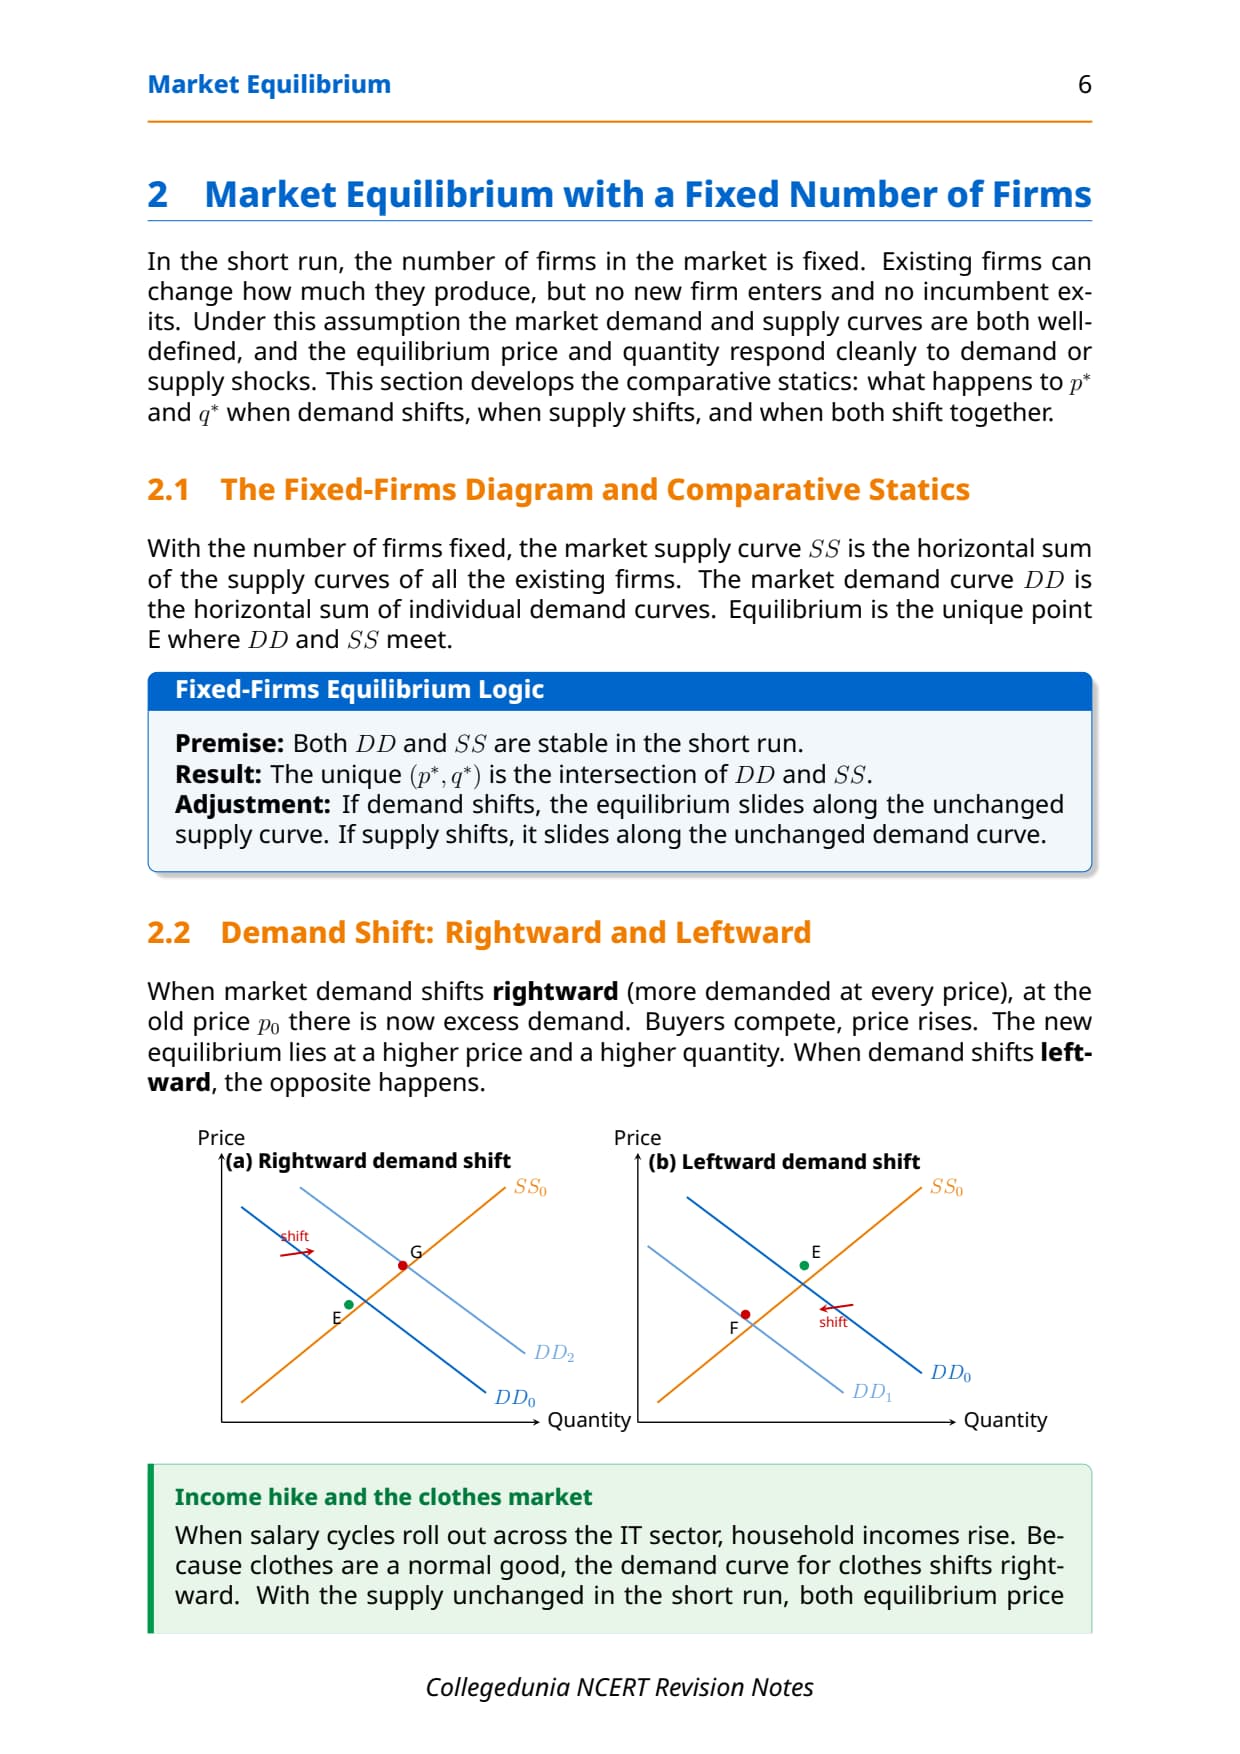
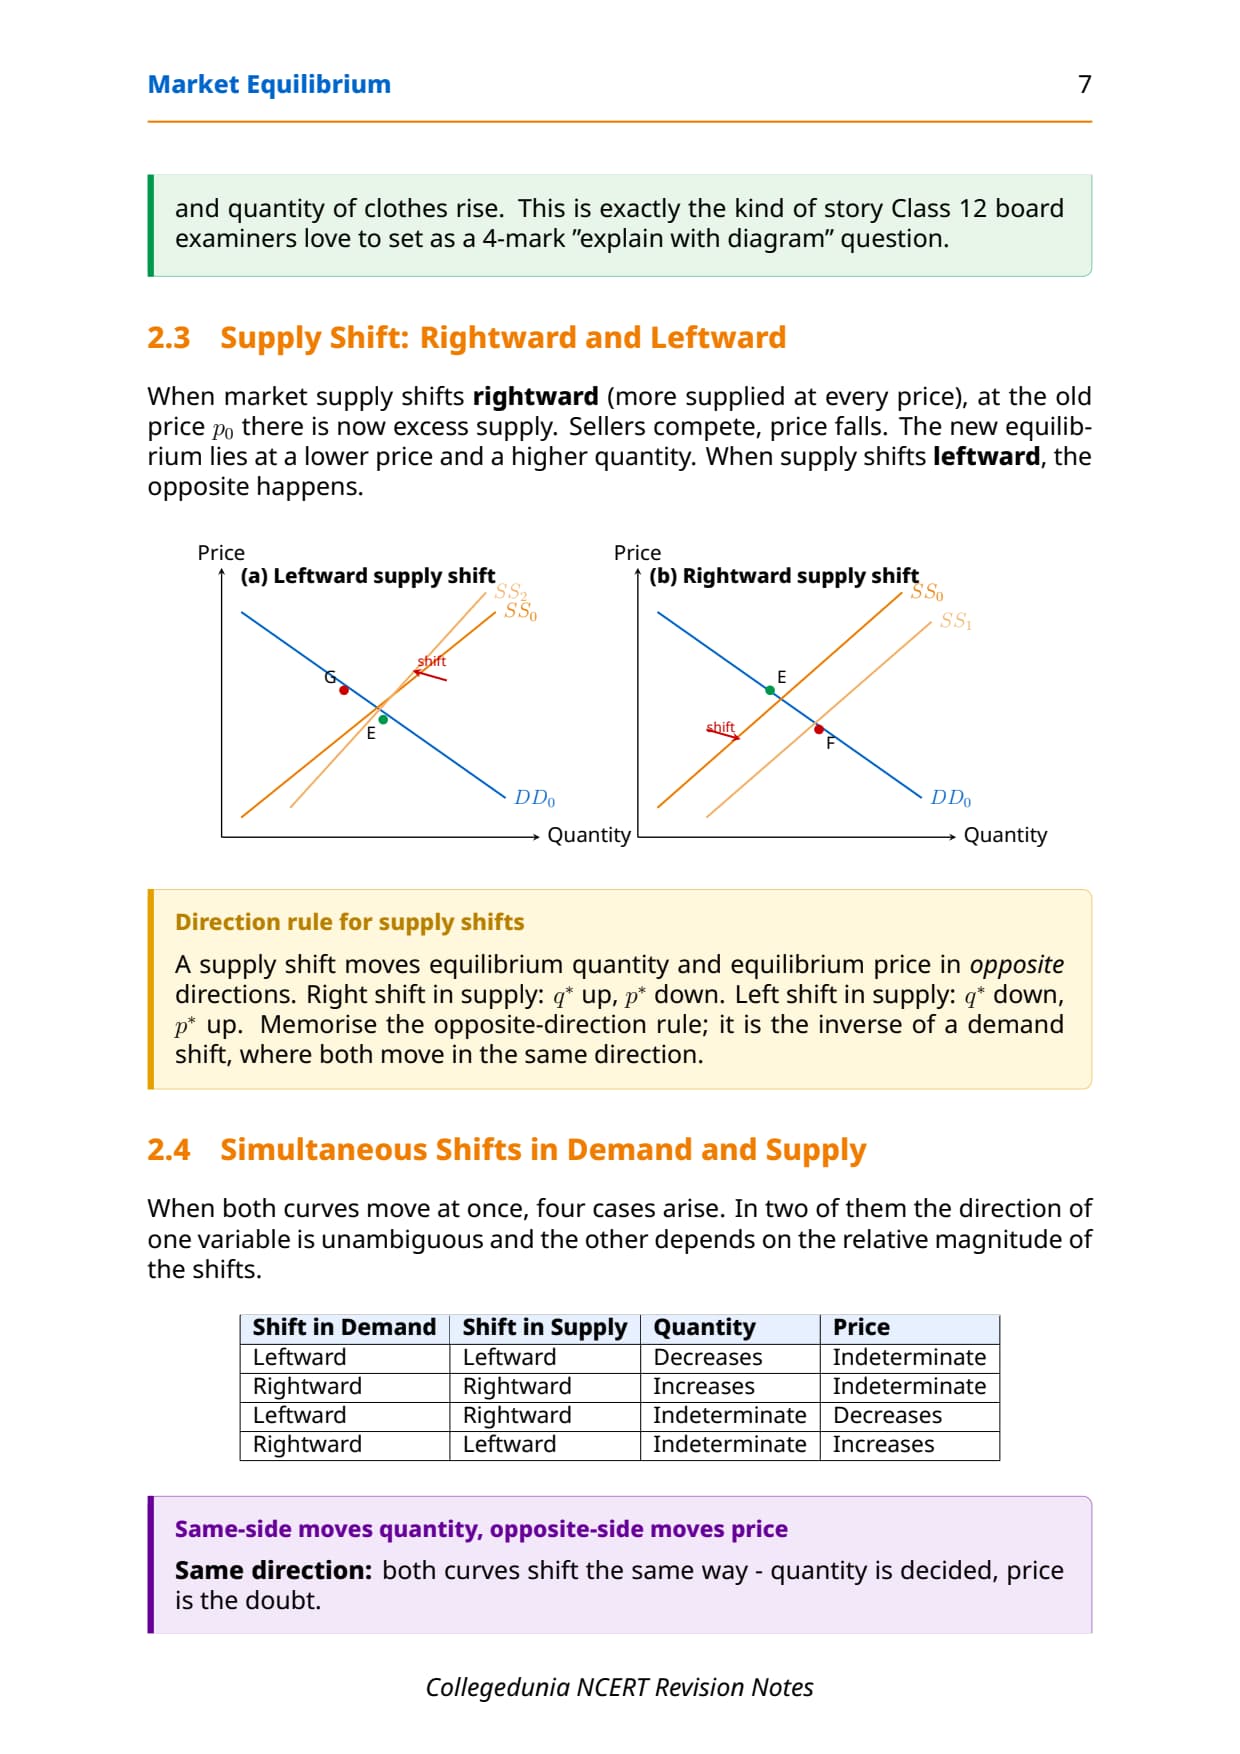
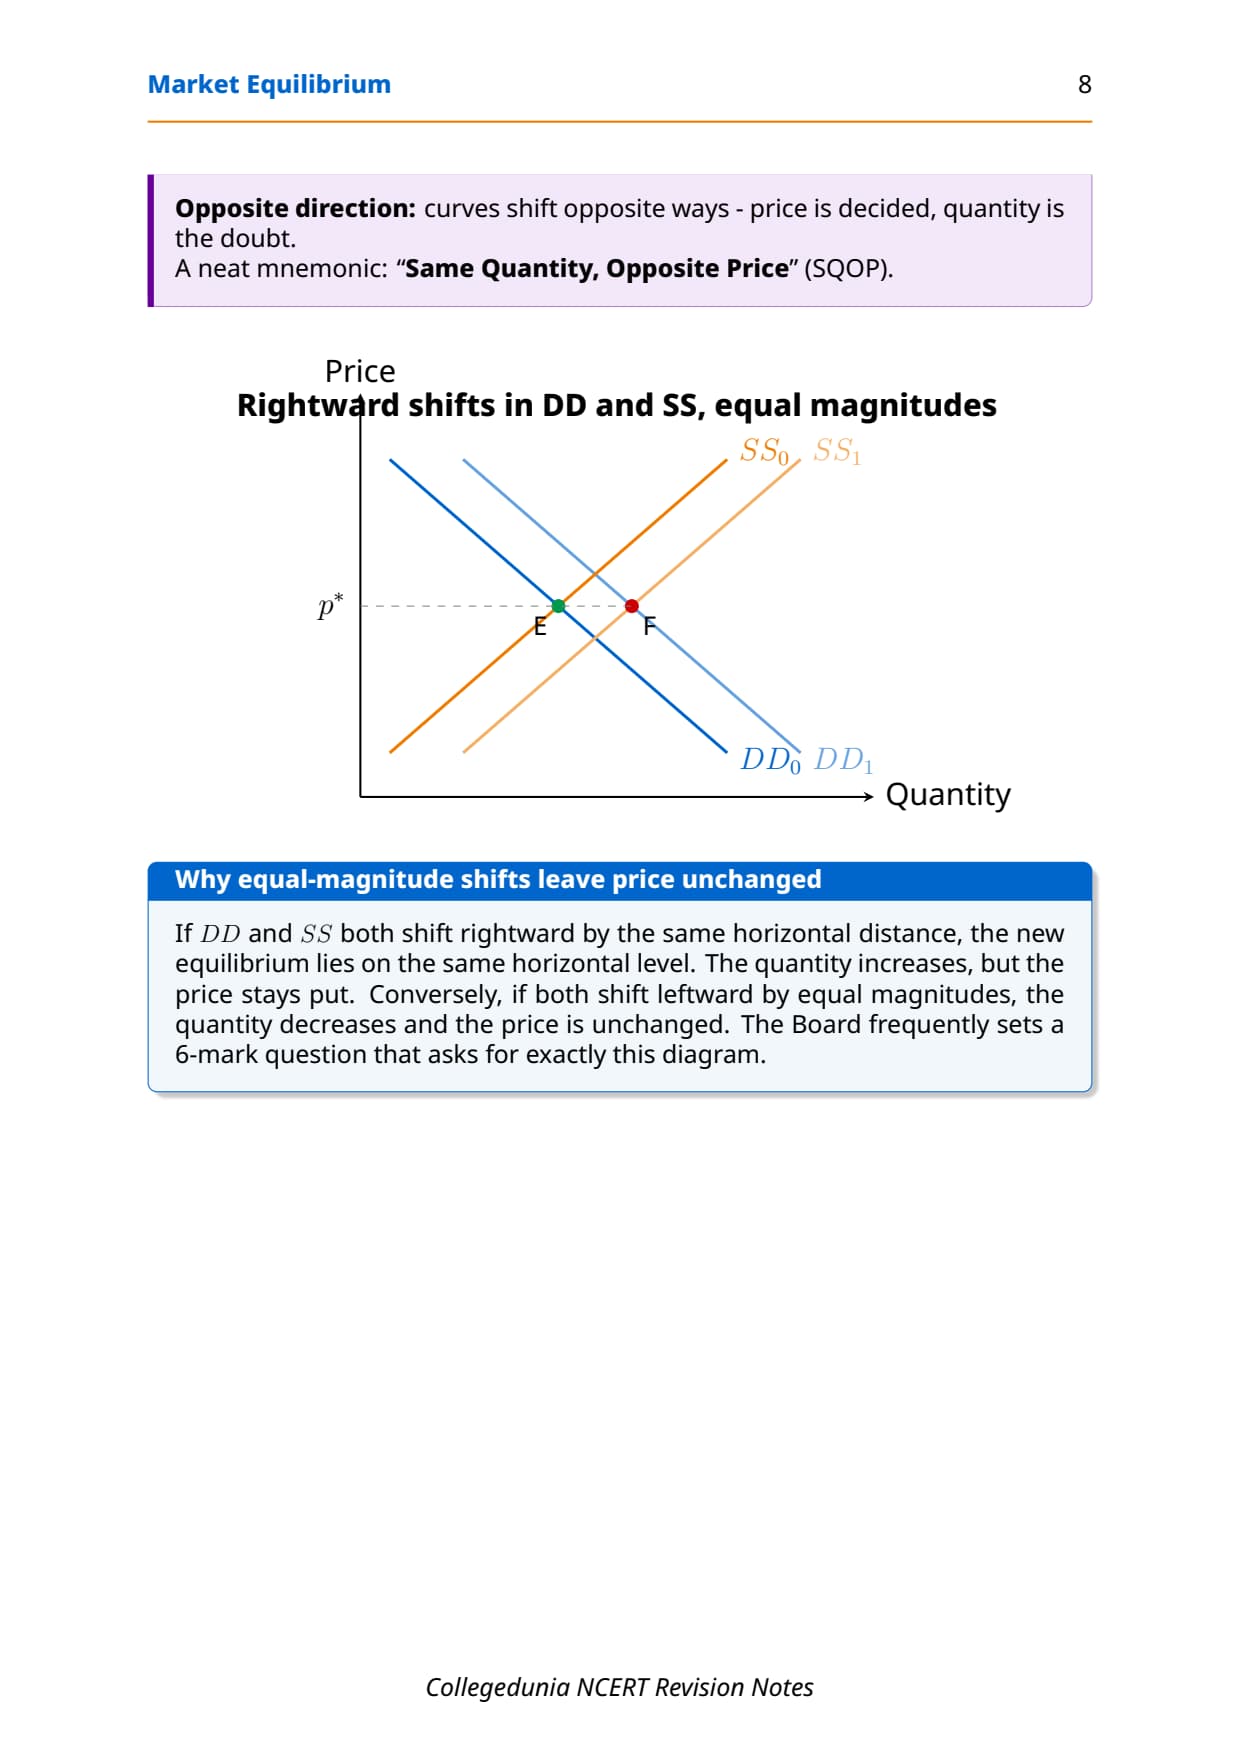
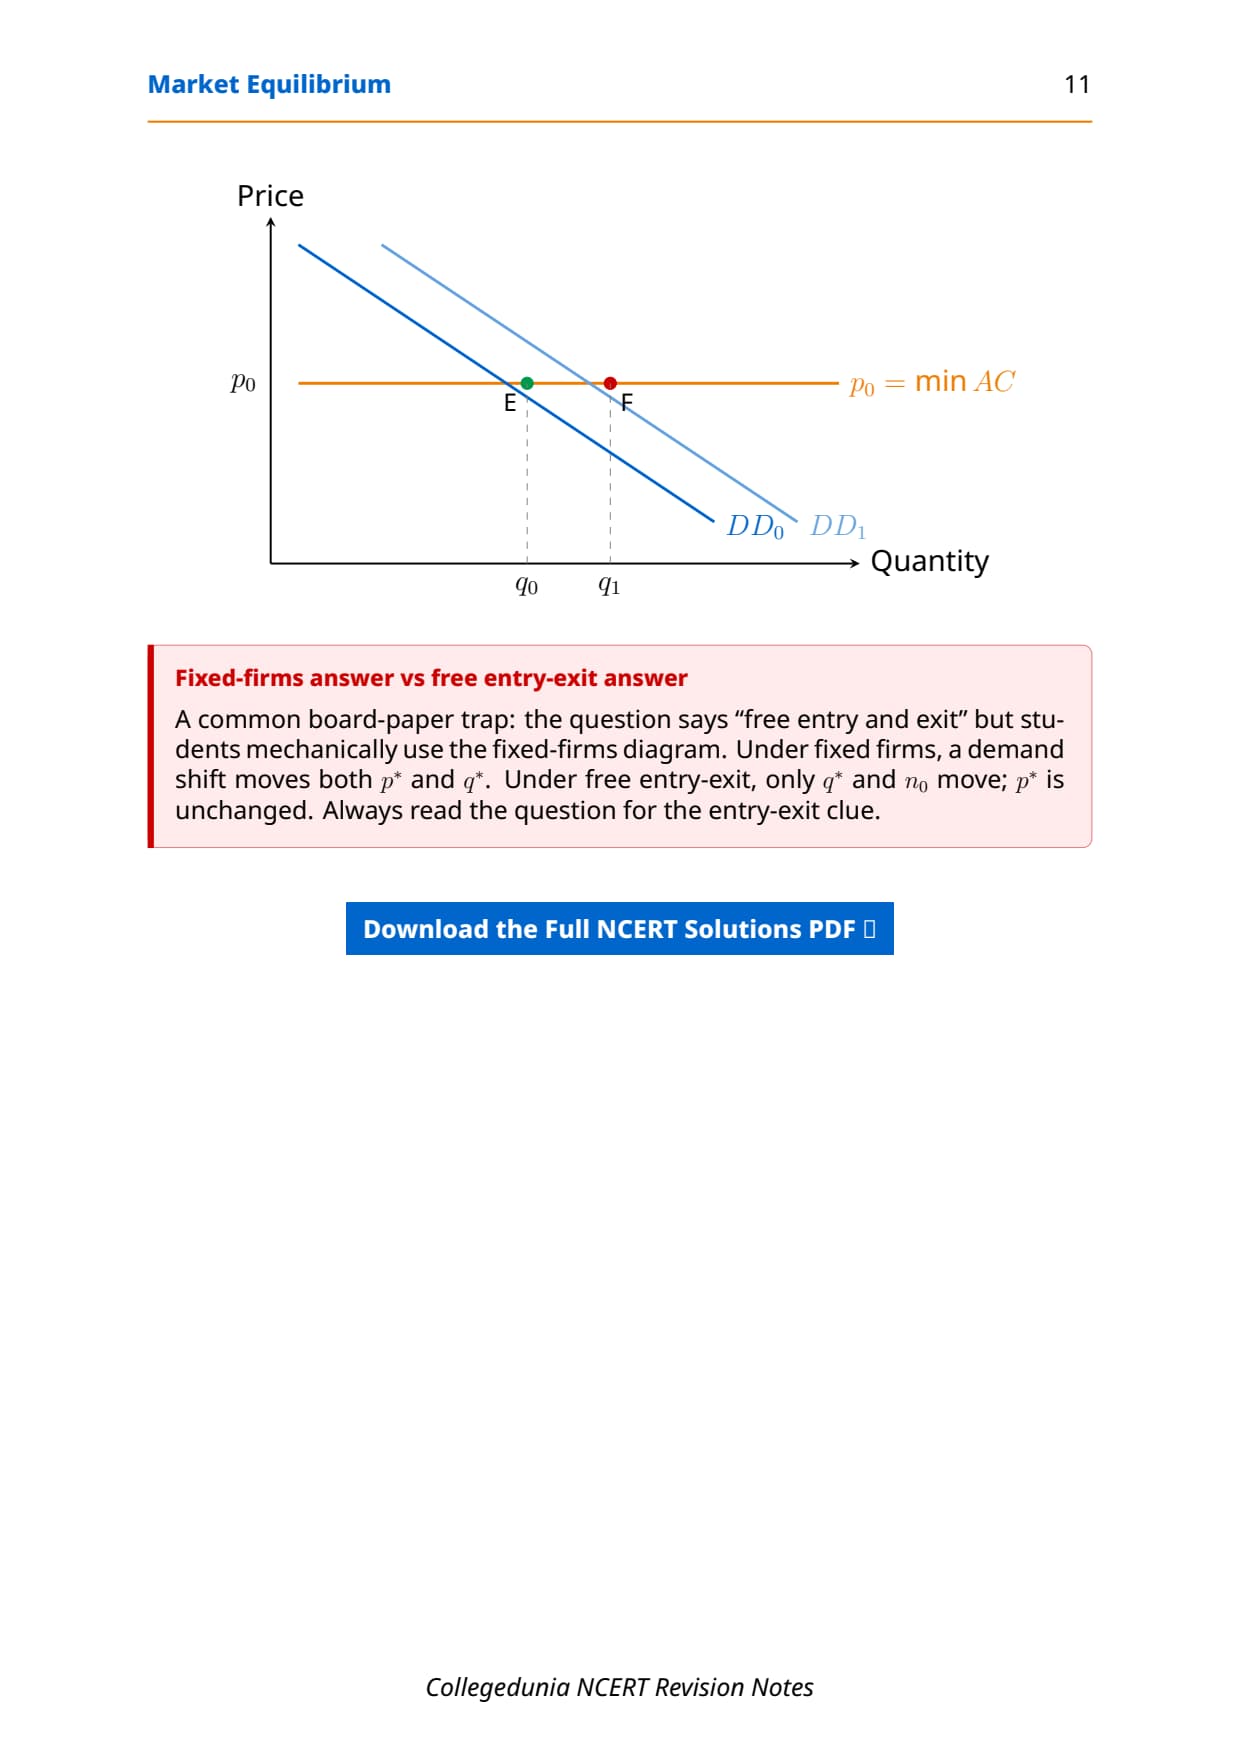
- Shifts in demand and supply: how P* and Q* change.
- Price ceiling and price floor: what government price controls do.
Market Equilibrium with a Fixed Number of Firms (Short Run)
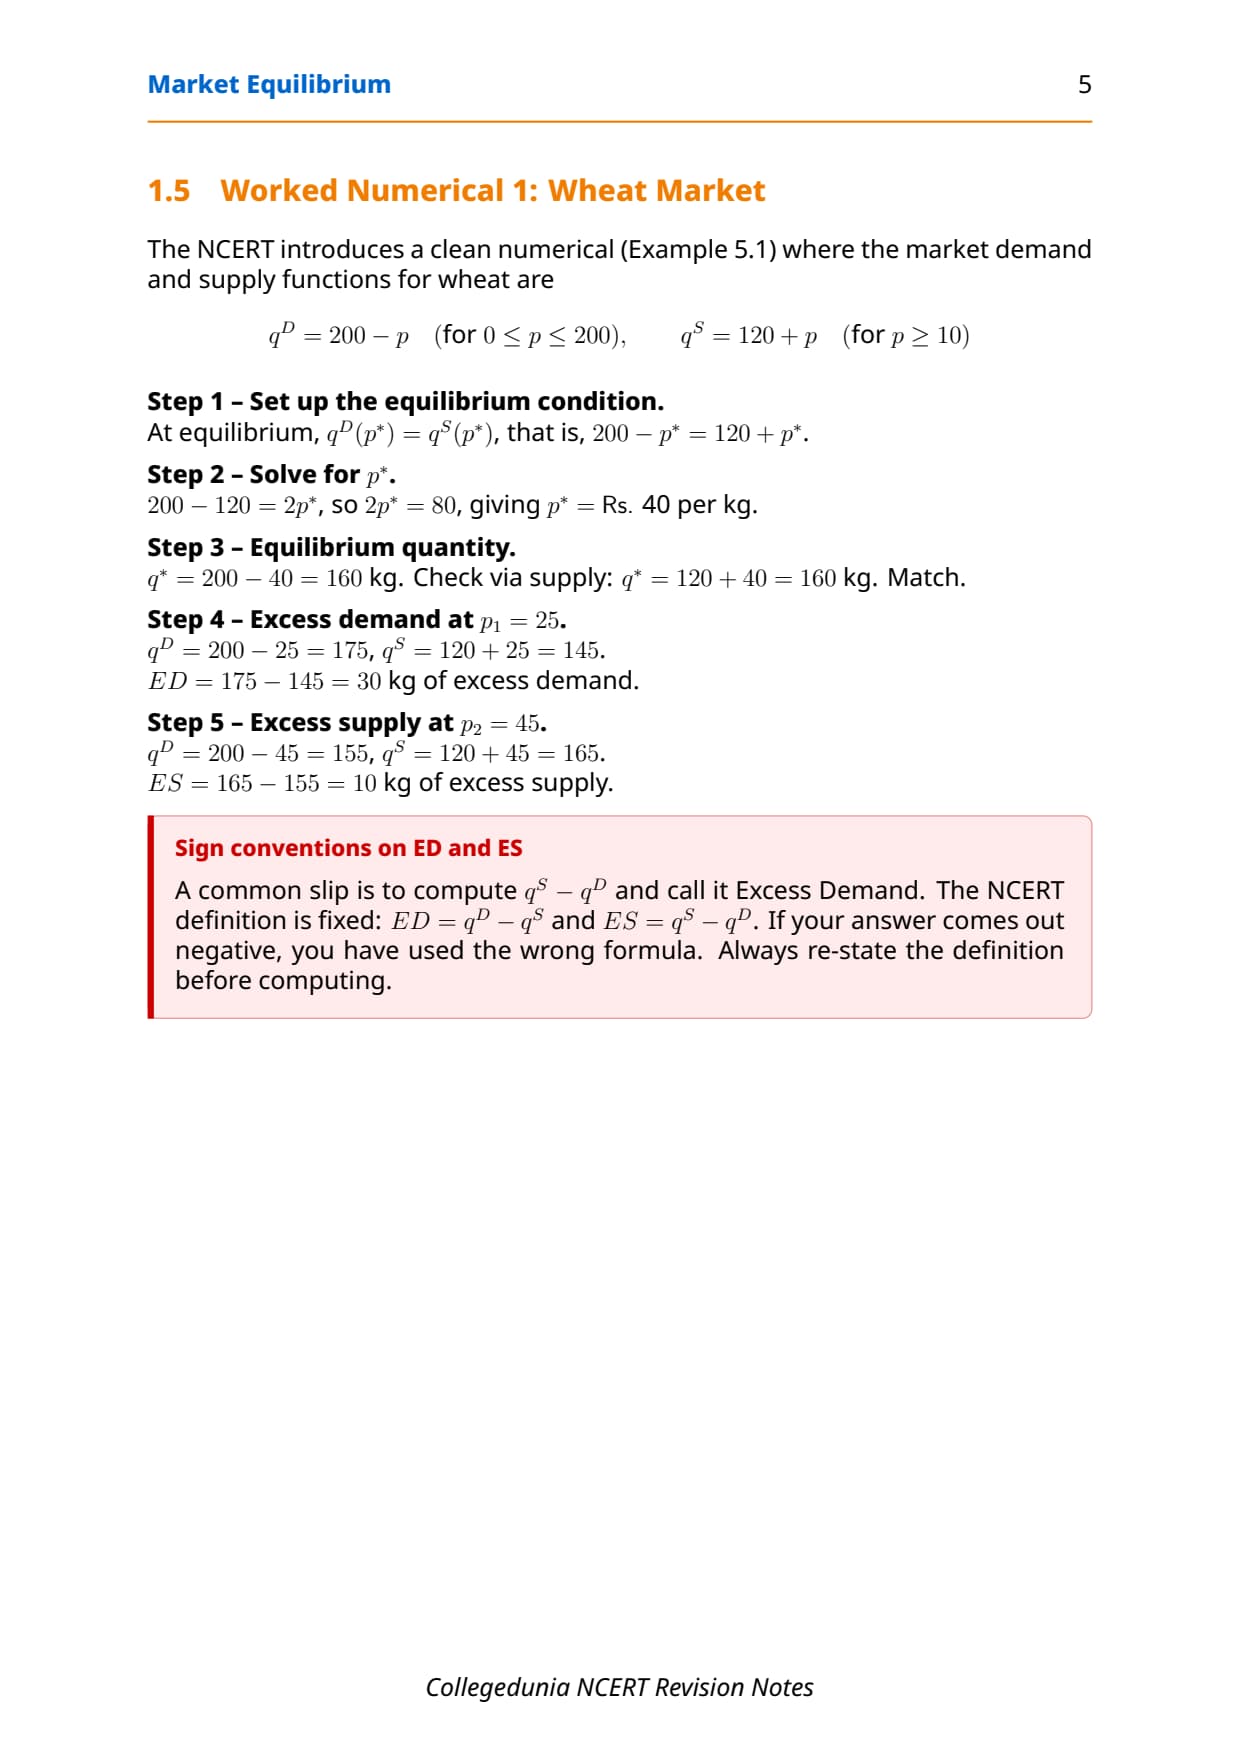
In the short run the number of firms is fixed. Market supply is the sum of every firm's marginal cost curve above its minimum AVC. Equilibrium sits where demand and supply cross.
| Term | One-line meaning |
|---|---|
| Equilibrium price (P*) | Price where market quantity demanded equals quantity supplied. |
| Equilibrium quantity (Q*) | The quantity bought and sold at P*; same on both sides. |
| Market supply (fixed firms) | Sum of the firms' short-run MC curves above minimum AVC. |
| Short-run profit | Profit = (P - SAC) x Q; can be positive, zero or a loss. |
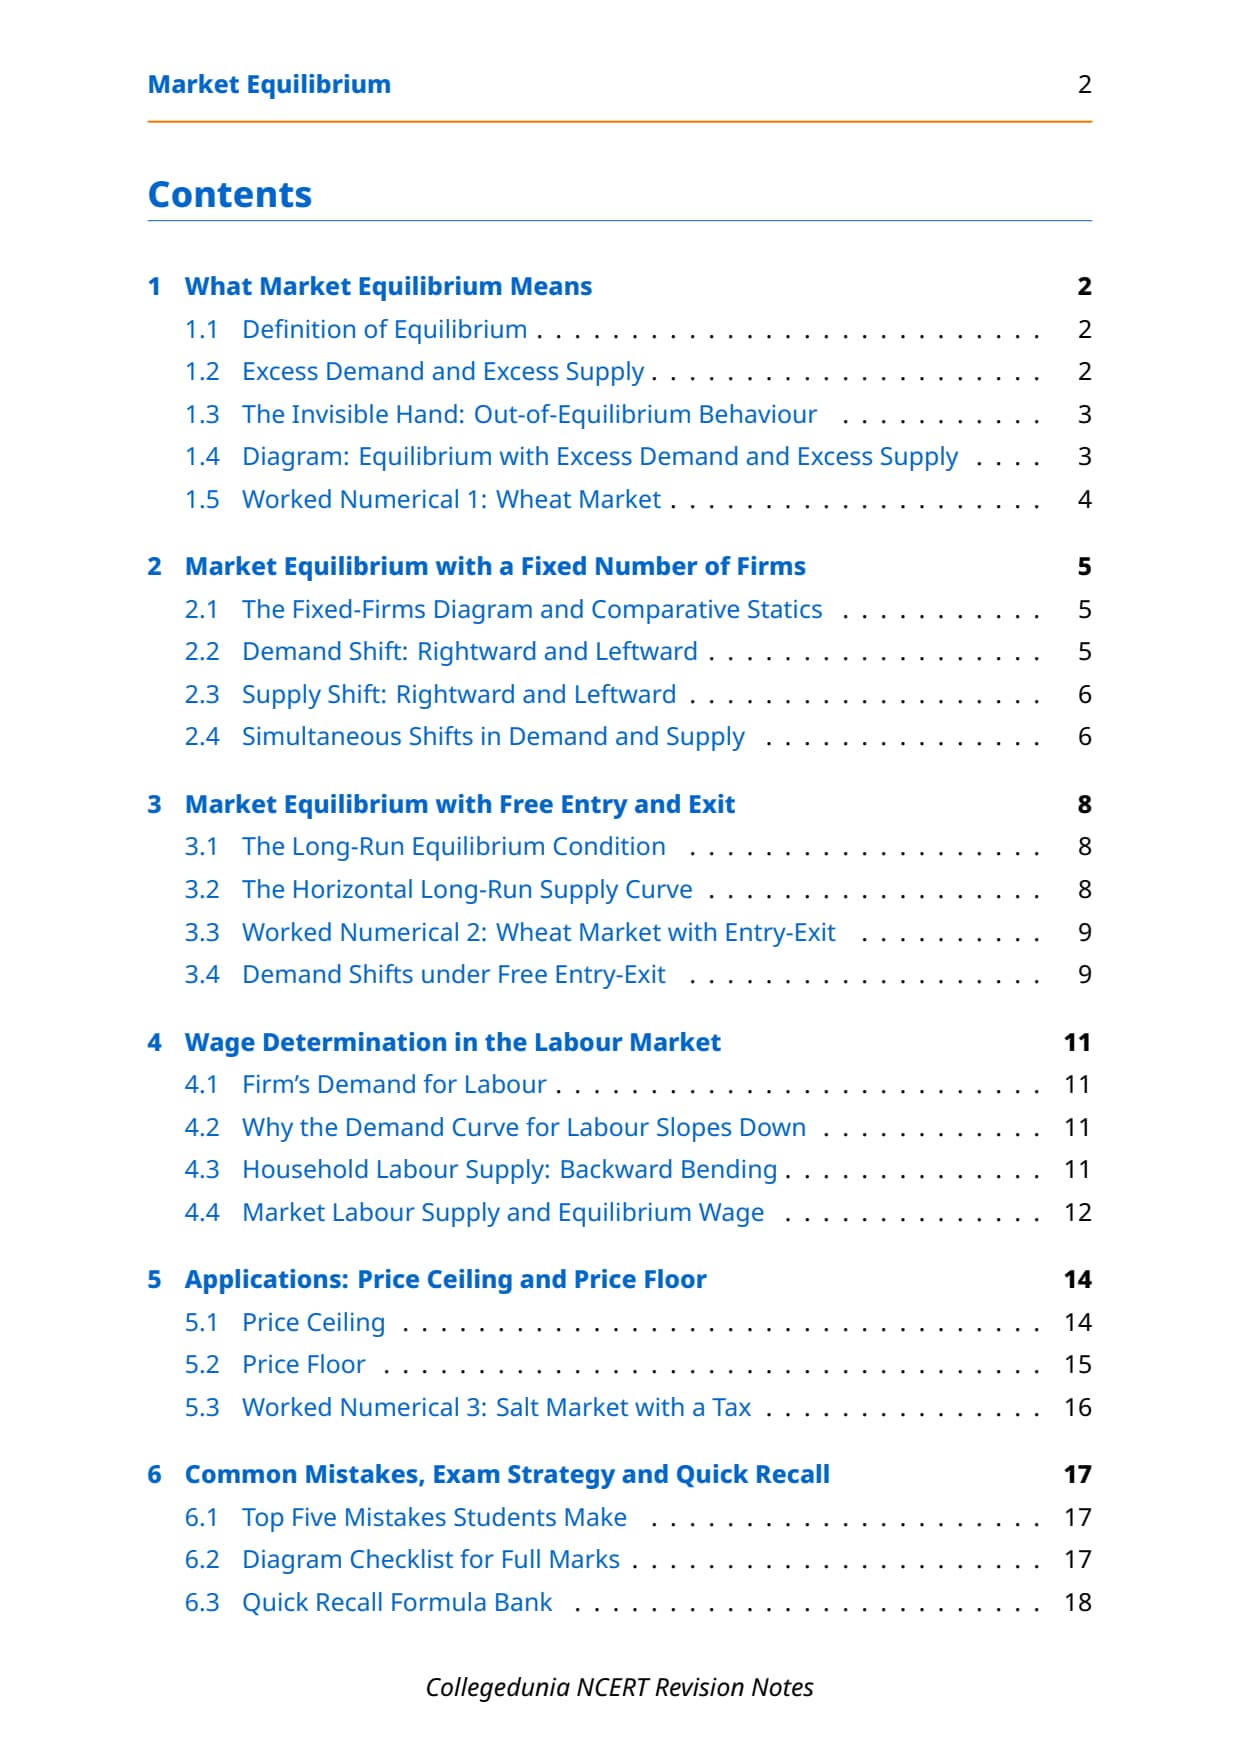
To find P* from a schedule, look for the row where quantity demanded equals quantity supplied, and read off that price.
Market Equilibrium with Free Entry and Exit (Long Run)
In the long run, firms can enter or exit. Profit pulls new firms in; losses push firms out. This goes on until every firm earns zero economic profit.
| Long-run feature | What it means |
|---|---|
| Entry condition | Positive profit pulls firms in; entry stops when profit hits zero. |
| Exit condition | Losses push firms out; exit stops when the rest break even. |
| Long-run price (P_LR) | Equals the minimum of the long-run average cost curve (LRAC). |
| Zero economic profit | Total revenue equals total cost, including opportunity cost. |
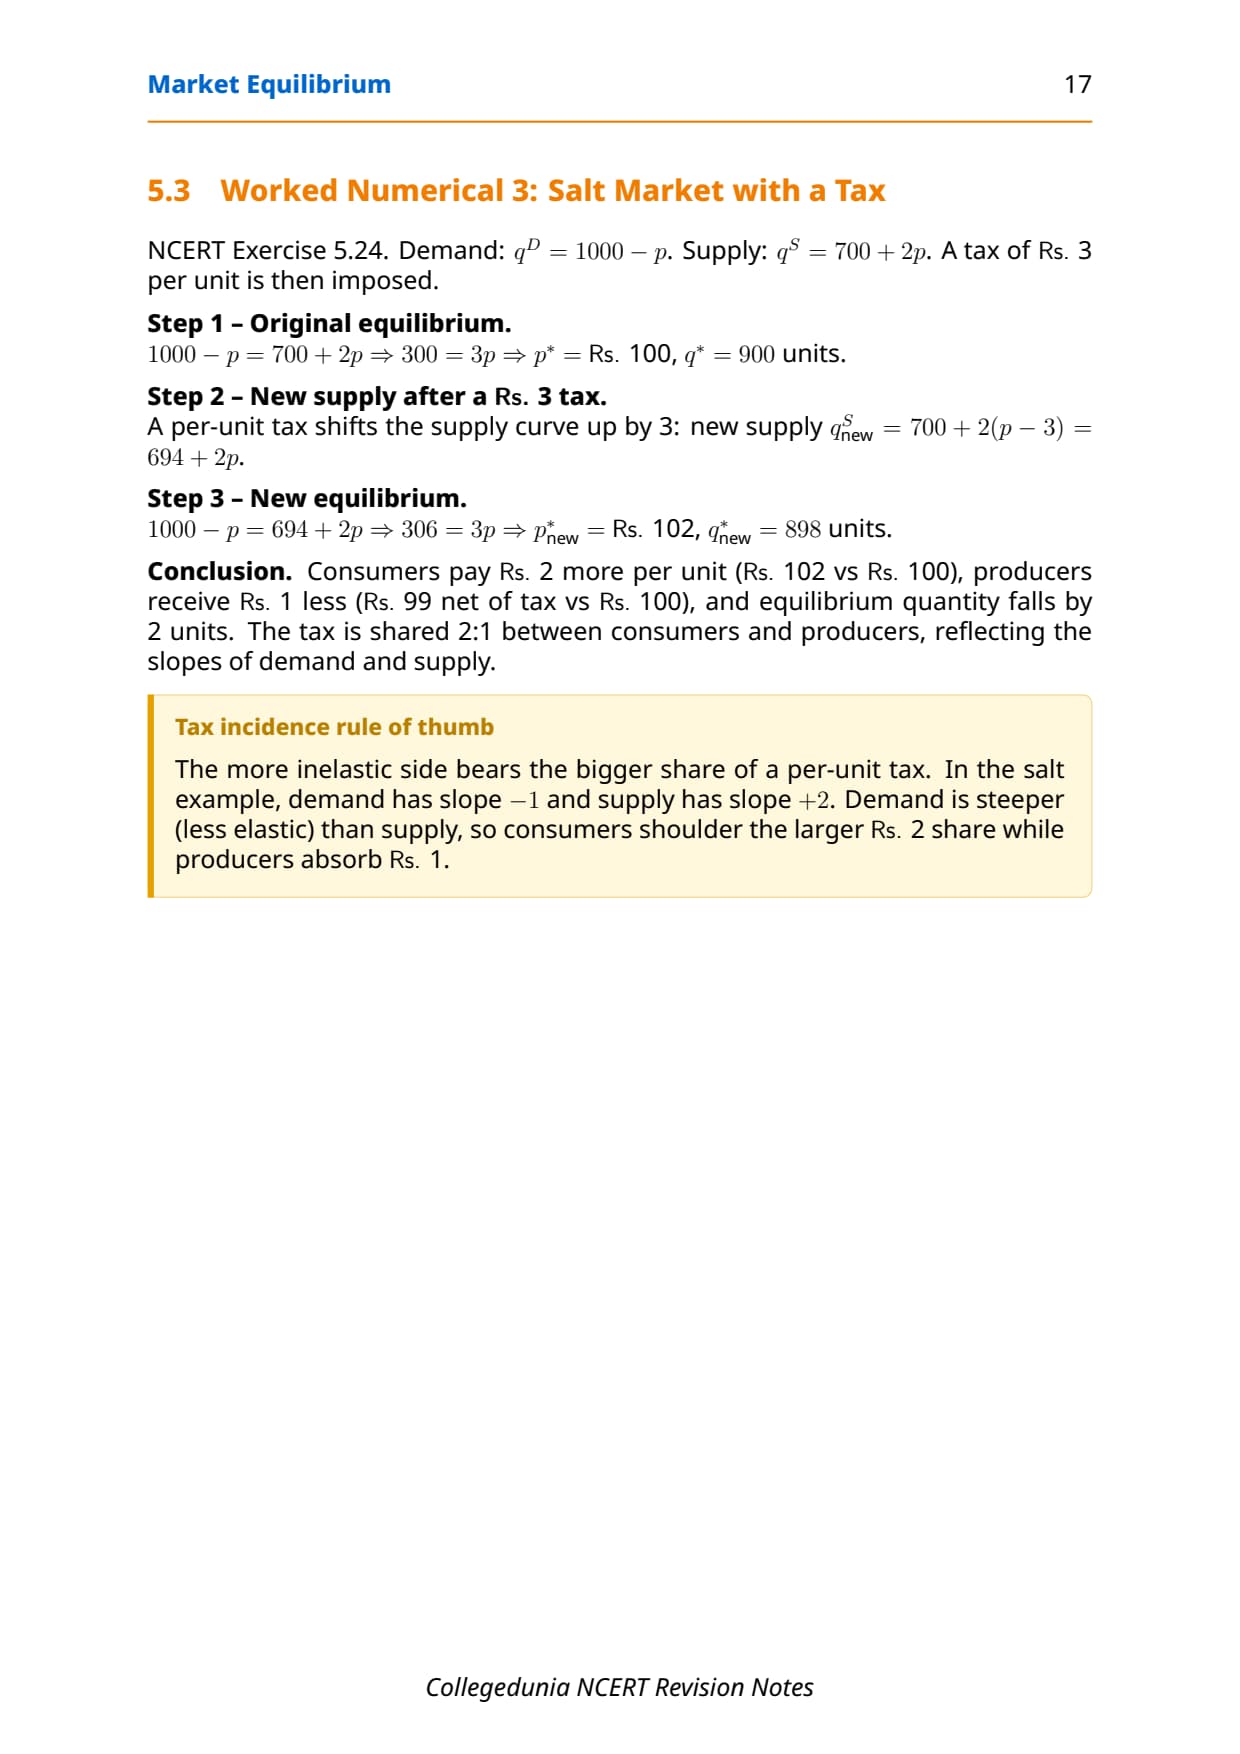
Memory hook: short run with fixed firms, profits and losses stay, market clears at the DD-SS crossing. Long run with free entry and exit, profits vanish and the market clears at P = minimum LRAC. The 4-mark "compare short-run and long-run equilibrium" answer must hit three points: firm count, profit, and price versus LRAC.
Excess Demand and Excess Supply in Market Equilibrium Class 12
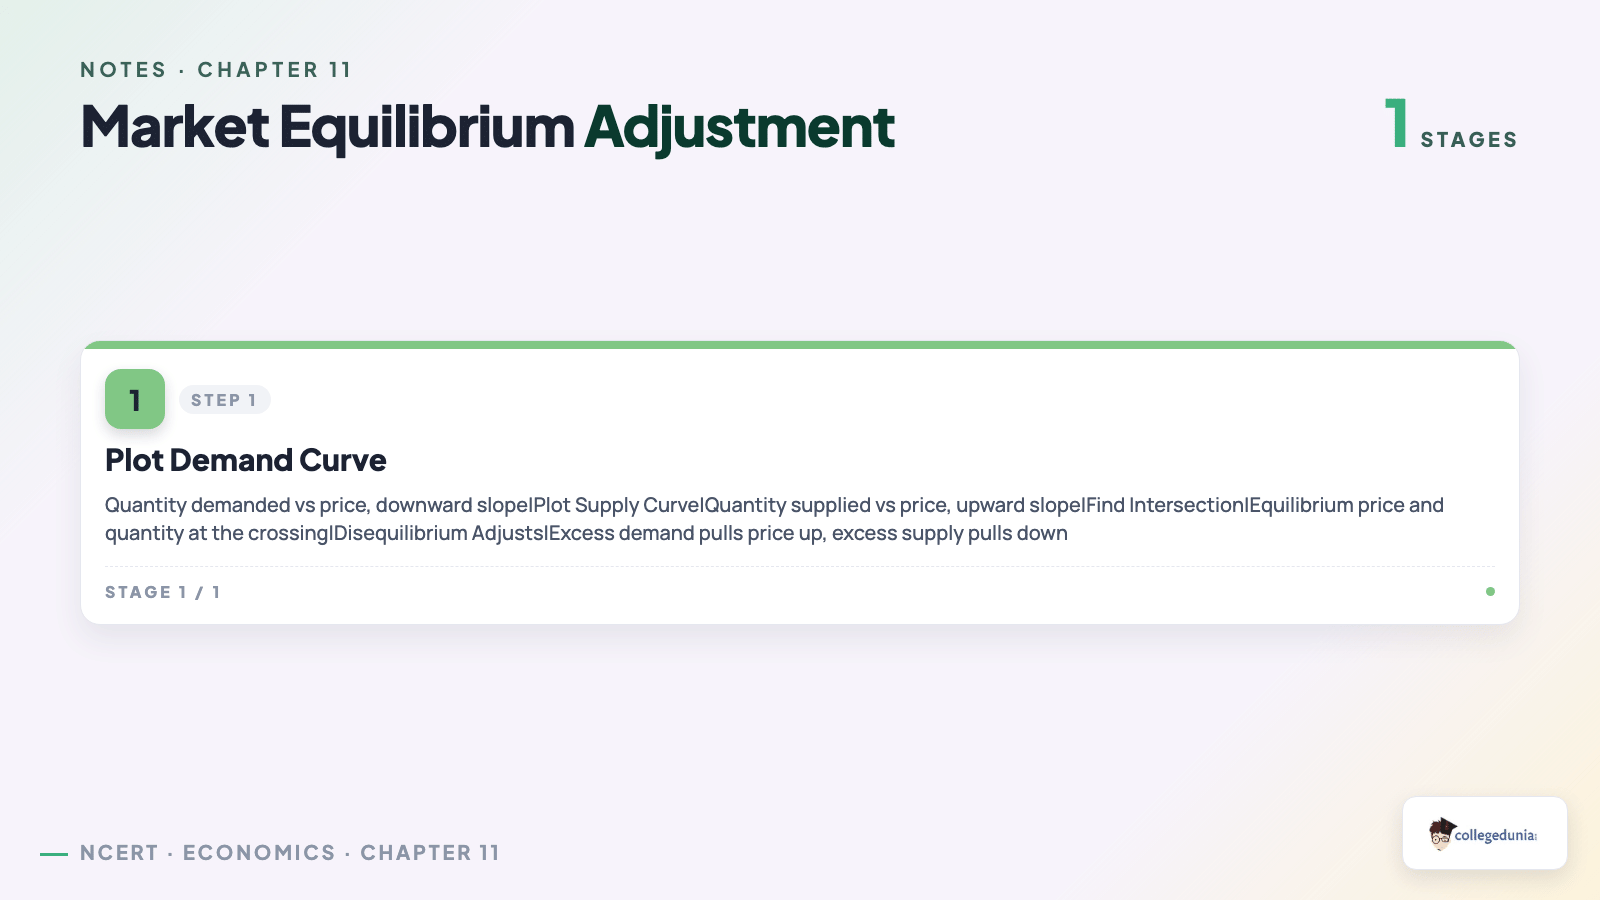
The market is stable because price adjusts whenever it is away from P*. CBSE tests this in 1-mark and 3-mark forms.
| State | Where it sits | What price does |
|---|---|---|
| Excess demand (shortage) | Below P*: Q_d > Q_s. | Buyers bid the price up toward P*. |
| Excess supply (surplus) | Above P*: Q_s > Q_d. | Sellers cut the price toward P*. |
| Equilibrium | At P*: Q_d = Q_s. | No tendency to change; market clears. |
In any numerical, compare Q_d and Q_s at the stated price. If Q_d is bigger it is a shortage; if Q_s is bigger it is a surplus.
Market Equilibrium Class 12 Video Lesson
Source: Magnet Brains on YouTube
Wage Determination in the Labour Market
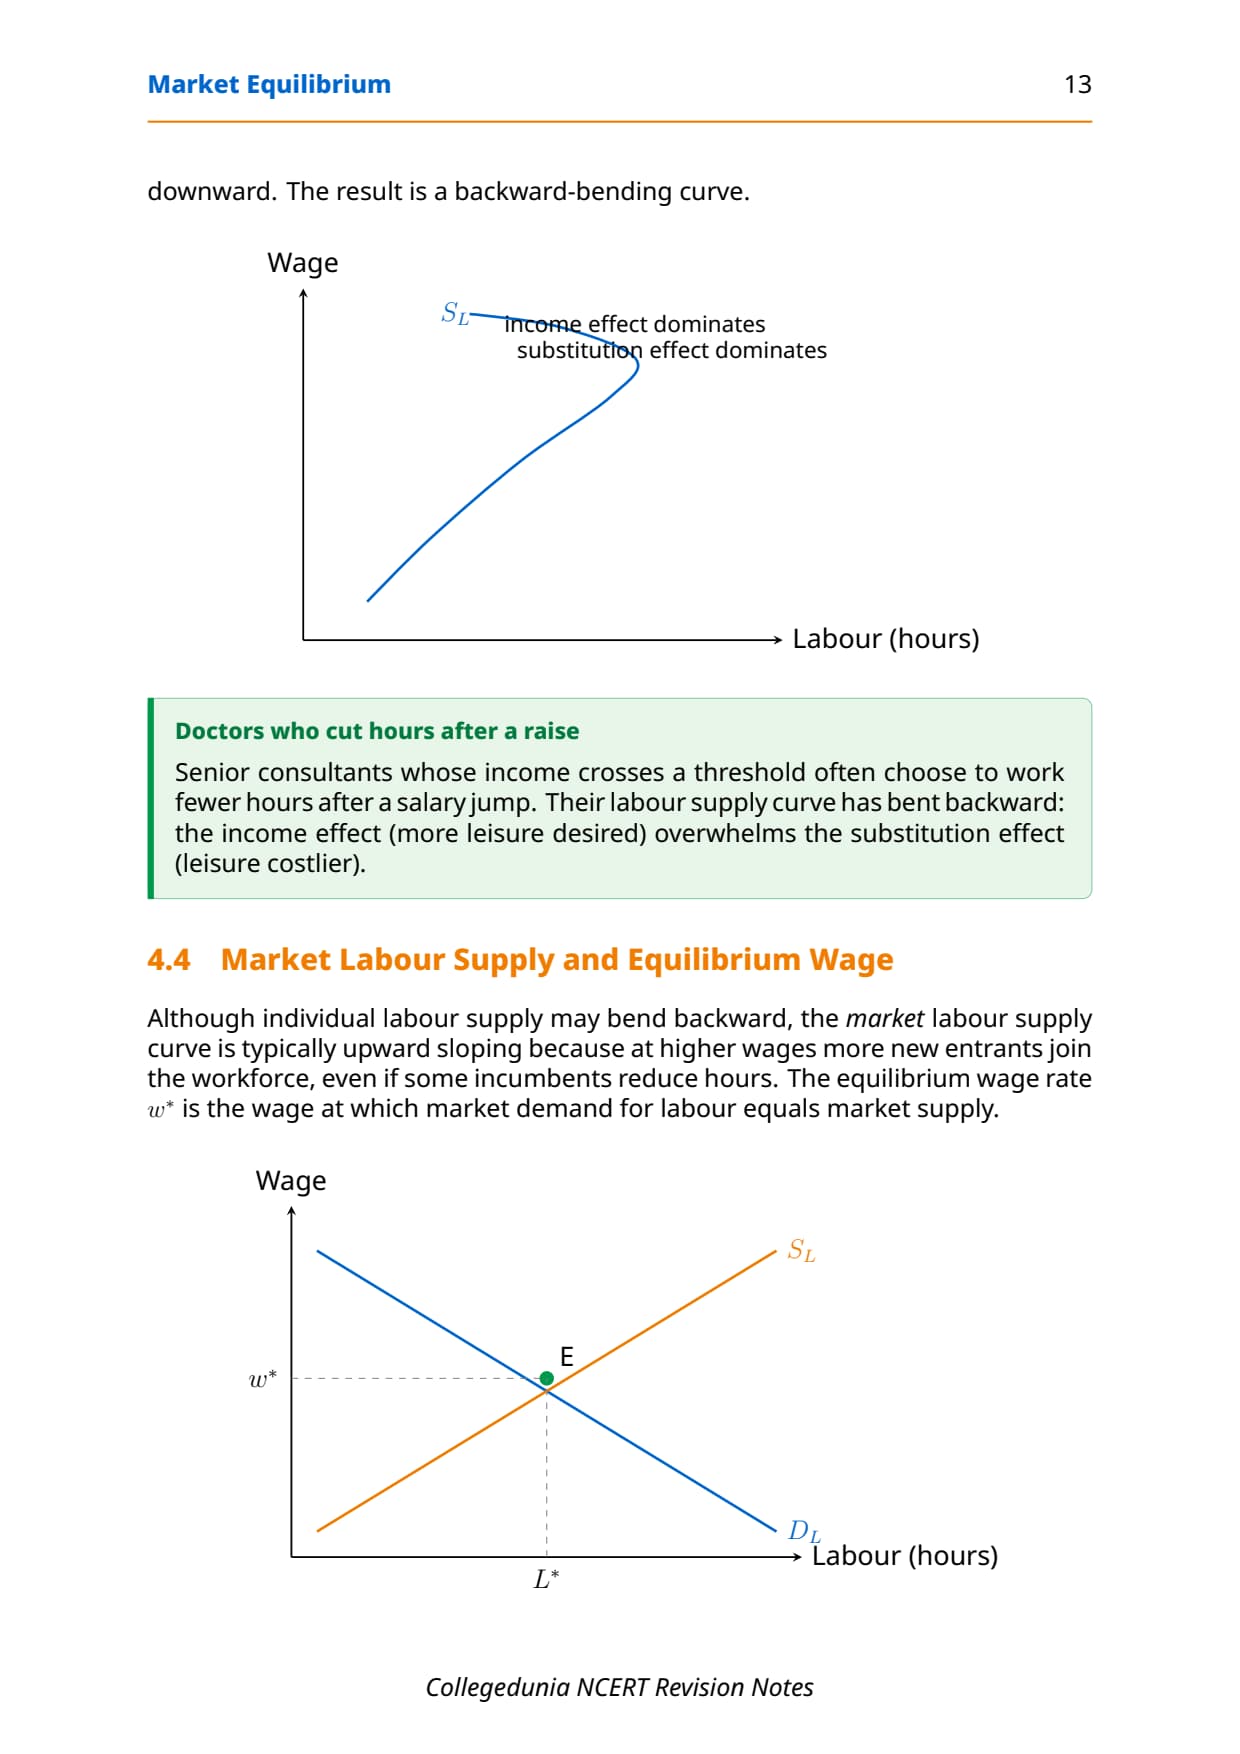
The same demand-supply idea works for labour. The equilibrium wage and employment sit where labour demand meets labour supply.
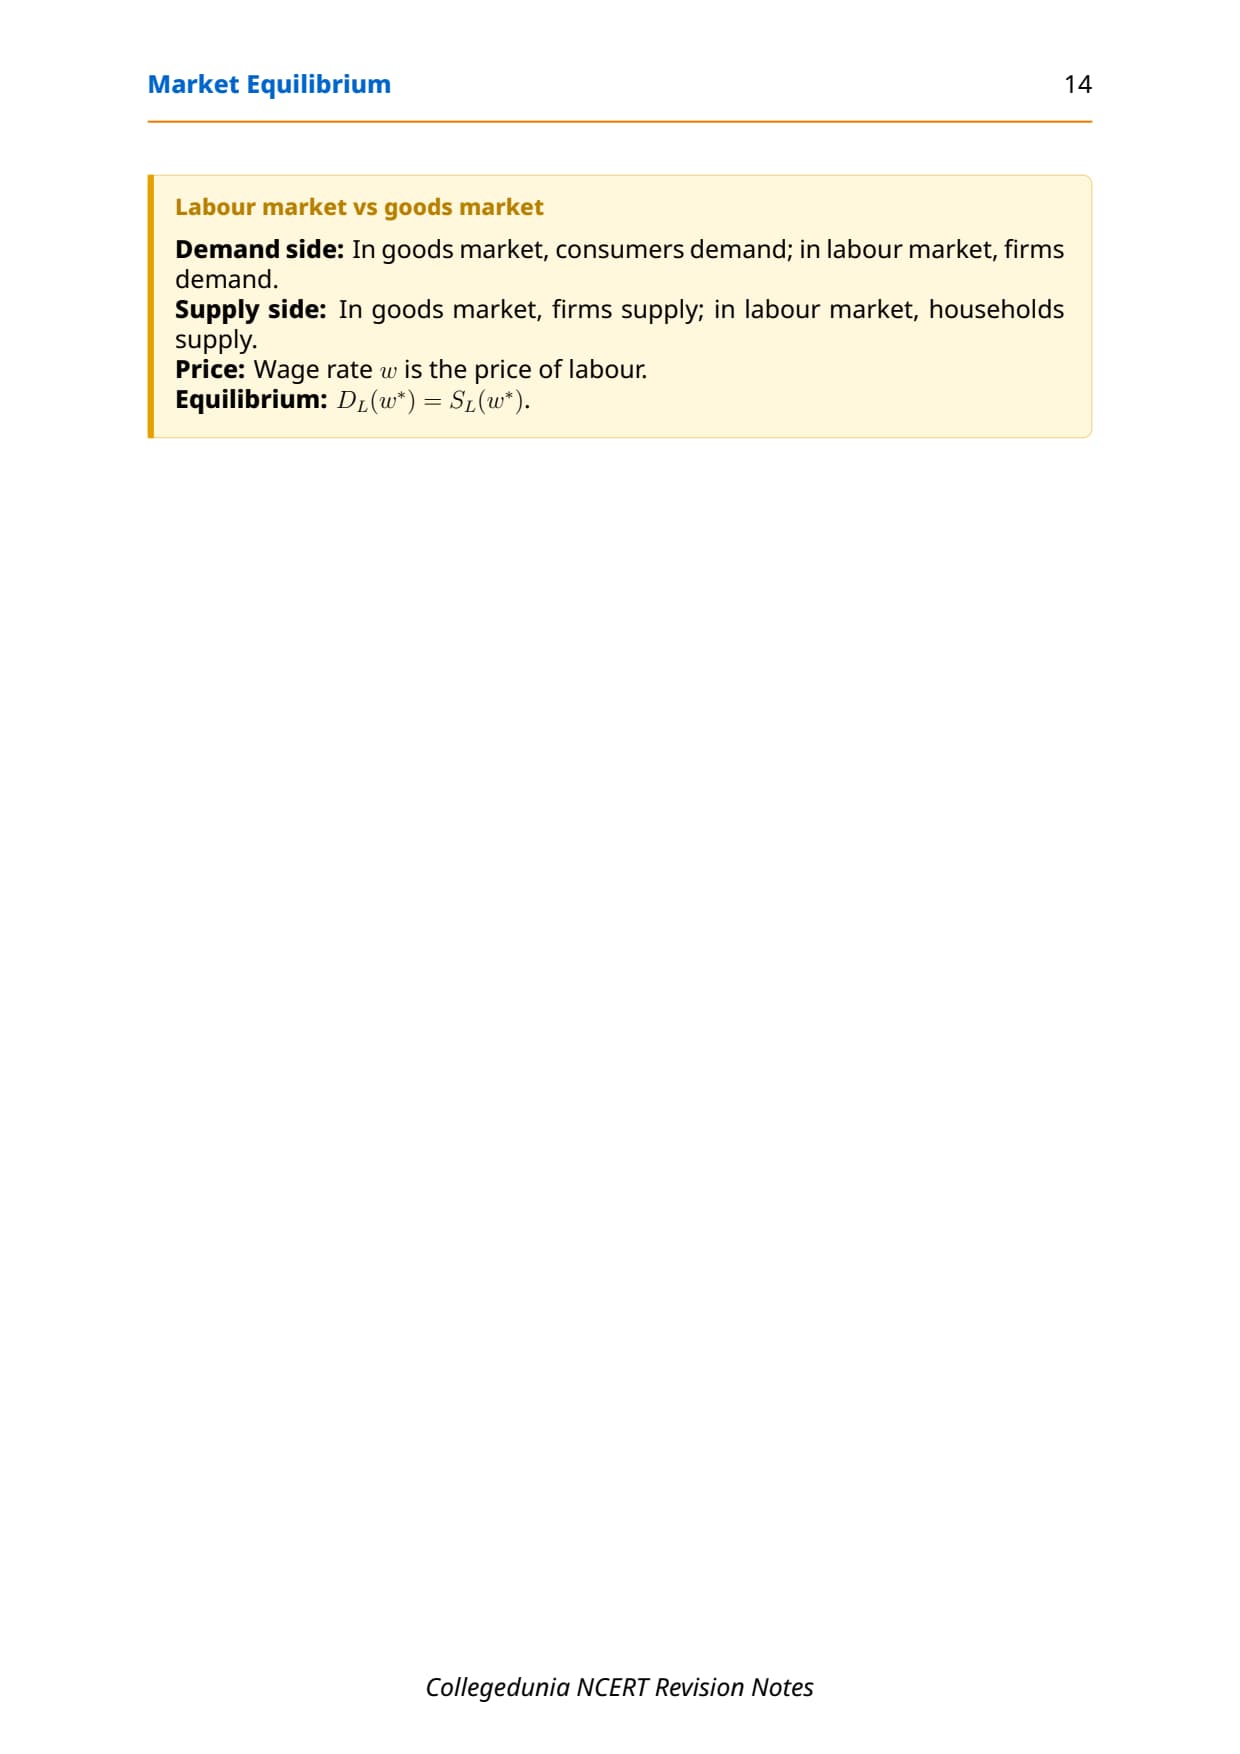
| Concept | One-line meaning |
|---|---|
| Labour demand | Equals the marginal revenue product of labour, MRP_L = MP_L x P. |
| Labour supply | Hours workers offer at each wage; rises with the wage. |
| Equilibrium wage (W*) | Wage where labour demanded equals labour supplied. |
| Excess supply of labour | At a wage above W*: the surplus is involuntary unemployment. |
MRP_L (marginal product times output price) is the most-tested labour formula. Leaving out the price loses a mark.

Shifts in Demand and Supply: Market Equilibrium Class 12 Comparative Statics
Once you can find P*, the chapter asks how it changes when a curve shifts. This is the most common 3-mark question.
| Shift | Example cause | Price | Quantity |
|---|---|---|---|
| Demand right | Rise in income, costlier substitute. | Rises | Rises |
| Demand left | Fall in income, weaker taste. | Falls | Falls |
| Supply right | Better technology, cheaper inputs. | Falls | Rises |
| Supply left | Costlier inputs, firms exit. | Rises | Falls |
When both curves shift, one change is certain and the other depends on which shift is bigger. A change in the good's own price is a movement along the curve, not a shift. Get the cause right before you draw.
Price Ceiling and Price Floor in Class 12 Economics
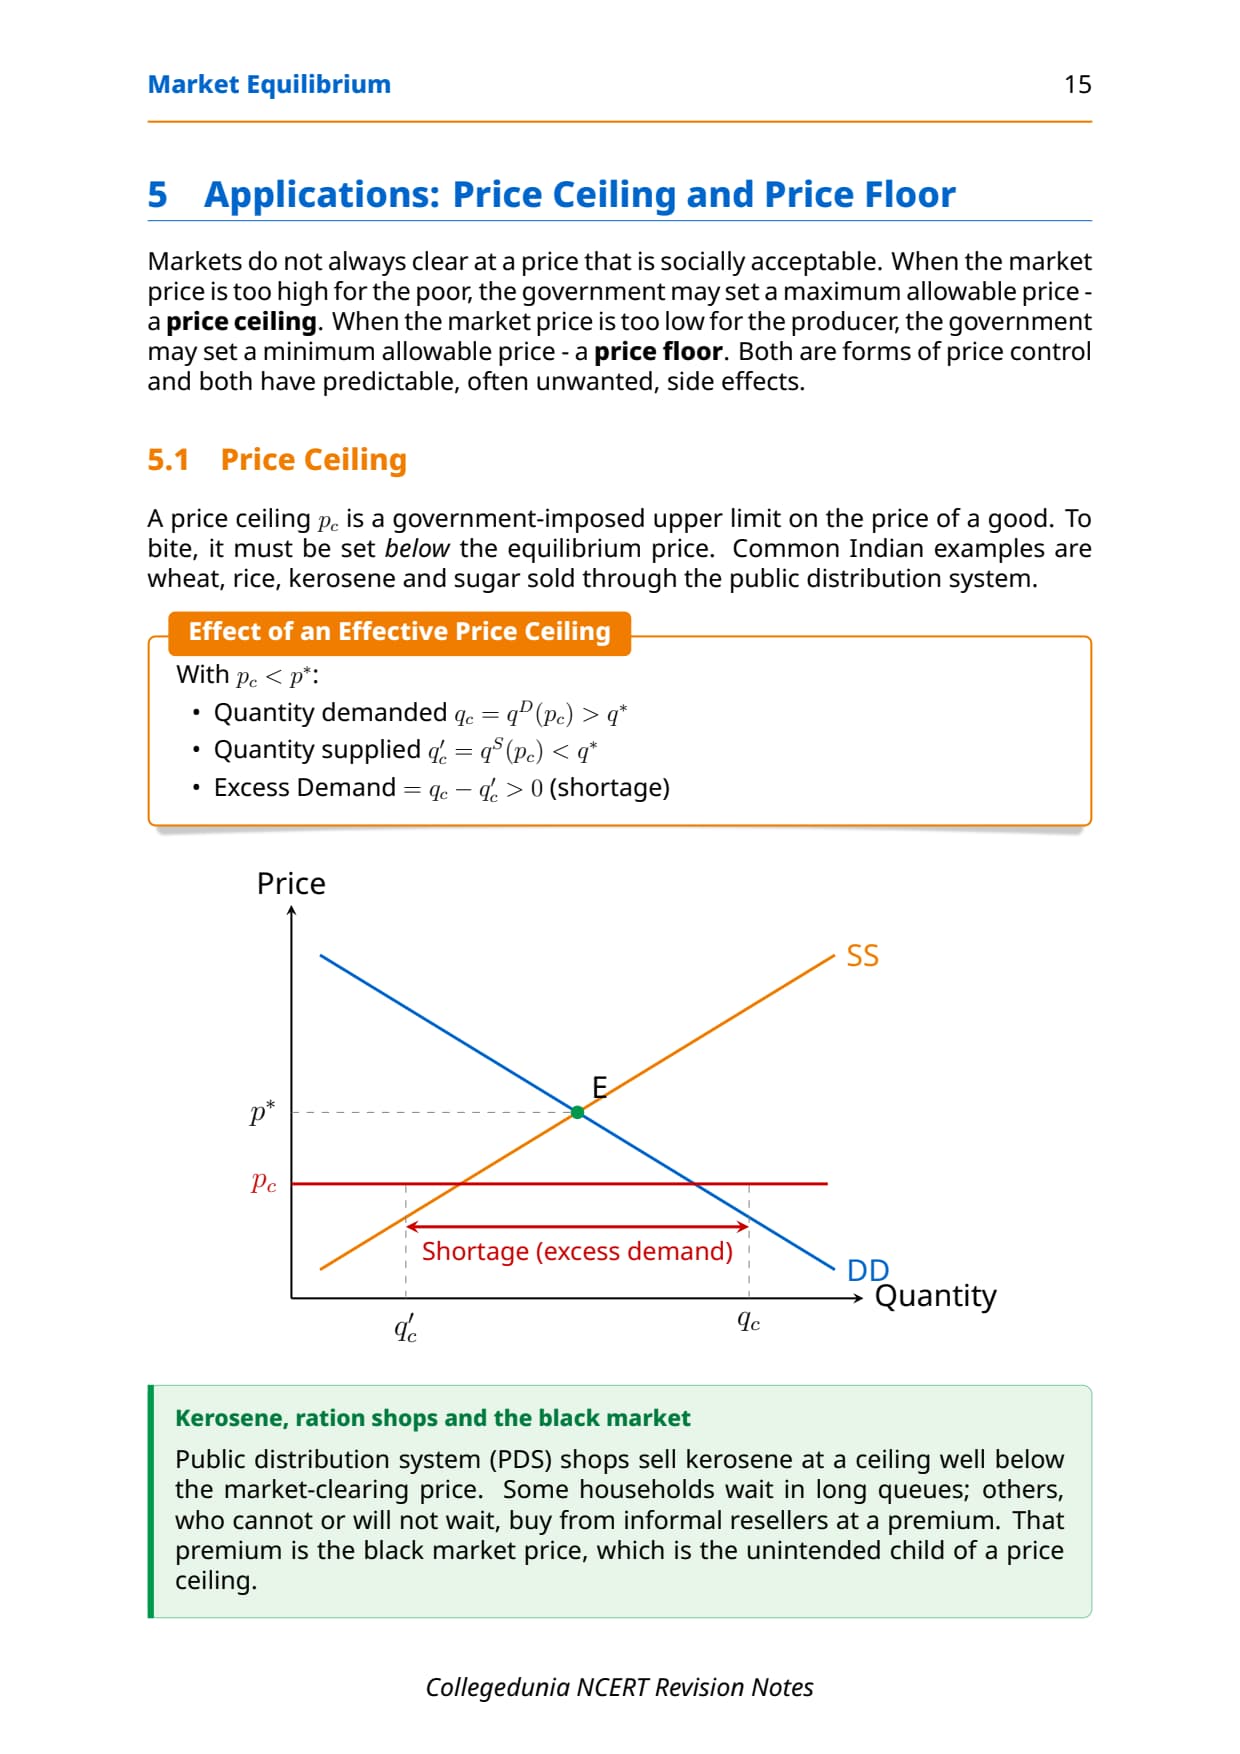
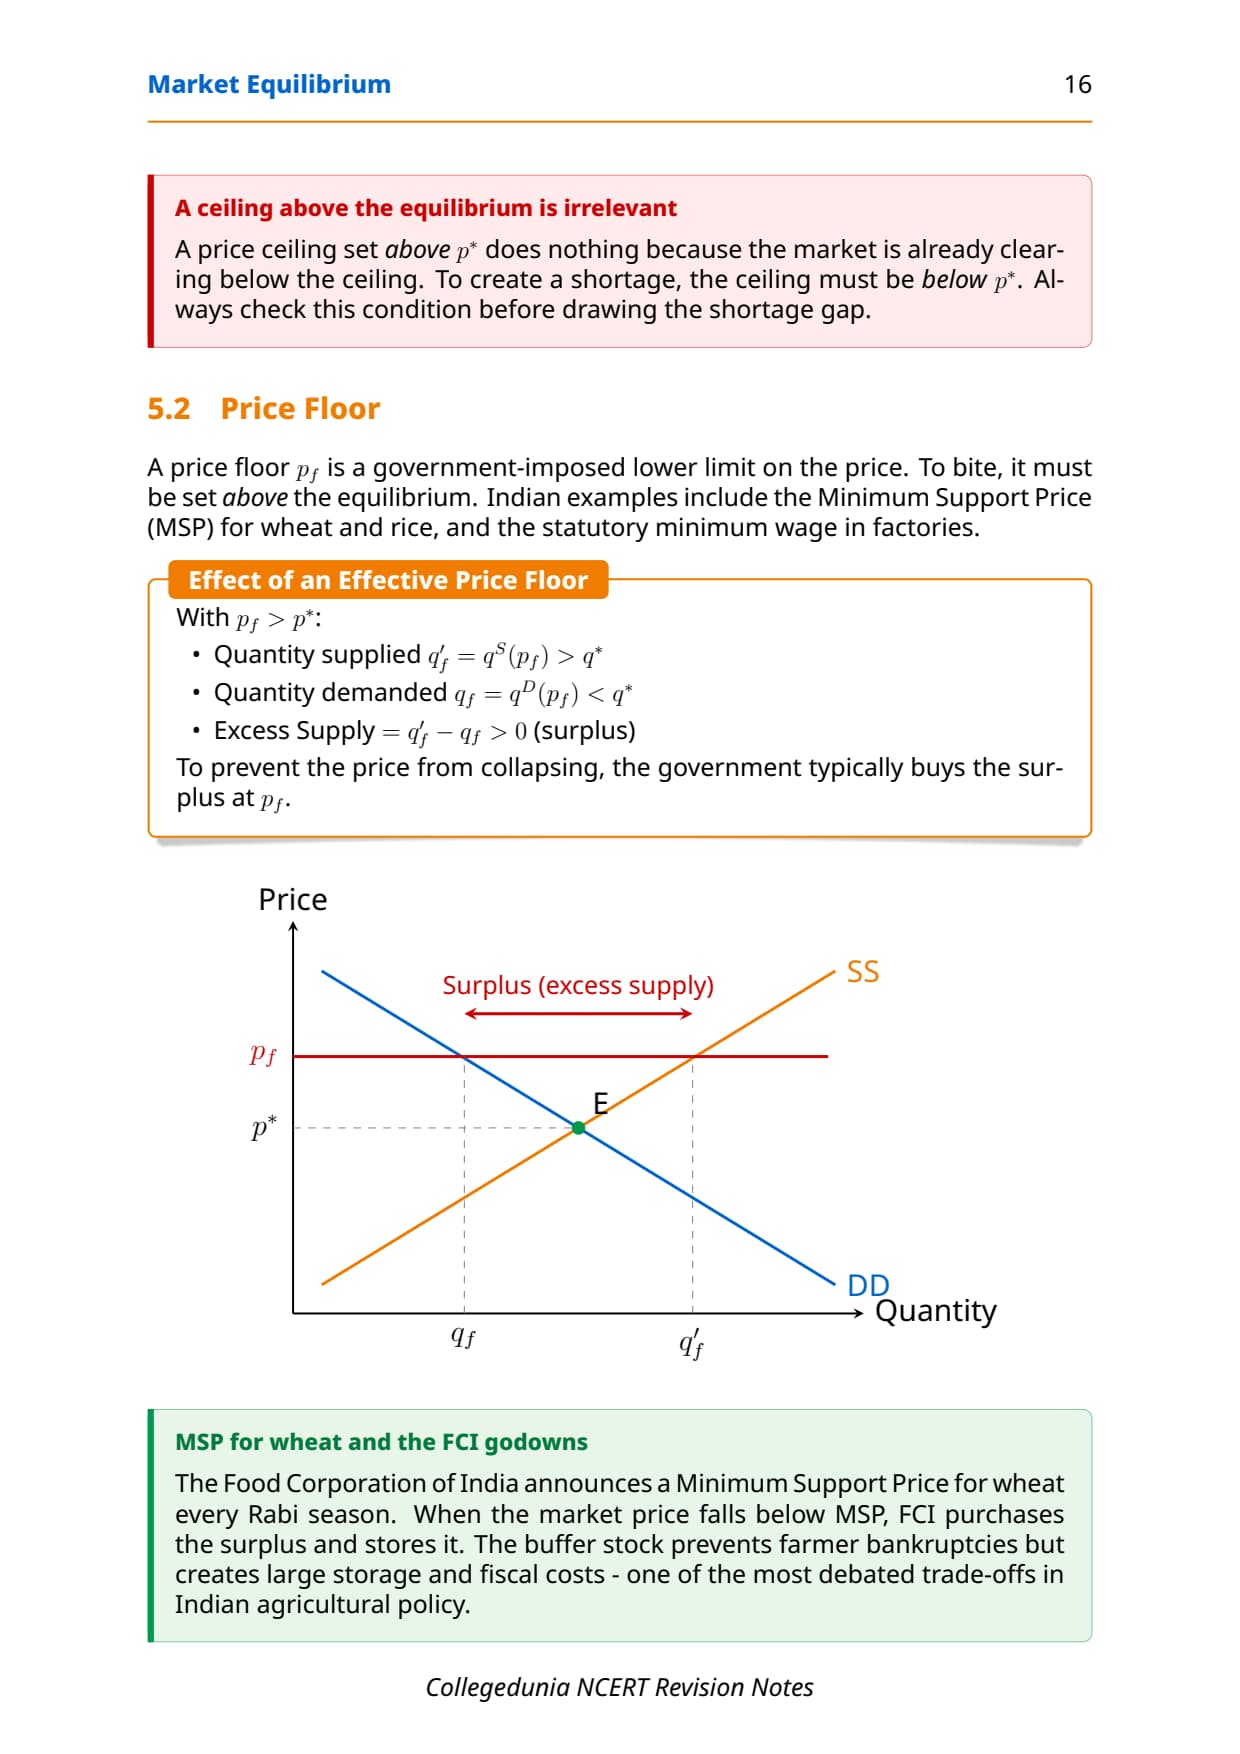
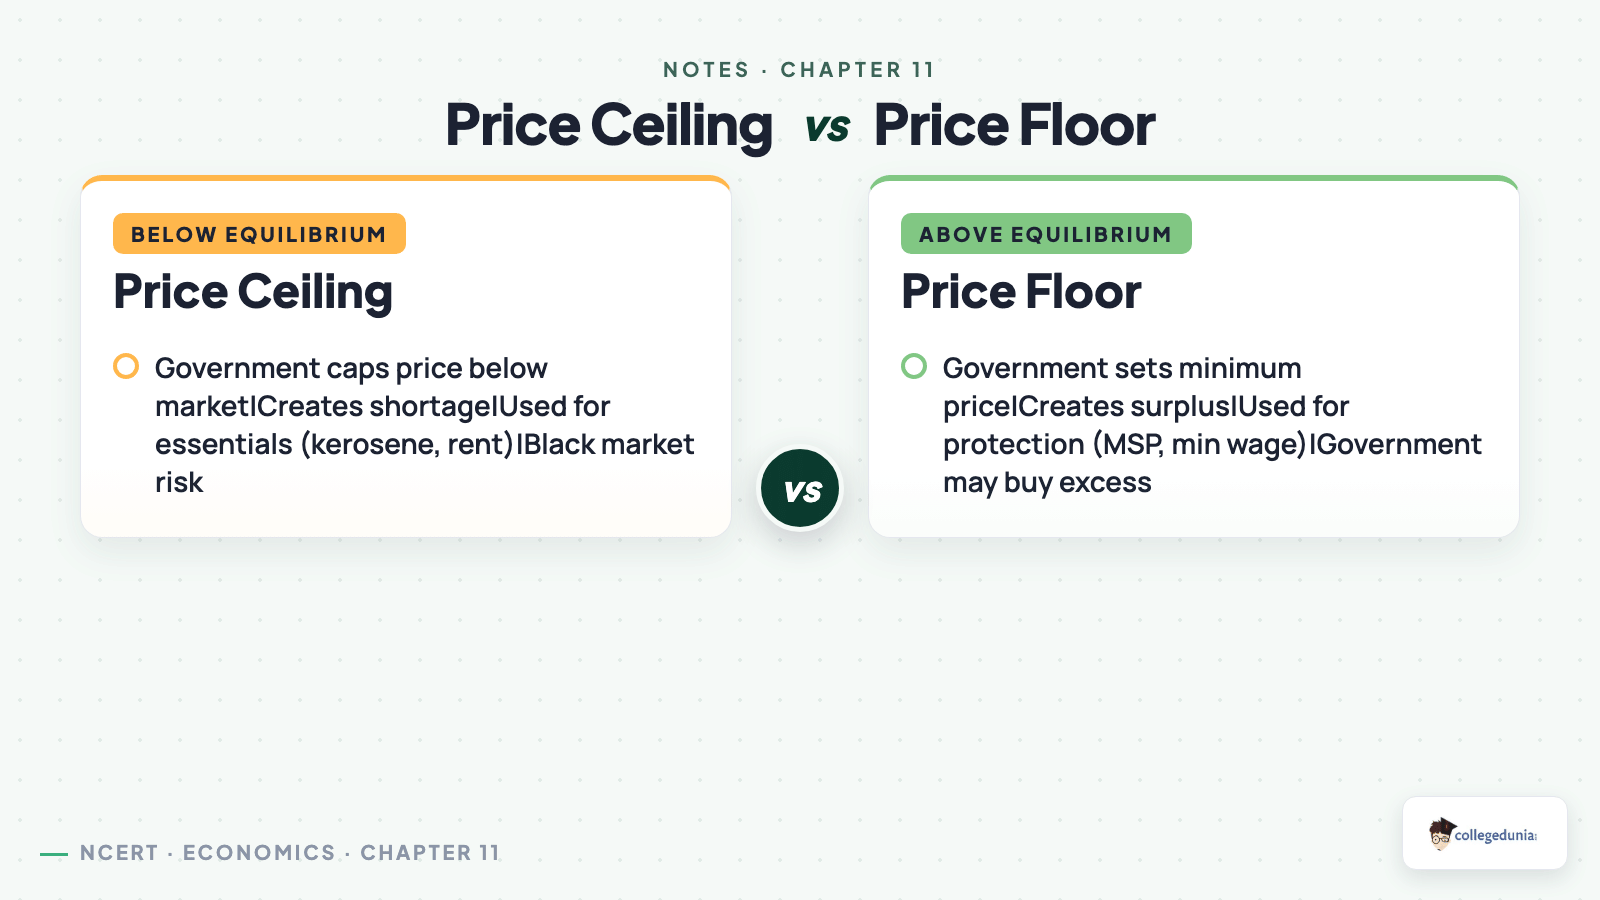
A price ceiling is a legal maximum below equilibrium (kerosene, rent control). A price floor is a legal minimum above equilibrium (MSP for wheat, minimum wage).
| Policy | Set | Result | Consequences |
|---|---|---|---|
| Price ceiling (effective) | Below P* | Shortage | Queues, rationing, black markets, lower quality. |
| Price floor (effective) | Above P* | Surplus | Government stockpiles, MSP buying, or unemployment. |
Exam cue: "kerosene", "ration shops" or "rent control" means price ceiling. "MSP", "minimum wage" or "FCI procurement" means price floor. Name the policy first, then the excess demand or supply, then two consequences.
Formula and Diagram Sheet for Market Equilibrium Class 12
This is the block to revise in the last 20 minutes before the exam.
| Concept | Formula or one-line statement |
|---|---|
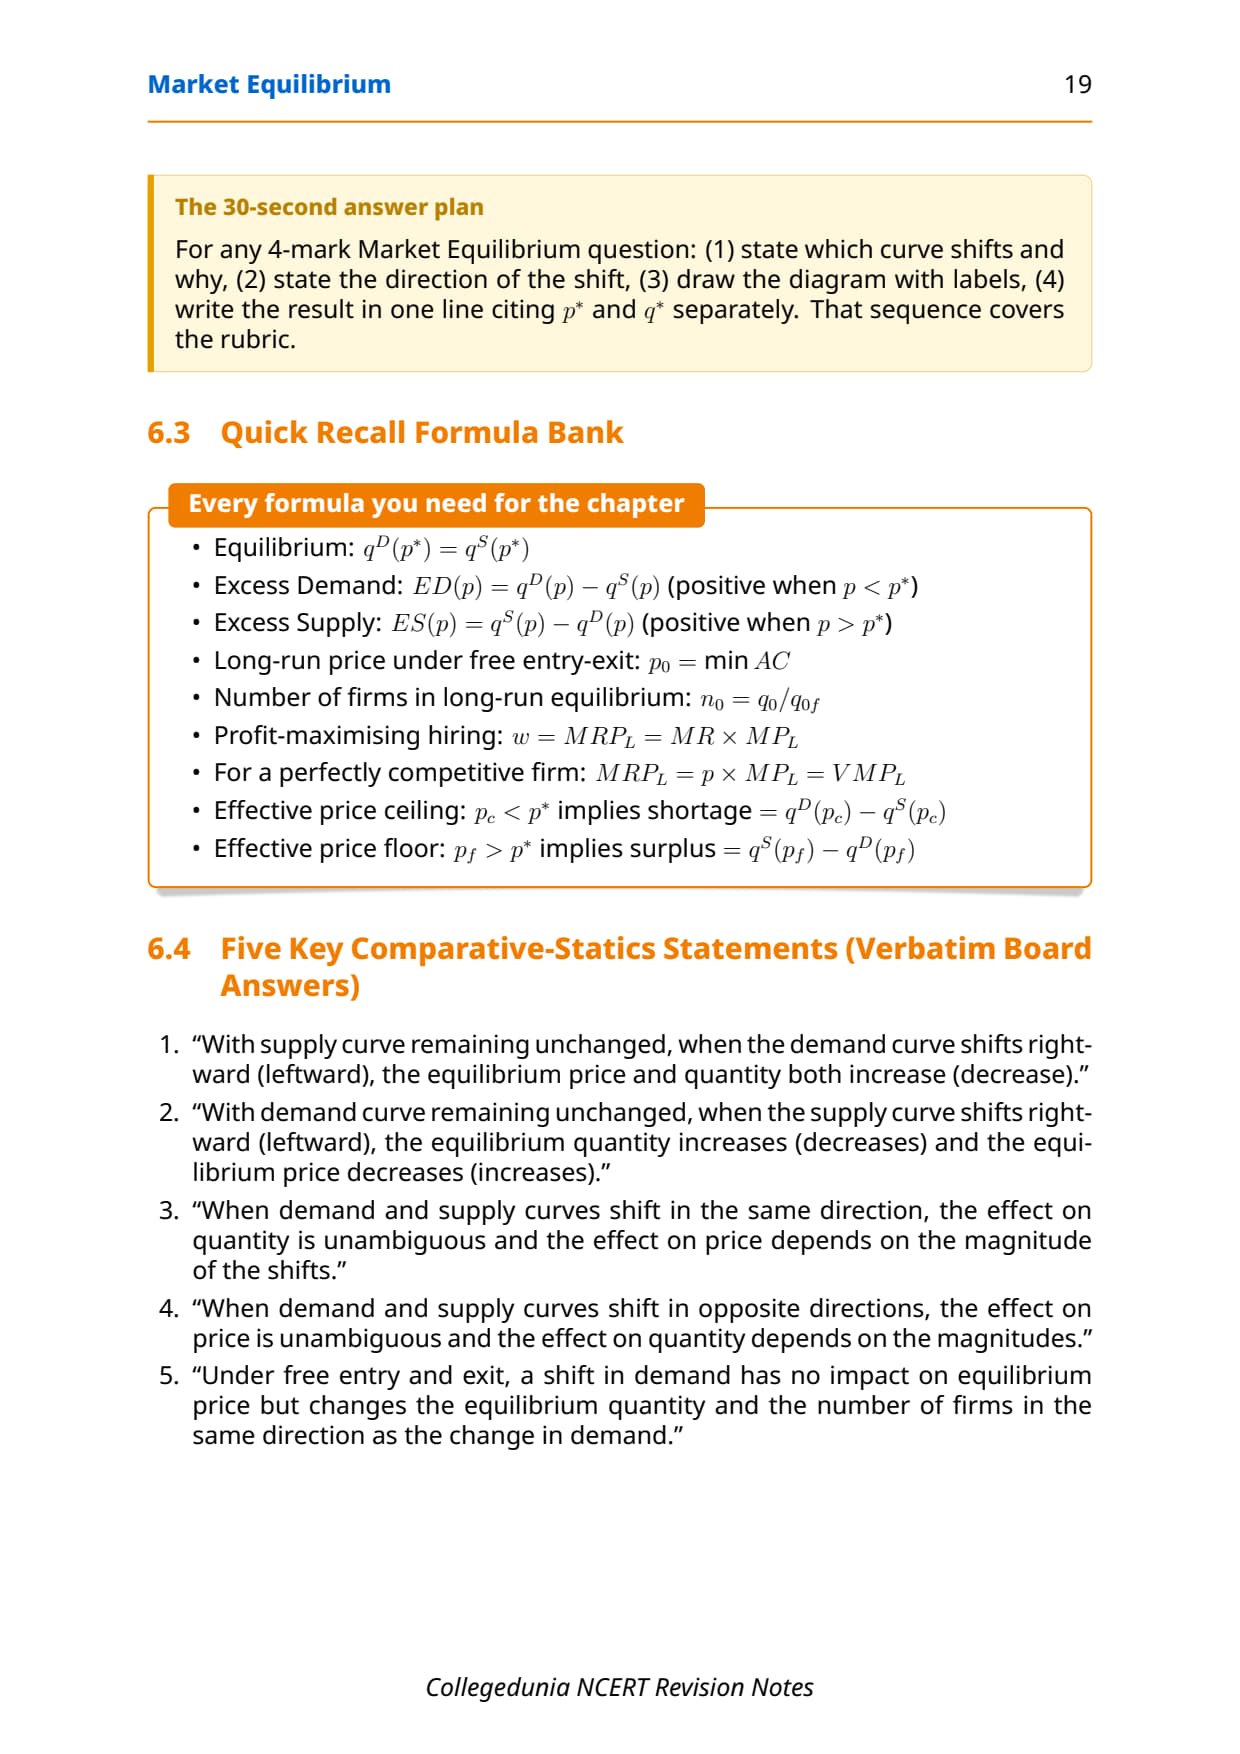
| Equilibrium condition | Q_d = Q_s at price P*. |
| Excess demand / supply | ED = Q_d - Q_s below P*; ES = Q_s - Q_d above P*. |
| Short-run firm profit | Profit = (P - SAC) x Q. |
| Long-run zero profit | P_LR = minimum LRAC; firm makes q_LR at that point. |
| Labour demand | MRP_L = MP_L x P. |
| Price ceiling | Below P*: shortage = Q_d - Q_s at the ceiling. |
| Price floor | Above P*: surplus = Q_s - Q_d at the floor. |
Worked sums on each formula sit in the matching NCERT Solutions for Class 12 Economics Chapter 5.
Common Mistakes in Market Equilibrium Class 12
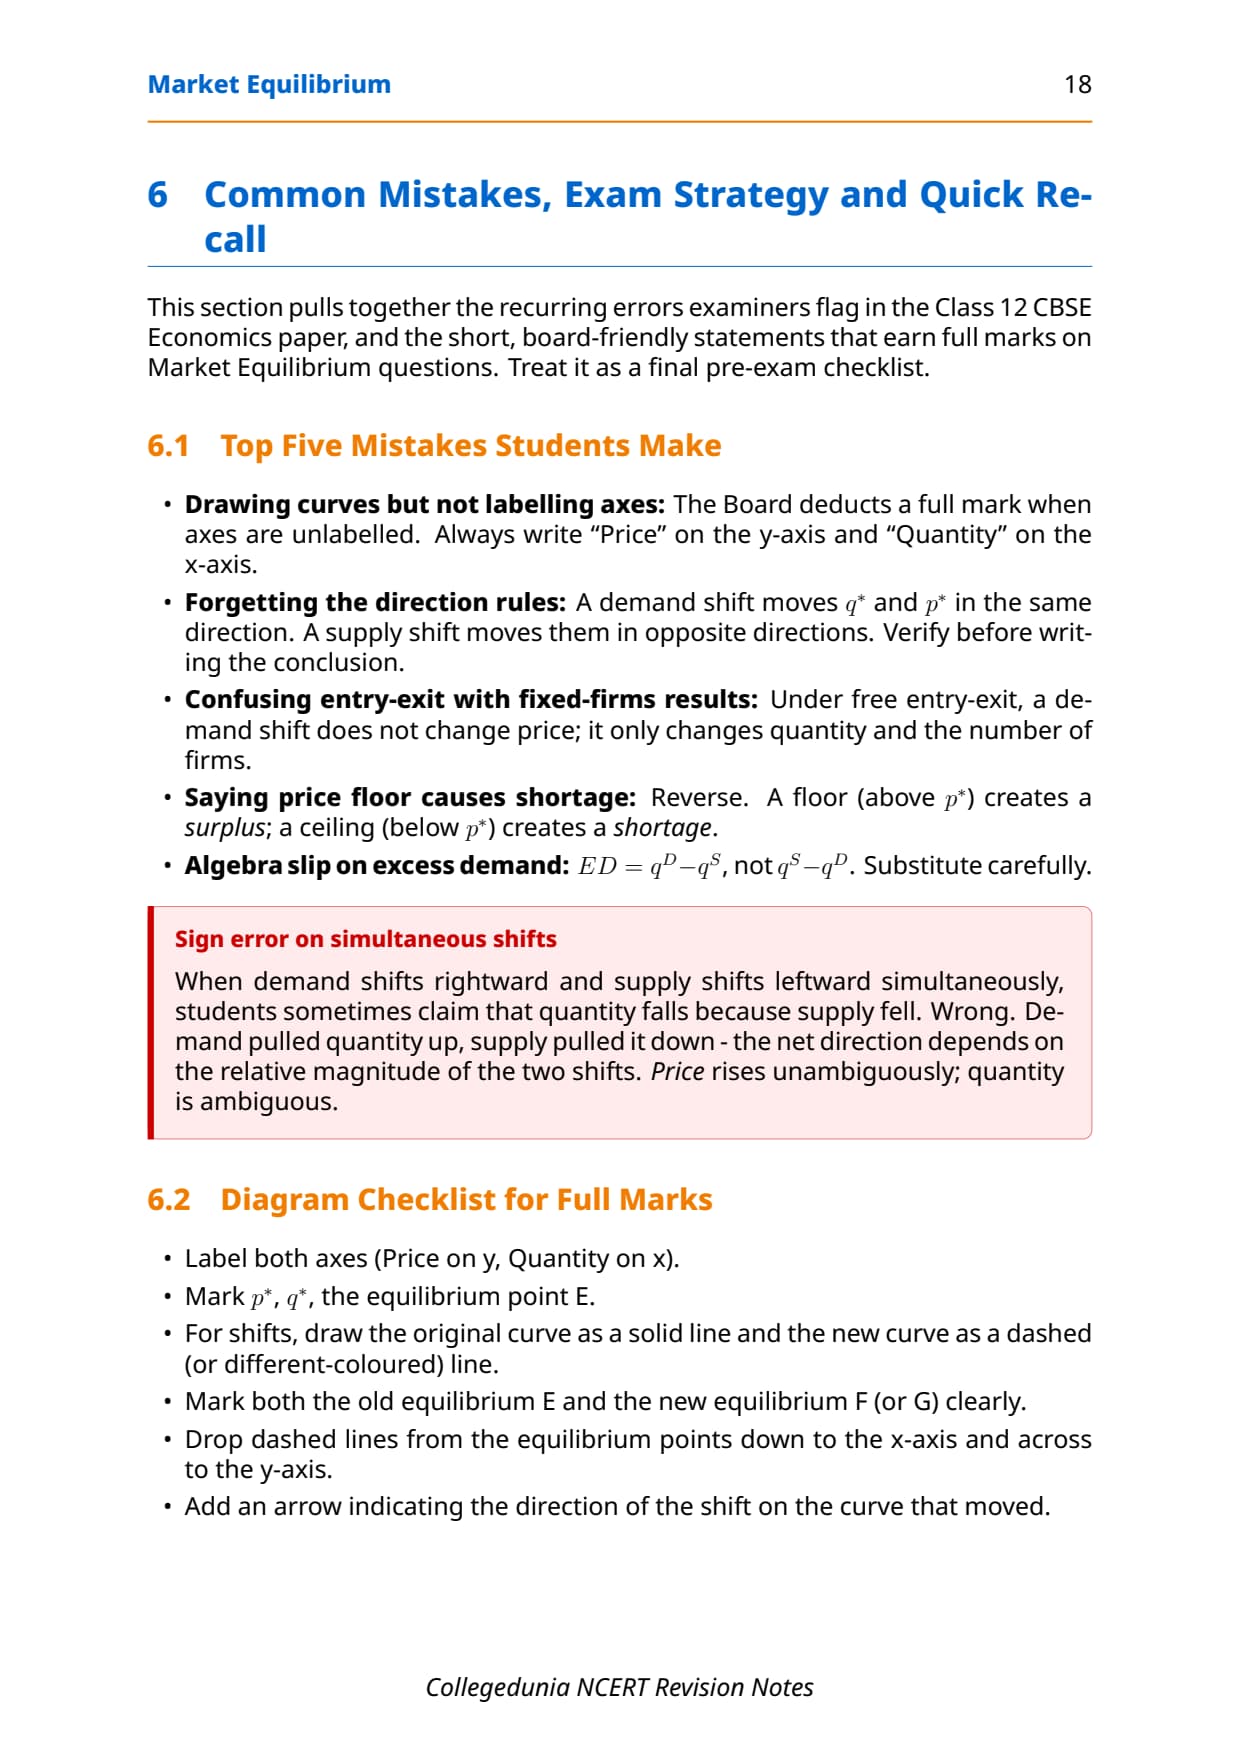
- Treating a change in the good's own price as a demand shift; it is a movement along the curve.
- Writing "positive profit in the long run"; free entry and exit drive profit to zero.
- Swapping shortage and surplus: below P* is shortage, above P* is surplus.
- Drawing the ceiling above P* or the floor below P*, where the policy does nothing.
- Writing MRP_L without the output price, or calling MSP a price ceiling.
Market Equilibrium Weightage in CBSE and CUET
The chapter carries about 8 to 10 marks a year. The table maps what CBSE has asked recently.
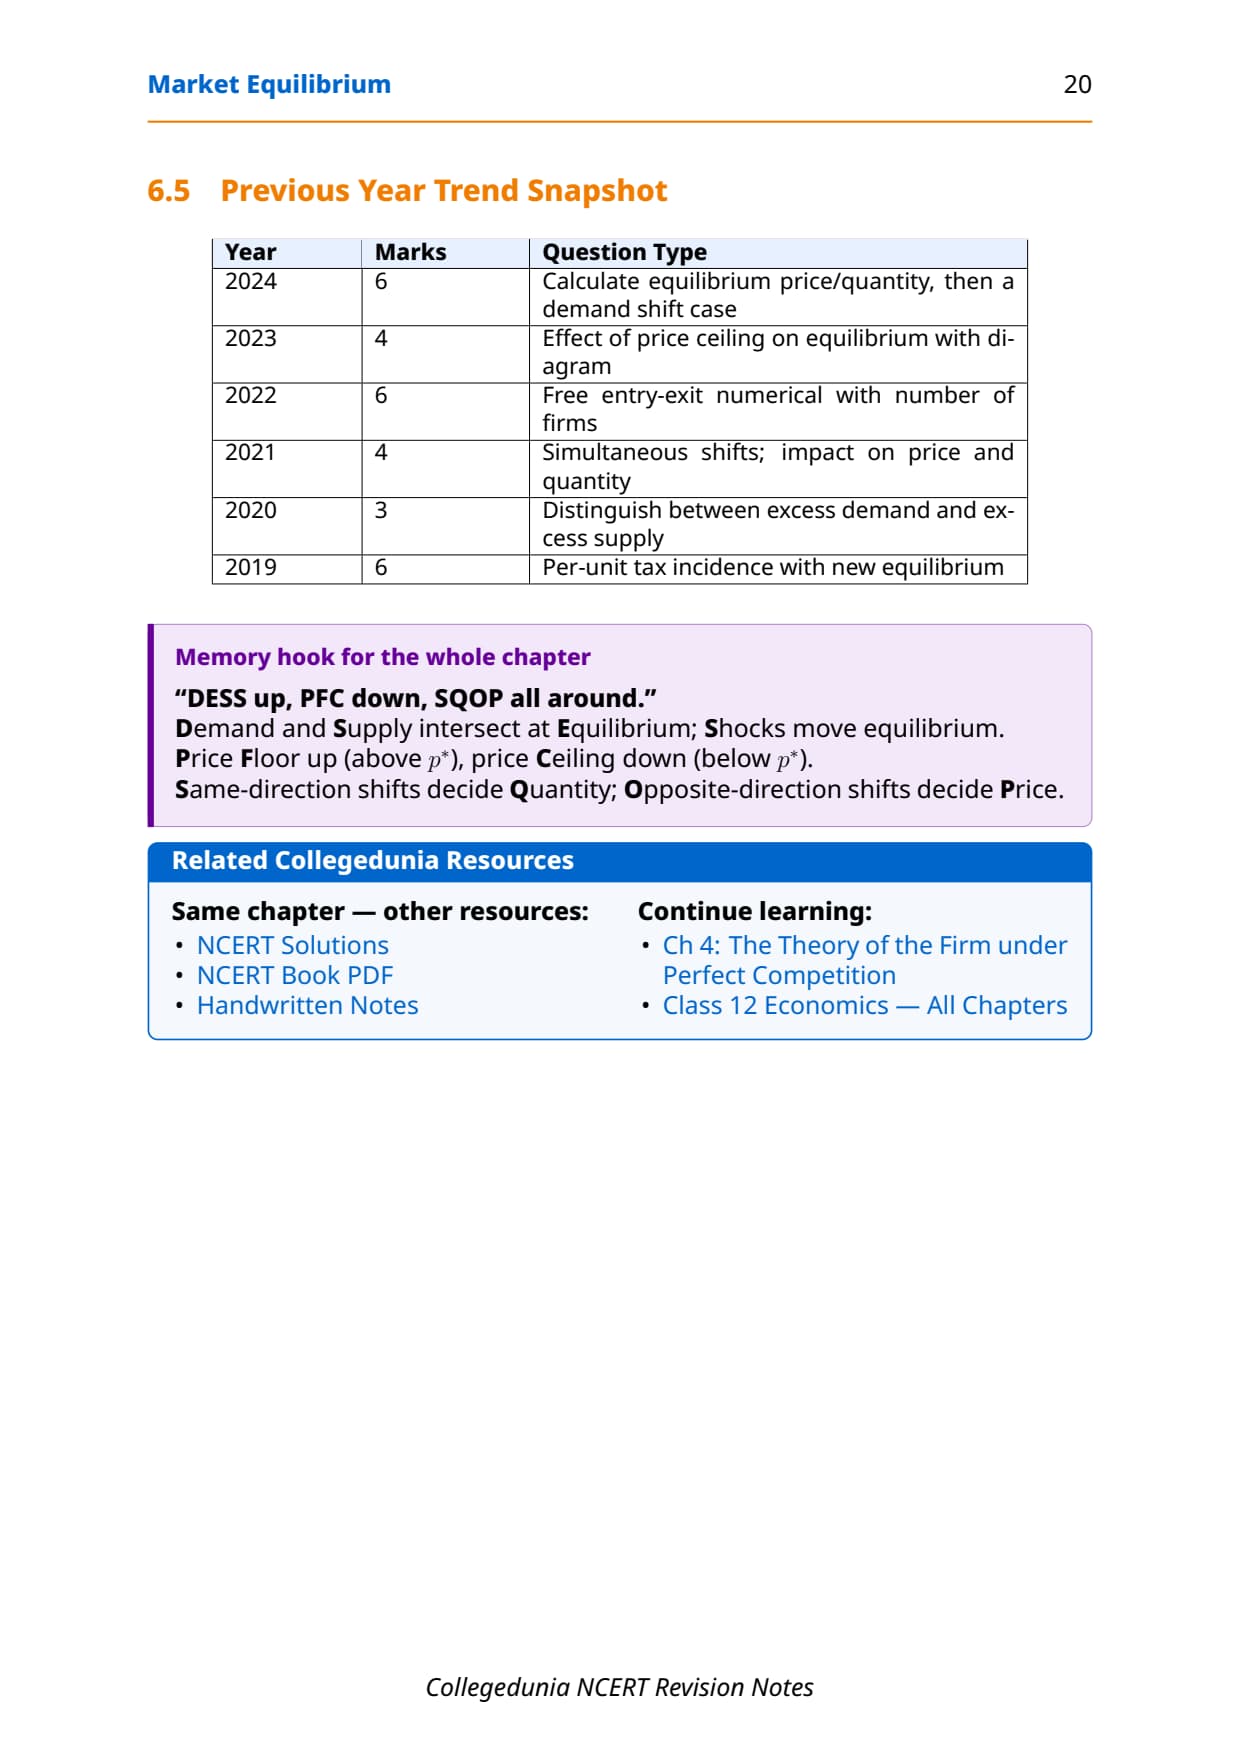
| Year | CBSE question | Marks |
|---|---|---|
| 2025 | Define equilibrium price; effect of demand right and supply left shifts | 1 + 4 |
| 2024 | Long-run equilibrium under free entry and exit; zero-profit condition | 3 + 1 |
| 2023 | Price ceiling vs price floor, with one Indian example of each | 3 + 1 |
| 2022 | Effect of a rise in input prices, with a diagram | 4 + 2 |
| 2021 | Define excess demand and supply; explain price adjustment | 1 + 3 |
Student Feedback
We asked 13,420 Class 12 students about this chapter. 71% found the long-run zero-profit case and the price ceiling and floor diagrams the hardest part. 3 out of 4 said the demand-shift and supply-shift table was the part most worth revising from a notes sheet.
Other Resources for Class 12 Economics Chapter 5 Market Equilibrium
Pair these notes with the Solutions, handwritten notes and the official NCERT chapter below.
| Resource | What it covers | Open |
|---|---|---|
| Notes | Concept-first revision of the full chapter. | Chapter 5 Notes |
| NCERT Solutions | Step-by-step answers to every exercise question. | Chapter 5 NCERT Solutions |
| Handwritten Notes | Scanned notebook pages for last-mile revision. | Chapter 5 Handwritten Notes |
| NCERT Book PDF | Official NCERT Microeconomics Chapter 5 textbook. | Chapter 5 NCERT Book PDF |
All Chapters Notes for Class 12 Microeconomics
| Chapter | Notes link |
|---|---|
| Chapter 1 | Introduction to Microeconomics |
| Chapter 2 | Theory of Consumer Behaviour |
| Chapter 3 | Production and Costs |
| Chapter 4 | Theory of the Firm under Perfect Competition |
| Chapter 5 | Market Equilibrium |
NCERT Notes Class 12 Economics Chapter 5 Market Equilibrium FAQs
Ques. What is market equilibrium in Class 12 Economics?
Ans. Market equilibrium is the state where the quantity demanded equals the quantity supplied at the going price. On a graph it is where the demand curve meets the supply curve. At that price there is no excess demand and no excess supply, so price does not change.
Ques. What is the difference between equilibrium with fixed firms and free entry and exit?
Ans. With fixed firms (short run), firms can earn profit, zero profit or a loss at the equilibrium price. With free entry and exit (long run), firms enter on profit and exit on losses, so the price ends up at the minimum LRAC and every firm earns zero economic profit.
Ques. What is excess demand and excess supply?
Ans. Excess demand (a shortage) is when quantity demanded is more than quantity supplied; it happens below P* and pushes price up. Excess supply (a surplus) is when quantity supplied is more than quantity demanded; it happens above P* and pushes price down. Both fade as price moves back to P*.
Ques. What is a price ceiling and a price floor?
Ans. A price ceiling is a legal maximum price set below P*, like kerosene or rent control; it causes a shortage with queues and black markets. A price floor is a legal minimum price set above P*, like the MSP for wheat or a minimum wage; it causes a surplus, taken up as stockpiles or unemployment.
Ques. Are these Market Equilibrium Class 12 notes enough for the CBSE board exam?
Ans. They are enough for theory and 1 to 3 mark questions. For numericals and diagrams, pair them with the matching NCERT Solutions PDF and one practice drill on equilibrium, shifts and price controls. The 2026-27 syllabus is unchanged for this chapter.



Comments