The NCERT Solutions for Class 11 Geography Chapter 8 Solar Radiation, Heat Balance and Temperature cover all 9 textbook questions from the latest 2026-27 NCERT book. The chapter explains insolation, albedo, heat budget, temperature controls, isotherms and January temperature distribution.
Covers every Chapter 8 exercise question with direct answers and expert explanations.
Focuses on high scoring ideas: insolation, terrestrial radiation, albedo, heat balance and isotherms.
Useful for school exams because the answers connect NCERT facts with map-reading and diagram points.
Student Feedback: In a Collegedunia poll of 10,280 Class 11 Geography students preparing for the 2026-27 school exams, 72% said the heat-budget answer became easier when the 100-unit model was written step by step.
Source: 2026-27 Class 11 Geography student poll across CBSE schools.
Every answer in this chapter set is checked against the 2026-27 NCERT Geography textbook and written so that students can revise the fact, explanation and diagram framing together.
Solar Radiation, Heat Balance and Temperature explains how solar energy reaches Earth, how the atmosphere is heated and why temperatures vary from place to place. The solutions PDF follows the NCERT exercise order so that students can move from factual MCQs to short answers, map interpretation and heat-budget explanation without mixing the concepts.
Chapter area
What students must know
Where it helps
Insolation
Incoming solar radiation and why it varies by latitude, season and day length
Questions 1 and 3(i)
Heating of atmosphere
Earth heats air mainly through long wave terrestrial radiation
Questions 1 and 2(ii)
Temperature controls
Latitude, altitude, sea distance, air mass, ocean currents and local aspects
Question 2(ii)
Heat balance
Reflection, absorption and outgoing radiation in the 100-unit NCERT model
Question 3(ii)
Isotherms
January temperature patterns in northern and southern hemispheres
Question 3(iii)
Start this chapter with the energy chain: incoming solar radiation, reflected radiation, absorbed radiation and outgoing terrestrial radiation. Once the chain is clear, the longer answers become easier to frame.
Solar Radiation Heat Balance and Temperature Video Explanation
Solar Radiation and Heat Balance Ideas for Class 11 Geography
The chapter uses a simple energy-account method. Out of 100 units of incoming solar radiation, a part is reflected back to space and the rest is absorbed by the atmosphere and the surface. The warmed surface then sends out long wave terrestrial radiation. The atmosphere absorbs some of this heat and finally radiates energy back to space.
Insolation: incoming solar radiation received by Earth.
Albedo: the percentage of light reflected by a surface.
Terrestrial radiation: long wave radiation emitted by the heated Earth surface.
Heat balance: the long-term match between absorbed solar energy and outgoing radiation.
This is why the PDF answer to the heat-budget question uses the 100-unit NCERT model. It gives students a measurable chain instead of a vague paragraph about heating and cooling.
Temperature Distribution Controls in Solar Radiation Heat Balance and Temperature
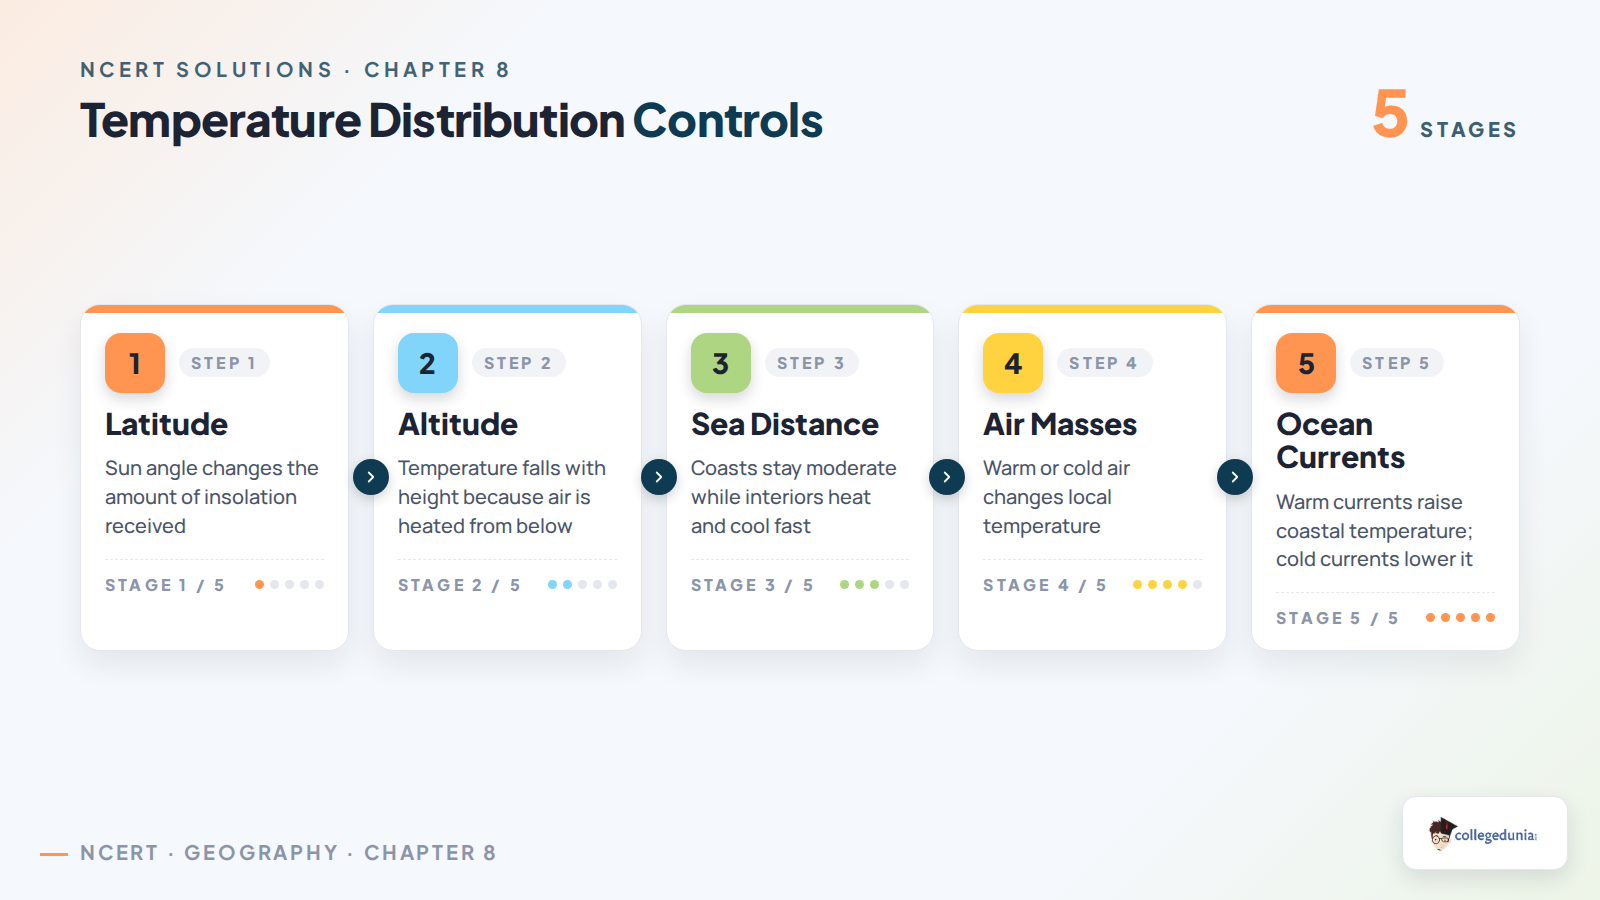
Temperature distribution is controlled by both solar geometry and surface conditions. Latitude changes the angle of rays, altitude changes air density and distance from the sea changes how quickly a place heats or cools. Ocean currents, air masses and local aspects then modify the pattern.
Control
Effect on temperature
Exam point
Latitude
Low latitudes receive more direct rays than high latitudes
Explains global radiation variation
Altitude
Temperature usually falls with height
Explains hill-station coolness
Sea distance
Coastal areas have a smaller annual range than interiors
Explains maritime and continental effect
Ocean currents
Warm and cold currents modify coastal temperatures
Explains isotherm bending
Local aspects
Slope direction and surface cover affect heating
Useful for short-answer framing
How to Write Better Answers for Solar Radiation, Heat Balance and Temperature
Chapter 8 answers score well when the explanation is written as a chain. For heat-balance questions, begin with incoming radiation and end with outgoing radiation. For temperature-distribution questions, compare factors rather than listing them mechanically. For isotherm questions, connect the line pattern with land, sea and ocean-current effects.
Use exact NCERT terms. Write insolation, albedo, terrestrial radiation, isotherm and annual range clearly.
Add the reason after each term. A one-line definition is not enough for long-answer questions.
Use the 100-unit model. It makes the heat-budget answer specific and easy to check.
Compare hemispheres directly. January isotherms are irregular in the northern hemisphere and smoother in the southern hemisphere.
All NCERT Solutions for Class 11 Geography Chapter 8 Solar Radiation, Heat Balance and Temperature with Step-by-Step Solutions
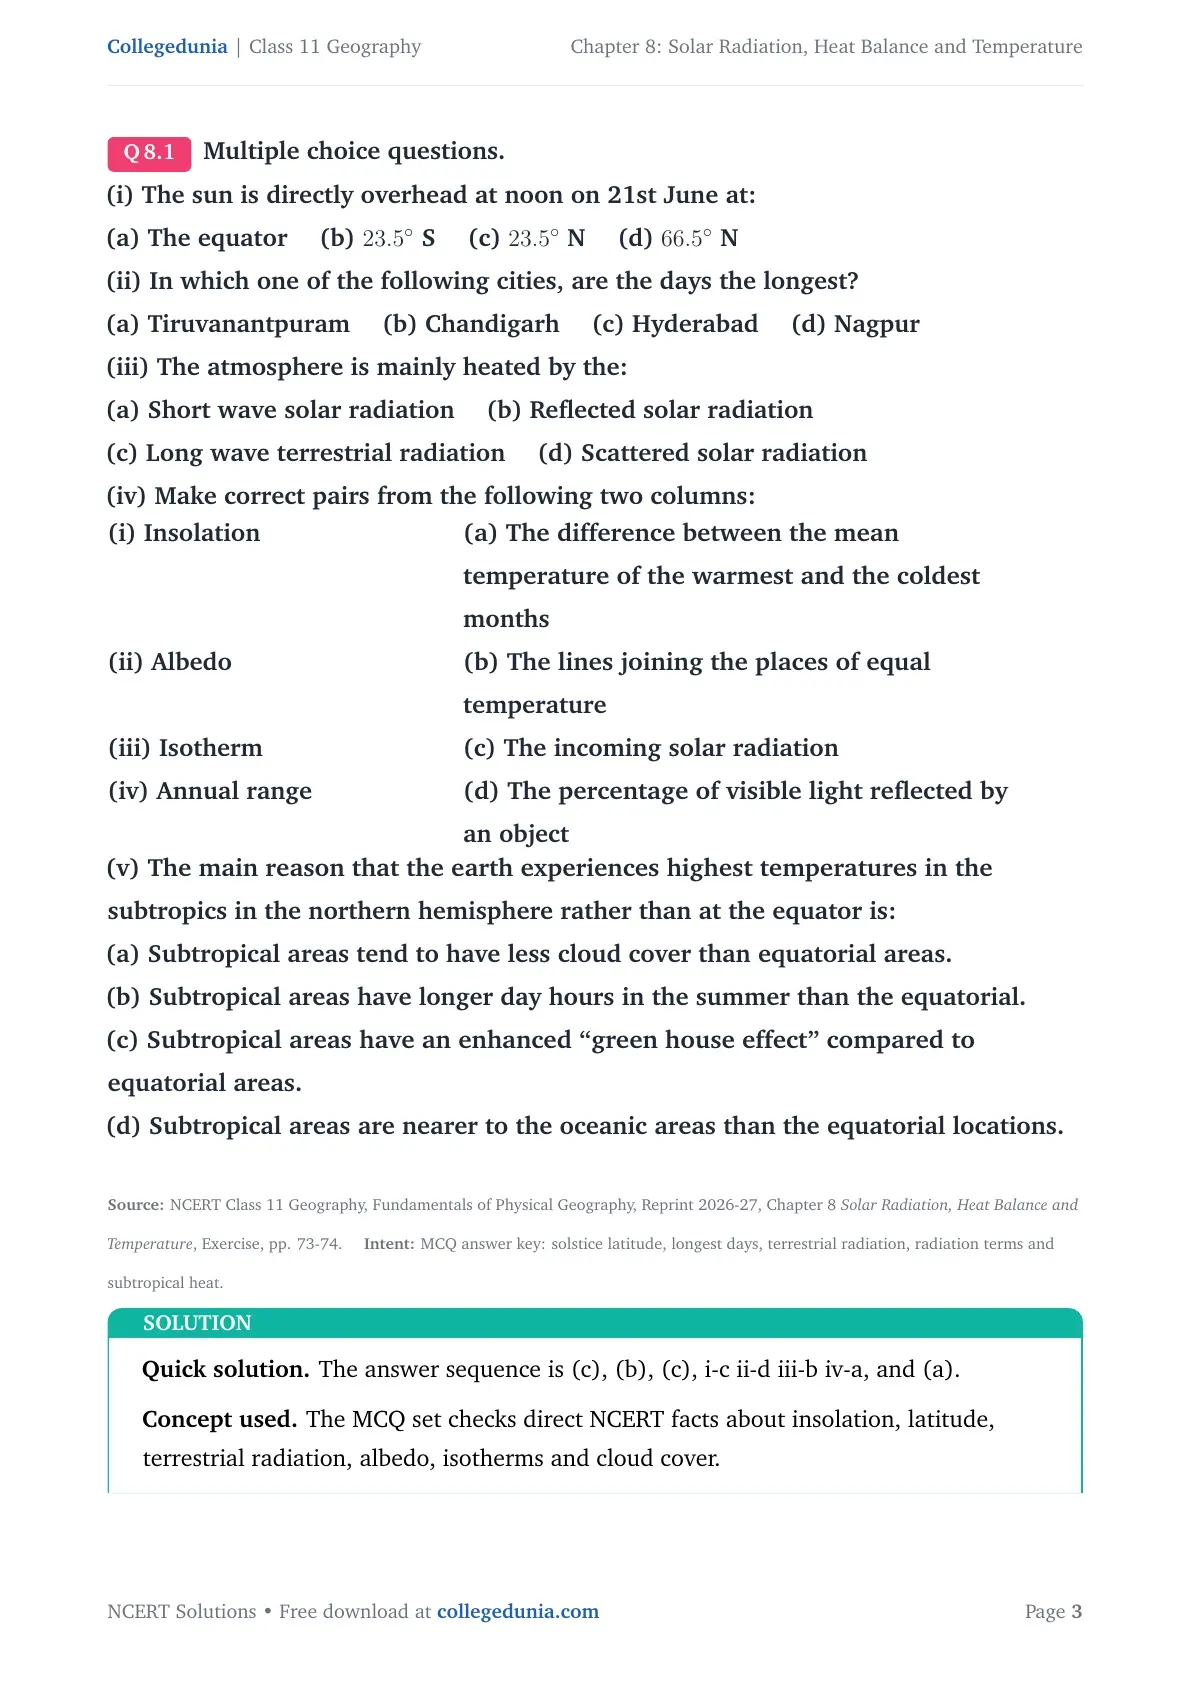
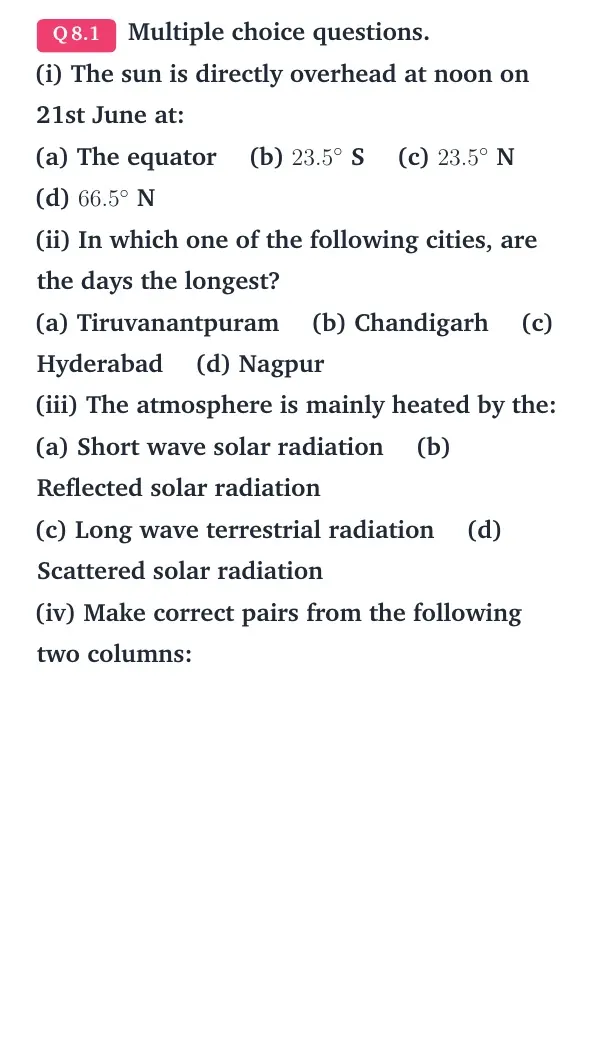
Q 8.1
Multiple choice questions.
(i) The sun is directly overhead at noon on 21st June at:
(a) The equator (b) 23.5∘ S (c) 23.5∘ N (d) 66.5∘ N
(ii) In which one of the following cities, are the days the longest?
(a) Tiruvanantpuram (b) Chandigarh (c) Hyderabad (d) Nagpur
(iii) The atmosphere is mainly heated by the:
(a) Short wave solar radiation (b) Reflected solar radiation
(c) Long wave terrestrial radiation (d) Scattered solar radiation
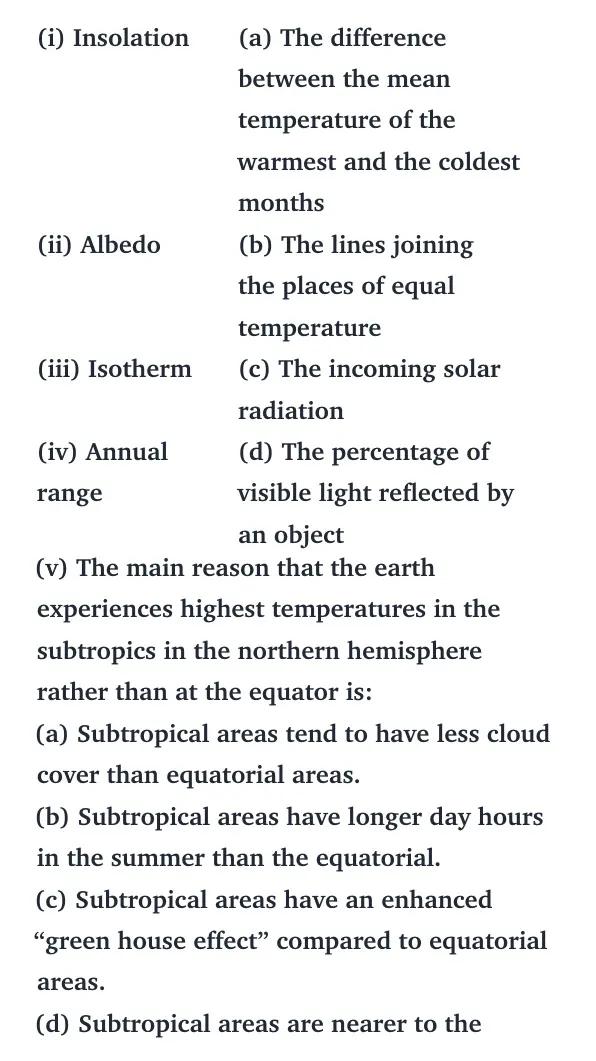
(iv) Make correct pairs from the following two columns:
tabular@p0.34p0.58@
(i) Insolation & (a) The difference between the mean temperature of the warmest and the coldest months
(ii) Albedo & (b) The lines joining the places of equal temperature
(iii) Isotherm & (c) The incoming solar radiation
(iv) Annual range & (d) The percentage of visible light reflected by an object
tabular
(v) The main reason that the earth experiences highest temperatures in the subtropics in the northern hemisphere rather than at the equator is:
(a) Subtropical areas tend to have less cloud cover than equatorial areas.
(b) Subtropical areas have longer day hours in the summer than the equatorial.
(c) Subtropical areas have an enhanced ``green house effect'' compared to equatorial areas.
(d) Subtropical areas are nearer to the oceanic areas than the equatorial locations.
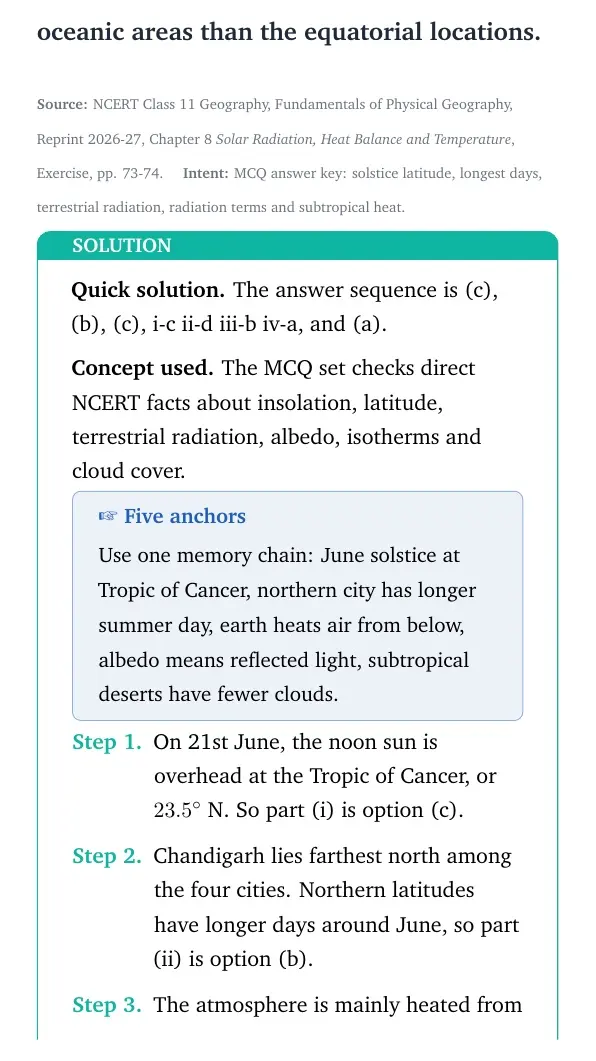
The answer sequence is (c), (b), (c), i-c ii-d iii-b iv-a, and (a).
Concept used. The MCQ set checks direct NCERT facts about insolation, latitude, terrestrial radiation, albedo, isotherms and cloud cover.
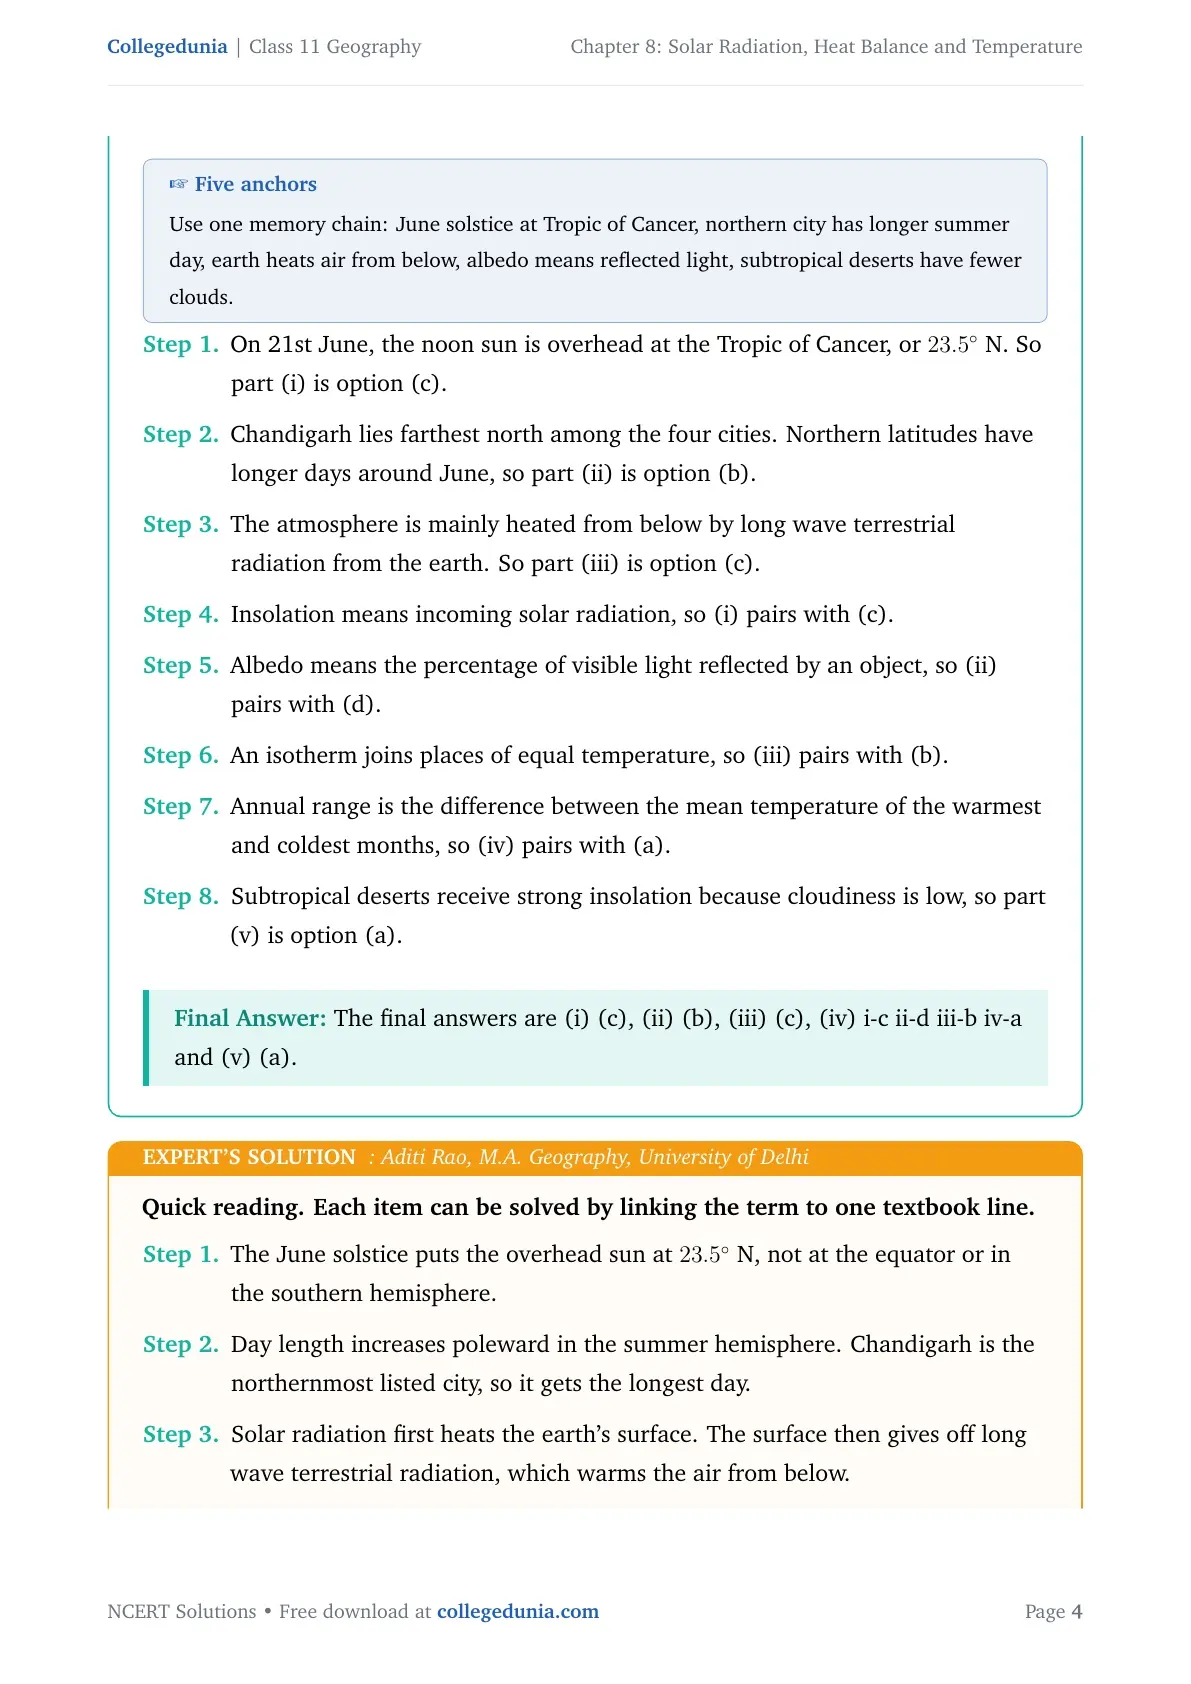
Five anchors
Use one memory chain: June solstice at Tropic of Cancer, northern city has longer summer day, earth heats air from below, albedo means reflected light, subtropical deserts have fewer clouds.
On 21st June, the noon sun is overhead at the Tropic of Cancer, or 23.5∘ N. So part (i) is option (c).
Chandigarh lies farthest north among the four cities. Northern latitudes have longer days around June, so part (ii) is option (b).
The atmosphere is mainly heated from below by long wave terrestrial radiation from the earth. So part (iii) is option (c).
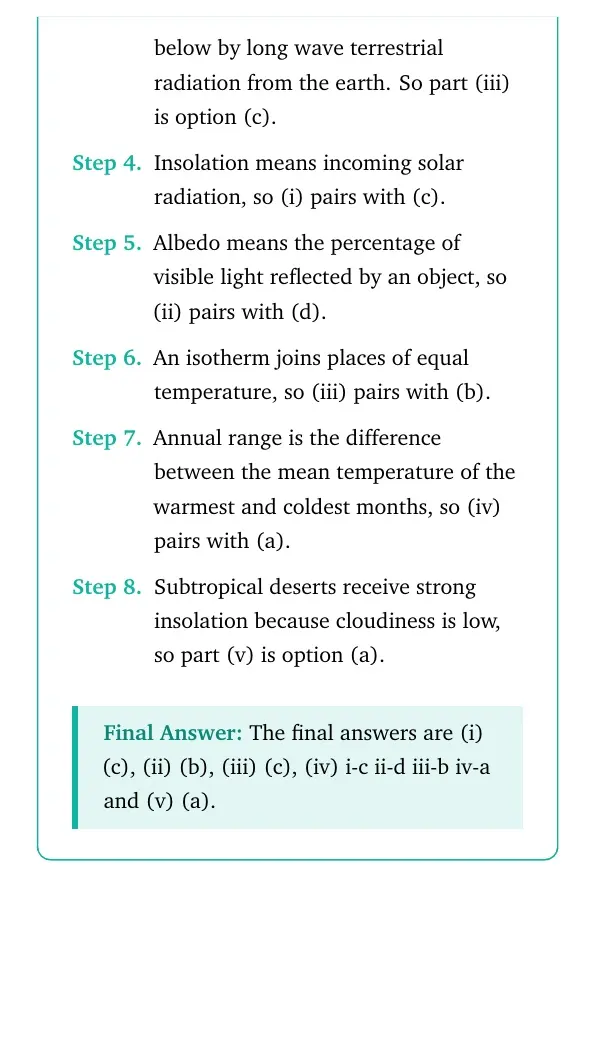
Insolation means incoming solar radiation, so (i) pairs with (c).
Albedo means the percentage of visible light reflected by an object, so (ii) pairs with (d).
An isotherm joins places of equal temperature, so (iii) pairs with (b).
Annual range is the difference between the mean temperature of the warmest and coldest months, so (iv) pairs with (a).
Subtropical deserts receive strong insolation because cloudiness is low, so part (v) is option (a).
The final answers are (i) (c), (ii) (b), (iii) (c), (iv) i-c ii-d iii-b iv-a and (v) (a).
AR
Aditi Rao
M.A. Geography, University of Delhi
Verified Expert
Quick reading. Each item can be solved by linking the term to one textbook line.
The June solstice puts the overhead sun at 23.5∘ N, not at the equator or in the southern hemisphere.
Day length increases poleward in the summer hemisphere. Chandigarh is the northernmost listed city, so it gets the longest day.
Solar radiation first heats the earth's surface. The surface then gives off long wave terrestrial radiation, which warms the air from below.
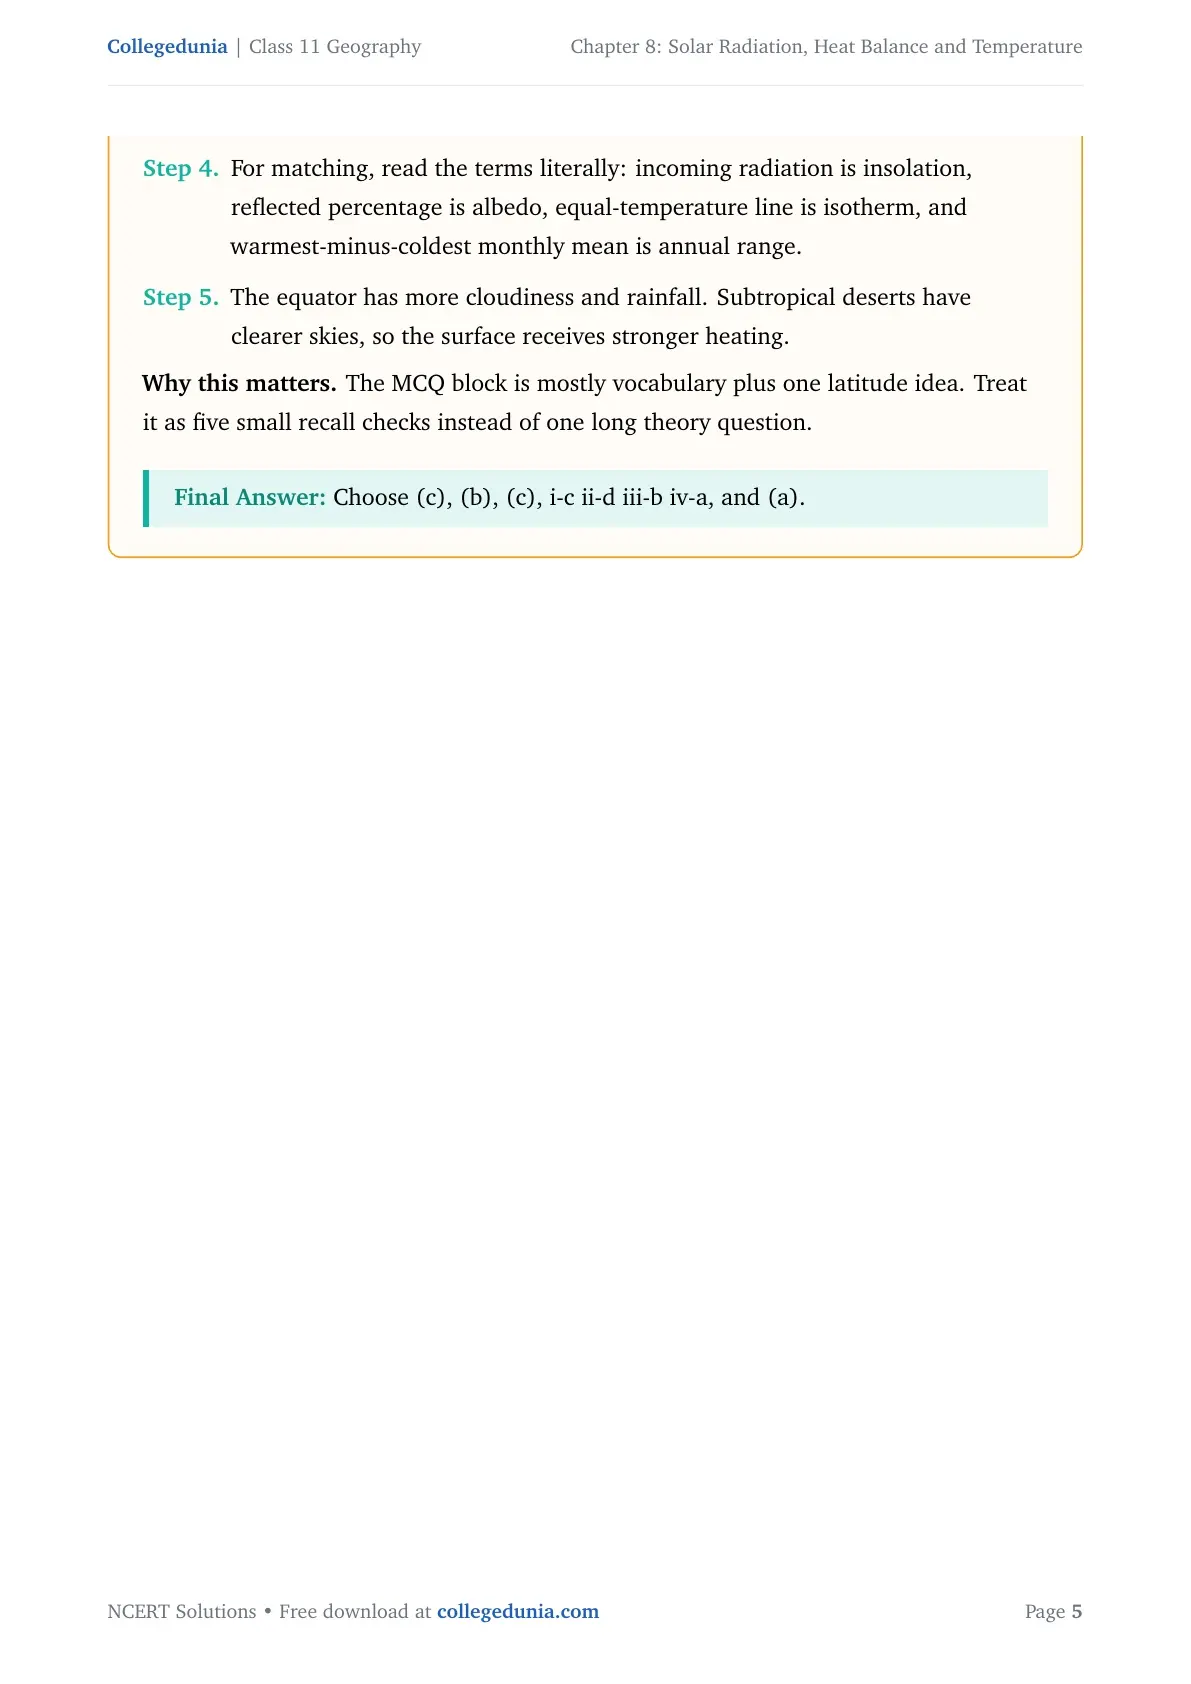
For matching, read the terms literally: incoming radiation is insolation, reflected percentage is albedo, equal-temperature line is isotherm, and warmest-minus-coldest monthly mean is annual range.
The equator has more cloudiness and rainfall. Subtropical deserts have clearer skies, so the surface receives stronger heating.
Why this matters. The MCQ block is mostly vocabulary plus one latitude idea. Treat it as five small recall checks instead of one long theory question.
Choose (c), (b), (c), i-c ii-d iii-b iv-a, and (a).
Q 8.2
How does the unequal distribution of heat over the planet earth in space and time cause variations in weather and climate?
Unequal heating creates temperature and pressure differences. Air moves from one region to another, transferring heat and causing variations in weather and climate.
Concept used. Insolation is not received equally everywhere. Differences in latitude, season, day length and land-sea contrast create uneven heating.
Write the chain
Use the chain: unequal insolation, temperature difference, pressure difference, winds, weather and climate variation.
Different parts of the earth receive different amounts of insolation.
The tropics receive more direct rays, while higher latitudes receive slanting rays.
The amount of heating also changes with day length and season.
Unequal heating creates temperature differences from place to place.
Temperature differences create pressure differences in the atmosphere.
Air moves from one pressure region to another as wind.
These winds transfer heat and moisture, so weather and climate vary across the earth.
Unequal heat distribution creates temperature and pressure differences. Winds then transfer heat and moisture, producing spatial and seasonal variations in weather and climate.
RM
Rohan Mehta
M.Sc Earth Science, IIT Kharagpur
Verified Expert
Cause-effect angle. The answer should move from solar energy to atmospheric motion.
The sun heats the earth unevenly because the earth is spherical and tilted.
This means one region may be warmer while another is cooler at the same time.
Warm air expands and tends to rise, while cooler air is denser and tends to sink.
This difference creates pressure belts and local pressure contrasts.
Air movement tries to reduce the contrast by transferring heat from surplus regions to deficit regions.
The movement of air also carries moisture and clouds, which changes rainfall, storms and daily weather.
Over many years, the repeated pattern of these conditions becomes the climate of a place.
Why this matters. The question asks how variation is produced. A clear cause-effect chain earns more than a paragraph that only says the earth is heated unevenly.
Unequal heating drives pressure differences and winds; these control temperature, rainfall and the climate pattern of each region.
Q 8.3
What are the factors that control temperature distribution on the surface of the earth?
Temperature distribution is controlled by latitude, altitude, distance from the sea, air-mass circulation, ocean currents and local aspects.
Concept used. Temperature distribution means how heat conditions vary from place to place on the earth's surface.
Use NCERT order
Write the factors in NCERT order so none are missed: latitude, altitude, sea distance, air mass, ocean current and local aspects.
Latitude controls the angle of the sun's rays and the amount of insolation received.
Altitude controls temperature because the atmosphere is heated mainly from below by terrestrial radiation.
Distance from the sea matters because land heats and cools faster than the sea.
Air-mass circulation affects temperature when warm or cold air moves into a region.
Ocean currents influence coastal temperature. Warm currents raise temperature, while cold currents lower it.
Local aspects such as slope direction and exposure also affect the amount of heating.
The main controls are latitude, altitude, distance from the sea, air-mass circulation, warm and cold ocean currents, and local aspects.
KI
Kavya Iyer
M.Sc Geography, Savitribai Phule Pune University
Verified Expert
List-plus-reason method. Name each control and add the reason in one line.
Latitude is the first control because it decides whether rays are vertical or slanting.
Altitude is the second control because higher places are farther from the heated surface and are cooler.
Maritime influence is the third control because water heats and cools slowly.
Air masses are mobile controls. Warm air masses raise temperature and cold air masses lower it.
Ocean currents work strongly along coasts. Warm currents make nearby coasts warmer, while cold currents cool them.
Local aspects add smaller differences, such as sunny slopes and shaded slopes.
Why this matters. This is a direct short answer. The safest form is a complete list with one clear explanation for each factor.
Latitude, altitude, sea distance, air masses, ocean currents and local aspect together control surface temperature distribution.
Q 8.4
In India, why is the day temperature maximum in May and why not after the summer solstice?
India records maximum day temperature in May because land is intensely heated before the monsoon. After the summer solstice, cloud cover and rain reduce daytime heating.
Concept used. Temperature does not depend on solar angle alone. Cloud cover, moisture and winds also control the heat felt near the surface.
Add monsoon
The key word is monsoon. The June solstice has strong sun, but the monsoon limits heating after it.
May is a pre-monsoon month in most parts of India.
The sun is nearly overhead over north India during this period.
Land heats quickly because it has lower specific heat than water.
Before the monsoon, skies are often clearer and dry winds allow strong heating.
After the summer solstice, the southwest monsoon advances over large parts of India.
Cloud cover, rainfall and higher humidity reduce direct insolation at the surface.
Therefore, maximum day temperature is usually reached in May, not after the solstice.
May is hottest because dry land heating is strongest before the monsoon. After the summer solstice, monsoon clouds and rain reduce insolation and daytime temperature.
NJ
Neha Joshi
M.A. Geography, Jawaharlal Nehru University
Verified Expert
Seasonal timing. Solar angle is high in June, but local weather decides the actual day temperature.
The summer solstice gives long days and high solar altitude in the northern hemisphere.
If India had only clear skies, heating could continue strongly after that date.
But India has a monsoon climate. The southwest monsoon begins around June.
Clouds reflect part of the incoming solar radiation and rain cools the land surface.
Moist air also reduces the sharp dry heating that occurs in May.
In May, these monsoon controls are weaker, so daytime heating becomes extreme.
This explains the time lag between maximum solar geometry and maximum observed day temperature.
Why this matters. Students often answer only with sun position. The NCERT logic needs both radiation and seasonal weather controls.
India is hottest in May because pre-monsoon clear-sky land heating is strongest before monsoon clouds and rain moderate temperatures.
Q 8.5
Why is the annual range of temperature high in the Siberian plains?
The Siberian plains have a high annual range because they are deep inside a large continent and far from the sea. Winters are very cold and summers can become warm.
Concept used. Annual range of temperature is the difference between the mean temperature of the warmest and coldest months.
One word clue
The key reason is continentality: land heats and cools quickly, and Siberia is far from oceanic moderation.
Siberia lies in the interior of the Eurasian continent.
It is far from the moderating influence of oceans.
Land loses heat rapidly during the long winter.
High latitude also gives very low insolation and long nights in winter.
During summer, the land surface can heat up more quickly.
The contrast between severe winter cold and summer warmth becomes large.
This creates a very high annual range of temperature.
The annual range is high in Siberia because of continentality, high latitude and weak sea influence, which produce very cold winters and comparatively warmer summers.
AS
Arjun Singh
M.Sc Geology, Banaras Hindu University
Verified Expert
Continentality view. The same surface that cools quickly in winter heats quickly in summer.
Oceans heat and cool slowly, so coastal areas usually have smaller temperature ranges.
Siberia is not coastal. It is located inside a huge landmass.
In winter, long nights and low solar angle reduce energy input sharply.
Snow cover and cold air masses intensify the winter chill.
In summer, the land warms more quickly than nearby seas would.
Because both extremes are strong, the warmest-minus-coldest monthly mean becomes very large.
Why this matters. Annual range questions are best answered through land-sea contrast. Once continentality is clear, Siberia becomes the classic example.
Siberia has a high annual range because the continental interior lacks sea moderation and faces strong seasonal heating contrast.
Q 8.6
How do the latitude and the tilt in the axis of rotation of the earth affect the amount of radiation received at the earth's surface?
Latitude changes the angle of the sun's rays, while axial tilt changes season and day length. Together they control how much radiation reaches each part of the earth.
Concept used. The earth is spherical and its axis is tilted at about 66.5∘ to the plane of its orbit. This makes insolation vary by latitude and season.
Separate the two controls
Write latitude first for angle of rays. Then write axial tilt for seasons and day length.
Latitude affects the angle at which the sun's rays strike the earth.
Near the equator and tropics, rays are more vertical, so the same energy is spread over a smaller area.
At higher latitudes, rays are slanting, so energy is spread over a larger area.
Slanting rays also pass through a greater thickness of the atmosphere.
This increases absorption, scattering and diffusion before the rays reach the surface.
The earth's axis is tilted, so the overhead sun shifts between 23.5∘ N and 23.5∘ S during the year.
This shift creates seasons and changes the length of day and night.
Longer days allow more hours of heating, while shorter days reduce heating time.
Therefore, latitude controls the basic north-south pattern of radiation, and axial tilt controls seasonal changes in radiation.
Latitude controls the angle and path of solar rays. Axial tilt shifts the overhead sun and changes day length, producing seasonal differences in radiation received at the surface.
FK
Farah Khan
M.A. Geography, Jamia Millia Islamia
Verified Expert
Geometry-first answer. Insolation depends on both ray angle and heating time.
Imagine the same beam of sunlight falling on two surfaces.
When the beam is vertical, it covers a smaller area and gives stronger heating per unit area.
When the beam is slanting, it spreads over a wider area and becomes weaker per unit area.
Latitude decides this angle in a broad way, so low latitudes usually receive more radiation than high latitudes.
The tilted axis adds a seasonal control. One hemisphere leans towards the sun while the other leans away.
The leaning hemisphere gets longer days and a higher midday sun.
The opposite hemisphere gets shorter days and a lower midday sun.
This is why radiation varies during a day, across seasons and from equator to poles.
Why this matters. This question is not only about distance from the sun. It is mainly about geometry: angle, atmospheric path and length of daylight.
Latitude changes the ray angle; axial tilt changes seasons and daylight duration. Together they control surface radiation.
Q 8.7
Discuss the processes through which the earth-atmosphere system maintains heat balance.
The earth-atmosphere system maintains heat balance because incoming solar energy is matched by energy returned to space through reflection and terrestrial radiation.
Concept used. Heat balance means the earth as a whole neither keeps gaining heat nor keeps losing heat over a long period. The incoming and outgoing energy totals balance.
Use the 100-unit model
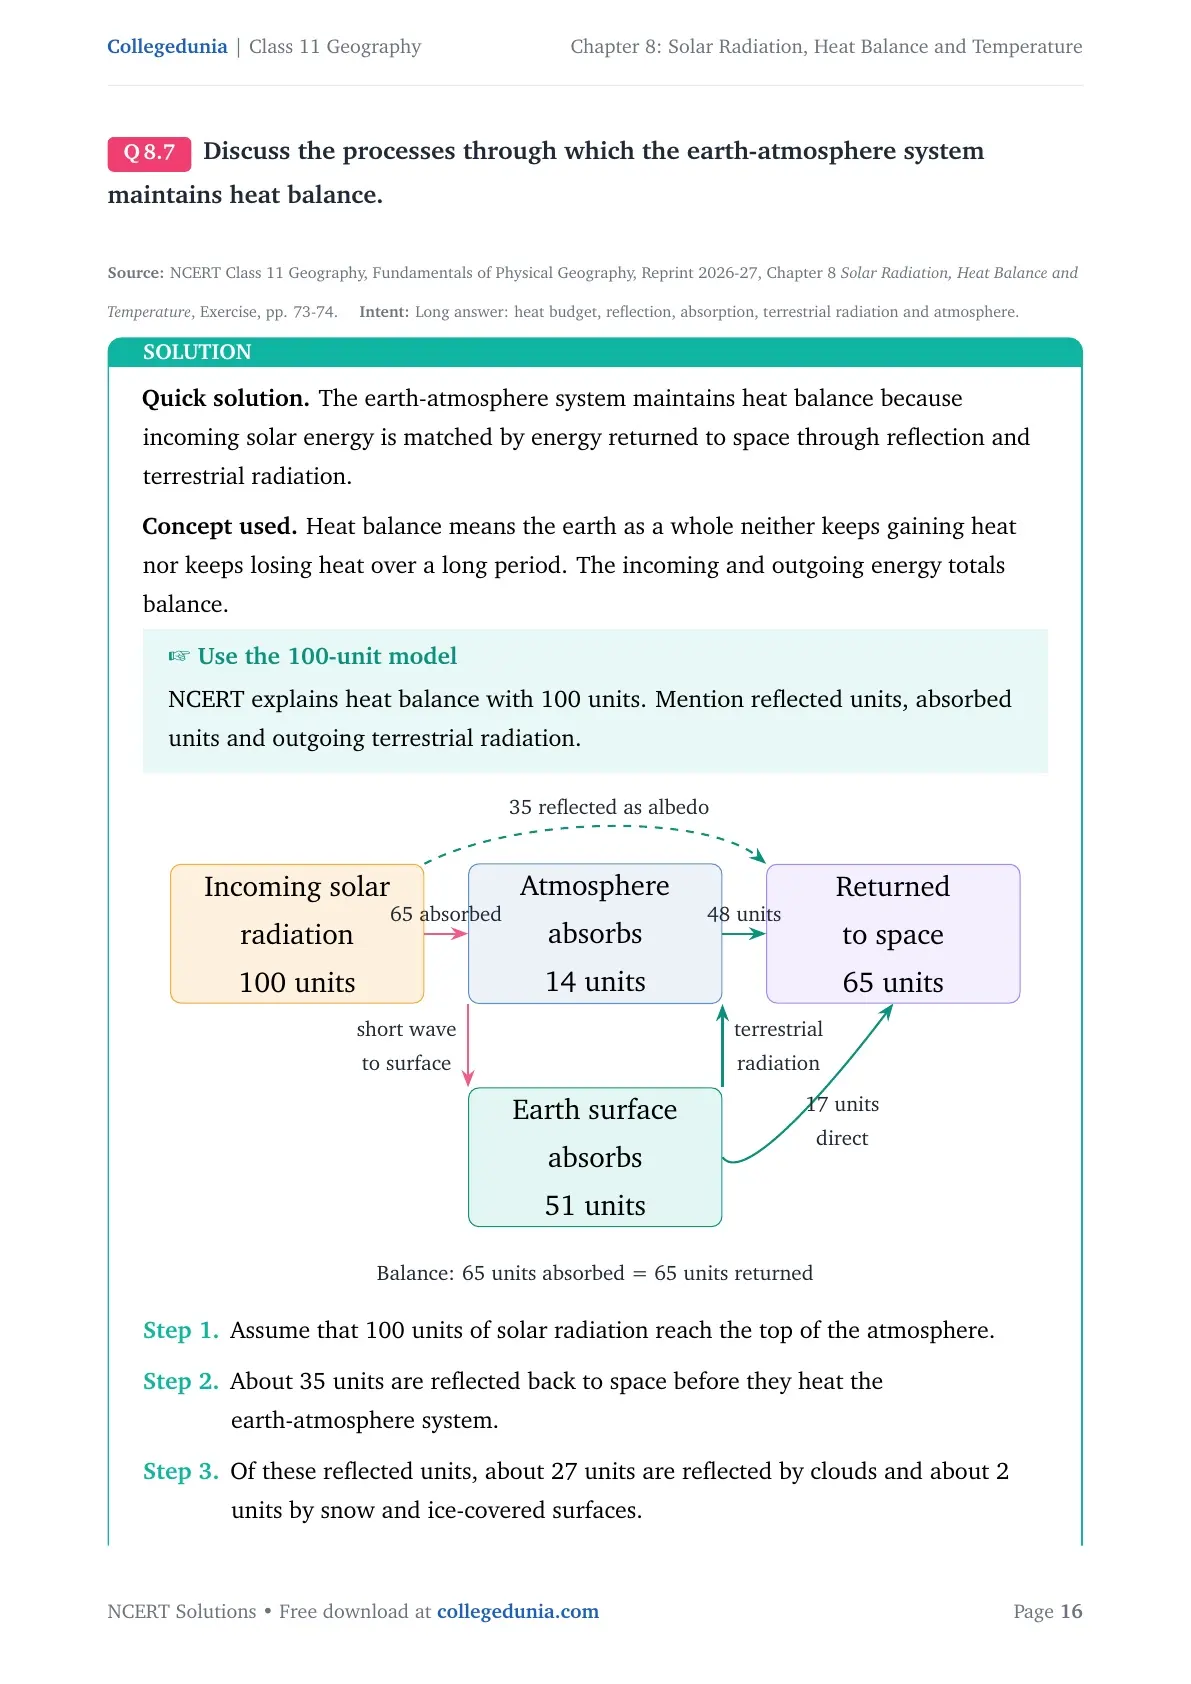
NCERT explains heat balance with 100 units. Mention reflected units, absorbed units and outgoing terrestrial radiation.
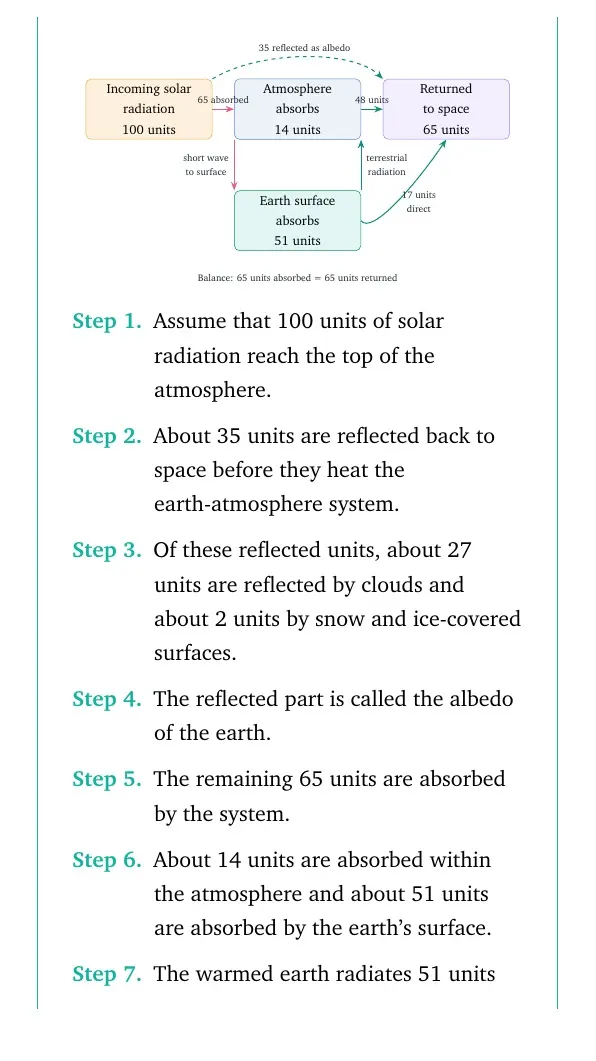
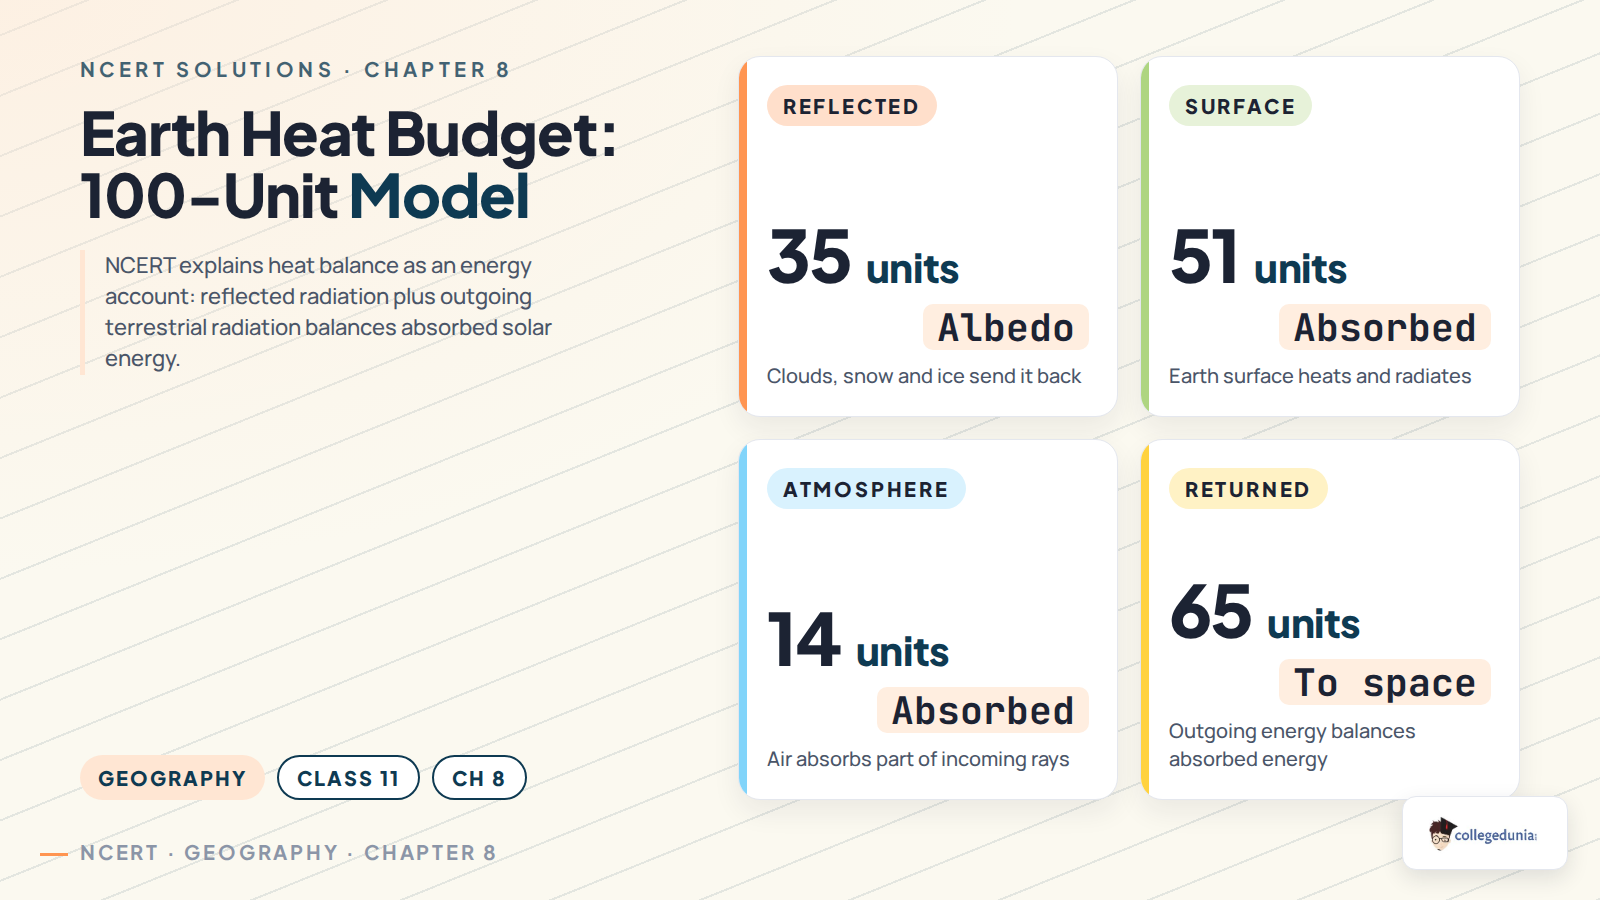
See the heat-budget diagram in the downloadable PDF version.
Assume that 100 units of solar radiation reach the top of the atmosphere.
About 35 units are reflected back to space before they heat the earth-atmosphere system.
Of these reflected units, about 27 units are reflected by clouds and about 2 units by snow and ice-covered surfaces.
The reflected part is called the albedo of the earth.
The remaining 65 units are absorbed by the system.
About 14 units are absorbed within the atmosphere and about 51 units are absorbed by the earth's surface.
The warmed earth radiates 51 units back as long wave terrestrial radiation.
Of this, about 17 units go directly to space and about 34 units are absorbed by the atmosphere.
The atmosphere finally radiates its absorbed heat back to space.
Thus, 65 units return to space, balancing the 65 units absorbed from the sun.
Heat balance is maintained because 65 absorbed units are returned to space as 17 units directly from the earth and 48 units from the atmosphere. Separately, 35 reflected units plus 65 outgoing units balance the 100 incoming units.
MN
Meera Nair
Ph.D Geography, IISc Bangalore
Verified Expert
Budget method. Treat the system like an energy account with incoming and outgoing entries.
Start with incoming short wave solar radiation at the top of the atmosphere. In the NCERT model, this full incoming amount is taken as 100 units.
Before this energy heats the surface, some of it is sent back to space. Clouds reflect the largest share, and snow and ice reflect a smaller share.
This reflected share is called albedo. It is important because reflected energy does not become heat within the earth-atmosphere system.
After reflection, the remaining 65 units are absorbed. The atmosphere absorbs 14 units and the earth's surface absorbs 51 units.
The surface then becomes a radiator. It gives off the absorbed 51 units as long wave terrestrial radiation.
A part of this terrestrial radiation escapes directly to space. The rest is absorbed by water vapour, carbon dioxide and other greenhouse gases.
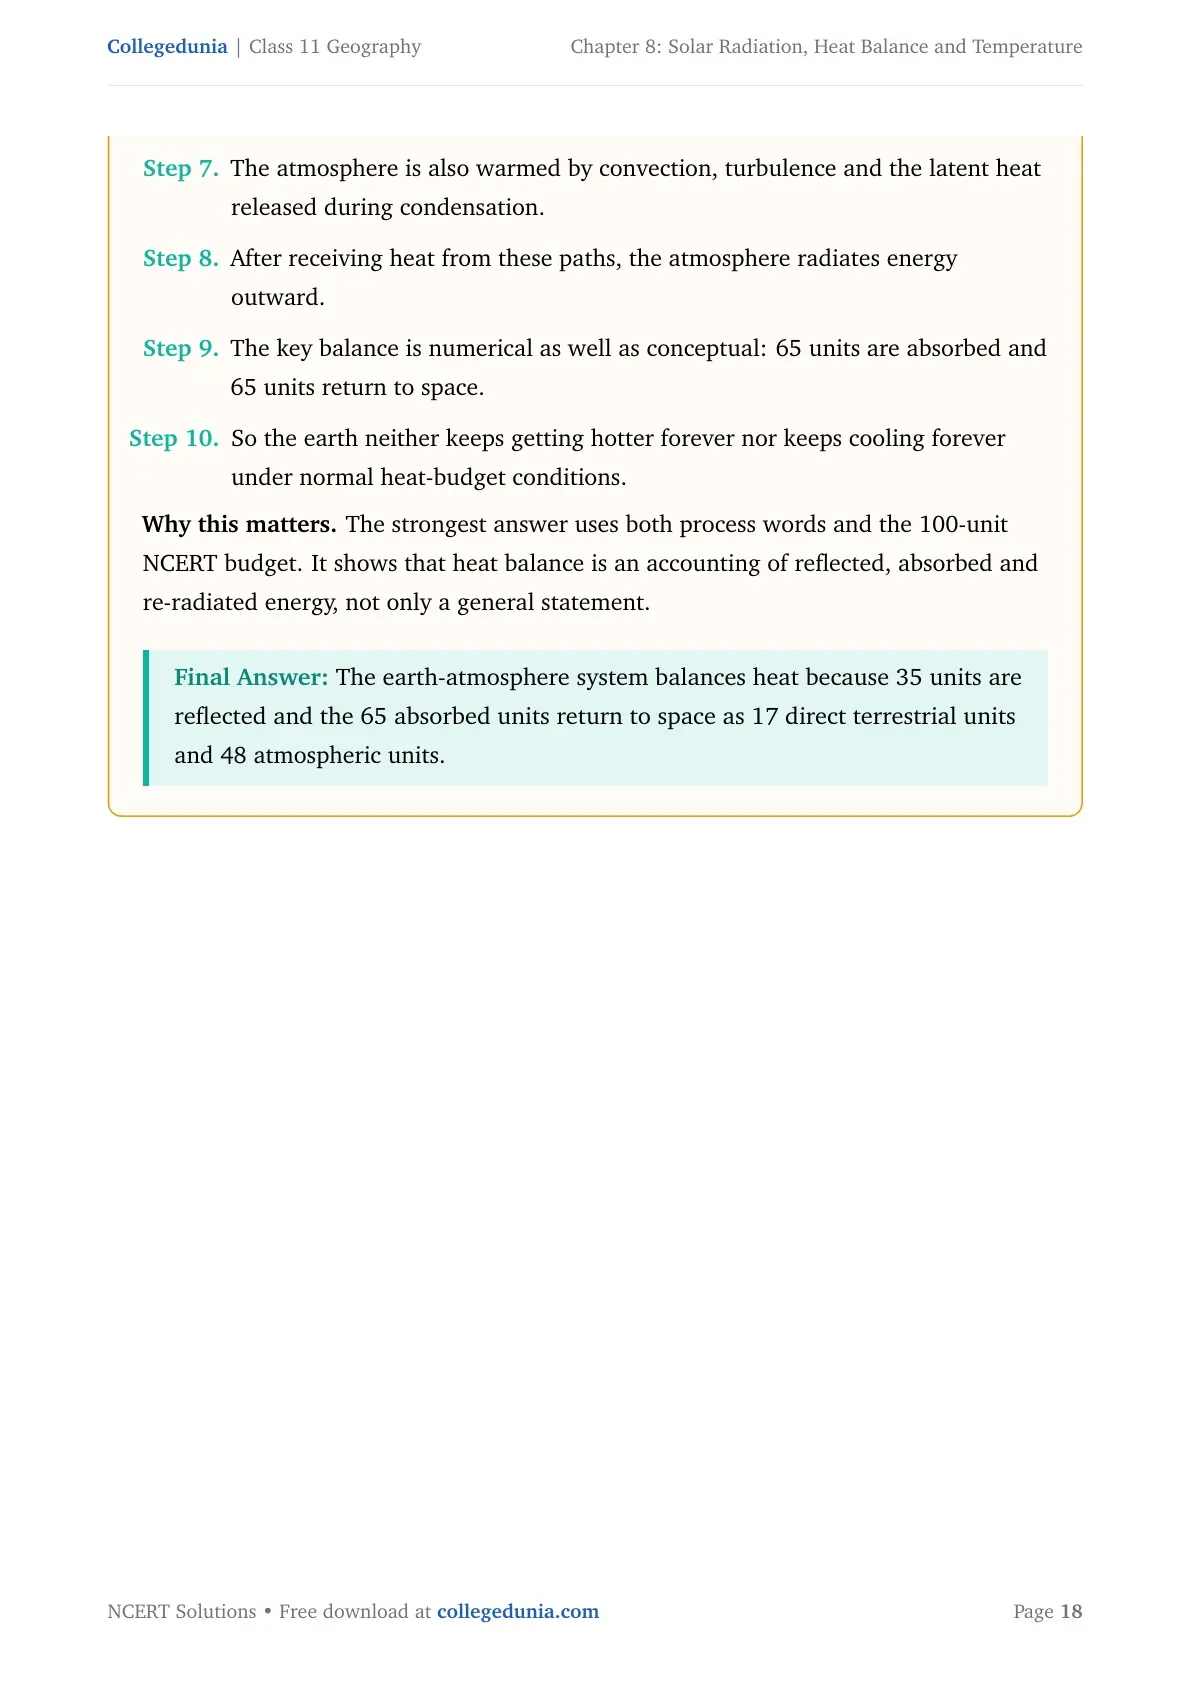
The atmosphere is also warmed by convection, turbulence and the latent heat released during condensation.
After receiving heat from these paths, the atmosphere radiates energy outward.
The key balance is numerical as well as conceptual: 65 units are absorbed and 65 units return to space.
So the earth neither keeps getting hotter forever nor keeps cooling forever under normal heat-budget conditions.
Why this matters. The strongest answer uses both process words and the 100-unit NCERT budget. It shows that heat balance is an accounting of reflected, absorbed and re-radiated energy, not only a general statement.
The earth-atmosphere system balances heat because 35 units are reflected and the 65 absorbed units return to space as 17 direct terrestrial units and 48 atmospheric units.
Q 8.8
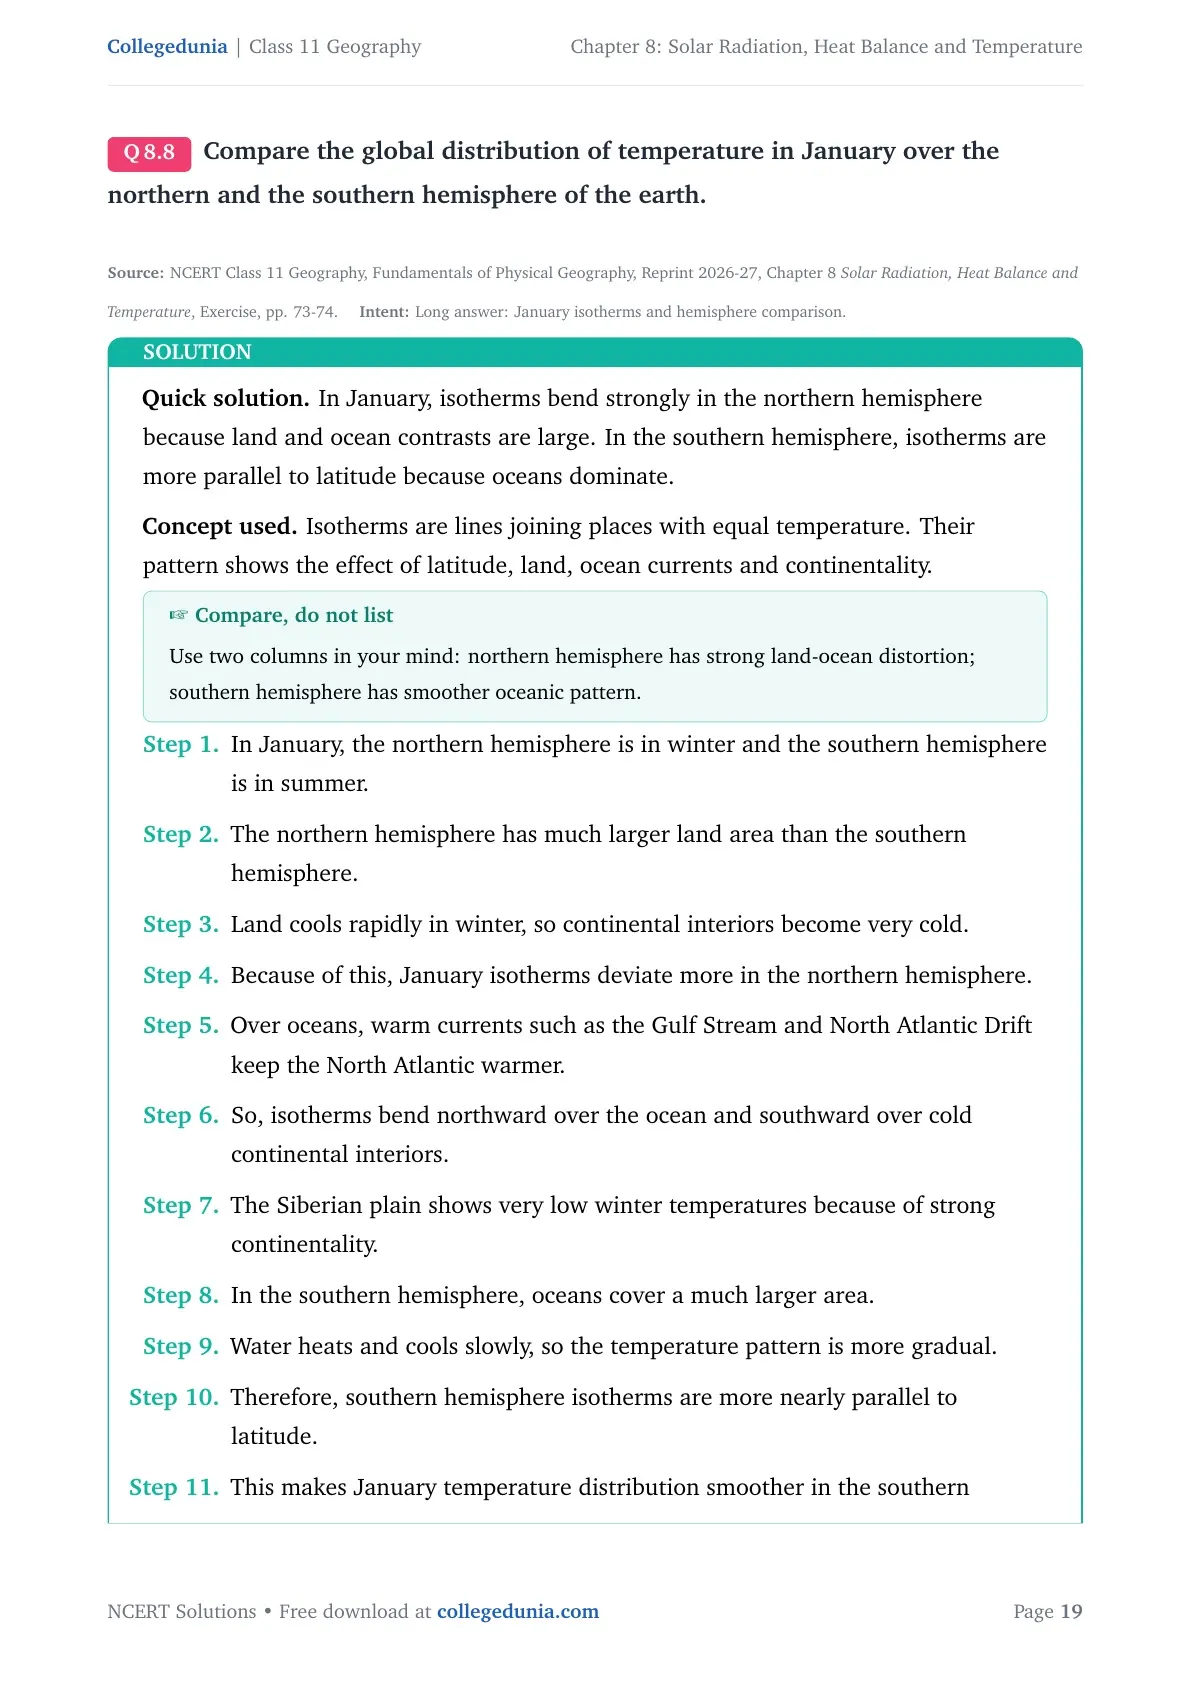
Compare the global distribution of temperature in January over the northern and the southern hemisphere of the earth.
In January, isotherms bend strongly in the northern hemisphere because land and ocean contrasts are large. In the southern hemisphere, isotherms are more parallel to latitude because oceans dominate.
Concept used. Isotherms are lines joining places with equal temperature. Their pattern shows the effect of latitude, land, ocean currents and continentality.
Compare, do not list
Use two columns in your mind: northern hemisphere has strong land-ocean distortion; southern hemisphere has smoother oceanic pattern.
In January, the northern hemisphere is in winter and the southern hemisphere is in summer.
The northern hemisphere has much larger land area than the southern hemisphere.
Land cools rapidly in winter, so continental interiors become very cold.
Because of this, January isotherms deviate more in the northern hemisphere.
Over oceans, warm currents such as the Gulf Stream and North Atlantic Drift keep the North Atlantic warmer.
So, isotherms bend northward over the ocean and southward over cold continental interiors.
The Siberian plain shows very low winter temperatures because of strong continentality.
In the southern hemisphere, oceans cover a much larger area.
Water heats and cools slowly, so the temperature pattern is more gradual.
Therefore, southern hemisphere isotherms are more nearly parallel to latitude.
This makes January temperature distribution smoother in the southern hemisphere than in the northern hemisphere.
January temperature distribution is irregular in the northern hemisphere because of large landmasses, cold interiors and warm currents. It is smoother in the southern hemisphere because oceans dominate.
SK
Sanya Kapoor
M.Sc Geography, University of Calcutta
Verified Expert
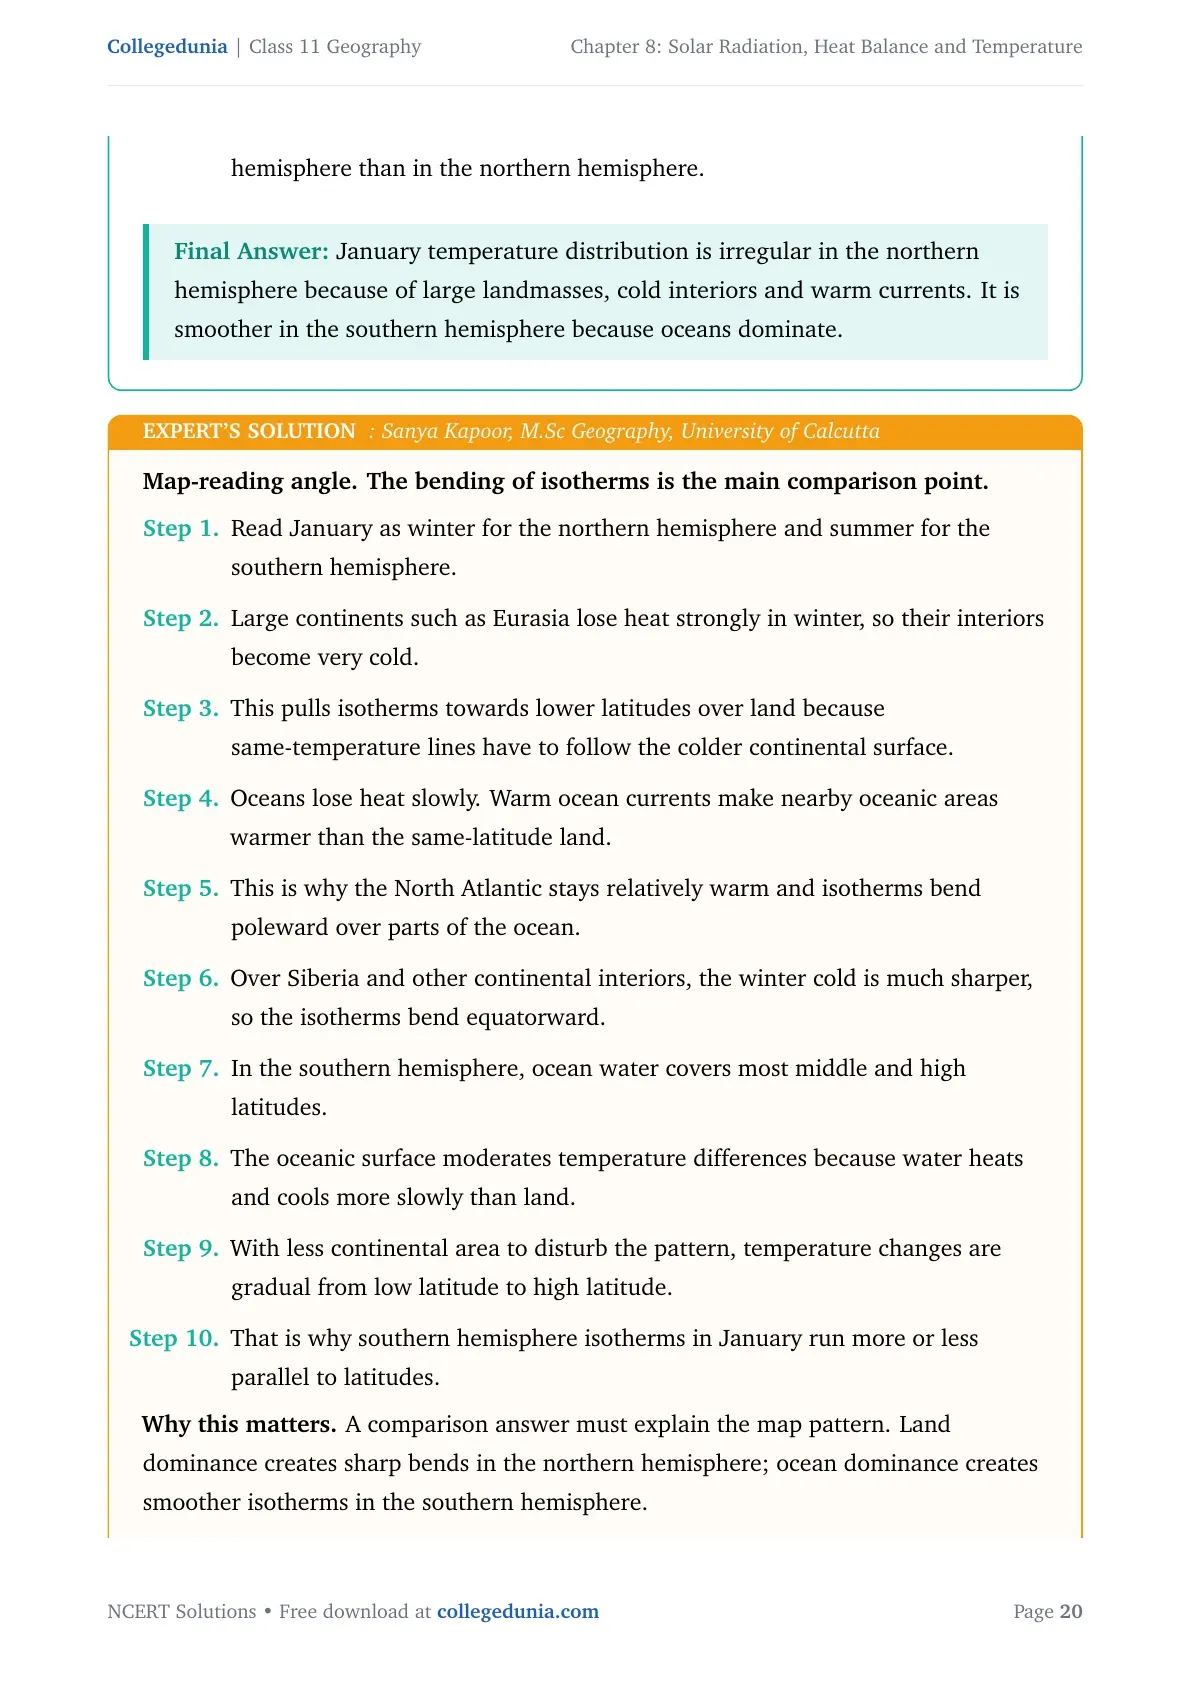
Map-reading angle. The bending of isotherms is the main comparison point.
Read January as winter for the northern hemisphere and summer for the southern hemisphere.
Large continents such as Eurasia lose heat strongly in winter, so their interiors become very cold.
This pulls isotherms towards lower latitudes over land because same-temperature lines have to follow the colder continental surface.
Oceans lose heat slowly. Warm ocean currents make nearby oceanic areas warmer than the same-latitude land.
This is why the North Atlantic stays relatively warm and isotherms bend poleward over parts of the ocean.
Over Siberia and other continental interiors, the winter cold is much sharper, so the isotherms bend equatorward.
In the southern hemisphere, ocean water covers most middle and high latitudes.
The oceanic surface moderates temperature differences because water heats and cools more slowly than land.
With less continental area to disturb the pattern, temperature changes are gradual from low latitude to high latitude.
That is why southern hemisphere isotherms in January run more or less parallel to latitudes.
Why this matters. A comparison answer must explain the map pattern. Land dominance creates sharp bends in the northern hemisphere; ocean dominance creates smoother isotherms in the southern hemisphere.
Northern January isotherms are highly distorted by continents and currents, while southern isotherms are smoother and more latitudinal due to ocean dominance.
Q 8.9
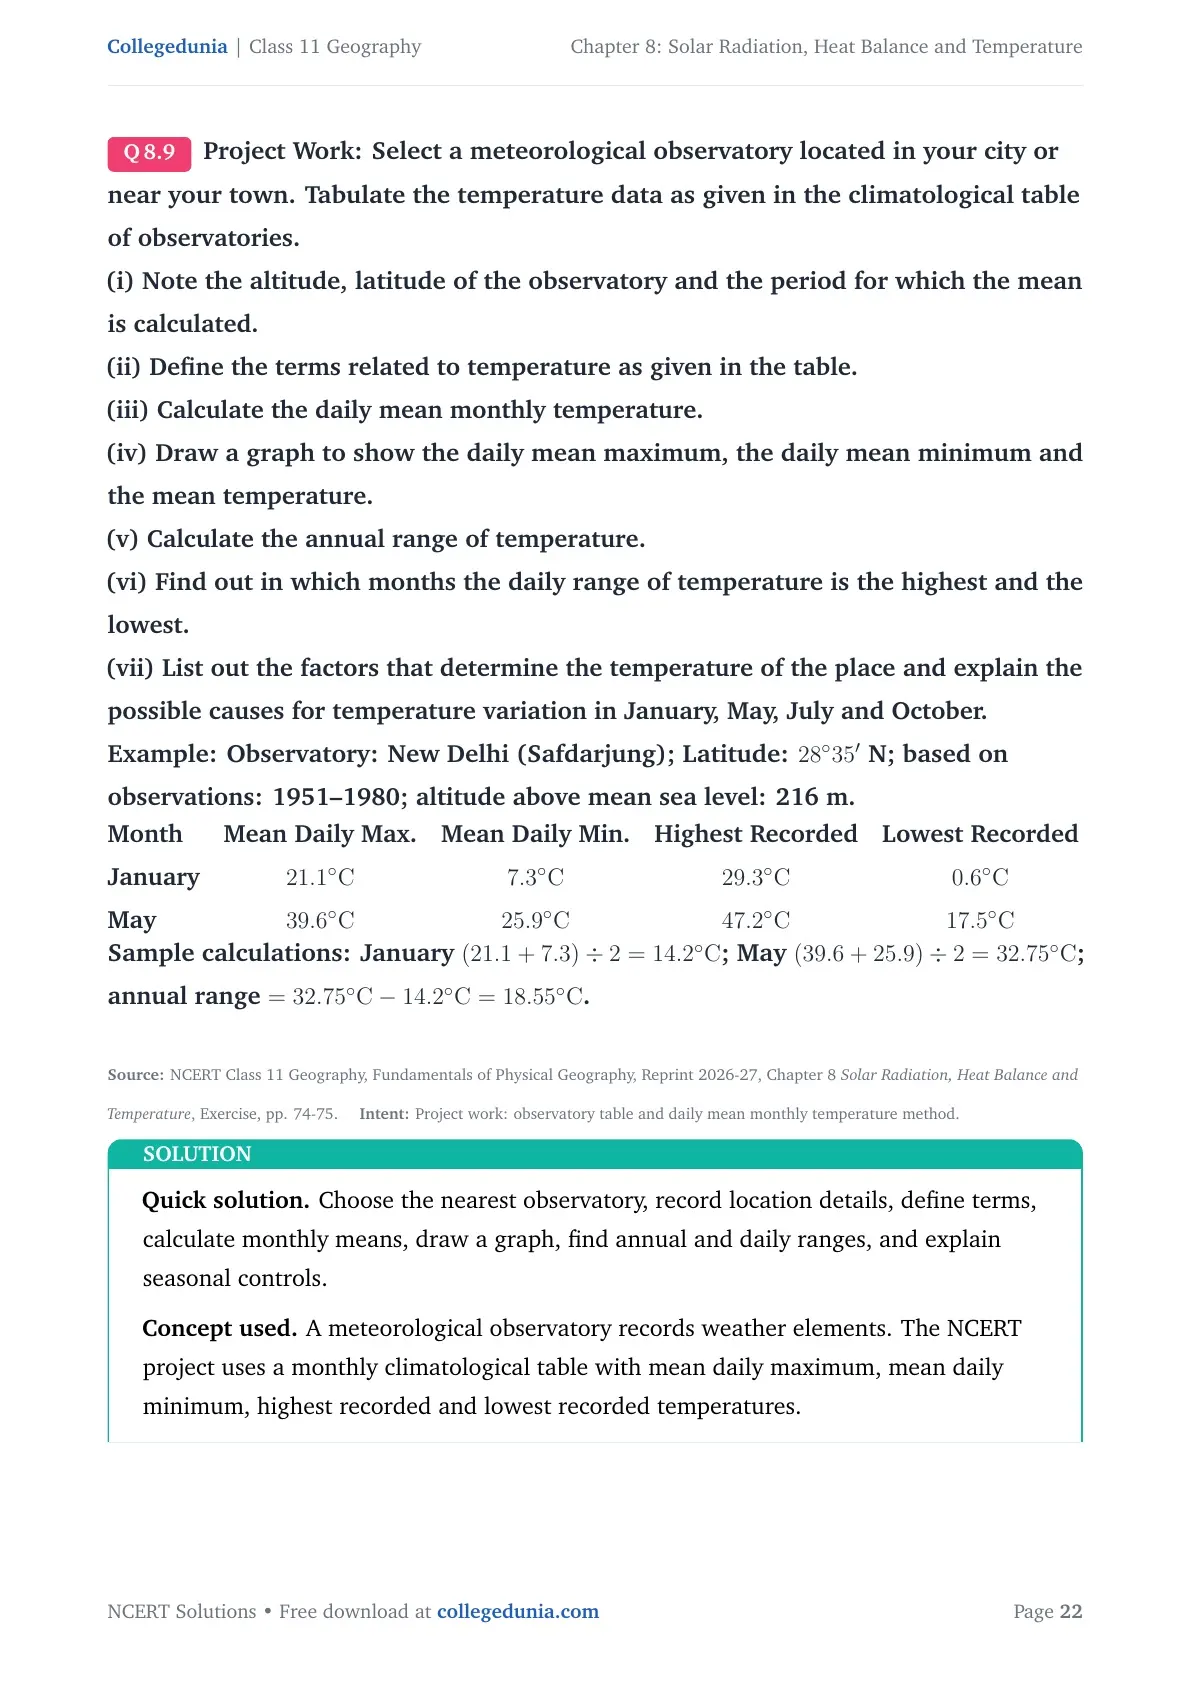
Project Work: Select a meteorological observatory located in your city or near your town. Tabulate the temperature data as given in the climatological table of observatories.
(i) Note the altitude, latitude of the observatory and the period for which the mean is calculated.
(ii) Define the terms related to temperature as given in the table.
(iii) Calculate the daily mean monthly temperature.
(iv) Draw a graph to show the daily mean maximum, the daily mean minimum and the mean temperature.
(v) Calculate the annual range of temperature.
(vi) Find out in which months the daily range of temperature is the highest and the lowest.
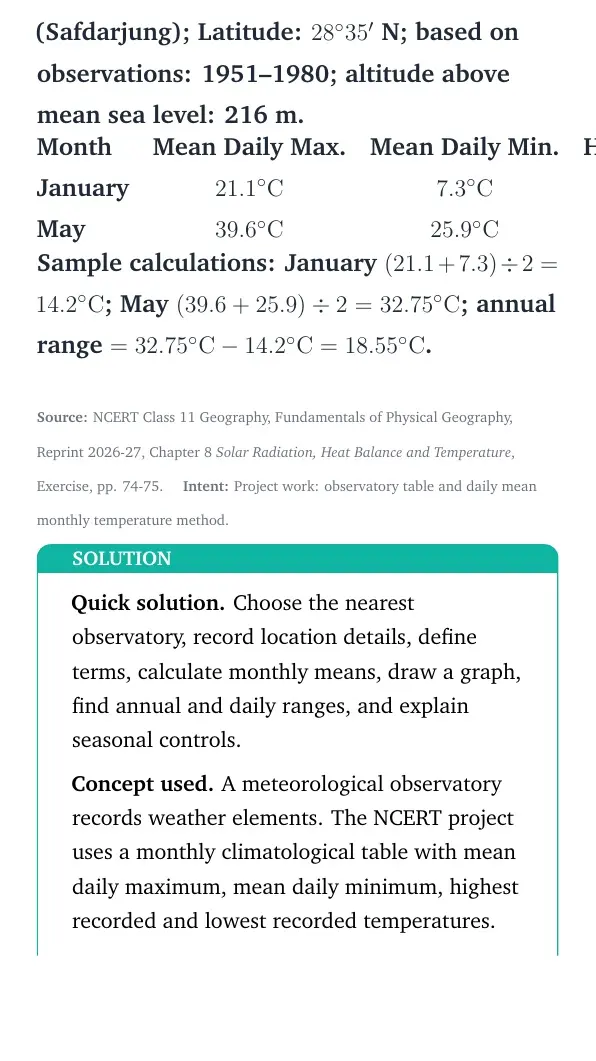
(vii) List out the factors that determine the temperature of the place and explain the possible causes for temperature variation in January, May, July and October. Example: Observatory: New Delhi (Safdarjung); Latitude: 28∘35' N; based on observations: 1951–1980; altitude above mean sea level: 216 m.
tabular@lcccc@
Month & Mean Daily Max. & Mean Daily Min. & Highest Recorded & Lowest Recorded
January & 21.1∘C & 7.3∘C & 29.3∘C & 0.6∘C
May & 39.6∘C & 25.9∘C & 47.2∘C & 17.5∘C
tabular
Sample calculations: January (21.1 + 7.3) ÷ 2 = 14.2∘C; May (39.6 + 25.9) ÷ 2 = 32.75∘C; annual range = 32.75∘C - 14.2∘C = 18.55∘C.
Choose the nearest observatory, record location details, define terms, calculate monthly means, draw a graph, find annual and daily ranges, and explain seasonal controls.
Concept used. A meteorological observatory records weather elements. The NCERT project uses a monthly climatological table with mean daily maximum, mean daily minimum, highest recorded and lowest recorded temperatures.
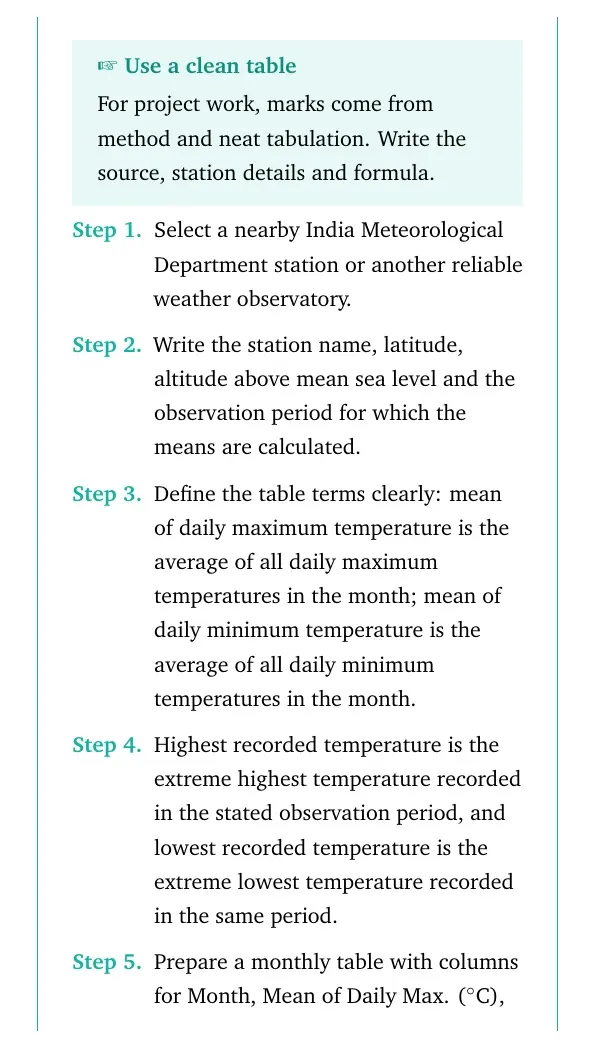
Use a clean table
For project work, marks come from method and neat tabulation. Write the source, station details and formula.
Select a nearby India Meteorological Department station or another reliable weather observatory.
Write the station name, latitude, altitude above mean sea level and the observation period for which the means are calculated.
Define the table terms clearly: mean of daily maximum temperature is the average of all daily maximum temperatures in the month; mean of daily minimum temperature is the average of all daily minimum temperatures in the month.
Highest recorded temperature is the extreme highest temperature recorded in the stated observation period, and lowest recorded temperature is the extreme lowest temperature recorded in the same period.
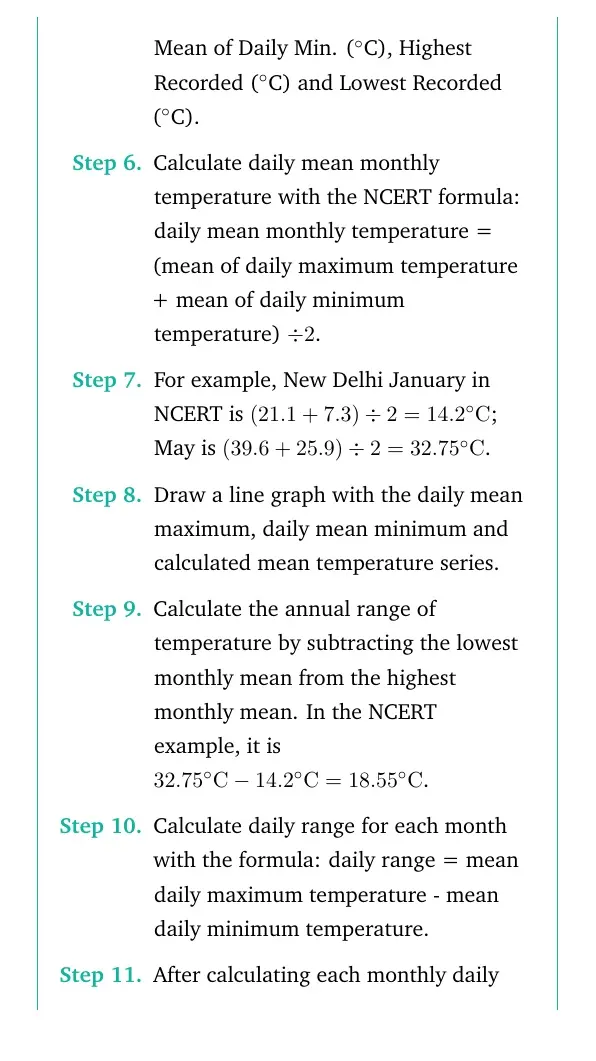
Prepare a monthly table with columns for Month, Mean of Daily Max. (∘C), Mean of Daily Min. (∘C), Highest Recorded (∘C) and Lowest Recorded (∘C).
Calculate daily mean monthly temperature with the NCERT formula: daily mean monthly temperature = (mean of daily maximum temperature + mean of daily minimum temperature) ÷ 2.
For example, New Delhi January in NCERT is (21.1 + 7.3) ÷ 2 = 14.2∘C; May is (39.6 + 25.9) ÷ 2 = 32.75∘C.
Draw a line graph with the daily mean maximum, daily mean minimum and calculated mean temperature series.
Calculate the annual range of temperature by subtracting the lowest monthly mean from the highest monthly mean. In the NCERT example, it is 32.75∘C - 14.2∘C = 18.55∘C.
Calculate daily range for each month with the formula: daily range = mean daily maximum temperature - mean daily minimum temperature.
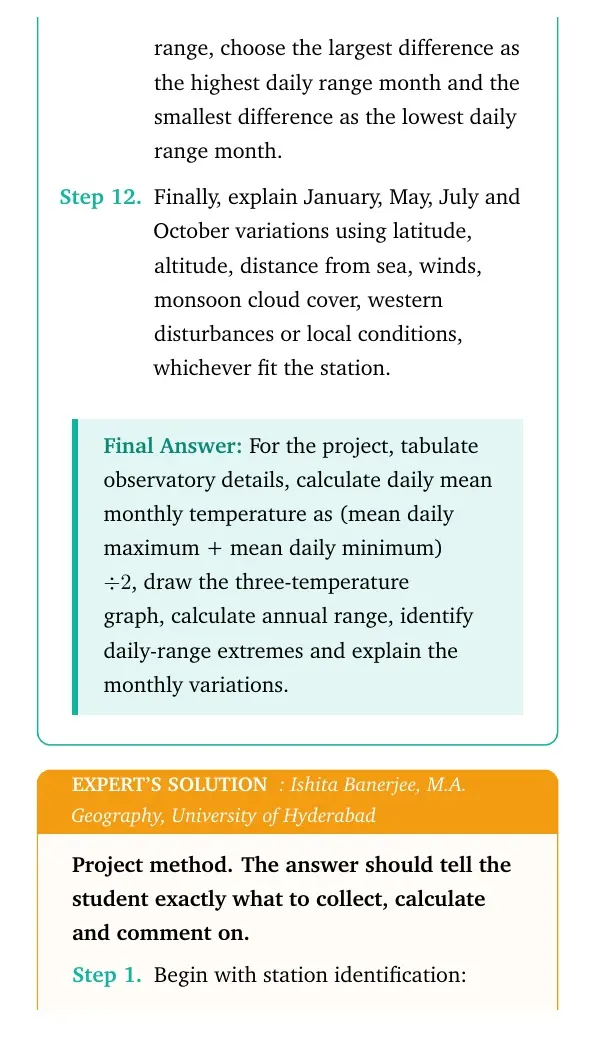
After calculating each monthly daily range, choose the largest difference as the highest daily range month and the smallest difference as the lowest daily range month.
Finally, explain January, May, July and October variations using latitude, altitude, distance from sea, winds, monsoon cloud cover, western disturbances or local conditions, whichever fit the station.
For the project, tabulate observatory details, calculate daily mean monthly temperature as (mean daily maximum + mean daily minimum) ÷ 2, draw the three-temperature graph, calculate annual range, identify daily-range extremes and explain the monthly variations.
IB
Ishita Banerjee
M.A. Geography, University of Hyderabad
Verified Expert
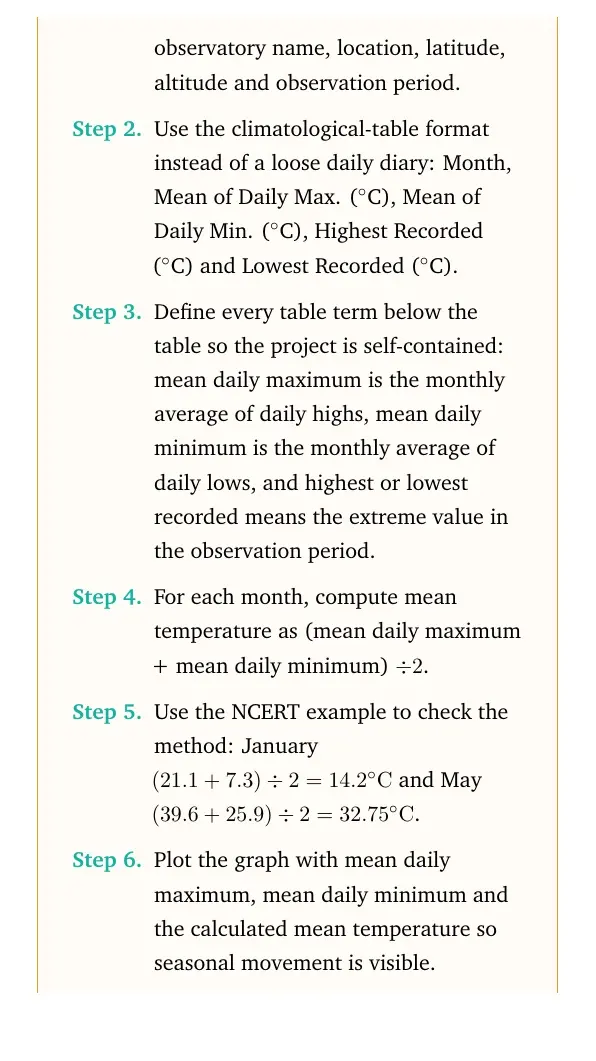
Project method. The answer should tell the student exactly what to collect, calculate and comment on.
Begin with station identification: observatory name, location, latitude, altitude and observation period.
Use the climatological-table format instead of a loose daily diary: Month, Mean of Daily Max. (∘C), Mean of Daily Min. (∘C), Highest Recorded (∘C) and Lowest Recorded (∘C).
Define every table term below the table so the project is self-contained: mean daily maximum is the monthly average of daily highs, mean daily minimum is the monthly average of daily lows, and highest or lowest recorded means the extreme value in the observation period.
For each month, compute mean temperature as (mean daily maximum + mean daily minimum) ÷ 2.
Use the NCERT example to check the method: January (21.1 + 7.3) ÷ 2 = 14.2∘C and May (39.6 + 25.9) ÷ 2 = 32.75∘C.
Plot the graph with mean daily maximum, mean daily minimum and the calculated mean temperature so seasonal movement is visible.
Calculate annual range from the highest monthly mean minus the lowest monthly mean.
Find the highest and lowest daily range months using mean daily maximum minus mean daily minimum for each month.
Explain the four named months: January may show winter and continental cooling, May pre-monsoon heating, July monsoon cloud and rain, and October post-monsoon transition.
Why this matters. The project is an application task. It checks whether a student can read the NCERT climatological table format, compute monthly means, graph the series and explain temperature controls.
Use a nearby observatory, record location details, define the climatological table columns, compute monthly means with the NCERT formula, graph the three series, calculate annual and daily ranges, and explain the seasonal causes.
Related Geography Resources for Solar Radiation, Heat Balance and Temperature
Use the solutions PDF for solved answers, then move to the NCERT book and notes when you want to revise the chapter theory in a different format.












Comments