


The NMAT 2023 DI Aptitude Question Paper, along with its detailed solutions, is now available for download in PDF format. This valuable resource is aimed at helping candidates who are preparing for the NMAT (National Management Admission Test), which is a key entrance exam for admission to various MBA programs in India and abroad. The Quantitative Aptitude section of the NMAT tests candidates' ability to solve numerical problems efficiently, focusing on various mathematical concepts such as arithmetic, algebra, geometry, and data interpretation.
NMAT 2023 Question Paper with Solution PDFs
| NMAT 2023 DI Question Paper with Solution PDF | Check Solution |
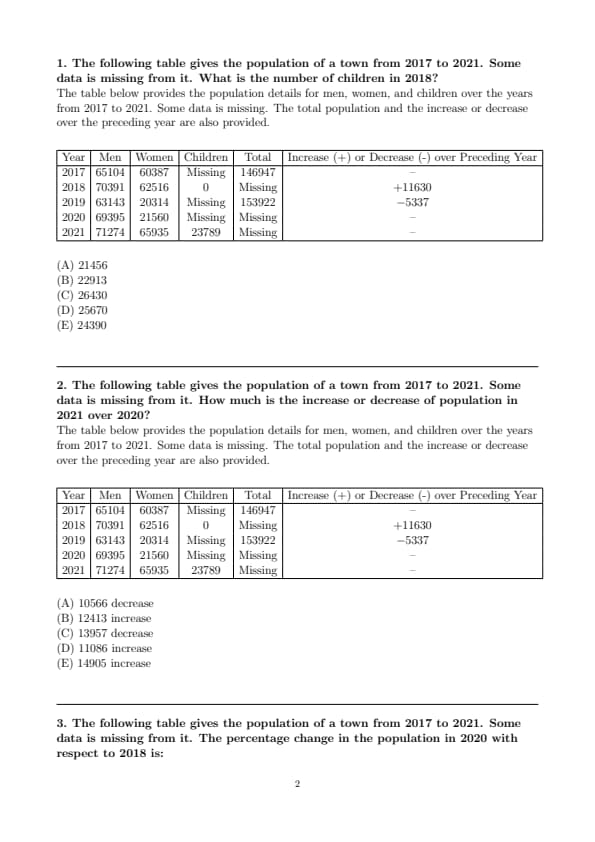
The following table gives the population of a town from 2017 to 2021. Some data is missing from it. What is the number of children in 2018?
The table below provides the population details for men, women, and children over the years from 2017 to 2021. Some data is missing. The total population and the increase or decrease over the preceding year are also provided.

The following table gives the population of a town from 2017 to 2021. Some data is missing from it. How much is the increase or decrease of population in 2021 over 2020?
The table below provides the population details for men, women, and children over the years from 2017 to 2021. Some data is missing. The total population and the increase or decrease over the preceding year are also provided.
The following table gives the population of a town from 2017 to 2021. Some data is missing from it. The percentage change in the population in 2020 with respect to 2018 is:
The table below provides the population details for men, women, and children over the years from 2017 to 2021. Some data is missing. The total population and the increase or decrease over the preceding year are also provided.
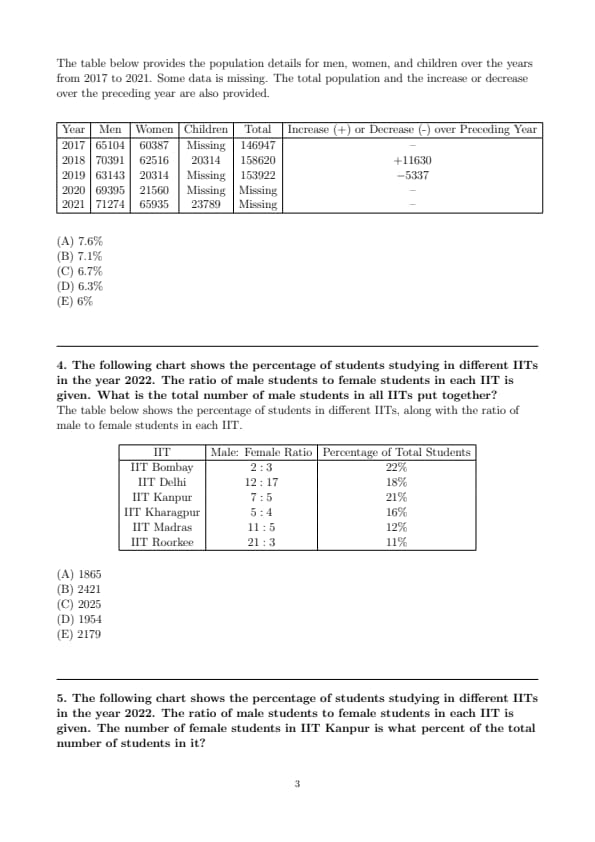
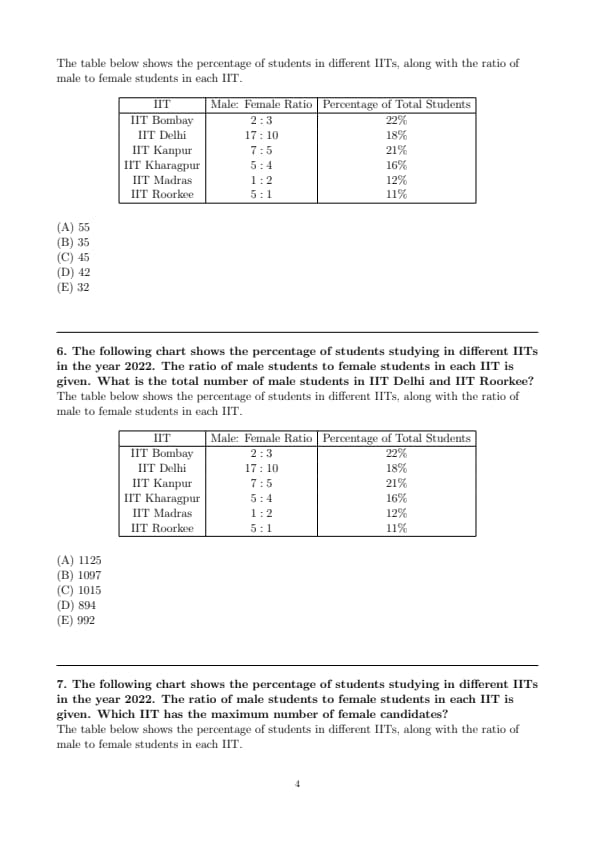
The following chart shows the percentage of students studying in different IITs in the year 2022. The ratio of male students to female students in each IIT is given. What is the total number of male students in all IITs put together?
The table below shows the percentage of students in different IITs, along with the ratio of male to female students in each IIT.

The following chart shows the percentage of students studying in different IITs in the year 2022. The ratio of male students to female students in each IIT is given. The number of female students in IIT Kanpur is what percent of the total number of students in it?
The table below shows the percentage of students in different IITs, along with the ratio of male to female students in each IIT.
The following chart shows the percentage of students studying in different IITs in the year 2022. The ratio of male students to female students in each IIT is given. What is the total number of male students in IIT Delhi and IIT Roorkee?
The table below shows the percentage of students in different IITs, along with the ratio of male to female students in each IIT.
The following chart shows the percentage of students studying in different IITs in the year 2022. The ratio of male students to female students in each IIT is given. Which IIT has the maximum number of female candidates?
The table below shows the percentage of students in different IITs, along with the ratio of male to female students in each IIT.
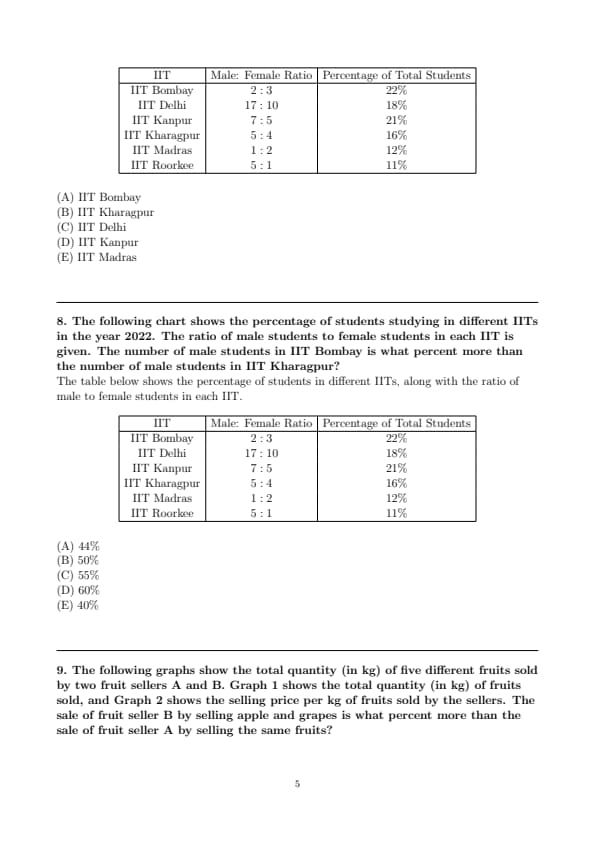
The following chart shows the percentage of students studying in different IITs in the year 2022. The ratio of male students to female students in each IIT is given. The number of male students in IIT Bombay is what percent more than the number of male students in IIT Kharagpur?
The table below shows the percentage of students in different IITs, along with the ratio of male to female students in each IIT.
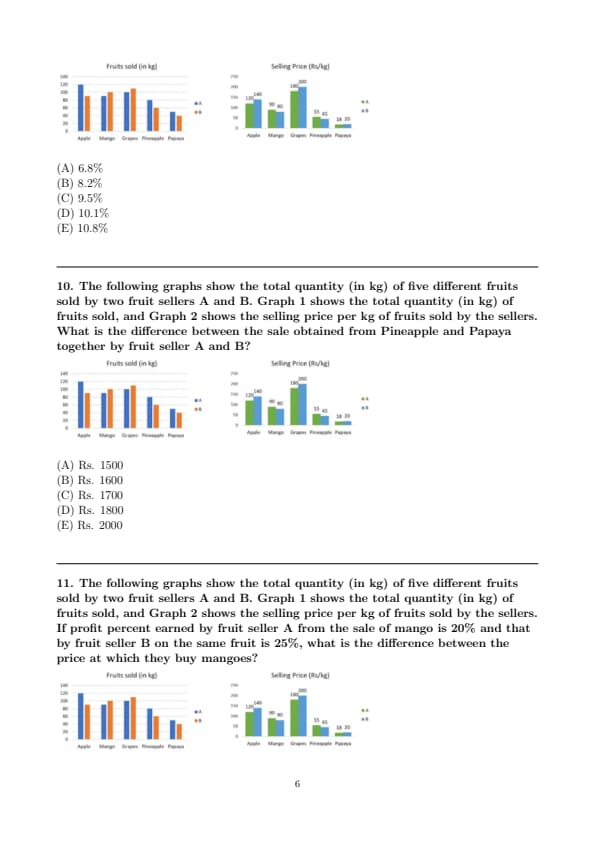
The following graphs show the total quantity (in kg) of five different fruits sold by two fruit sellers A and B. Graph 1 shows the total quantity (in kg) of fruits sold, and Graph 2 shows the selling price per kg of fruits sold by the sellers. The sale of fruit seller B by selling apple and grapes is what percent more than the sale of fruit seller A by selling the same fruits?

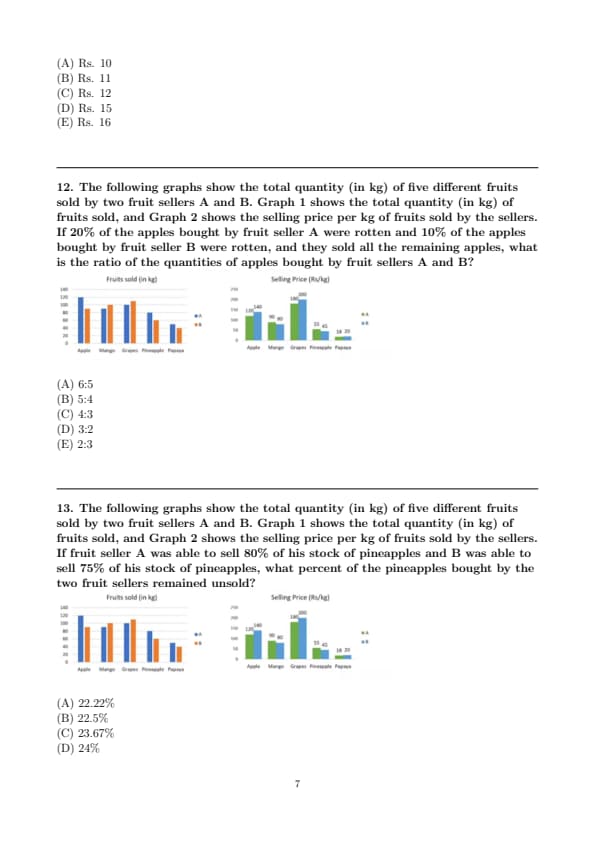
The following graphs show the total quantity (in kg) of five different fruits sold by two fruit sellers A and B. Graph 1 shows the total quantity (in kg) of fruits sold, and Graph 2 shows the selling price per kg of fruits sold by the sellers. What is the difference between the sale obtained from Pineapple and Papaya together by fruit seller A and B?
The following graphs show the total quantity (in kg) of five different fruits sold by two fruit sellers A and B. Graph 1 shows the total quantity (in kg) of fruits sold, and Graph 2 shows the selling price per kg of fruits sold by the sellers. If profit percent earned by fruit seller A from the sale of mango is 20% and that by fruit seller B on the same fruit is 25%, what is the difference between the price at which they buy mangoes?
The following graphs show the total quantity (in kg) of five different fruits sold by two fruit sellers A and B. Graph 1 shows the total quantity (in kg) of fruits sold, and Graph 2 shows the selling price per kg of fruits sold by the sellers. If 20% of the apples bought by fruit seller A were rotten and 10% of the apples bought by fruit seller B were rotten, and they sold all the remaining apples, what is the ratio of the quantities of apples bought by fruit sellers A and B?
The following graphs show the total quantity (in kg) of five different fruits sold by two fruit sellers A and B. Graph 1 shows the total quantity (in kg) of fruits sold, and Graph 2 shows the selling price per kg of fruits sold by the sellers. If fruit seller A was able to sell 80% of his stock of pineapples and B was able to sell 75% of his stock of pineapples, what percent of the pineapples bought by the two fruit sellers remained unsold?
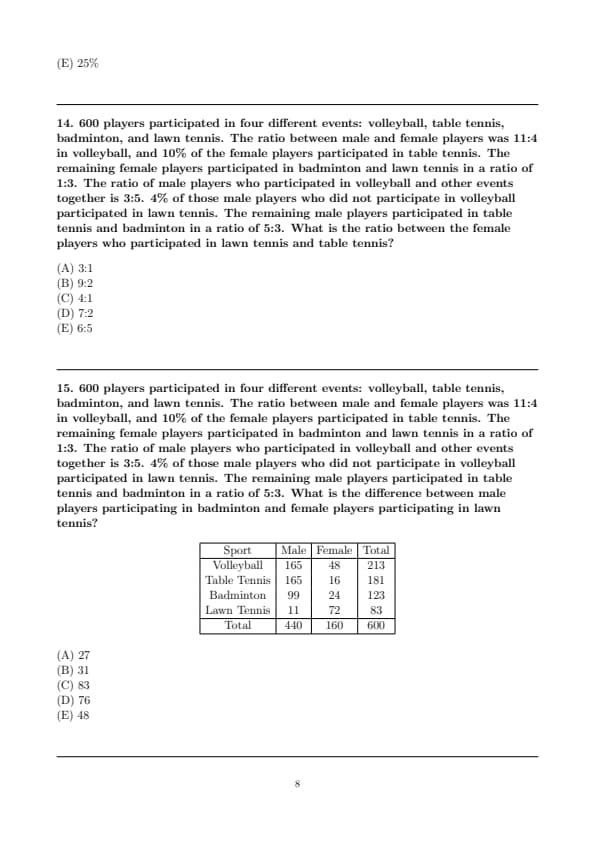
600 players participated in four different events: volleyball, table tennis, badminton, and lawn tennis. The ratio between male and female players was 11:4 in volleyball, and 10% of the female players participated in table tennis. The remaining female players participated in badminton and lawn tennis in a ratio of 1:3. The ratio of male players who participated in volleyball and other events together is 3:5. 4% of those male players who did not participate in volleyball participated in lawn tennis. The remaining male players participated in table tennis and badminton in a ratio of 5:3. What is the ratio between the female players who participated in lawn tennis and table tennis?
600 players participated in four different events: volleyball, table tennis, badminton, and lawn tennis. The ratio between male and female players was 11:4 in volleyball, and 10% of the female players participated in table tennis. The remaining female players participated in badminton and lawn tennis in a ratio of 1:3. The ratio of male players who participated in volleyball and other events together is 3:5. 4% of those male players who did not participate in volleyball participated in lawn tennis. The remaining male players participated in table tennis and badminton in a ratio of 5:3. What is the difference between male players participating in badminton and female players participating in lawn tennis?

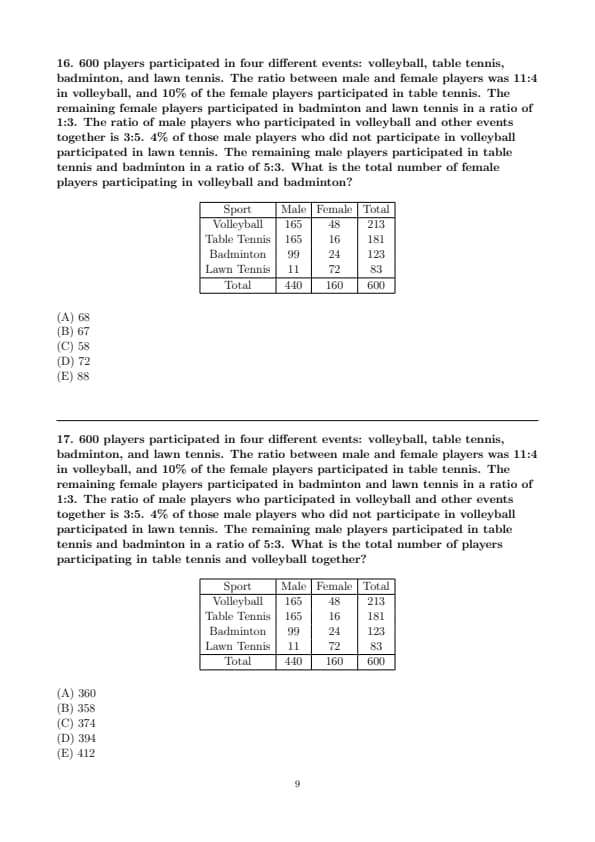
600 players participated in four different events: volleyball, table tennis, badminton, and lawn tennis. The ratio between male and female players was 11:4 in volleyball, and 10% of the female players participated in table tennis. The remaining female players participated in badminton and lawn tennis in a ratio of 1:3. The ratio of male players who participated in volleyball and other events together is 3:5. 4% of those male players who did not participate in volleyball participated in lawn tennis. The remaining male players participated in table tennis and badminton in a ratio of 5:3. What is the total number of female players participating in volleyball and badminton?
600 players participated in four different events: volleyball, table tennis, badminton, and lawn tennis. The ratio between male and female players was 11:4 in volleyball, and 10% of the female players participated in table tennis. The remaining female players participated in badminton and lawn tennis in a ratio of 1:3. The ratio of male players who participated in volleyball and other events together is 3:5. 4% of those male players who did not participate in volleyball participated in lawn tennis. The remaining male players participated in table tennis and badminton in a ratio of 5:3. What is the total number of players participating in table tennis and volleyball together?


Comments