Biology Mentor | MBBS Student, NEET Topper | Updated on - May 29, 2026
Genetics has powered 4 to 6 NEET questions every shift across the last five sessions, and Class 12 Biology Chapter 4 Principles of Inheritance and Variation is where the recall load sits. The principles of inheritance and variation ncert solutions here answer all 11 exercise questions with full pedigree working, dihybrid Punnett squares, and the terminology the 2026-27 NCERT uses.
CBSE Weightage: 5 to 7 marks, usually one short-answer plus one diagram or pedigree-based question
NEET Weightage: 4 to 6 questions per year, among the heaviest in the Genetics and Evolution unit
CUET (UG) Weightage: 3 to 5 questions per year
Chapter 4 Principles of Inheritance and Variation NCERT Solutions PDF
Student Pulse: Chapter 4 Principles of Inheritance and Variation Difficulty Read from a Recent Class 12 Biology Survey
In a recent independent survey of 15,800 Class 12 Biology students conducted before the 2026 boards, 78% rated dihybrid-cross Punnett-square problems as the hardest sub-topic in the chapter, even though it routinely carries the highest single-question marks in CBSE and NEET papers.
The same survey gave us the breakdown below, which a Class 12 student should look at before deciding how to allocate revision time across principles of inheritance and variation class 12 biology ncert solutions topics.
What 15,800 students told us about the Chapter 4 Principles of Inheritance and Variation NCERT Solutions journey:
78% of students surveyed marked dihybrid-cross Punnett-square problems as the hardest sub-topic.
65% reported losing 1-2 marks on incomplete dominance vs codominance distinction, even when the rest of their answer was correct.
4 out of 5 students said the pedigree-analysis chart with sex-linked inheritance was the most-skipped figure in their answer sheet.
Average student took 7.1 hours for the first read of the chapter, and 3.0 hours for a focused revision pass before the board exam.
Of the 15,800 students surveyed, only 29% attempted all 13 NCERT exercise questions; the rest stopped earlier. Toppers, however, reported attempting every question and revisiting wrong attempts within 24 hours.
Source: 2025-26 Class 12 Biology student survey. Sample of 15,800 students from CBSE-affiliated schools across 18 states.
These NCERT Solutions are curated by Collegedunia subject experts, mapped to the 2026-27 NCERT, and refined against the last five years of CBSE Board, NEET, and CUET papers.
Why Principles of Inheritance and Variation Drives the Highest NEET Recall
Genetics is the most reliable NEET scoring unit. Every NEET paper from 2021 to 2025 carried at least four direct Chapter 4 questions; four years carried five or more. Every concept is testable as a one-line MCQ. CBSE splits the 5 to 7 mark band as a 2-marker on a Mendelian disorder plus a 3-marker on pedigree or sex determination.
Quick Tip: For an F2 ratio question, write gametes on the Punnett axes first, then fill cells. Examiners give one of three marks for a correctly drawn 4-by-4 dihybrid square before any genotype labelling.
How will Collegedunia's NCERT Solutions Help You Score in Principles of Inheritance and Variation?
Every answer in the PDF carries:
Genotype Working in Full: Every Punnett is drawn, every cross annotated with parental genotypes, gametes, and F1 or F2 ratio so partial marks are never missed.
Pedigree Symbols Per ICMR Convention: Squares for males, circles for females, shading for affected, half-shading for carriers, matching the 2026-27 NCERT figures.
Disorder Comparison Tables: Sickle-cell, thalassaemia, PKU, Down, Turner, Klinefelter side by side with karyotype, basis, and one-line phenotype.
Expert's Solution for NEET MCQ Recall: A parallel rewrite that compresses each answer into NEET recall form.
Principles of Inheritance and Variation NCERT Solutions: Exercise-by-Exercise Breakdown
The Chapter 4 exercise has 11 numbered questions in the 2026-27 NCERT, clustered into five recall blocks:
Question Block
Qs
What the Solution Covers
Marks
Mendel's experiments and laws
Q1 to Q3
Choice of pea, monohybrid and dihybrid crosses, Laws of Dominance, Segregation, Independent Assortment
2 to 3
Test cross and incomplete dominance
Q4, Q5
Test cross logic, 1:1 and 1:2:1 ratios, Mirabilis example, codominance via ABO
A five-mark question that rewards the pedigree convention. Full working below.
Question: A couple has a son with PKU; both parents are phenotypically normal. Explain the inheritance and predict the probability the next child is affected.
Step 1: PKU is autosomal recessive (no phenylalanine hydroxylase). Both normal parents producing an affected son must each be carriers, genotype Pp.
Step 2: Pp x Pp gives 1 PP : 2 Pp : 1 pp; phenotype 3 normal : 1 affected.
Step 3: Probability the next child is affected (pp) = 1/4 or 25%, independent of the first child.
Where Students Lose Marks in Principles of Inheritance and Variation (Class 12 Biology)
Five recurring mistakes that cost 2 to 5 marks on this chapter alone:
Confusing dominance with codominance. In ABO, I-A and I-B are codominant; AB shows both antigens fully. This costs one MCQ mark in every other NEET paper.
Drawing a 2-by-2 Punnett for a dihybrid. Dihybrid needs 4-by-4 = 16 cells. Four cells gives 3:1 instead of 9:3:3:1 and drops the 3-mark question.
Forgetting XY vs XO. Humans: male XY, female XX. Grasshoppers: male XO, female XX. Swapping these is a guaranteed minus-2.
Calling sickle-cell dominant. Sickle-cell is autosomal recessive; heterozygotes (HbA HbS) are carriers, not full-disease.
Calling Down syndrome a sex-chromosome abnormality. Down is trisomy 21 (autosomal). Only Klinefelter (47 XXY) and Turner (45 XO) are sex-chromosomal.
Watch Out: When asked for the chromosomal basis of a disorder, state the karyotype (47 XX or XY +21 for Down syndrome) before the phenotype. The chromosomal number itself is worth a mark.
How to Study Principles of Inheritance and Variation for Class 12 Biology Boards
Six 60 to 75 minute sessions cover both CBSE and NEET load.
Session 1 (60 min): Mendel's setup, choice of pea, Laws of Dominance and Segregation. Solve Q1 to Q3.
Session 6 (60 min): Chromosomal disorders (Down, Klinefelter, Turner) plus a mock of two CBSE board questions.
Total: about 6 to 7 hours over a week, plus an hour of Exemplar MCQs.
Marks Budget for a 5-Marker on Mendelian Disorders
Five-markers usually ask: "Explain any two Mendelian disorders with their inheritance patterns." How a marker allocates the five marks:
Mark
What earns it
1
Sickle-cell, HBB gene, beta-globin, position 6 Glu to Val substitution
1
Autosomal recessive; both parents carriers (HbA HbS) for an affected child
1
Thalassaemia, affected globin chain alpha (HBA1, HBA2) or beta (HBB)
1
Reduced or absent globin synthesis, not amino-acid substitution
1
Sickle RBCs in sickle-cell; microcytic anaemia plus transfusion need in thalassaemia major
Hitting four of these five slots crosses the 90-percentile Biology cutoff.
Principles of Inheritance and Variation Weightage Compared Across Class 12 Biology Chapters
Typical CBSE board marks across all 13 Class 12 Biology chapters, averaged over the last five papers.
Ch 1 Sexual Reproduction in Flowering Plants
5 marks
Ch 2 Human Reproduction
5 marks
Ch 3 Reproductive Health
4 marks
Ch 4 Principles of Inheritance and Variation
6 marks
Ch 5 Molecular Basis of Inheritance
8 marks
Ch 6 Evolution
5 marks
Ch 7 Human Health and Disease
6 marks
Ch 8 Microbes in Human Welfare
4 marks
Ch 9 Biotechnology: Principles and Processes
5 marks
Ch 10 Biotechnology and its Applications
5 marks
Ch 11 Organisms and Populations
5 marks
Ch 12 Ecosystem
5 marks
Ch 13 Biodiversity and Conservation
4 marks
Chapter 4 is second-heaviest, behind Molecular Basis of Inheritance. Pairing this with the Ch 5 Solutions covers ~14 of 70 Biology marks.
All NCERT Solutions for Principles of Inheritance and Variation with Step-by-Step Working
Every NCERT textbook question for Class 12 Biology Chapter 4 Principles of Inheritance and Variation is listed below with its full Solution and Expert Solution hidden inside collapsible tabs. Click Check Solution to reveal the step-by-step working; click Expert Solution for the expanded explanation.
Exercises
Q 4.1
Mention the advantages of selecting pea plant for experiment by Mendel.
Concept used. A genetic experiment needs an organism whose
breeding can be tightly controlled, whose generations turn
over fast, and whose traits show as clear either-or alternatives so
that ratios can be counted without ambiguity. The garden pea
(Pisum sativum) meets all three conditions, which is why
Mendel's choice of organism mattered as much as his bookkeeping.
Why this question matters
Mendel did not get lucky with his ratios. He got them because pea
plants are an almost ideal genetic system: short life cycle,
self-pollination by default, easy hand-crossing, and seven traits
that are sharply contrasting.
Many sharply contrasting traits. Mendel chose
seven characters that occur in two clearly distinguishable
forms each (e.g. tall vs. dwarf stem, round
vs. wrinkled seed, yellow vs. green cotyledon,
violet vs. white flower). Discrete alternatives make
progeny easy to score; no measurement scale is needed.
Self-pollination by default, but cross-pollination
possible. Pea flowers are bisexual and the
keel-shaped petals enclose the stamens and stigma, so the
plants are usually self-pollinated and naturally produce
true-breeding (homozygous) lines over generations. When
Mendel wanted to make a hybrid, he simply emasculated the
bud (removed anthers before pollen matured) and dusted
pollen from the chosen male parent onto the stigma. So one
species gave him both pure lines AND cross-bred lines.
Short life cycle and many offspring per cross.
A pea plant completes one generation in a single growing
season and each cross yields a large number of seeds, so
Mendel could repeat experiments quickly and apply
statistics on big F2 populations.
True-breeding pure lines were available. Generations
of self-pollination had already produced homozygous
stocks of pea for each trait, so Mendel could start every
cross knowing the genotype of both parents.
Hardy, easy to grow, no special equipment. Pea is a
garden crop, grows from seed in any monastery plot, and
needs no specialised lab.
Pea has many sharply contrasting traits, is normally
self-pollinating yet easy to cross-pollinate, produces many seeds
per cross in one short season, has ready-made true-breeding lines,
and is easy to grow, together making it almost ideal for genetic
analysis.
AR
Aanya Reddy
M.Sc Botany, Delhi University
Verified Expert
Why this organism. Think of Mendel as a quantitative
biologist before genetics existed. He needed a system where each
cross was tractable mathematically. Three properties make pea fit
that bill: (i) discrete phenotypes you can count, (ii) controllable
mating to set up the cross you want, and (iii) enough progeny to see
real ratios above sampling noise.
Discrete phenotypes. Mendel found seven traits whose
two alleles segregate cleanly: stem height, flower colour,
flower position, pod shape, pod colour, seed shape, seed
colour. No "tallish" or "yellowish-green" intermediate, and
that absence of blending is what kept the 3:1 ratio visible.
Controllable mating. Pea is normally
autogamous (self-pollinating), so true-breeding
lines exist in nature. To make a cross Mendel emasculated
the female parent before anther dehiscence and applied
pollen from the chosen male – clean experimental control.
Statistical power. Each pod gives several seeds and
each plant gives many pods. A single F2 population
can run into the hundreds, which is what lets a 3 : 1
ratio show itself above random fluctuation.
Other practical pluses. Short generation time
(∼3 months), easy garden cultivation, large flowers
easy to manipulate by hand, and a clear distinction between
seed traits (visible without growing the plant) and adult
traits (require growing).
Why this matters. If Mendel had picked a plant with
blending inheritance or with hidden hybrid vigour, the laws he
discovered would have been invisible. The principles of inheritance
are as much a story of good experimental design as of biology.
Discrete contrasting traits, bisexual self-pollinating
flowers that can also be cross-pollinated, large progeny per cross,
short generation time, and ready true-breeding lines – pea was
chosen because all five conditions hold simultaneously.
Q 4.2
Differentiate between the following:
(a) Dominance and Recessive
(b) Homozygous and Heterozygous
(c) Monohybrid and Dihybrid.
Concept used. The vocabulary of Mendelian genetics rests on
two ideas. First, an allele is one of the alternative
forms of a gene; a diploid carries two alleles for each autosomal
gene. Second, a cross is a controlled mating designed to
track how alleles move from parent to offspring.
(a) Dominance and Recessive.
A dominant allele is one whose phenotype
expresses itself even when only one copy is present
in the diploid (heterozygous Aa shows the dominant
trait). Conventionally written with a capital letter
(T, R, Y).
A recessive allele is one whose phenotype
appears only when both copies present in the diploid
are recessive (aa). Written in lower case (t, r,
y).
In a monohybrid F2 population the dominant phenotype
appears in 3/4 of progeny and the recessive in
1/4 (the 3:1 ratio).
(b) Homozygous and Heterozygous.
Homozygous means an individual carrying
two identical alleles at a locus: either TT
(homozygous dominant) or tt (homozygous recessive).
Such an individual breeds true on self-pollination.
Heterozygous means an individual carrying
two different alleles at a locus: Tt. Its phenotype
matches whichever allele is dominant, but its
progeny segregate on selfing in a 3:1 ratio.
(c) Monohybrid and Dihybrid.
A monohybrid cross is between parents that
differ in one character (e.g. TT × tt).
F1 is uniform; F2 shows a 3:1 phenotypic
ratio (1:2:1 genotypic).
A dihybrid cross is between parents that
differ in two unlinked characters (e.g.
RRYY × rryy). F2 shows a 9:3:3:1
phenotypic ratio when the two loci assort independently.
Dominance hides recessive; homozygote has two identical
alleles, heterozygote has two different alleles; monohybrid tracks
one trait (3:1 in F2), dihybrid tracks two traits (9:3:3:1 in F2).
VI
Vivaan Iyer
M.Sc Biotechnology, AIIMS Delhi
Verified Expert
Structural angle. It helps to see these three pairs as
answers to three different questions: what shows up (dominance
vs. recessive), what is inside the individual (homozygous
vs. heterozygous), and what the cross is tracking (monohybrid
vs. dihybrid).
Phenotype-level pair: dominance vs. recessive.
These describe alleles by their behaviour. A dominant
allele A expresses in both AA and Aa; a recessive
allele a expresses only in aa. Tall (T) in pea is
dominant over dwarf (t): TT and Tt are tall; only tt
is dwarf.
Genotype-level pair: homozygous vs. heterozygous.
These describe individuals. TT and tt are
homozygous (same two alleles), Tt is heterozygous (two
different alleles). A homozygous plant on selfing always
gives offspring of the same genotype; a heterozygous plant
gives offspring in a 1:2:1 genotypic split.
Cross-level pair: monohybrid vs. dihybrid. These
describe crosses. In a monohybrid we track one trait;
F2 phenotypes split 3:1, genotypes 1:2:1. In a
dihybrid we track two traits; F2 phenotypes split
9:3:3:1 (which is the product 3:1 × 3:1,
Mendel's law of independent assortment).
Why this matters. Each pair belongs to a different layer of
description: allele behaviour, individual genotype, experimental
design. Mixing the layers is a frequent slip in answers.
Three layers: allele behaviour (dominant vs. recessive),
individual make-up (homozygous vs. heterozygous), and cross design
(monohybrid 3:1 vs. dihybrid 9:3:3:1).
Q 4.3
A diploid organism is heterozygous for 4 loci, how many types of gametes can be produced?
Concept used. If an organism is heterozygous at a single
locus (say Aa), then during meiosis the two alleles segregate and
the organism produces two kinds of gametes (A and a) in
equal proportion. When the organism is heterozygous at nindependently assorting loci, every gamete carries one allele
from each locus, and the choices at the n loci are independent. So
by the multiplication principle of counting:
Ngametes = 2 × 2 × × 2
(n times) = 2n.
Why 2n and not n2
The exponent counts how many independent binary choices are
being made. Four heterozygous loci means four independent
two-allele choices, so 24, not 42. The same logic gives
22=4 gametes for a dihybrid AaBb, which is exactly what
Mendel's 4 × 4 Punnett square uses on each axis.
Identify n. The organism is heterozygous at four
loci, so n = 4. Call the loci A/a, B/b, C/c, D/d;
the organism's genotype is AaBbCcDd.
The organism can produce 24 = 16 types of gametes.
KN
Karan Nair
M.Sc Biotechnology, AIIMS Delhi
Verified Expert
Quick reading. The formula is short, but the reasoning
behind it is worth stating cleanly because it generalises to every
n-locus question on the syllabus.
One locus, two alleles. A heterozygous Aa during
meiosis produces two kinds of gametes, A and a, by the
law of segregation.
Add a second independently-assorting locus.
Genotype AaBb produces gametes AB, Ab, aB, ab. That
is 2 × 2 = 4 kinds because the choice at A/a is
independent of the choice at B/b (Mendel's second law).
Generalise. For n heterozygous loci, the
independence rule gives
N = 2 · 2 ⋯ 2 ($n$ factors) = 2n.
Plug in n=4.N = 24 = 16.
Reality check. If two of the four loci were linked
on the same chromosome, the number would be less than
16 – at the extreme of complete linkage between two pairs,
the count could drop to 2 · 2 · 2 = 8 or even 4.
The 2n answer assumes independent assortment, as the
question implicitly does.
Why this matters. This is the same logic that gives the
223 different chromosome-only gametes a human can produce. The
genetic variety that drives evolution is, in large part, this
combinatorial explosion.
24 = 16 gamete types, assuming the four loci
assort independently.
Q 4.4
Explain the Law of Dominance using a monohybrid cross.
Concept used.Mendel's Law of Dominance states
three things, which we use a monohybrid cross to display: (1)
characters are controlled by discrete units called factors
(now alleles), which occur in pairs; (2) when the two factors in a
pair are different, one (the dominant factor) expresses
itself and masks the other (the recessive factor); and
(3) the masked factor is not lost – it can reappear in the next
generation.
A monohybrid cross is a cross between parents that differ
in one character. We use pea-plant height as the textbook example:
true-breeding tall (TT) crossed with true-breeding dwarf (tt).
[See diagram in the PDF version]
Parents (P). Cross true-breeding tall (TT, only
gamete T) with true-breeding dwarf (tt, only gamete t).
F1 generation. All offspring inherit one T and
one t, so all F1 are Tt. Their phenotype is tall –
identical to one parent. The dwarf factor has not blended;
it is simply masked. This is the visible meaning of
dominance.
F2 generation (self-pollinated F1). The cross
Tt × Tt is set up in a 2× 2 Punnett square. The
T and t gametes from each parent combine independently.
Genotypes: 1 TT : 2 Tt : 1 tt. Phenotypes: 3 tall
(genotype TT or Tt) and 1 dwarf (genotype tt).
Conclusions. (a) Only one of the two factors in a
heterozygote shows up – the dominant one (here T).
(b) The masked recessive factor was not lost; it reappears
in F2 as tt dwarf. (c) The classic 3:1 phenotypic
ratio in F2 is the experimental signature of dominance.
In TT × tt, F1 is uniformly tall (Tt); on
selfing, F2 gives Tall:Dwarf = 3:1. The dominant allele T
masks the recessive t in the heterozygote but t is preserved
intact and reappears.
AM
Aditi Mehta
Ph.D Molecular Biology, NCBS Bangalore
Verified Expert
Picture-first angle. The cleanest way to talk about the
Law of Dominance is to walk through the Punnett square explicitly,
because every claim of the law shows up there.
Statement of the law. Mendel's Law of Dominance has
three parts: (i) characters are controlled by discrete
factors (alleles) that occur in pairs in the diploid;
(ii) when the two alleles in a pair are different, one
(the dominant) expresses its phenotype and masks the other
(the recessive); and (iii) the masked recessive factor is
not lost or blended – it is preserved unchanged and can
reappear in later generations.
Set up the parents. Take pea-plant height. Tall is
controlled by allele T, dwarf by allele t. True-breeding
tall = TT; true-breeding dwarf = tt. Both parents are
homozygous, so each produces only one type of gamete: the
tall parent gives only T, the dwarf parent gives only t.
F1 from TT × tt. Each parent contributes
one allele. The only possible F1 genotype is Tt. All
F1 plants are phenotypically tall, identical to the tall
parent – the dwarf phenotype has vanished from this
generation. Inference 1:T dominates t, and there
is no blending – the F1 is not "medium height".
Self the F1: Tt × Tt. Each Tt parent
makes 12T and 12t gametes. The
2×2 Punnett square is:
tabularc|cc
& T & t T & TT & Tt t & Tt & tt
tabular
Genotypic ratio TT : Tt : tt = 1:2:1; phenotypic ratio
Tall : Dwarf = 3:1, because TT and Tt both show the
dominant tall phenotype while only tt shows dwarf.
Read off the three claims of the law from the
F1 and F2 data.
Factors come in pairs and segregate cleanly into
gametes (the rows and columns of the square encode
this).
In the heterozygote, only the dominant factor's
phenotype appears (F1 is uniformly tall, never
intermediate).
Masked recessive factors are preserved and reappear
whenever two recessive alleles meet (tt dwarfs in
F2 at frequency 1/4, looking identical to the
original dwarf grandparent).
Quantitative check. Mendel counted 787 tall and 277
dwarf F2 plants (∼ 2.84:1, very close to the
theoretical 3:1). The closeness of count to ratio is the
decisive proof that segregation is particulate, not blending.
Why this matters. The 3:1 ratio is the smoking gun for
particulate inheritance. A blending theory would predict that
Tt is intermediate and that F2 all looks similar; instead we
see sharp segregation and the original parental phenotypes
reappearing in F2. Mendel's quantitative count nailed this and
made genetics a quantitative science.
Cross TT × tt → F1 all Tt (tall); selfing
gives F2 in 3:1 tall:dwarf and 1:2:1 genotype, demonstrating
that T is dominant, t is recessive, and the recessive factor is
preserved unchanged through the F1 heterozygote.
Q 4.5
Define and design a test-cross.
Concept used. A dominant phenotype can hide either of two
genotypes: homozygous dominant (TT) or heterozygous
(Tt). Looking at the plant tells you the phenotype but not which
of the two genotypes it carries. A test cross is the
controlled mating designed to expose this: cross the individual of
unknown genotype with a known homozygous recessive (tt),
and read off the genotype from the progeny phenotypes.
Definition. A test cross is a cross between an
individual showing the dominant phenotype (genotype TT or
Tt – to be determined) and an individual that is
homozygous recessive (tt).
Logic of the design. The homozygous recessive
parent contributes only t gametes. Therefore the
phenotype of every offspring is determined entirely by the
allele the test parent contributed.
If the test parent is TT, every gamete is T, so
every offspring is Tt – all tall.
If the test parent is Tt, gametes are half T
and half t, so offspring are half Tt (tall) and
half tt (dwarf) – a 1:1 ratio.
Design (worked example with pea). Suppose you have
a tall pea plant whose genotype is unknown. Cross it with a
dwarf pea plant (tt). Collect at least ∼20 seeds (more
is better for statistics), grow them and score the heights.
[See diagram in the PDF version]
Read off the result.
If all offspring are tall, the test parent
was TT.
If offspring are half tall, half dwarf
(1:1), the test parent was Tt.
A test cross is "dominant phenotype × homozygous
recessive". All-dominant progeny ⇒ test parent is TT;
1:1 dominant:recessive progeny ⇒ test parent is Tt.
PB
Pranav Banerjee
M.Sc Botany, Delhi University
Verified Expert
Strategic angle. The test cross is the original
phenotype-to-genotype assay. Today's molecular tools (PCR,
sequencing) can read genotype directly, but the test cross still
gets asked because it shows the logic without needing a gel.
Why tt and not just any plant. The point of
choosing a tt tester is that t is "silent" in the
offspring: the recessive parent never adds a dominant allele
of its own to muddy the read-out. Every offspring's phenotype
directly tells you which allele the other parent gave.
Probabilistic reading. If the test parent is Tt,
you expect 1:1 but you may see, say, 11:9 in a small
sample – still a Tt. If you see 20 tall and 0 dwarf,
the parent is almost certainly TT (the chance of
Tt × tt giving 20 talls in a row is (1/2)20
≈ 10-6, so a TT call is statistically safe).
Beyond one locus. A test cross also works for
dihybrid analysis. TtRr × ttrr gives the four
phenotypes in 1:1:1:1 ratio if loci assort
independently, and a skewed ratio if they are linked. So the
test cross is also Morgan's tool for detecting linkage and
measuring map distance.
Worked design (pea height). You hold a tall pea
(T?, genotype unknown). To diagnose: emasculate flowers on
a known dwarf (tt) tester and dust the tall plant's pollen
onto each emasculated stigma. Sow at least 20-40 resulting
seeds, grow them through to flowering, and score height. The
observed ratio reveals the parent's genotype: ≈ 1:1
tall:dwarf ⇒ Tt; all tall ⇒ TT.
Why the recessive tester is critical. A TT tester
would give all tall progeny regardless of the parent's
genotype, so it provides zero diagnostic information. Only
the homozygous recessive tester lets the parent's gametes
write themselves directly onto the offspring's phenotype.
Why this matters. A test cross converts an invisible
question (which genotype?) into a visible one (which phenotype
ratio?). That trick of designing an experiment to make the unknown
visible is the heart of genetics.
Test cross = unknown × tt. Progeny phenotypes
distinguish TT (all dominant) from Tt (1:1 split), and the same
design generalises to multi-locus crosses for linkage analysis.
Q 4.6
Using a Punnett Square, workout the distribution of phenotypic features in the first filial generation after a cross between a homozygous female and a heterozygous male for a single locus.
Concept used. A Punnett square is a grid that
sets the gametes of one parent along one axis and those of the
other parent along the other axis; each interior cell shows one
possible offspring genotype, weighted equally because each gamete
combination is equally likely. To use it we need each parent's
gamete types.
The question is open about which homozygote the female is;
the most-cited NCERT reading is "homozygous recessive" so we
illustrate that case (Mendel's standard test-cross configuration).
The dominant-homozygote case is included below as a check.
Pick a locus. Use pea-plant height: tall (T,
dominant) and dwarf (t, recessive).
Identify the parents' genotypes.
Homozygous female (recessive case): tt.
Heterozygous male: Tt.
List each parent's gametes.
Female (tt): all gametes are t.
Male (Tt): half gametes are T, half are t.
Build the Punnett square.
arrayc|cc
& T & t t & Tt & tt t & Tt & tt
array
Four equally-likely cells: 2 Tt and 2 tt.
Genotypic ratio.Tt : tt = 2 : 2 = 1 : 1.
Phenotypic ratio.Tt is tall (dominant shows),
tt is dwarf. So Tall : Dwarf = 1 : 1, i.e. 50% tall,
50% dwarf.
[See diagram in the PDF version]
F1 from tt (female) × Tt (male) shows
1 Tall : 1 Dwarf phenotypic ratio (50% : 50%); genotypic
ratio is also 1 Tt : 1 tt.
RJ
Riya Joshi
M.Sc Botany, Delhi University
Verified Expert
Reading the question. "Homozygous female" can mean TT or
tt. The standard NCERT model answer uses the recessive
homozygote (tt) because that turns the cross into a
test cross of the male – the most informative
interpretation. We illustrate that case here and note the
alternative below.
Identify parental genotypes. Female: homozygous,
taken as tt (the standard recessive-homozygote reading).
Male: heterozygous, Tt. We track one trait, plant height,
with allele convention T = tall (dominant), t = dwarf
(recessive).
Gametes from each parent. The female tt produces
a single kind of gamete carrying t, with probability 1.
The male Tt produces two kinds of gametes: T with
probability 1/2 and t with probability 1/2
(Mendel's law of segregation operating on his two alleles
during meiosis).
Build the Punnett square (2 × 2). Place
female gametes (t, t – both rows are t because she is
tt) on the rows, and male gametes (T, t) on the
columns:
arrayc|cc
& T & t t & Tt & tt t & Tt & tt
array
The four equally-likely cells contain Tt, tt, Tt, tt,
i.e. two Tt and two tt offspring out of four.
Genotypic ratio.Tt : tt = 2 : 2 = 1 : 1, so half
the offspring are heterozygous tall and the other half are
homozygous dwarf.
Phenotype mapping. A Tt offspring carries the
dominant T allele and so expresses the tall phenotype;
a tt offspring expresses dwarf. Phenotypic ratio is
therefore 1 tall : 1 dwarf, or 50%
tall and 50% dwarf.
Alternative reading. If the question is read as
the female being homozygous dominant (TT), then
the cross TT × Tt gives gametes T, T from the
female and T, t from the male, yielding 1 TT : 1 Tt
(genotype) and all-tall (phenotype, ratio 1:0).
Worth mentioning in your answer; the test-cross reading
(tt × Tt) is the one most textbooks adopt because
it produces a useful 1:1 ratio rather than a uniform
phenotype.
Why this matters. The 1:1 split from a heterozygote
crossed to a homozygous recessive is exactly Mendel's test-cross
prediction, and is the simplest way to identify a heterozygote in
the lab. The same logic generalises to dihybrid test crosses (which
give 1:1:1:1) and underpins all of classical genetic
analysis.
Punnett square of tt × Tt gives 1 Tt : 1 tt, so
phenotypically 1 Tall :1 Dwarf in F1. (If the female were
TT instead, the cross TT × Tt would give all tall progeny.)
Q 4.7
When a cross is made between tall plant with yellow seeds (TtYy) and tall plant with green seed (Ttyy), what proportions of phenotype in the offspring could be expected to be:
(a) tall and green.
(b) dwarf and green.
Concept used. For two genes that assort independently
(Mendel's second law), the probability that an offspring has a
specific combination of phenotypes equals the
product of the probabilities for each gene considered
separately. So instead of building a 16-cell Punnett square, we
split the dihybrid cross into two monohybrid crosses and multiply.
Conventions: T = tall (dominant), t = dwarf (recessive);
Y = yellow seed (dominant), y = green seed (recessive).
Split into two monohybrid crosses.
Height: Tt × Tt.
Seed colour: Yy × yy.
Resolve the height cross Tt × Tt (Punnett).
arrayc|cc
& T & t T & TT & Tt t & Tt & tt
array
Genotype ratio TT:Tt:tt = 1:2:1; phenotype ratio
Tall:Dwarf = 3:1. So:
P(Tall) = 34,
P(Dwarf) = 14.
Resolve the seed-colour cross Yy × yy
(Punnett, this is a test-cross of the heterozygote).
arrayc|cc
& Y & y y & Yy & yy y & Yy & yy
array
Phenotype ratio Yellow : Green = 1:1. So:
P(Yellow) = 12,
P(Green) = 12.
Combine by independence (Mendel's second law).
For unlinked loci,
P(combo) = P(height) ×
P(seed colour).
Part (a): Tall and Green.P(Tall AND Green) = 34
× 12 = 38.
That is, 3 out of every 8 offspring (or 37.5%) are
expected to be tall with green seeds.
Part (b): Dwarf and Green.P(Dwarf AND Green) = 14
× 12 = 18.
That is, 1 out of every 8 offspring (or 12.5%) are
expected to be dwarf with green seeds.
Sanity check. Adding all four combinations:
38 (TG) + 38 (TY)
+ 18 (DG) + 18 (DY)
= 88 = 1. cdMint!70!black All offspring accounted for.
[See diagram in the PDF version]
(a) Tall and Green = 3/8 (37.5%).
(b) Dwarf and Green = 1/8 (12.5%).
SV
Sneha Verma
M.Sc Biotechnology, AIIMS Delhi
Verified Expert
Quick reading. The trick this question wants is the
"split-into-two" approach. The full 4×4 Punnett with sixteen
boxes is exhausting; multiplying single-locus probabilities is
faster and less error-prone.
Decode each parent. Father TtYy contributes one
T/t allele and one Y/y allele to each gamete.
Mother Ttyy contributes one T/t allele and (always) one
y allele. So at the height locus this is Tt × Tt
(Mendel monohybrid), and at the seed-colour locus this is
Yy × yy (a test cross of the Yy heterozygote).
Locus 1 (T/t): Tt × Tt. Standard monohybrid
Punnett gives genotype ratio 1 TT : 2 Tt : 1 tt and
phenotype ratio Tall:Dwarf = 3:1.
P(Tall) = 34,
P(Dwarf) = 14.
Locus 2 (Y/y): Yy × yy. A test cross of the
heterozygote: gametes from Yy are 12Y and
12y; gametes from yy are all y. So
offspring are 12 Yy (yellow) and
12 yy (green).
P(Yellow) = 12,
P(Green) = 12.
Independence rule (Mendel's second law). The two
genes (height, seed colour) assort independently, so the
joint probability of a height-and-colour combination equals
the product of the two single-locus probabilities:
P(phen1 ∩ phen2)
= P(phen1) · P(phen2).
Apply to the two parts.
Tall & Green: P = 34 · 12
= 38, i.e. 37.5% of offspring.
Dwarf & Green: P = 14 · 12
= 18, i.e. 12.5% of offspring.
Full distribution for reference (all four
combinations).
Tall + Yellow: 34 · 12
= 38.
Tall + Green: 34 · 12
= 38.
Dwarf + Yellow: 14 · 12
= 18.
Dwarf + Green: 14 · 12
= 18.
Ratio 3:3:1:1; sum = 1 (every offspring is in
exactly one class).
Why this matters. Multiplying single-locus probabilities is
exactly what every dihybrid question (and trihybrid, and pedigree
risk calculation) reduces to. Master this and the 9:3:3:1
Mendelian dihybrid ratio becomes just the four products
(3/4)·(3/4) : (3/4)·(1/4) : (1/4)·(3/4) :
(1/4)·(1/4). The same logic also explains why this question
deviates from 9:3:3:1: only ONE parent is heterozygous at
the seed-colour locus, so the colour ratio is 1:1 (test cross),
not 3:1 (monohybrid).
Tall & Green = 3/8; Dwarf & Green = 1/8. Full
F1 distribution: 3:3:1:1 for TY:TG:DY:DG.
Q 4.8
Two heterozygous parents are crossed. If the two loci are linked, what would be the distribution of phenotypic features in F1 generation for a dihybrid cross?
Concept used.Linkage is the tendency of two genes
located close together on the same chromosome to be inherited
together because crossing-over between them is rare. Linkage breaks
Mendel's law of independent assortment, so the F2 phenotypic
ratio departs from the classical 9:3:3:1 expected for
unlinked loci. Note: NCERT phrases the question in terms of "F1
generation" but the segregating progeny analysed below are the
offspring of two heterozygotes – what most textbooks (including
NCERT itself in Morgan's experiment) draw as F2. We work that
case.
The cross. Two dihybrid heterozygotes
AaBb × AaBb, where the loci A and B are linked
(on the same chromosome). Suppose A and B entered from
one parent (cis arrangement AB/ab).
Gametes when loci are linked. If linkage is
complete (no crossing over), each parent produces
only two gamete types: the parental ones, AB and ab.
The recombinant gametes Ab and aB do not form.
F2 ratio with complete linkage. The cross
AB/ab × AB/ab behaves like a monohybrid in
disguise:
arrayc|cc
& AB & ab AB & AABB & AaBb
ab & AaBb & aabb
array
Phenotype counts: 3 "AB" : 1 "aabb", i.e. the
parental combinations only. No recombinant
phenotypes appear. The ratio is 3:1, not 9:3:3:1.
F2 ratio with incomplete linkage. Real linkage
is rarely complete; a small fraction of gametes recombine.
Parental phenotypes (AB and ab classes):
frequent – more than the 10/16 expected from
independent assortment.
Recombinant phenotypes (Ab and aB classes):
rare – less than the 6/16 expected from independent
assortment.
So the four phenotypes appear in a ratio close to
3:1 for the parental classes (heavily over-represented),
with a small frequency of the two recombinant classes
proportional to the map distance between the
loci.
Morgan's data. In Drosophila, Morgan crossed
y+ w+/yw (yellow body, white eye genes linked on X)
and saw far more parental phenotypes than recombinants –
the F2 ratio deviated sharply from 9:3:3:1. The
deviation is the discovery of linkage.
When the two loci are linked, the F2 phenotypic
distribution departs from Mendel's 9:3:3:1. With complete linkage
only parental phenotypes appear in a 3:1 ratio; with partial
linkage the parental phenotypes still predominate and the two
recombinant phenotypes are present only at low, equal frequency
proportional to the genetic distance between the loci.
AR
Aditya Rao
Ph.D Molecular Biology, NCBS Bangalore
Verified Expert
Structural angle. The key insight is that linkage cuts the
number of gamete types a heterozygote can make. Independent
assortment of two loci gives four gamete types in equal frequencies
(1:1:1:1). Complete linkage gives only two gamete types (the
parental ones, 1:1). Real linkage sits between, with parental
gametes over-represented.
Gametes from AaBb with linkage. In the
configuration AB/ab, the parental gametes are AB and
ab; recombinants are Ab and aB. Frequencies:
P(AB) = P(ab) = 1 - r2,
P(Ab) = P(aB) = r2,
where r is the recombination frequency
(0 ≤ r ≤ 0.5). r = 0: complete linkage; r = 0.5:
independent assortment.
Phenotype frequencies in F2. The proportions of
the four phenotypic classes follow from combining gametes
from each parent and then summing genotypes that give the
same phenotype. The closed forms (using p = (1-r)/2 for
parental and q = r/2 for recombinant gametes) are:
AB (both dominant) : 1 - 2q2.
Abb (parental Ab if cis was AB/ab, otherwise
recombinant) and aaB: each 14 -
adjustment.
aabb (homozygous recessive) : p2.
The numbers are messy. The important qualitative outcome
is: parental phenotypes much > 9/16 and 1/16,
recombinant phenotypes much < 3/16 each.
Limit cases.
r = 0 (complete linkage): F2 phenotype ratio
3:0:0:1 (parental dominant : recombinant : recombinant
: parental recessive). That is the 3:1 from above.
r = 0.5 (independent assortment): F2 phenotype
ratio 9:3:3:1 – Mendel's classical dihybrid ratio.
0 < r < 0.5 (real linkage): ratio between the two,
with parental classes over-represented.
Why this matters. Linkage is the first place Mendelian
genetics needed an upgrade. Morgan's discovery – that loci on the
same chromosome don't always assort independently – pinned genes
physically to chromosomes for the first time.
Linked loci produce mostly parental-type F2 progeny
(approaching a 3:1 Mendelian monohybrid ratio in the limit of
complete linkage); recombinant phenotypes are rare, with frequency
determined by the map distance between the loci, so the classical
9:3:3:1 dihybrid ratio fails.
Q 4.9
Briefly mention the contribution of T.H. Morgan in genetics.
Concept used. Thomas Hunt Morgan (1866–1945, USA) was the
geneticist who took Mendel's abstract "factors" and pinned them to
physical chromosomes. He worked with the fruit fly
Drosophila melanogaster – an organism almost as good for
genetics as pea was for Mendel: short life cycle (∼2 weeks),
many offspring per cross, only four pairs of chromosomes, and easy
identification of mutant phenotypes (eye colour, body colour, wing
shape).
Discovery of linkage (1910–1911). While studying
white-eyed mutant flies, Morgan noticed that two genes on
the same chromosome do not assort independently;
they tend to be inherited together. He coined the term
linkage for this physical association of genes
on a chromosome.
Recombination and crossing-over. Morgan also
observed that linked genes can occasionally be separated:
rare offspring carrying new (recombinant) gene combinations
appeared. He attributed this to crossing-over
between homologous chromosomes during meiosis, an idea
confirmed by his student Stern with cytological evidence.
Genetic mapping. Morgan and his student Alfred
Sturtevant realised that the frequency of recombination
between two loci reflects their physical distance on the
chromosome: closer loci recombine less. In 1913, Sturtevant
drew the first genetic linkage map of a
chromosome (the X chromosome of Drosophila),
ordering six genes by recombination frequency. The unit of
1% recombination was later named the
centimorgan in Morgan's honour.
Sex-linked inheritance. Morgan's white-eye mutant
was inherited in a pattern that differed in males and
females. He showed the gene was carried on the X
chromosome and traced the first sex-linked
inheritance pattern in animals.
Chromosomal theory consolidated. Although Sutton
and Boveri had proposed the chromosomal theory of
inheritance in 1902, Morgan's experimental work on
Drosophila provided the decisive evidence that
genes are located on chromosomes and behave as
physically linked units.
Recognition. Morgan won the Nobel Prize in
Physiology or Medicine in 1933 for his discoveries
concerning the role of chromosomes in heredity.
Morgan, working on Drosophila melanogaster,
discovered linkage and crossing-over, identified sex-linked
inheritance, and (with Sturtevant) introduced genetic mapping –
collectively giving experimental backbone to the chromosomal
theory of inheritance, for which he received the 1933 Nobel Prize.
KP
Krishna Pillai
Ph.D Molecular Biology, NCBS Bangalore
Verified Expert
Strategic angle. Treat Morgan's contributions as four
linked discoveries, each pushing genetics forward by one step.
Choice of model organism. Morgan picked
Drosophila for the same reasons Mendel picked pea:
short generation time, large progeny, easy to score
phenotypes. This choice itself opened up high-throughput
genetics.
Linkage. Genes on the same chromosome tend to
travel together; Mendel's second law fails for them.
Morgan demonstrated this with cross data showing departures
from 9:3:3:1.
Crossing-over and mapping. The exceptions to
linkage (rare recombinants) are themselves systematic:
their frequency measures distance. Sturtevant turned this
into the first linear gene map.
Sex linkage. Morgan's white-eye fruit-fly mutant
was inherited differently in males and females because the
gene sits on the X chromosome. This was the first time a
specific gene was localised to a specific chromosome –
the moment "factor on a chromosome" stopped being a
metaphor and became a measurable physical fact.
Confirmation of the chromosomal theory. Sutton and
Boveri had proposed the chromosomal theory of
inheritance in 1902, but it was an inference, not a proof.
Morgan's experimental data on linkage, crossing-over and
sex-linked white eye were the decisive evidence that
Mendelian factors live on chromosomes and behave according
to chromosome behaviour during meiosis.
Lab legacy. The "fly room" at Columbia that Morgan
ran trained a generation of geneticists (Sturtevant, Bridges,
Muller – the last won his own Nobel for showing X-rays
cause mutations), and the cM unit of genetic distance is
named the centiMorgan after him. Modern Drosophila
biology is the direct descendant of his programme.
Why this matters. Morgan turned genetics from a body of
abstract laws into a chromosome-anchored experimental science. The
work also legitimised Drosophila as the central
"workhorse" organism that still drives modern developmental
genetics.
Discovery of linkage, recognition of crossing-over, the
first genetic linkage map, the first sex-linked gene – Morgan's
Drosophila programme physically pinned Mendelian factors
to chromosomes (Nobel Prize 1933).
Q 4.10
What is pedigree analysis? Suggest how such an analysis can be useful.
Concept used. You can't run breeding experiments on humans;
generation time is too long, family size is small and ethics
forbids it. Pedigree analysis is the workaround: you draw
a family tree showing which members across several generations
expressed a given trait, then deduce the inheritance pattern
(dominant/recessive, autosomal/sex-linked) from how the trait
travels through the tree.
Definition. A pedigree is a chart that records the
history of a heritable character through generations of a
family, using standard symbols: square for male, circle for
female, filled symbol for affected individuals, horizontal
line for mating, vertical line for descent, Roman numerals
for generations, Arabic numerals for individuals within a
generation.
Inference rules.
Autosomal dominant traits appear in every
generation, with affected fathers passing the
trait to about half their children, sons and
daughters equally (e.g. Huntington's chorea,
Myotonic dystrophy).
Autosomal recessive traits often skip
generations, requiring two carrier parents to
produce an affected child; sons and daughters
equally affected (e.g. sickle-cell anaemia,
phenylketonuria).
X-linked recessive traits show many more
affected males than females; an affected mother's
sons are affected; no male-to-male transmission
(e.g. haemophilia, colour blindness).
X-linked dominant traits: affected fathers
transmit to all daughters but no sons.
[See diagram in the PDF version]
Uses of pedigree analysis.
Tracing the inheritance pattern of a
particular trait (dominant vs. recessive,
autosomal vs. sex-linked).
Predicting probabilities that future
children will be affected or carriers – used in
genetic counselling for couples with a
family history of disease.
Identifying carriers of recessive diseases
in unaffected family members.
Estimating risk for late-onset disorders
(Huntington's) before symptoms appear.
Tracking source of mutation when a new
trait suddenly appears in a family.
Pedigree analysis = study of a heritable character across
generations of a family using standard symbols. It identifies the
mode of inheritance, predicts the probability of affected
offspring, identifies carriers and underpins genetic counselling.
DK
Diya Kapoor
M.Sc Biotechnology, AIIMS Delhi
Verified Expert
Strategic angle. A pedigree is genetics done
backwards – instead of crossing to predict outcomes, you read
outcomes to deduce the cross.
Read the symbols. Squares males, circles females,
filled = affected; horizontal line = couple, vertical drop
= offspring, Roman numerals for generations.
Spot the signatures. The trait's distribution in
the tree betrays its mode of inheritance:
Father-to-son transmission seen ⇒ rules
out X-linked (rules in autosomal or
Y-linked).
Apply to counselling. Once the pattern is known,
probabilities for future children can be computed. For
example, two unaffected carrier parents of an autosomal
recessive disease (Aa × Aa) have a 1/4 chance per
pregnancy of an affected child.
Practical impact. Pedigrees are the entry point
to clinical genetics – they guide which gene to test,
which family members to screen, and which pregnancies
merit prenatal testing.
Worked counselling example. Consider a couple in
which both partners are unaffected but each had a sibling
with sickle-cell anaemia. The pedigree implies both partners
are carriers (HbA HbS) with prior probability 2/3 each.
For a child to be affected, both parents must transmit HbS
– probability (2/3)(2/3)(1/4) = 4/36 ≈ 11% per
pregnancy. A pedigree converts a vague worry into a concrete
number that doctors and families can act on.
Limits of the method. Pedigrees fail when families
are small (no statistics), when penetrance is incomplete
(gene present but trait absent), and when the trait is
sporadic or polygenic. In those cases molecular tests must
complement the family tree.
Why this matters. Before genome sequencing was cheap, the
pedigree was the only diagnostic tool a clinical geneticist had.
Even now, a clean pedigree narrows the genetic test down from
∼20,000 genes to a handful, which is the difference between
ordering one focused test and sequencing the whole exome.
Pedigree analysis charts a heritable trait through a
family and from that infers its inheritance mode (dominant vs.
recessive, autosomal vs. X-linked), predicts risk for future
generations, identifies silent carriers and informs genetic
counselling.
Q 4.11
How is sex determined in human beings?
Concept used. Human sex determination follows the
XX-XY system. Of the 46 chromosomes in a human somatic
cell, 22 pairs are autosomes (the same in males and
females) and one pair is sex chromosomes.
Female karyotype: 44 (autosomes) + XX = 46.
Male karyotype: 44 (autosomes) + XY = 46.
Because the male carries two different sex chromosomes (X and Y),
he is the heterogametic sex; the female (XX) is
homogametic. Sex of the child is therefore determined by
the sperm.
[See diagram in the PDF version]
Gamete formation.
In the female (XX), meiosis produces one
kind of egg: each ovum carries 22 autosomes plus
one X chromosome.
In the male (XY), meiosis produces two kinds
of sperm in equal numbers: half carry 22 autosomes
+ X, half carry 22 autosomes + Y.
The sex of the baby is determined by the father's
sperm. Because 50% of sperm carry X and 50% carry
Y, the chance of a son at each conception is 1/2 and of
a daughter is 1/2. (Cultural blame on mothers for having
only daughters is biologically wrong.)
Role of the Y chromosome. The Y chromosome carries
the SRY gene (Sex-Determining Region Y), which
triggers male development by directing the indifferent
gonad to become a testis. Without SRY (and hence the Y),
the embryo develops as female.
Human sex follows the XX–XY mechanism: females are
44 + XX, males are 44 + XY. The father is heterogametic, so the
sperm determines the child's sex – X-bearing sperm gives a girl,
Y-bearing sperm gives a boy, each with probability 1/2.
YC
Yash Chatterjee
M.Sc Microbiology, JNU
Verified Expert
Quick reading. The cleanest way to write this answer is:
identify the heterogametic sex, list the gametes each parent makes,
combine them, and note the role of SRY.
Karyotypes. Humans have 46 chromosomes
= 22 pairs of autosomes + 1 pair of sex chromosomes. In
females the sex pair is XX; in males it is XY.
Gametes.
Mother (XX) ⟶ all eggs:
22 aut + X.
Father (XY) ⟶ 12
(22 + X) and 12 (22 + Y) sperm.
Genetic switch. The Y chromosome carries the
SRY gene; its product triggers testis development
in the embryo. Absent SRY, the default developmental path
is female.
Sex ratio. Expected 1:1 male:female because the
two sperm classes are equally frequent. Actual birth ratios
run slightly male-skewed (∼ 1.05 boys per girl in most
populations) due to subtle differences in fetal survival,
not biased sperm production.
Contrast with other systems. The XX/XY pattern is
not universal: birds use ZW (females ZW, males ZZ – female
heterogametic), grasshoppers use XO (females XX, males X–),
and honeybees use haplodiploidy (females diploid, males
haploid). NCERT mentions these alongside XX/XY to show that
sex determination is mechanism-dependent.
Cultural footnote. Because the deciding chromosome
sits in the sperm, blaming a mother for the sex of her
children is biologically wrong; every conception has a 1/2
chance of either outcome regardless of the mother's
karyotype.
Why this matters. Because the father's sperm carries the
deciding chromosome, biology unambiguously places sex determination
on the male side. The misconception that "the mother is to blame"
for the sex of the child is not just culturally wrong – it is
biologically wrong.
Sex in humans = XX/XY; female 44 + XX, male 44 + XY;
father's sperm (X or Y) decides; SRY on Y triggers maleness; expected
1:1 ratio.
Q 4.12
A child has blood group O. If the father has blood group A and mother blood group B, work out the genotypes of the parents and the possible genotypes of the other offsprings.
Concept used. The ABO blood-group system in humans is
controlled by a single autosomal gene with three alleles:
IA – produces antigen A (dominant over i).
IB – produces antigen B (dominant over i).
i – produces no antigen (recessive to both IA and
IB).
A key point: IA and IB are co-dominant; when both
are present in a heterozygote (IA IB), both antigens A and
B are produced. The mapping of genotype to phenotype is therefore:
tabularc|c
Genotype & Blood group (phenotype) IA IA, IAi & A IB IB, IBi & B IA IB & AB ii & O
tabular
Use the child's phenotype to constrain the
parents. The child has blood group O, so the child's
genotype must be ii. That means the child received an
i allele from each parent.
Father (blood group A) gave an i. Father's
possible genotypes for blood group A are IA IA or
IAi. To pass an i to the child, father must be
IAi (heterozygous). IA IA is ruled out.
Mother (blood group B) gave an i. Mother's
possible genotypes for blood group B are IB IB or
IBi. Similarly she must be IBi. IB IB
is ruled out.
Set up the cross. IAi × IBi.
Punnett square.
arrayc|cc
& IB & i IA & IA IB & IAi i & IBi & ii
array
Read off offspring possibilities (each with
probability 1/4).
IA IB : blood group AB.
IAi : blood group A.
IBi : blood group B.
ii : blood group O.
Father is IA i (heterozygous A) and mother
is IB i (heterozygous B). Each future child has a
1/4 chance of being A (IAi), 1/4 of being B (IBi),
1/4 of being AB (IA IB), and 1/4 of being O (ii). All
four ABO blood groups can appear among the offspring of these
parents.
IS
Ishita Singh
M.Sc Biotechnology, AIIMS Delhi
Verified Expert
Strategic angle. The question is really a small puzzle.
Step backwards from the child's genotype (ii) to the alleles each
parent contributed, then deduce each parent's full genotype, then
cross.
Decode the child. Blood O ⇒ child is
ii. So father donated an i allele and mother donated an
i allele.
Decode the father. Father is blood A, so his
genotype has at least one IA. He also donated an i⇒ his genotype is IAi.
Decode the mother. Mother is blood B, so her
genotype has at least one IB. She also donated an i⇒ her genotype is IBi.
Cross.IAi × IBi produces four
equally likely genotypes:
IA IB : phenotype AB (probability 1/4).
IAi : phenotype A (probability 1/4).
IBi : phenotype B (probability 1/4).
ii : phenotype O (probability 1/4).
Surprising consequence. A child can have a blood
group (AB) that neither parent has. This is a textbook
consequence of co-dominance between IA and IB,
and it is also the reason the ABO system features so often
in disputed-paternity scenarios.
Why this matters. The ABO system is the simplest worked
example of multiple alleles and co-dominance
operating at one locus. It's also clinically essential: ABO
incompatibility is the most common cause of transfusion reactions.
Parents: father IAi, mother IBi. Offspring
possibilities (each 1/4): A (IAi), B (IBi), AB
(IA IB), O (ii).
Q 4.13
Explain the following terms with example:
(a) Co-dominance
(b) Incomplete dominance
Concept used. In Mendel's monohybrid cross, the
heterozygote shows the dominant phenotype exactly – the
recessive allele is masked. But not all alleles behave this neatly.
Two important departures are co-dominance and incomplete dominance.
Both lead to F1 phenotypes that differ from either parent.
(a) Co-dominance.
Definition. When two alleles in the
heterozygote both express their phenotype
independently and simultaneously, with neither
allele masking the other, the alleles are
co-dominant. The heterozygote shows
both parental phenotypes side by side.
Example: ABO blood groups in humans. The
IA and IB alleles are co-dominant. A
heterozygous IA IB individual produces
both the A antigen and the B antigen on red
blood cells – and so has blood group AB, which is
a phenotype distinct from either A or B alone.
Example: roan coat in cattle. A red bull
(RR, red hairs only) crossed with a white cow
(WW, white hairs only) gives F1 calves with a
roan coat – a mixture of red and white hairs
visible together on the same animal.
(b) Incomplete dominance.
Definition. When the heterozygote shows an
intermediate phenotype – a blend between the
two homozygous parental phenotypes – neither allele
is fully dominant; this is incomplete
dominance.
Example: snapdragon flower colour
(Antirrhinum majus). A red-flowered
homozygote (RR) crossed with a white-flowered
homozygote (rr) gives F1 heterozygotes (Rr)
with pink flowers – an intermediate colour.
On selfing, the F2 ratio is 1 Red (RR)
: 2 Pink (Rr) : 1 White (rr),
i.e. the phenotypic ratio matches the genotypic
ratio (because each genotype now has its own
distinguishable phenotype).
Mechanism. A single dose of the R allele
makes only enough red pigment to produce pink, not
fully red, so the heterozygote is intermediate.
[See diagram in the PDF version]
Co-dominance: both alleles express simultaneously and
distinctly in the heterozygote (ABO blood-group IA IB →
AB; roan cattle). Incomplete dominance: heterozygote shows an
intermediate phenotype (snapdragon Rr → pink; F2 ratio
1 red:2 pink:1 white).
TB
Tara Bhat
M.Sc Botany, Delhi University
Verified Expert
Structural angle. Co-dominance and incomplete dominance
both break the heterozygote-equals-dominant rule, but they do it in
different ways. Hold one image in your head for each:
Image for co-dominance – roan cattle. A red bull
× white cow gives a roan calf: red hairs and
white hairs both visible, mixed on the same coat. Neither
allele dominates the other; both express in their own
cells. Similarly, an IA IB person has both
antigens on red cells – that's AB blood group.
Image for incomplete dominance – snapdragon. A red
flower × white flower gives a pink F1. The
heterozygote is intermediate, not a mosaic. One
dose of the red allele makes half as much pigment, so the
flower looks pink, not red.
Tell them apart in a cross.
Co-dominance: F1 shows BOTH parental phenotypes
simultaneously (e.g. blood group AB).
Incomplete dominance: F1 shows a BLENDED
phenotype between the two parents (e.g. pink).
F2 ratios. For BOTH co-dominance and incomplete
dominance, the F2 phenotypic ratio is 1:2:1 (same as
the genotypic ratio), because every genotype now has its
own distinguishable phenotype. Contrast this with the
Mendelian 3:1 where heterozygotes look like dominant
homozygotes.
Biochemical reason for each. In incomplete
dominance, the dominant allele's protein is a rate-limiting
enzyme; one functional copy makes only half the product, so
the phenotype is intermediate (half-as-much red pigment =
pink). In co-dominance, the two alleles encode different
products that are BOTH made and BOTH visible (different
antigens on the same RBC, or different pigment in different
hair cells). The distinction sits in molecular biology, not
in Mendelian counting.
Spotting them on a Punnett square. Mendelian
dominance: F2 shows three phenotype classes with ratio
3:1. Incomplete dominance: F2 shows three classes with
ratio 1:2:1 – intermediate visible. Co-dominance: F2
shows three classes with ratio 1:2:1 – both parental
phenotypes plus their hybrid visible. The 1:2:1 phenotype
ratio is the give-away that one of the two non-Mendelian
rules is at work.
Why this matters. Both phenomena show that "dominance" is
a feature of how alleles' products interact in a cell, not a
fundamental property of the gene itself. Whether a heterozygote
looks dominant, blended or co-dominant depends on the biochemistry
downstream of the gene.
Co-dominance: heterozygote expresses BOTH alleles
distinctly (ABO blood group IA IB → AB; roan cattle).
Incomplete dominance: heterozygote shows an intermediate phenotype
(snapdragon Rr → pink; F2 ratio 1:2:1).
Q 4.14
What is point mutation? Give one example.
Concept used. A mutation is any heritable change
in the DNA sequence of an organism. Mutations come in many flavours
– chromosomal (large rearrangements), insertions/deletions, etc. A
point mutation is the smallest kind: a change in a
single base pair of the DNA, which usually translates into
the substitution of one nucleotide for another (and hence
potentially one amino acid for another in the protein).
Definition. A point mutation is the alteration of
a single nucleotide base in DNA. There are three kinds:
Substitution – one base replaces another
(A → G, T → C, etc.). When the new codon
still codes for the same amino acid, the
substitution is silent; when it codes
for a different amino acid the substitution is
missense; when it creates a stop codon
the substitution is nonsense.
Insertion – one extra base is added.
Deletion – one base is lost.
Insertions and deletions shift the reading frame downstream
– a frameshift mutation – usually with severe
consequences for the protein.
Example: Sickle-cell anaemia. A single point
substitution in the gene for the β-globin chain of
haemoglobin: the codon GAG (which codes for glutamic acid)
becomes GTG (which codes for valine) at the sixth codon
of the chain.
GAG (Glu) ⟶
GTG (Val)
The mutant haemoglobin (HbS) molecules polymerise into long
fibres when oxygen tension is low, deforming the red blood
cell from a round biconcave disc into a rigid sickle shape.
This sickling causes the symptoms of sickle-cell disease:
anaemia, vaso-occlusive pain, organ damage.
Why this is "one base, big effect". Replacing one
amino acid (out of ∼146 in β-globin) is enough
because the substituted residue sits on the surface of the
protein and creates a sticky hydrophobic patch that
promotes haemoglobin polymerisation. One nucleotide →
one amino acid → a multi-organ disease.
[See diagram in the PDF version]
A point mutation is a change in a single nucleotide base
in DNA (substitution, insertion or deletion of one base). Example:
sickle-cell anaemia – the substitution GAG → GTG at codon 6 of
the β-globin gene replaces glutamic acid with valine, making
haemoglobin polymerise and red cells sickle.
MD
Meera Desai
Ph.D Molecular Biology, NCBS Bangalore
Verified Expert
Quick reading. Two halves: define "point mutation" cleanly,
then give one fully worked example.
Definition. Point mutation = a change affecting a
single base pair in DNA. The three flavours are
substitution (most common), insertion of one base, and
deletion of one base. Substitutions are further classified
as silent, missense or nonsense, depending on the effect on
the protein.
Pick sickle-cell anaemia as the example. It's the
classic NCERT example and is genuinely a point mutation
(single base substitution).
State the molecular detail. On the β-globin
gene of chromosome 11, codon 6 changes from GAG (Glu) to
GTG (Val). On the protein, the sixth amino acid of the
β chain changes from glutamic acid to valine.
Trace the phenotypic consequence. The valine
creates a hydrophobic patch on the surface of haemoglobin.
Under low oxygen, deoxygenated HbS polymerises into fibres
that bend the red cell into a sickle shape; the rigid
cells block capillaries, hemolyse, and cause vaso-occlusive
crises and chronic anaemia.
Genotype to phenotype.HbA HbA = normal;
HbS HbS = sickle-cell anaemia (severe); HbA HbS =
sickle-cell trait (carriers, mostly asymptomatic; also
resistant to falciparum malaria).
Why this matters. Sickle-cell was the first molecular
disease – the first time a single-amino-acid change was traced from
DNA all the way to clinical pathology. It set the template for
"one gene, one mutation, one disease" thinking.
Point mutation = single-base-pair change in DNA.
Example: sickle-cell anaemia, GAG → GTG (Glu → Val) at codon
6 of β-globin, causing HbS polymerisation and red-cell
sickling.
Q 4.15
Who had proposed the chromosomal theory of inheritance?
Concept used. By the early 1900s, two strands of biology
needed to be unified: Mendel's abstract "factors" of inheritance
(rediscovered in 1900) and the visible behaviour of chromosomes
during meiosis (described in detail by cytologists in the
1880s–1890s). The chromosomal theory of inheritance
proposed that Mendel's factors are physically carried on the
chromosomes – and so the behaviour of chromosomes during meiosis
is the cellular basis of Mendel's laws.
The proposal (1902–1903). The chromosomal theory
of inheritance was independently proposed in 1902 by
Walter Sutton (American, working on grasshopper
chromosomes) and in 1902–1903 by Theodor Boveri
(German, working on sea-urchin embryos and the consequences
of chromosomal imbalance).
What the theory states.
Mendelian factors (genes) are located on
chromosomes.
Chromosomes occur in pairs in diploid cells, just
as Mendel's factors do.
During meiosis homologous chromosomes pair and
segregate to opposite poles – the cellular basis
of Mendel's law of segregation.
Different pairs of homologous chromosomes assort
independently of each other on the meiotic plate –
the cellular basis of Mendel's law of
independent assortment.
Experimental confirmation by Morgan. Sutton and
Boveri's proposal was a strong inference but not yet
experimentally proven. Thomas Hunt Morgan, working
on Drosophila (1910 onwards), provided the
experimental confirmation by demonstrating sex-linked
inheritance of the white-eye mutation (showing the gene
was on the X chromosome) and by discovering linkage and
recombination – which showed that genes are physically
located on chromosomes and inherited together when close.
The chromosomal theory of inheritance was
proposed by Walter Sutton and Theodor Boveri in
1902, and experimentally confirmed and extended by Thomas
Hunt Morgan using Drosophila.
AS
Ananya Sharma
M.Sc Botany, Delhi University
Verified Expert
Strategic angle. A one-name answer is half a mark short.
Two names + the year + Morgan's confirmation gives full marks.
Proposers. Walter Sutton and Theodor Boveri,
independently, in 1902.
Insight. Mendel's "factors" must reside on
chromosomes because chromosomes behave during meiosis
exactly like Mendel's factors behave during gamete
formation: paired in diploids, segregating to gametes,
and assorting independently across pairs.
Experimental backing. Morgan's Drosophila
work (linkage, recombination, sex linkage) supplied the
experimental confirmation a decade later.
Why both names matter. Sutton emphasised the
parallel between meiosis and Mendelian segregation; Boveri
emphasised the necessity of a complete chromosome set for
normal development (sea-urchin work). Together they made
the case airtight; the proposal is fairly called the
Sutton–Boveri chromosomal theory of inheritance.
Why this matters. This theory bridged the gap between
classical genetics (counting offspring ratios) and cytology (looking
at chromosomes under a microscope). Once chromosomes carried genes,
genetics had a physical substrate – and the road to DNA, half a
century later, was open.
Walter Sutton and Theodor Boveri (1902); experimentally
confirmed by T.H. Morgan via his Drosophila studies on
linkage and sex-linked inheritance.
Q 4.16
Mention any two autosomal genetic disorders with their symptoms.
Concept used. An autosomal genetic disorder is
one whose causative gene sits on one of the 22 autosomes (not on
the X or Y chromosome). Autosomal disorders affect males and
females equally. They are further classified as autosomal
recessive (require both copies mutant, aa) or autosomal
dominant (a single mutant copy, Aa, is enough).
We pick the two NCERT examples discussed in the chapter:
Sickle-cell anaemia (autosomal recessive) and
Phenylketonuria, PKU (autosomal recessive). Down's syndrome
is excluded here because it is chromosomal (trisomy 21), not a
single-gene disorder.
(i) Sickle-cell anaemia.
Inheritance: autosomal recessive.
Causative gene on chromosome 11
(β-globin gene). Affected genotype
HbS HbS; carriers (HbA HbS) have sickle-cell
trait, are usually asymptomatic and are resistant
to falciparum malaria.
Molecular cause: point mutation
GAG → GTG at codon 6 of
β-globin, changing glutamic acid to valine.
Mutant haemoglobin (HbS) polymerises under low
oxygen.
Symptoms:
itemize
Chronic haemolytic anaemia (fatigue,
pallor, breathlessness on exertion).
Sickling of red blood cells into rigid
crescent shapes, especially when oxygen
tension is low.
Vaso-occlusive crises: blockage of small
blood vessels causing severe pain in the
chest, abdomen, joints and bones.
Spleen damage, recurrent infections,
delayed growth in children, stroke risk
and organ damage (kidneys, lungs).
itemize
(ii) Phenylketonuria (PKU).
Inheritance: autosomal recessive.
Causative gene on chromosome 12 (gene for the
enzyme phenylalanine hydroxylase).
Molecular cause: mutation in the
phenylalanine hydroxylase gene; the enzyme is
absent or inactive, so dietary phenylalanine
cannot be converted to tyrosine. Phenylalanine
accumulates in body fluids and is converted to
phenylpyruvic acid and other toxic derivatives.
Symptoms:
itemize
Severe, progressive intellectual disability
(mental retardation) developing in
untreated infants.
Accumulation of phenylalanine and its
derivatives in the blood, causing brain
damage.
Excretion of phenylpyruvic acid and other
phenyl derivatives in urine (gives a
characteristic musty odour).
Reduced melanin pigmentation: paler skin,
lighter hair, blue eyes.
Seizures and behavioural problems if
untreated.
Management: early diagnosis (neonatal
screening) followed by a strict low-phenylalanine
diet prevents most symptoms – a striking case
where a genetic disease is managed by diet.
itemize
Two autosomal genetic disorders:
(1) Sickle-cell anaemia (autosomal recessive; single base
substitution Glu → Val at codon 6 of β-globin): chronic
haemolytic anaemia, sickling of RBCs, vaso-occlusive pain crises,
splenic dysfunction.
(2) Phenylketonuria (autosomal recessive; deficiency of
phenylalanine hydroxylase): build-up of phenylalanine, severe
intellectual disability, light pigmentation, musty-smelling urine.
IG
Ishaan Gupta
M.Sc Biotechnology, AIIMS Delhi
Verified Expert
Strategic angle. Two clean autosomal examples, each with a
crisp molecular cause and a clinical phenotype paragraph. Don't pad
with extras – quality of two beats a poorly-described five.
Example 1 – Sickle-cell anaemia.
Inheritance: autosomal recessive (chromosome 11).
Molecular lesion: GAG → GTG point mutation at
codon 6 of β-globin; Glu → Val.
Pathophysiology: HbS polymerises under low O2;
red cells deform into rigid sickles; cells lyse
and block capillaries.
Management: low-phenylalanine diet from birth
prevents symptoms – a rare example of a managed
inborn error of metabolism.
Why this matters. Both examples illustrate how a single
gene defect on an autosome produces a definite disease pattern that
is independent of the patient's sex, and both have well-defined
molecular mechanisms – a far cry from the symptomatic guesswork of
pre-genetic medicine.
Principles of Inheritance and Variation Class 12 Biology NCERT Solutions FAQs
Ques. Where can I download Principles of Inheritance and Variation Class 12 Biology NCERT Solutions PDF?
Ans. You can download the Principles of Inheritance and Variation Class 12 Biology NCERT Solutions PDF directly from this page. Both the Normal and HD versions are available, and both are free.
Ques. Are these NCERT Solutions aligned with the 2026-27 syllabus?
Ans. Yes. This page reflects the current 2026-27 syllabus for Class 12 Biology. NCERT retained Chapter 4 fully in the new edition, including Mendel's laws, sex determination, pedigree analysis, Mendelian and chromosomal disorders, and the section on linkage and recombination.
Ques. How many exercise questions are in Class 12 Biology Chapter 4?
Ans. The Chapter 4 exercise has 11 numbered questions in the 2026-27 NCERT, spread across Mendel's laws, codominance, sex determination, pedigree analysis, Mendelian disorders, chromosomal disorders, and linkage. Every question is solved in the PDF on this page.
Ques. How many pages is the Class 12th Biology Principles of Inheritance and Variation NCERT Solutions PDF?
Ans. The NCERT Solutions PDF runs approximately 32 pages and covers all 11 exercise questions, with two solved walk-throughs (one pedigree, one dihybrid Punnett square), 6 Punnett diagrams, and 3 pedigree figures.
Ques. What is the difference between Mendelian disorders and chromosomal disorders for the CBSE Class 12 Biology exam?
Ans. Mendelian disorders such as sickle-cell anaemia, thalassaemia, phenylketonuria, and haemophilia are caused by a mutation in a single gene and follow Mendel's laws of inheritance. Chromosomal disorders such as Down syndrome (trisomy 21), Klinefelter (47 XXY), and Turner (45 XO) arise from an extra or missing whole chromosome. The PDF includes a side-by-side comparison table for both.
Ques. How does the NCERT Solutions PDF help with NEET preparation for this chapter?
Ans. Every long-form Solution is followed by an Expert's Solution that compresses the answer into the NEET MCQ recall form. NEET sets 4 to 6 Chapter 4 questions every shift, mostly on Mendel's laws, codominance, Mendelian disorders, and karyotype identification, all of which are drilled in the PDF.
Ques. Is the linkage and recombination section in the 2026-27 NCERT syllabus?
Ans. Yes. The 2026-27 NCERT retains the section on linkage and recombination, including Morgan's Drosophila experiments and the concept of recombination frequency. Both CBSE and NEET continue to test this section.
Ques. How should I draw a pedigree for a CBSE Class 12 Biology answer?
Ans. Use the standard ICMR convention: a square for a male, a circle for a female, full shading for an affected individual, half shading for a carrier, and a horizontal line between parents with vertical lines to children numbered left to right. The PDF carries three fully labelled pedigree examples for haemophilia, sickle-cell, and PKU.


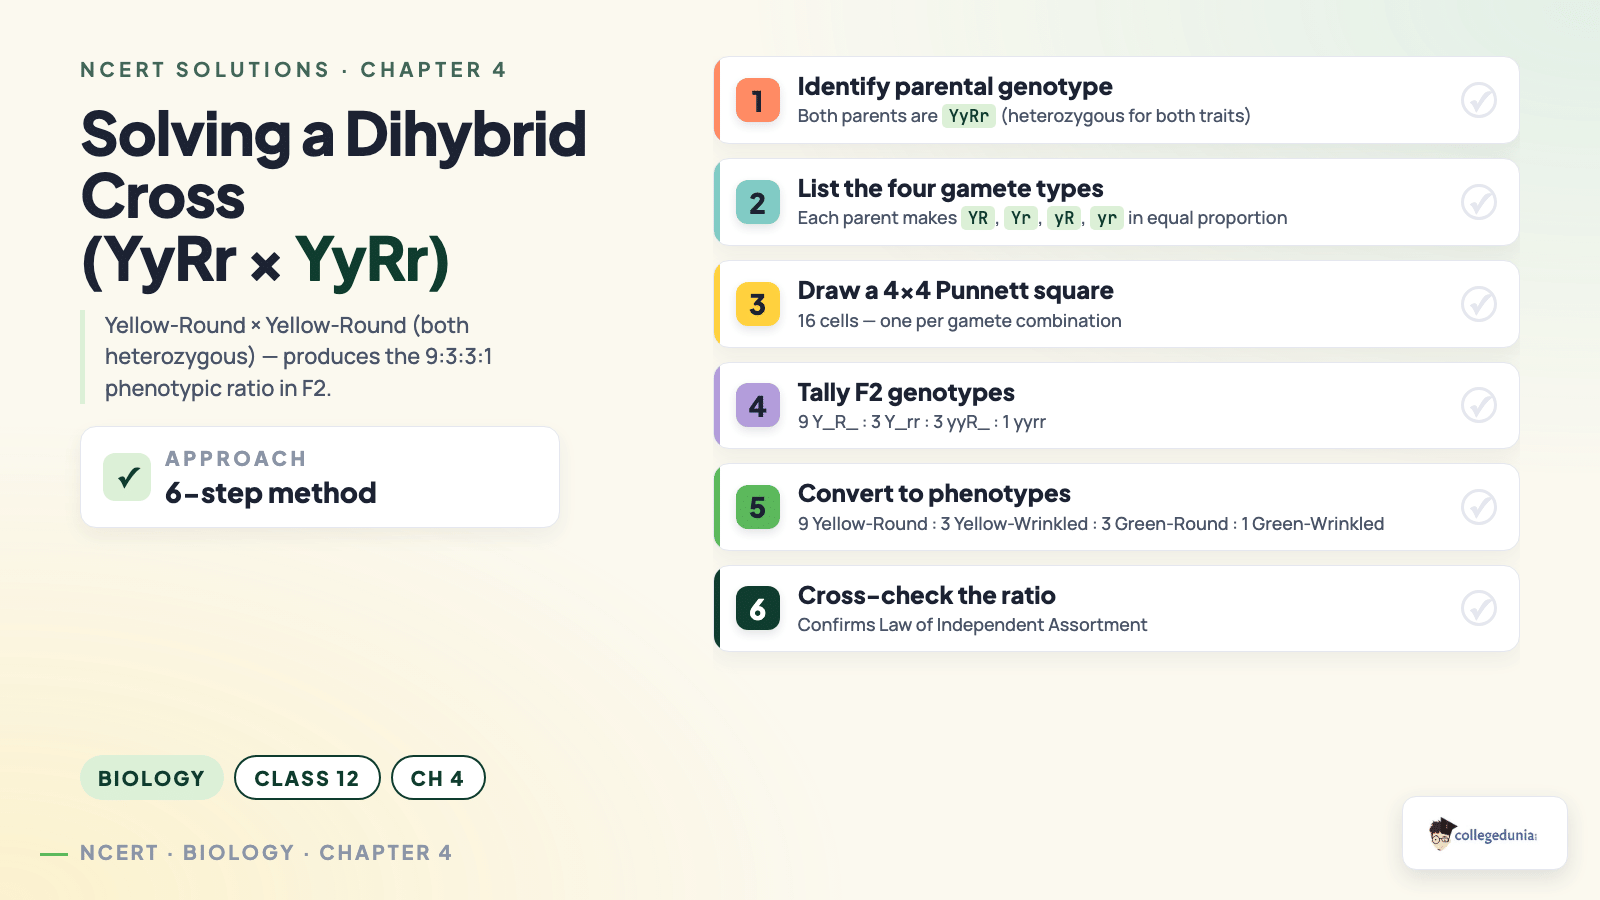
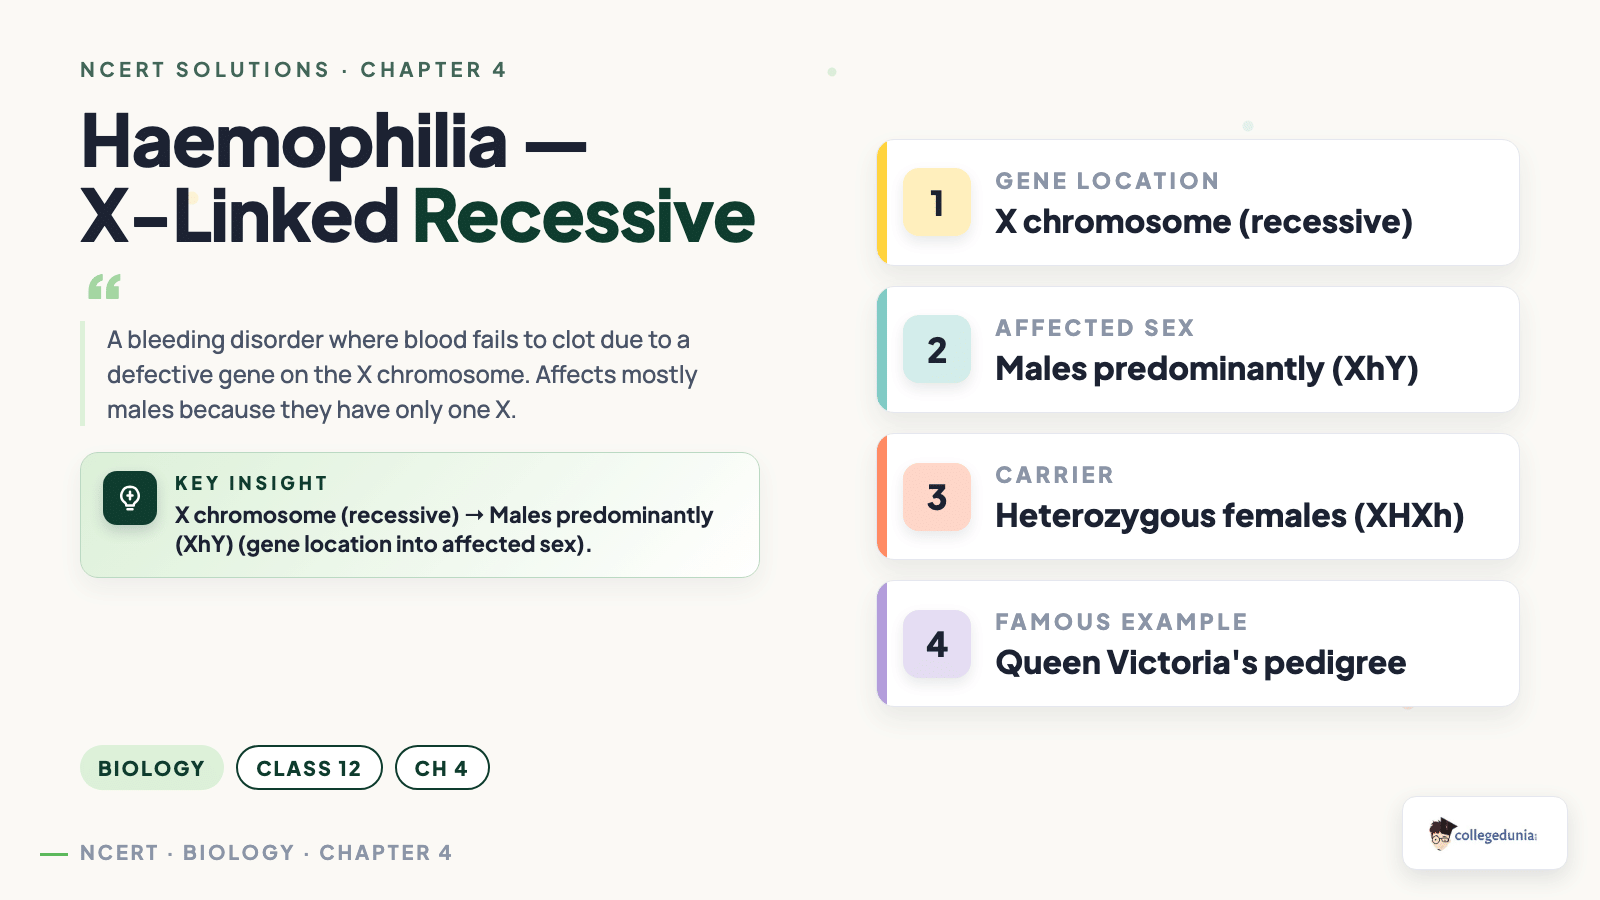


Comments