




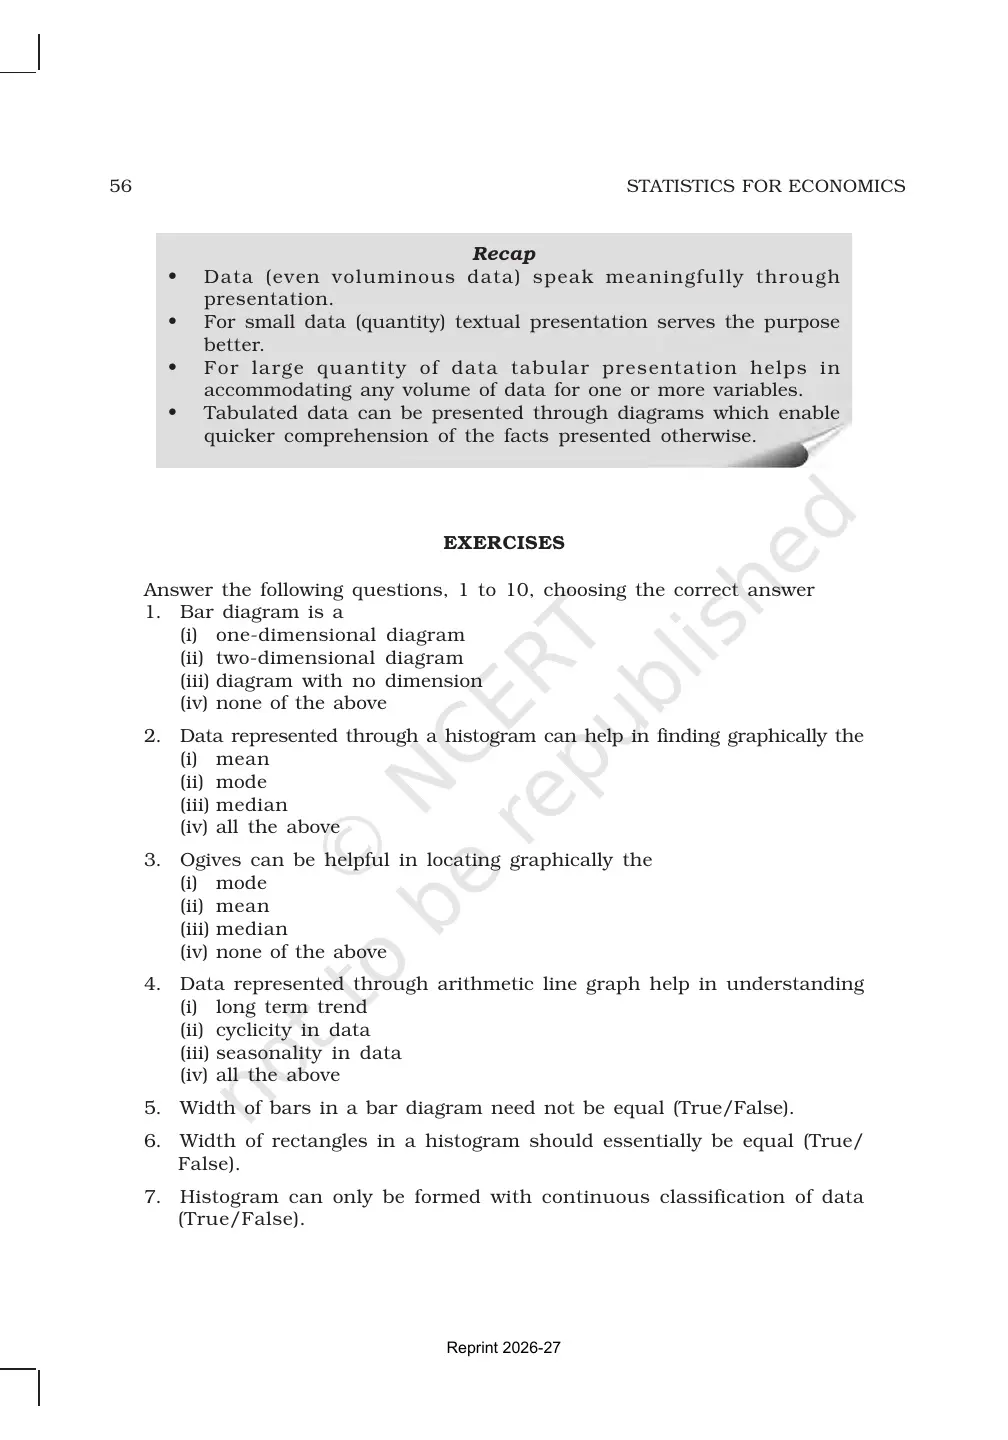
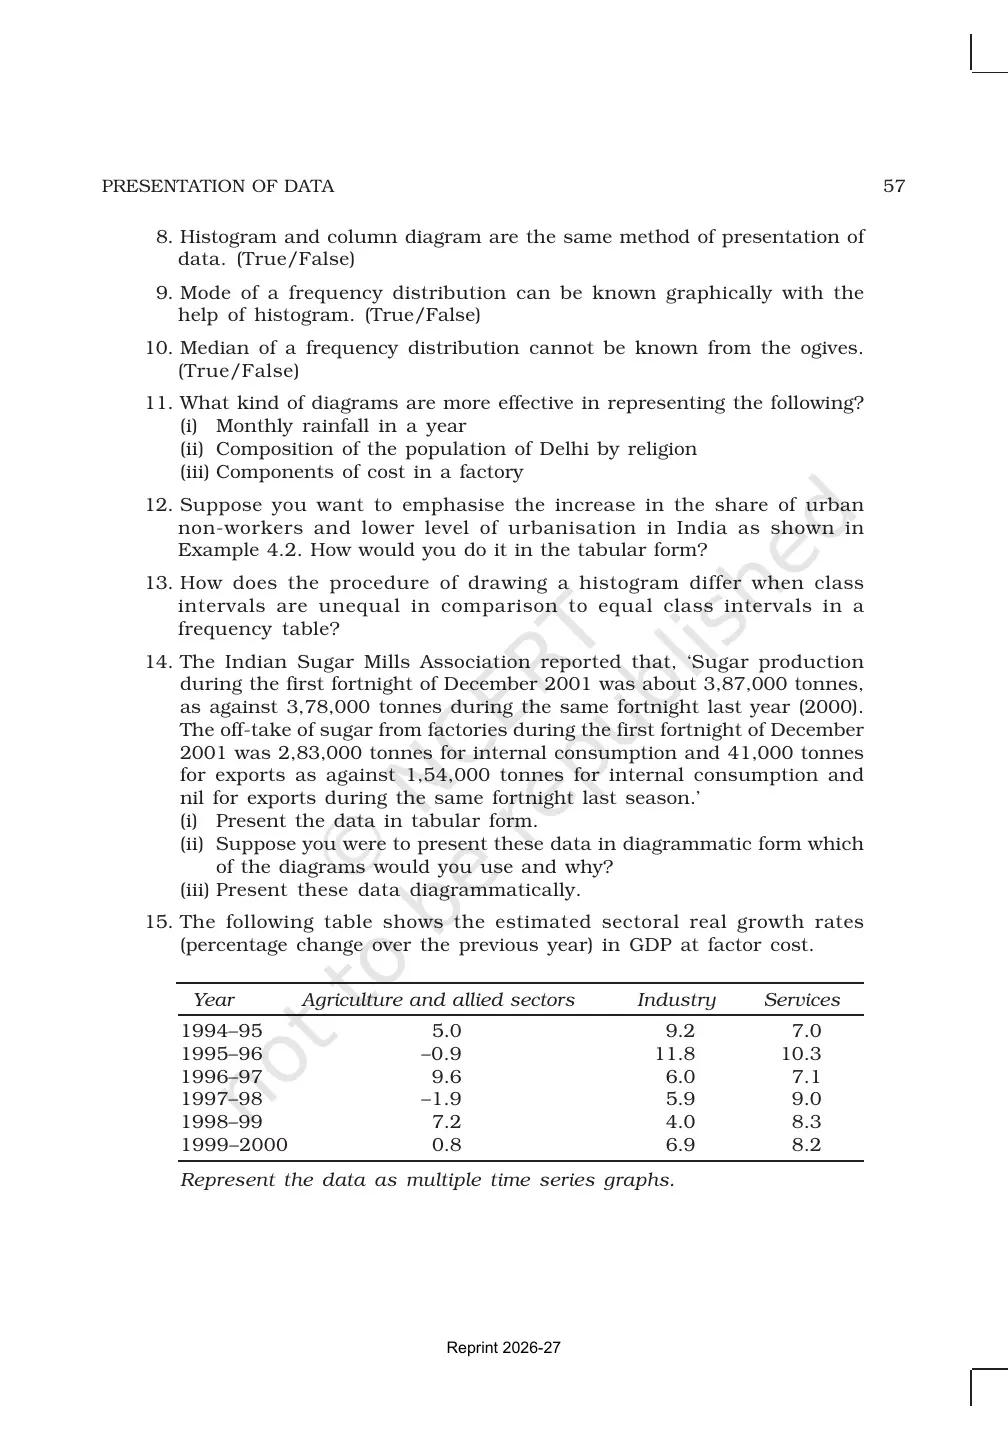
The NCERT Class 11 Economics Chapter 4 Presentation of Data Book PDF gives students the official Statistics for Economics chapter for the 2026-27 syllabus. Use it to read NCERT's explanation of tables, bar diagrams, pie diagrams and the correct way to present collected data.
- Book section: official NCERT chapter text, examples, diagrams and exercise questions.
- Best use: read the PDF before practising diagram-based questions.
- Revision cue: every diagram needs a title, scale, labels and source.
Student Feedback: In a Collegedunia check of 11,920 Class 11 Economics students, most errors in this chapter came from missing scale, unclear labels or choosing the wrong diagram type.
|
Table of Contents
Show more |
Presentation of Data Class 11 Economics NCERT Book PDF: What It Covers
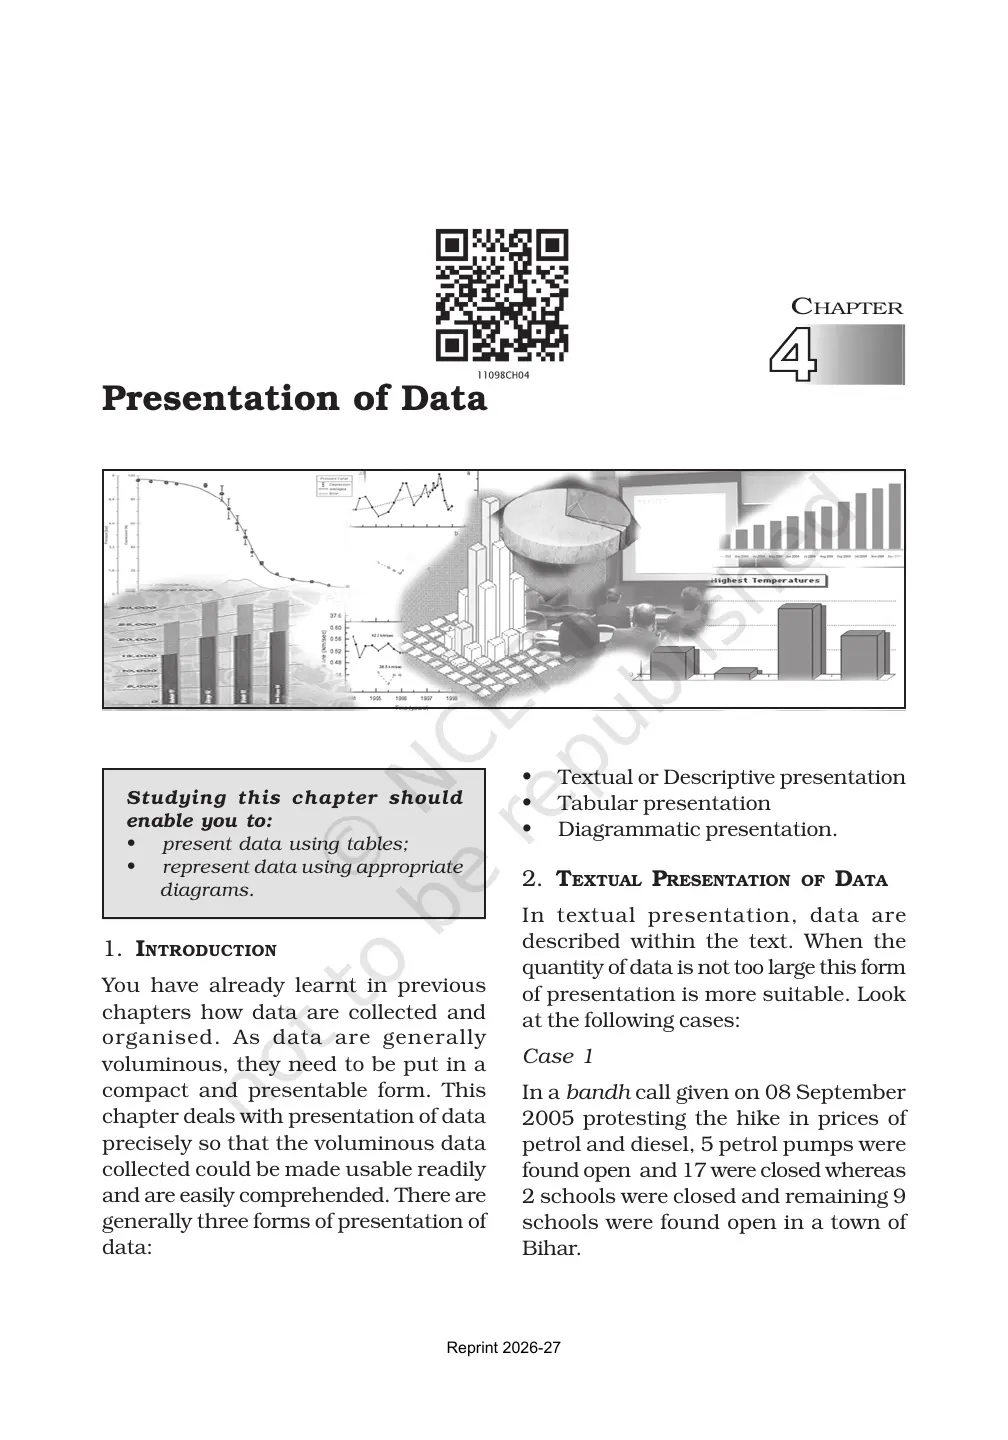
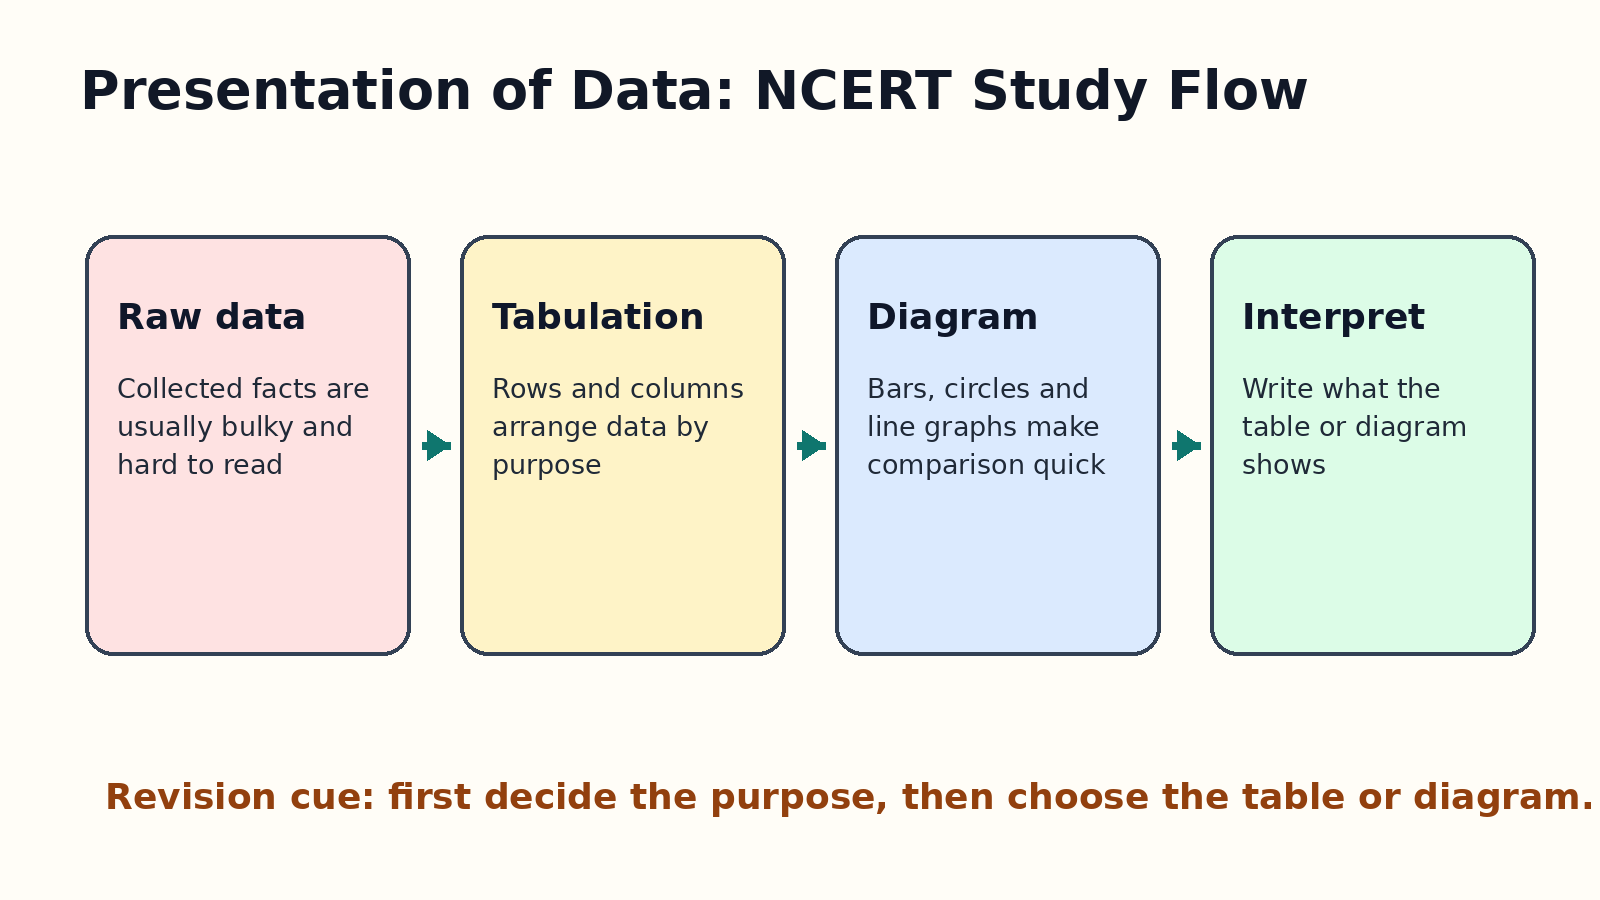
The chapter explains why collected data must be arranged in a compact and readable form. NCERT shows that raw information becomes useful only when it is organised into tables and diagrams that make comparison easy.
The PDF is the source text for Chapter 4. It gives the learning outcomes, chapter explanation, solved-style examples, diagram rules and exercise questions in the same order as the official book.
| NCERT area | What students should notice | Answer cue |
|---|---|---|
| Tabular presentation | Data is arranged in rows and columns with clear headings. | Mention title, caption, stub and source. |
| Diagrammatic presentation | Bar diagrams, pie diagrams and line graphs show comparison visually. | Choose the diagram according to the data type. |
| Accuracy and neatness | Scale, labels and units decide whether a diagram can be read correctly. | Write all parts before interpreting the result. |
Tables and Tabulation in Presentation of Data
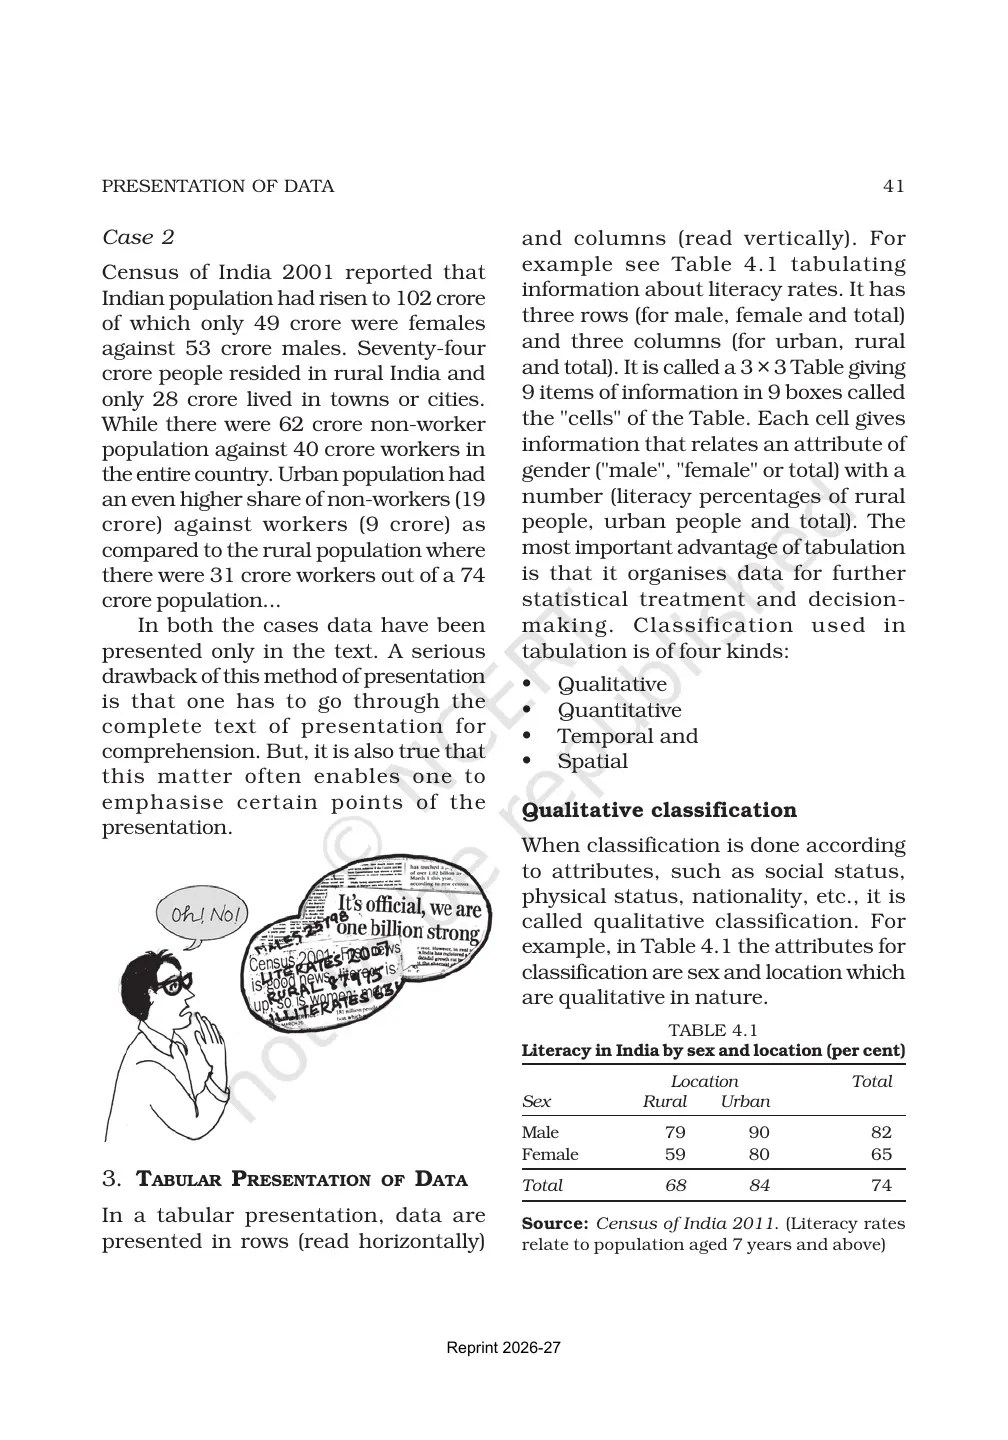
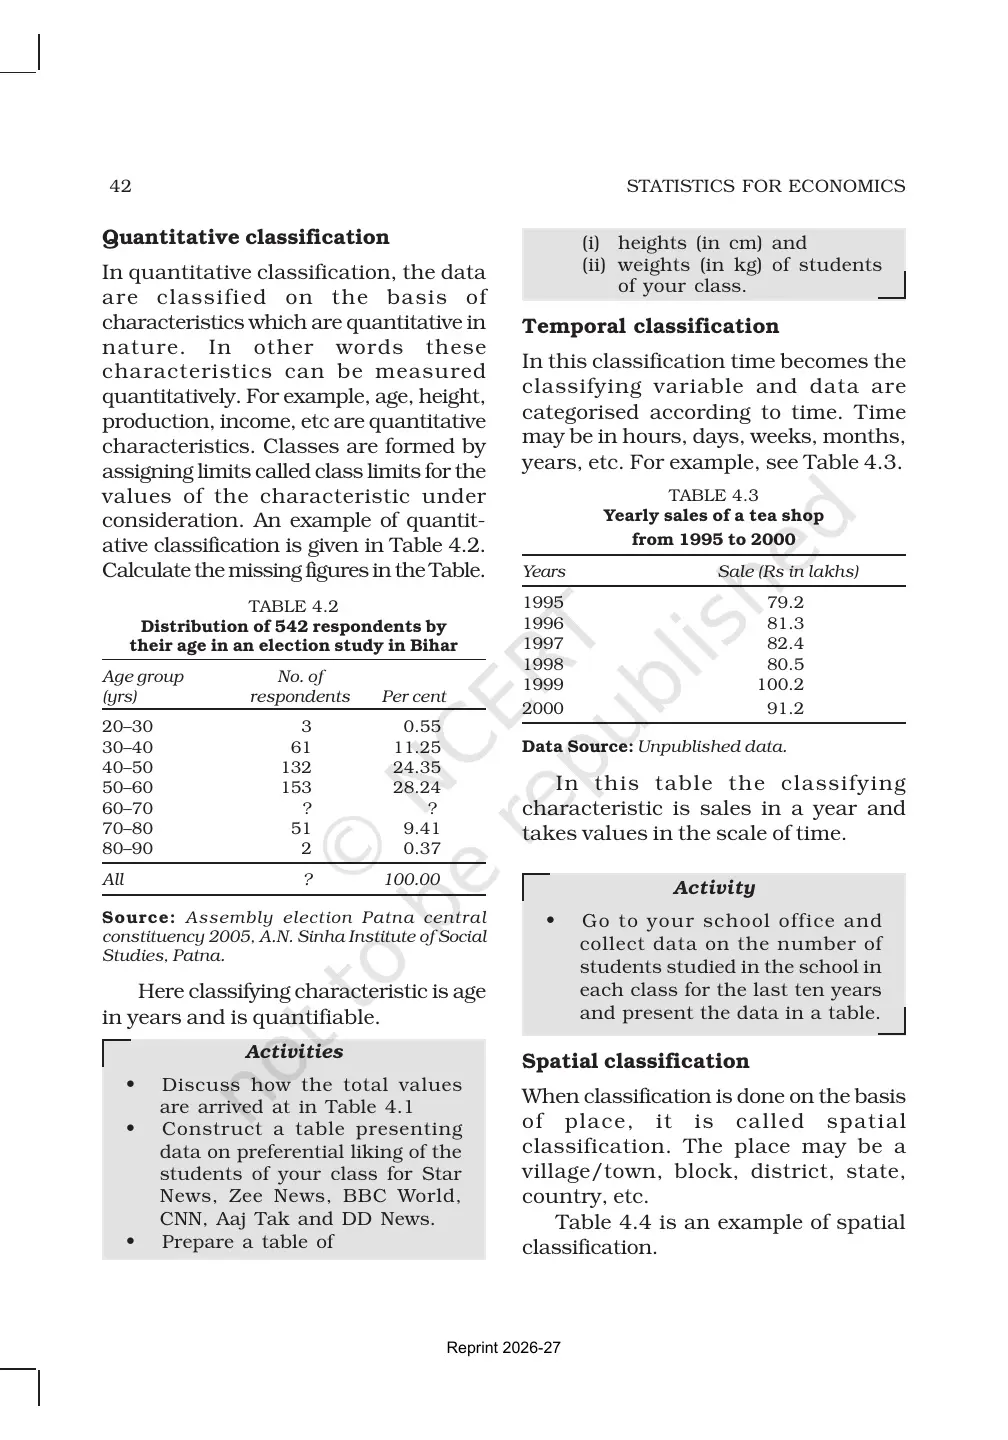
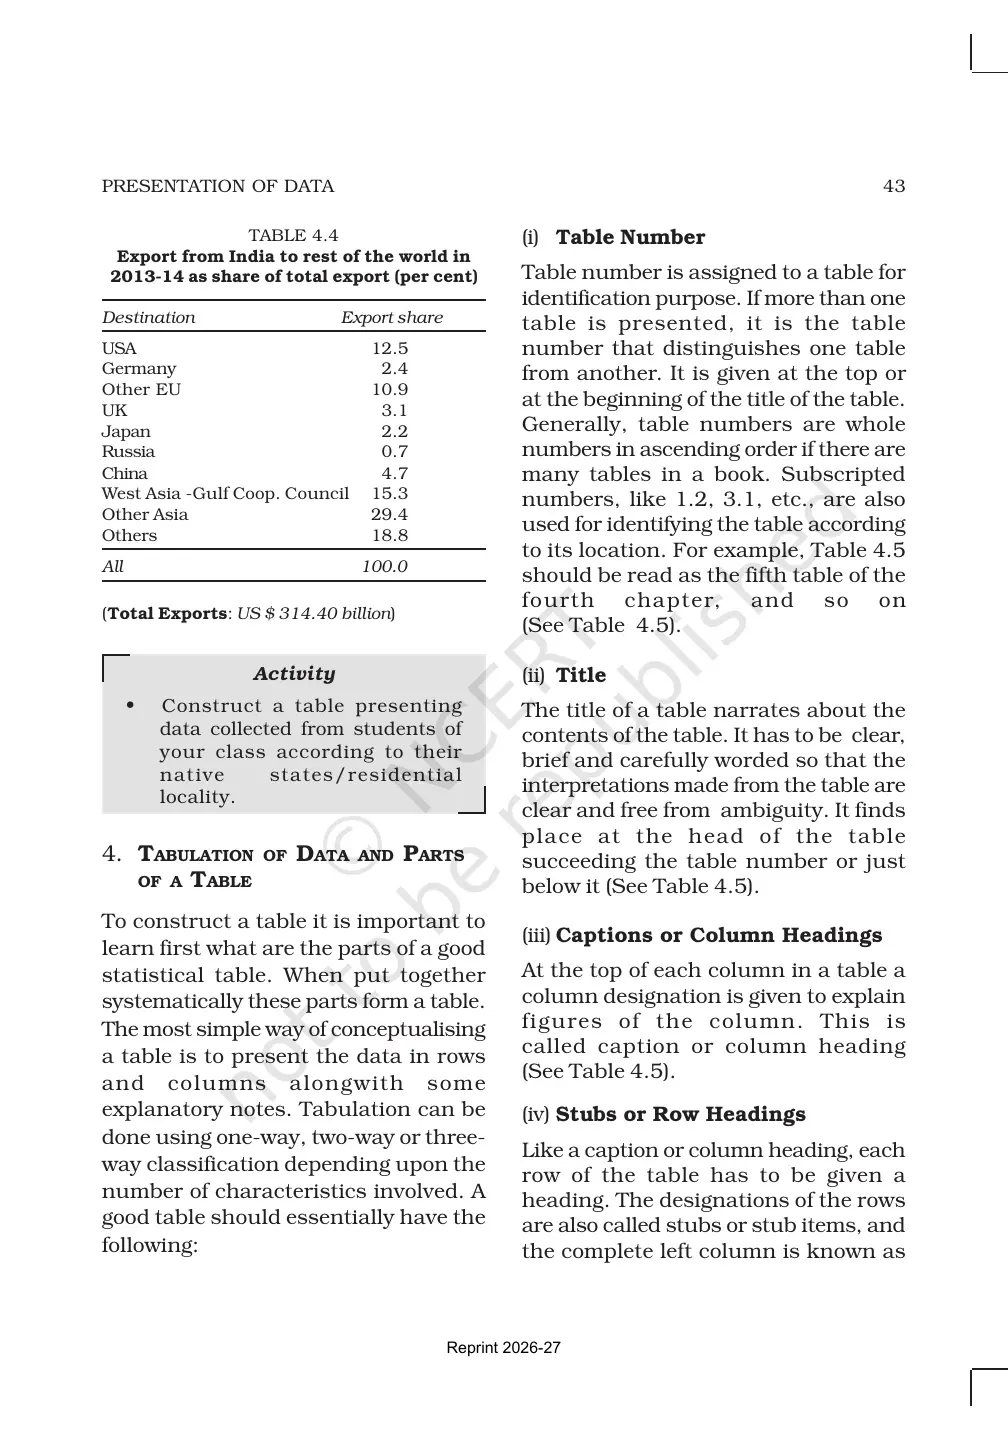
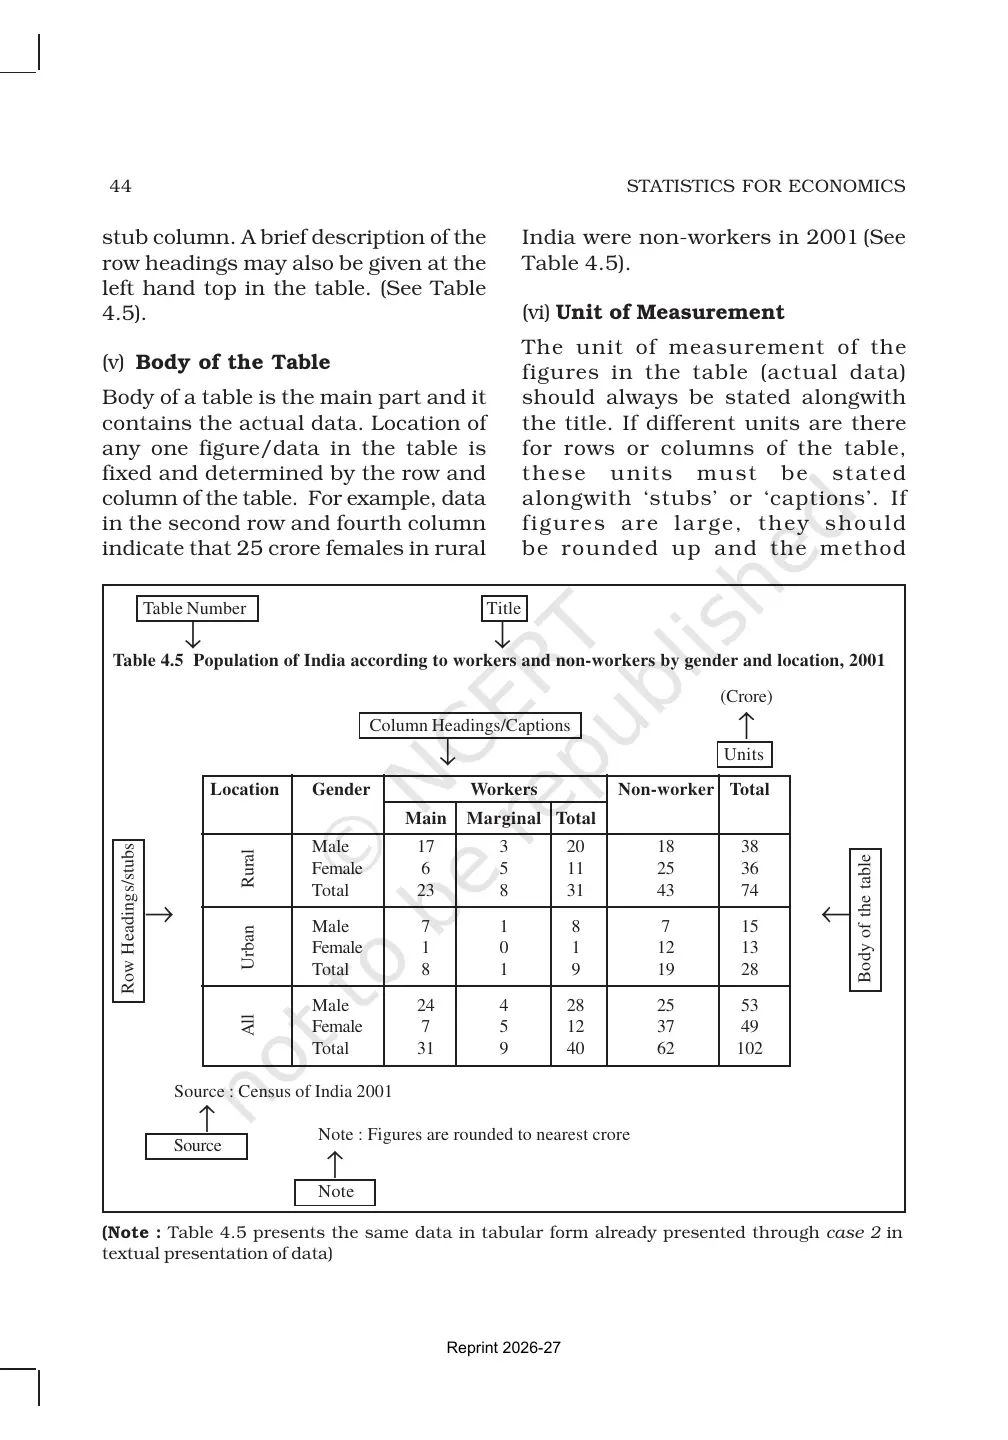
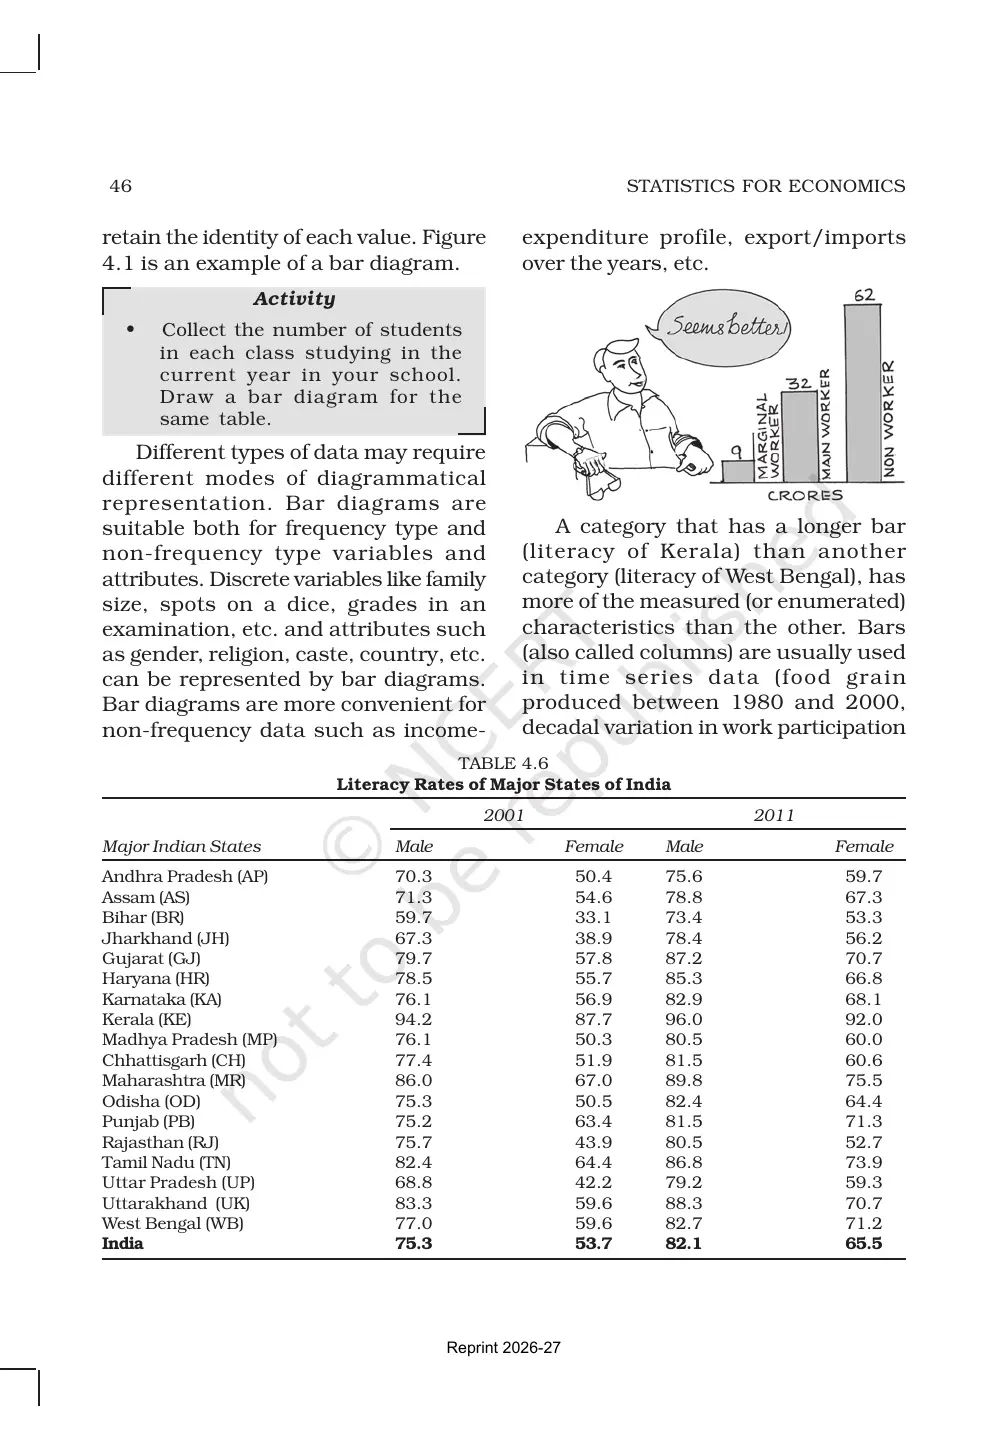
Tabulation is the first step in clear presentation. A table reduces bulky data into a readable arrangement. A good table has a title, row headings, column headings, body entries, units, source and footnotes wherever needed.
- Title: tells what the table is about.
- Caption: gives column headings at the top.
- Stub: gives row headings on the left side.
- Source: states where the data came from.
Read the examples carefully because NCERT expects students to identify table parts as well as interpret the data.
Watch Presentation of Data for Class 11 Economics
Source: Magnet Brains on YouTube
Bar Diagrams, Pie Diagrams and Line Graphs
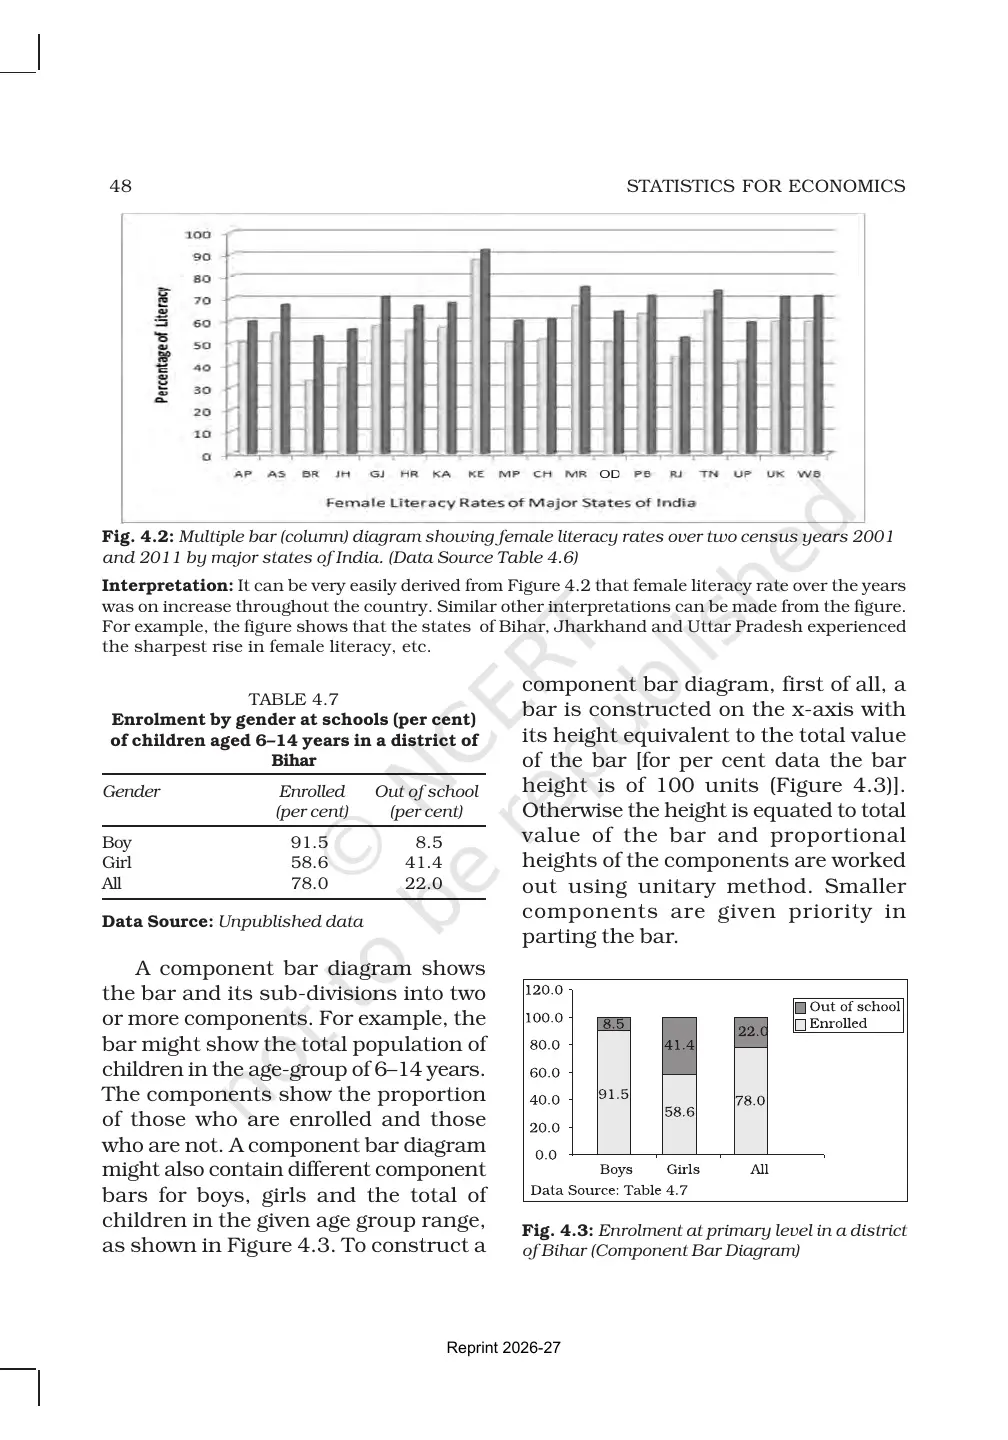
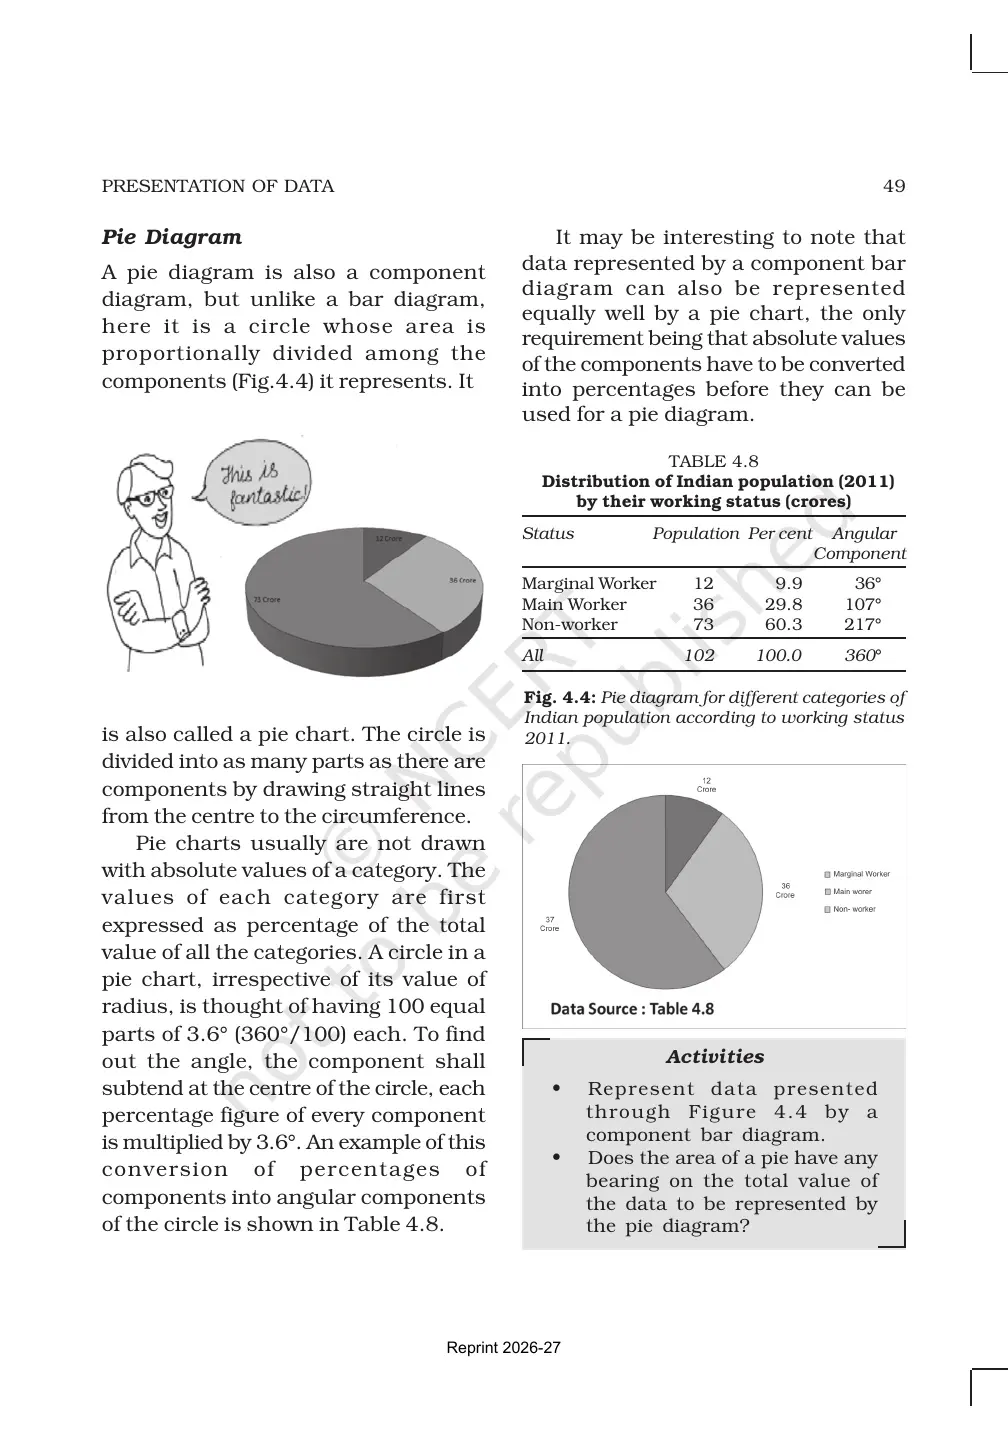
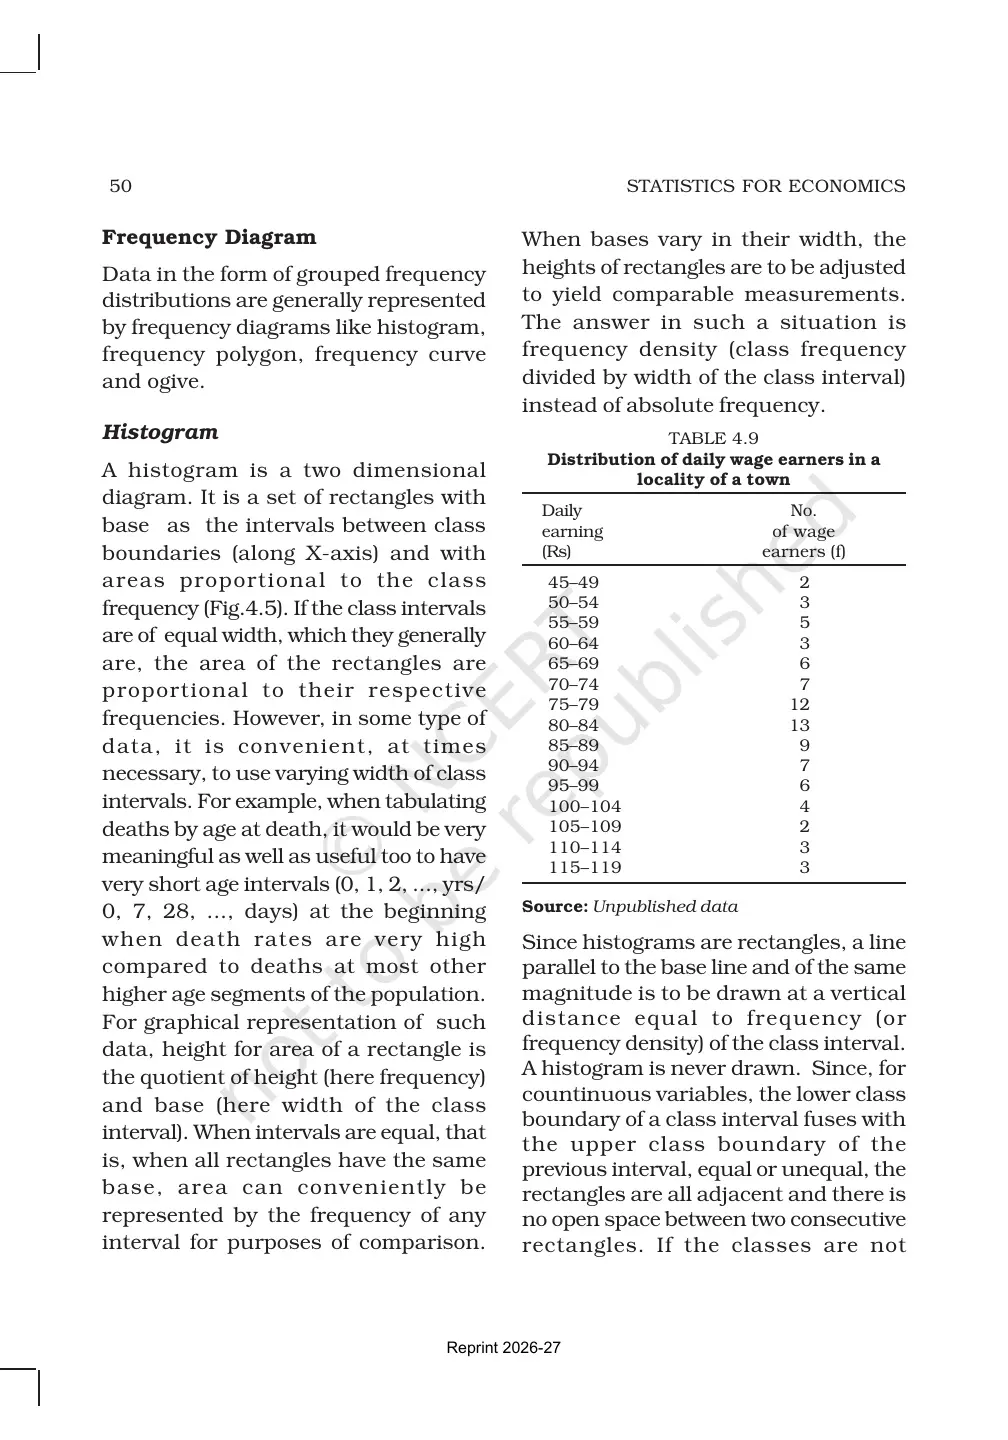
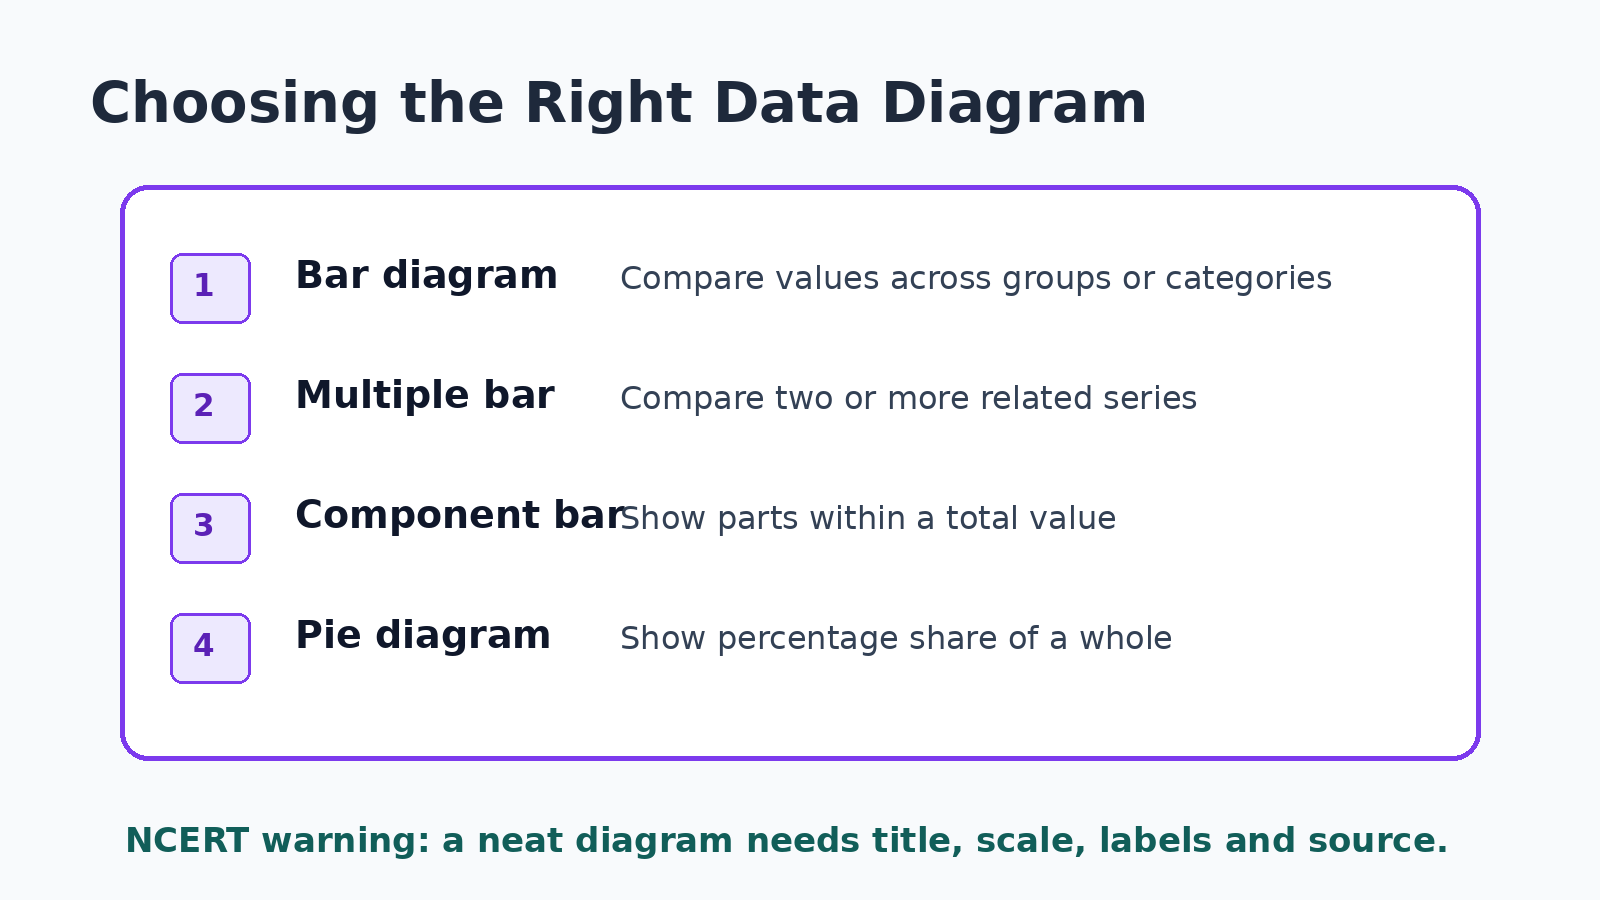
NCERT explains that diagrams make data easier to compare. A bar diagram is useful for category-wise comparison, a multiple bar diagram compares related series, and a component bar diagram shows the parts of a total. Pie diagrams show shares of a whole, while line graphs are useful when values change over time.
| Diagram type | Use it when | Common exam check |
|---|---|---|
| Simple bar diagram | One variable is compared across categories. | Bars must have equal width and equal spacing. |
| Multiple bar diagram | Two or more related series must be compared. | Use a legend for each series. |
| Component bar diagram | A total has to be split into parts. | All component values should add to the total. |
| Pie diagram | Shares of a whole are shown as sectors. | Convert values into angles or percentages correctly. |
A diagram is not complete without a title and scale. Students should also write the source when the data is taken from a table, survey or official report.
How to Use the Chapter 4 NCERT Book PDF
Use the book PDF in three passes. First, read the learning goals and identify the difference between table and diagram. Second, revise the parts of a table. Third, practise each diagram type with scale, labels and source.
- For short answers: define tabulation, caption, stub, title and source clearly.
- For diagram questions: decide whether the data needs bars, components, a pie chart or a line graph.
- For interpretation: write the highest value, lowest value, trend and comparison in words.
- For revision: compare the book PDF with notes after completing one diagram from the exercise.
Related Class 11 Economics Resources for Presentation of Data
Also Check: use the official book PDF with notes and practice resources for the same chapter.
| Resource | Best use | Link |
|---|---|---|
| NCERT Notes | Revise tables and diagrams quickly. | Presentation of Data Notes |
| NCERT Solutions | Practise textbook questions after reading the PDF. | Presentation of Data NCERT Solutions |
| Handwritten Notes | Use for quick visual revision before class tests. | Presentation of Data Handwritten Notes |
Class 11 Economics NCERT Book PDFs for All Chapters
The table below keeps all Class 11 Economics NCERT Book PDF chapters in one place. Chapters 1 to 8 come from Statistics for Economics, and Chapters 9 to 16 come from Indian Economic Development.
| Chapter | Title | NCERT Book PDF |
|---|---|---|
| Chapter 1 | Introduction | NCERT Book PDF |
| Chapter 2 | Collection of Data | NCERT Book PDF |
| Chapter 3 | Organisation of Data | NCERT Book PDF |
| Chapter 4 | Presentation of Data | Current NCERT Book PDF |
| Chapter 5 | Measures of Central Tendency | NCERT Book PDF |
| Chapter 6 | Correlation | NCERT Book PDF |
| Chapter 7 | Index Numbers | NCERT Book PDF |
| Chapter 8 | Use of Statistical Tools | NCERT Book PDF |
| Chapter 9 | Indian Economy on the Eve of Independence | NCERT Book PDF |
| Chapter 10 | Indian Economy 1950-1990 | NCERT Book PDF |
| Chapter 11 | Liberalisation, Privatisation and Globalisation: An Appraisal | NCERT Book PDF |
| Chapter 12 | Human Capital Formation in India | NCERT Book PDF |
| Chapter 13 | Rural Development | NCERT Book PDF |
| Chapter 14 | Employment: Growth, Informalisation and Other Issues | NCERT Book PDF |
| Chapter 15 | Environment and Sustainable Development | NCERT Book PDF |
| Chapter 16 | Comparative Development Experiences of India and Its Neighbours | NCERT Book PDF |
Presentation of Data Class 11 Economics NCERT Book PDF FAQs
Ques. What does the Class 11 Economics Chapter 4 Presentation of Data NCERT Book PDF include?
Ans. It includes the official NCERT chapter text, examples, diagrams and exercise questions from Statistics for Economics.
Ques. Which book does this Presentation of Data chapter belong to?
Ans. It belongs to the Class 11 Statistics for Economics NCERT textbook. The chapter explains tables and diagrammatic presentation.
Ques. Is this NCERT Book PDF useful for the 2026-27 syllabus?
Ans. Yes. The PDF is from the official NCERT reprint for 2026-27 and should be used as the source chapter before notes or solutions.
Ques. What should students revise first from this chapter?
Ans. Students should revise the parts of a table, rules of tabulation, bar diagrams, component bars, pie diagrams, line graphs and source notes.



Comments