




The class 11 maths notes chapter 13 statistics bring together every measure of dispersion that the CBSE Boards, JEE Main, JEE Advanced, and CUET actually test in 2026-27. These revision notes explain range, mean deviation, variance, standard deviation, and the coefficient of variation in plain language, with a full formula table for quick recall.
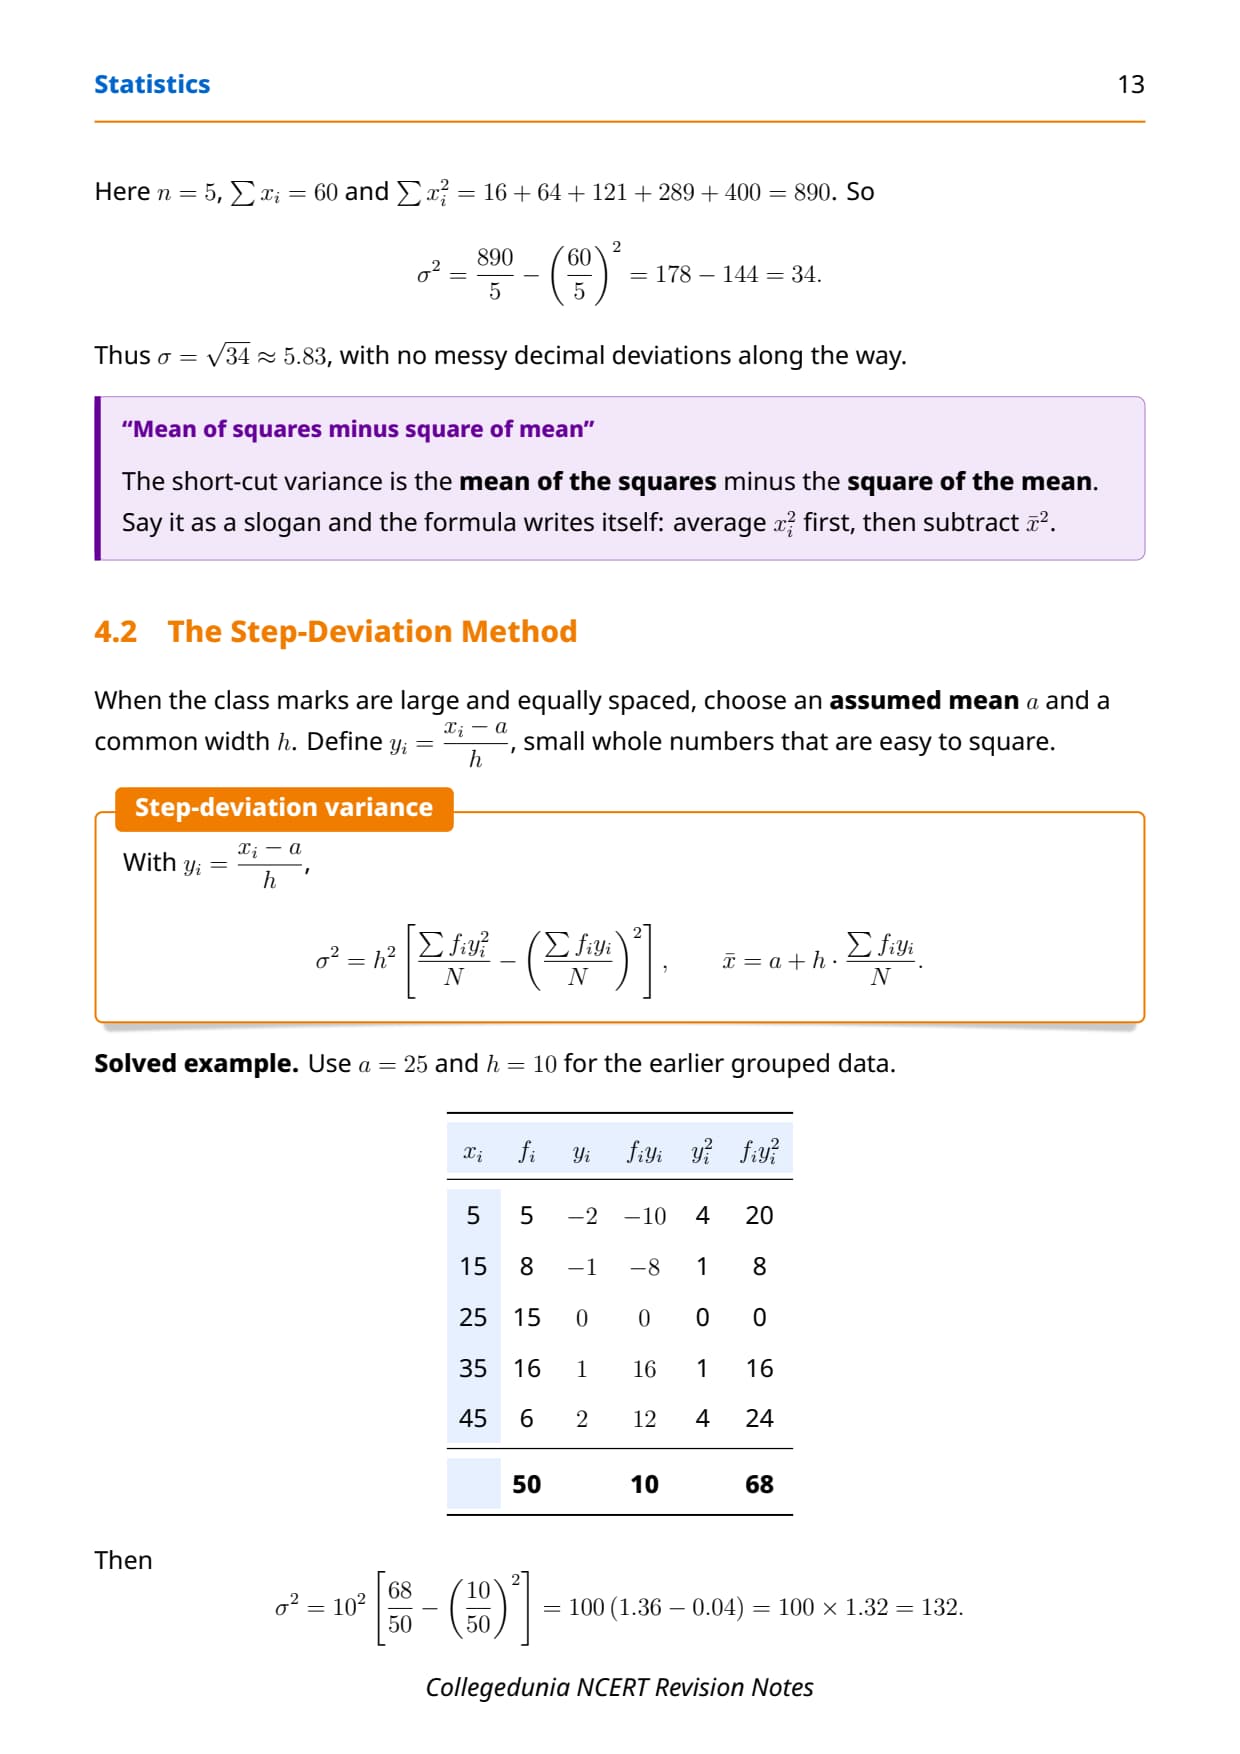
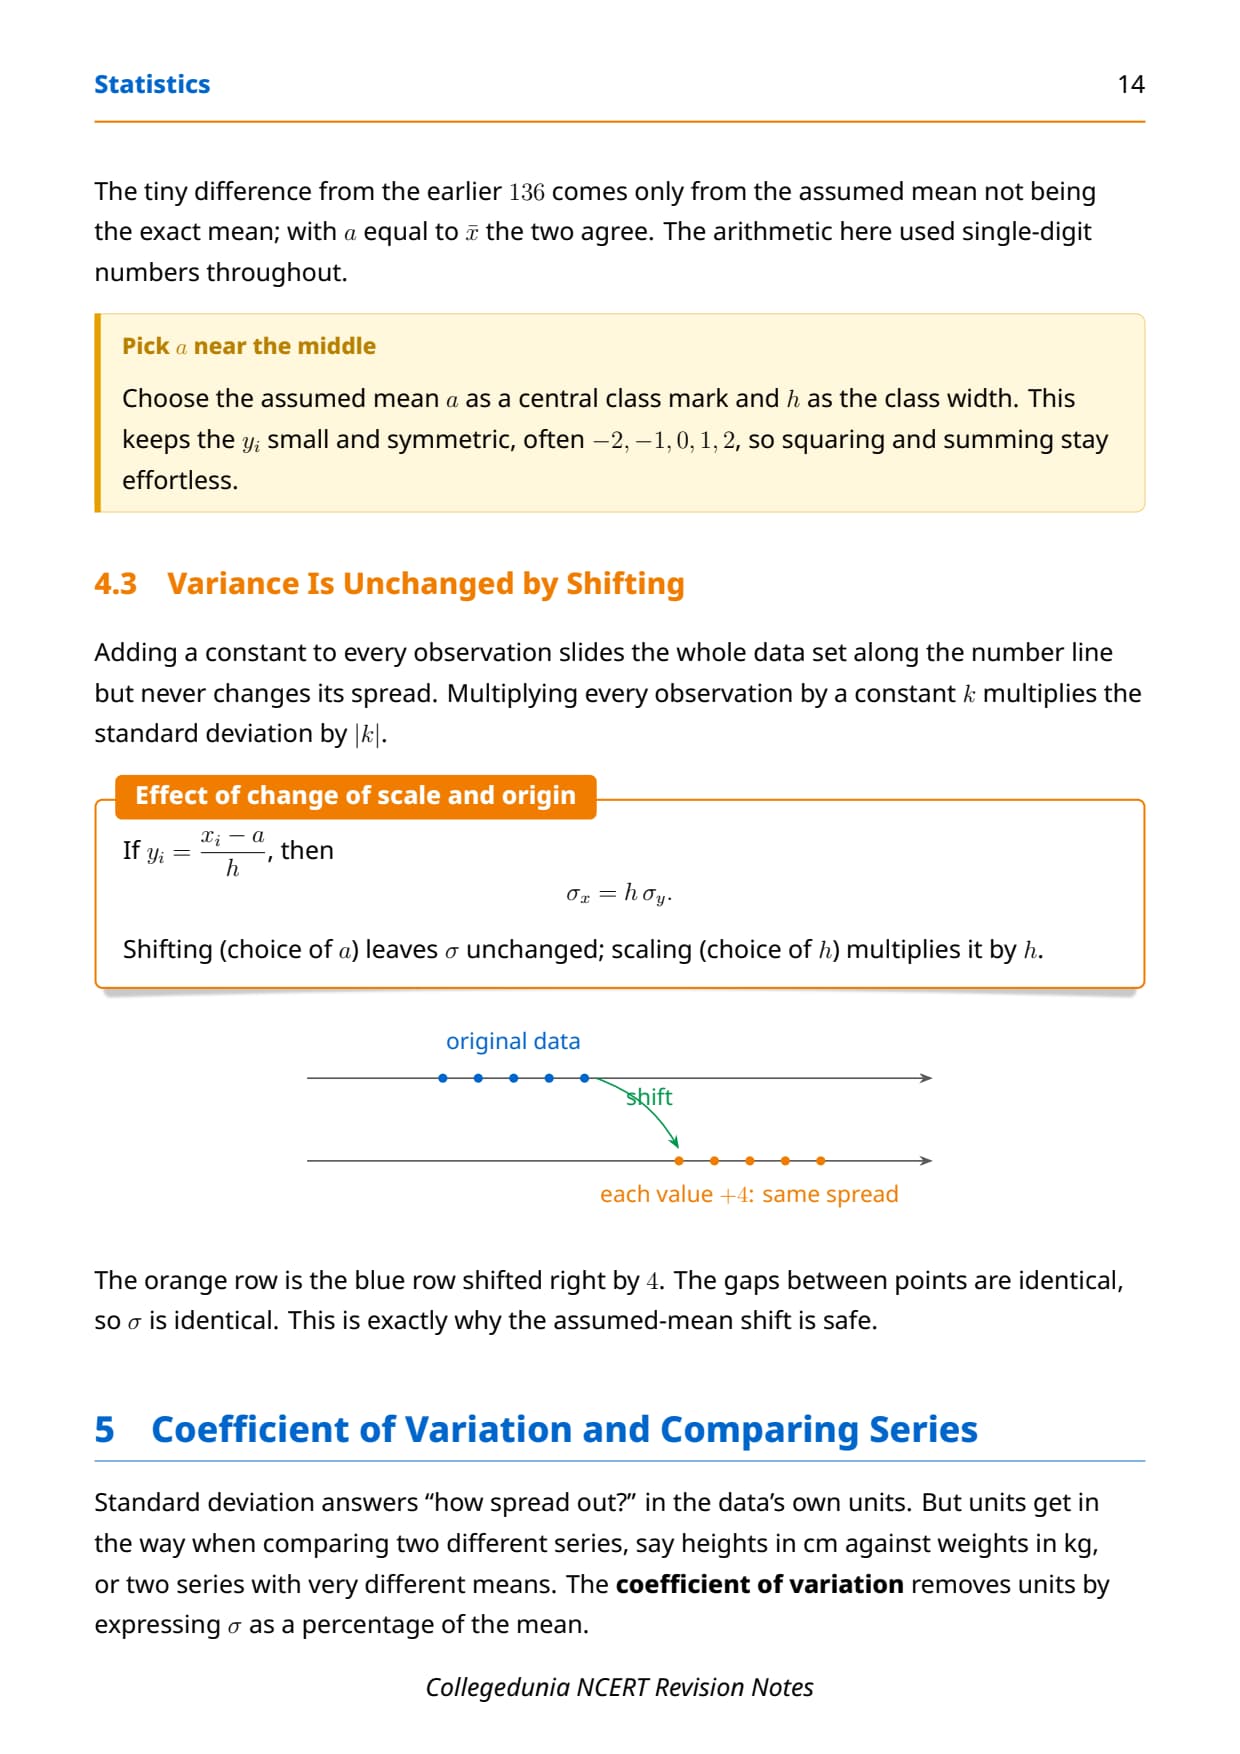
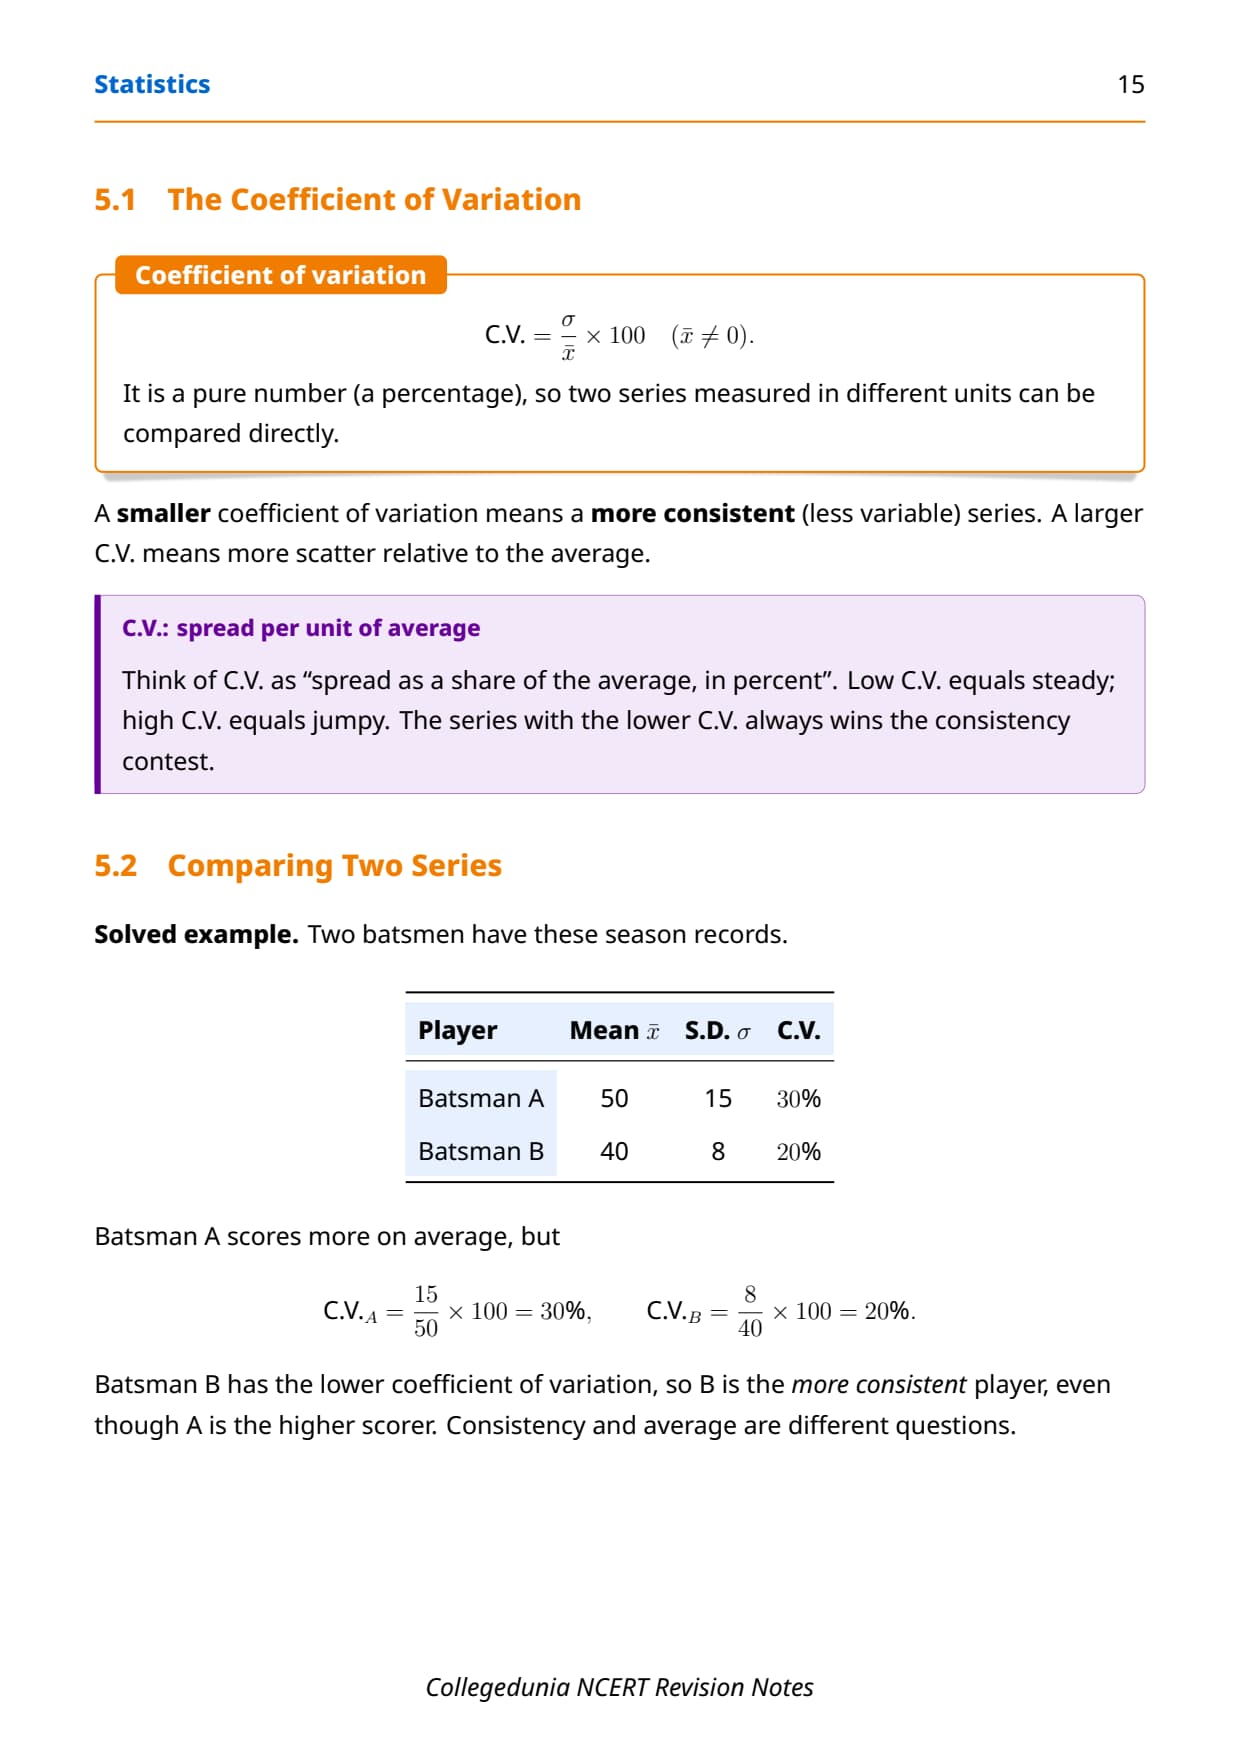
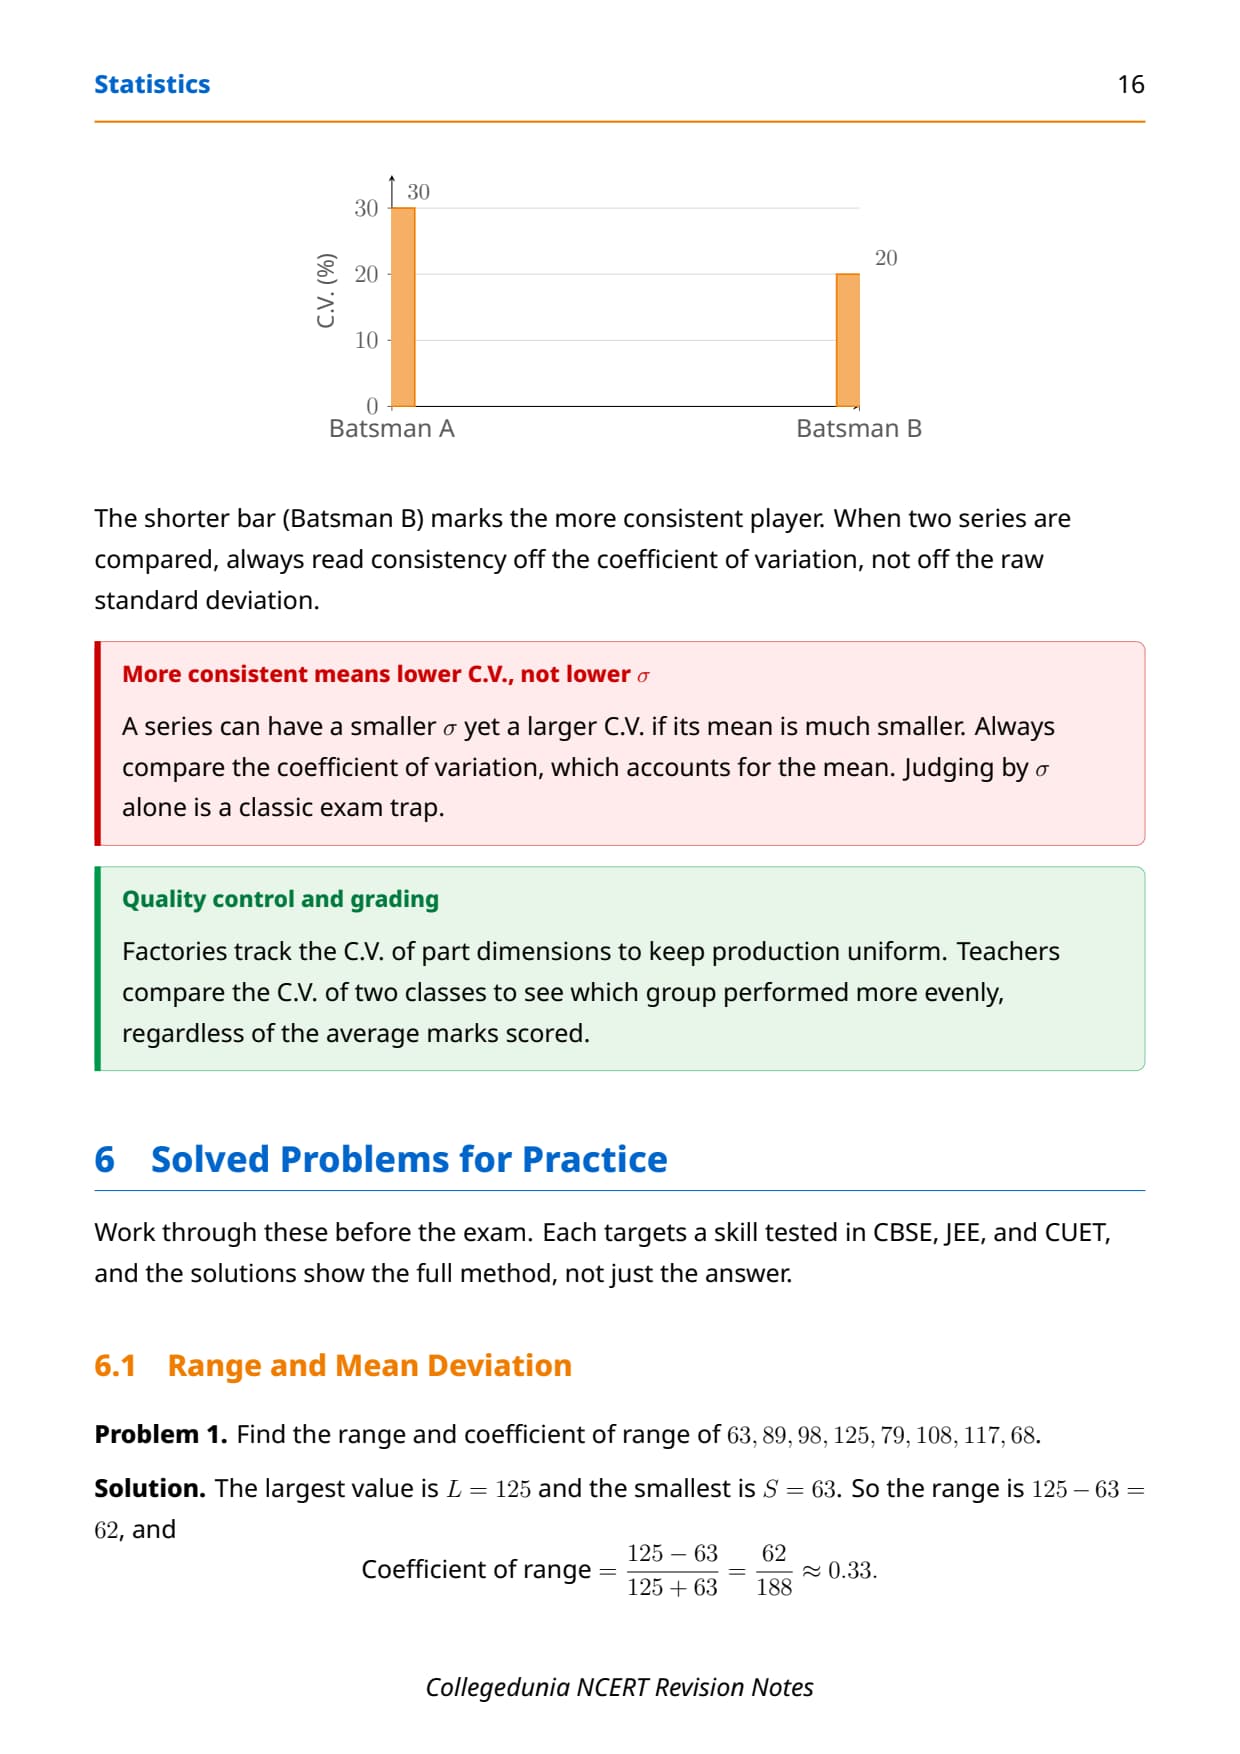
You can download the complete Statistics notes PDF above, then use the topic-by-topic summary and the formula table on this page for a fast last-minute revision.
- CBSE Boards: Statistics sits in Unit 6 (Statistics and Probability) and carries roughly 6 to 8 marks along with Probability.
- JEE Main and CUET: expect 1 to 2 direct questions on variance, standard deviation, and the coefficient of variation every year.
- What is covered: range, mean deviation about mean and median, variance, standard deviation, coefficient of variation, and analysis of frequency distributions.
Every entry in these Statistics notes is curated by Collegedunia subject experts, according to the 2026-27 NCERT textbook, and checked against the last five years of CBSE Board and JEE Main papers.
Also Check:
Topic-by-Topic Summary of Statistics for Class 11 Maths
The Statistics chapter builds on the mean, median, and mode from earlier classes and adds measures of dispersion. The class 11 maths notes chapter 13 statistics map each sub-topic to what the exam asks, so students know where the marks sit before they revise.
- Measures of dispersion: why a single average is not enough, and what "spread" means. A short 1-mark idea question.
- Range: the simplest measure of spread, using only the largest and smallest values. A quick 1-mark calculation.
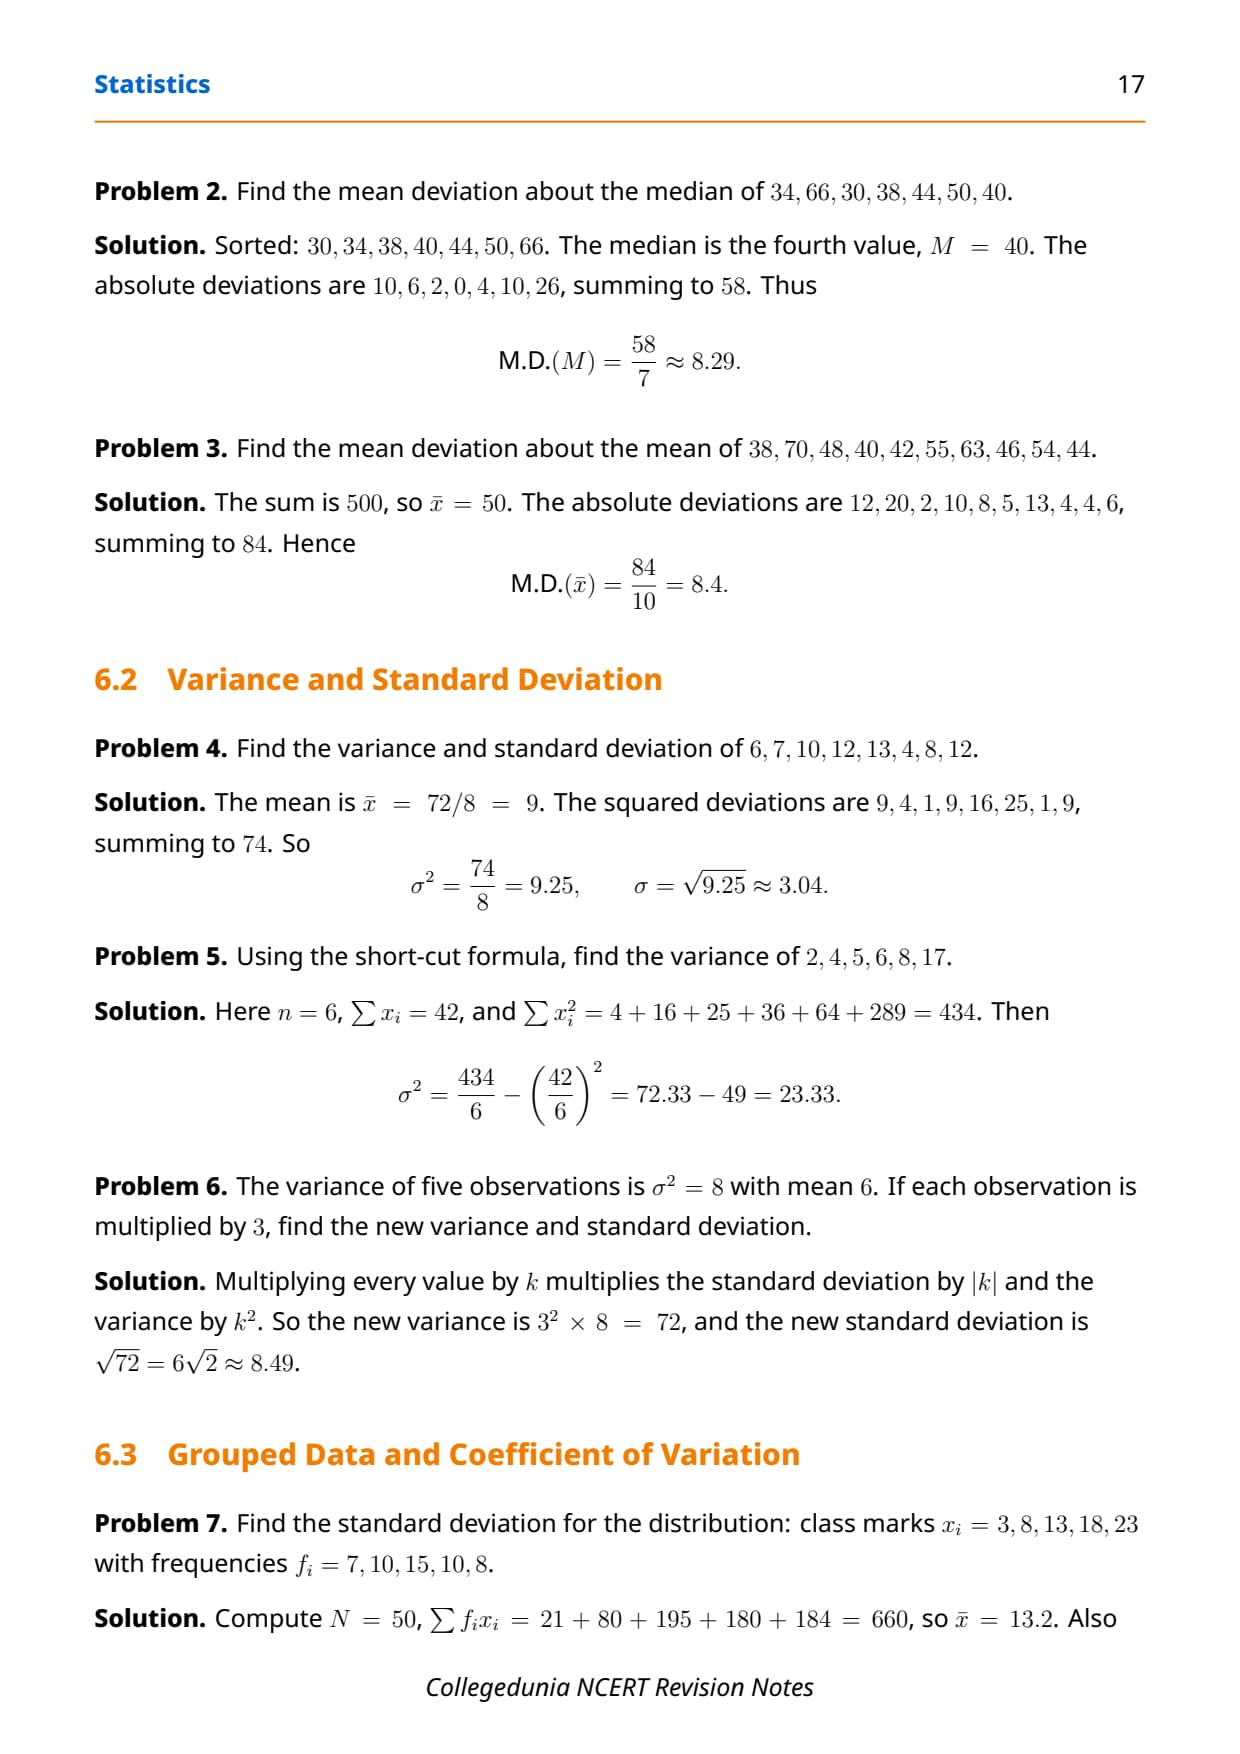
- Mean deviation: average distance of the data from the mean or the median. A common 3 to 4-mark question.
- Variance and standard deviation: the most important measures of spread. The 4 to 6-mark core of the chapter.
- Coefficient of variation: comparing the spread of two different data sets. A frequent word-problem question.
The rest of these notes take each block in order, so a first read from top to bottom mirrors the NCERT chapter flow.
Measures of Dispersion and the Range in Statistics
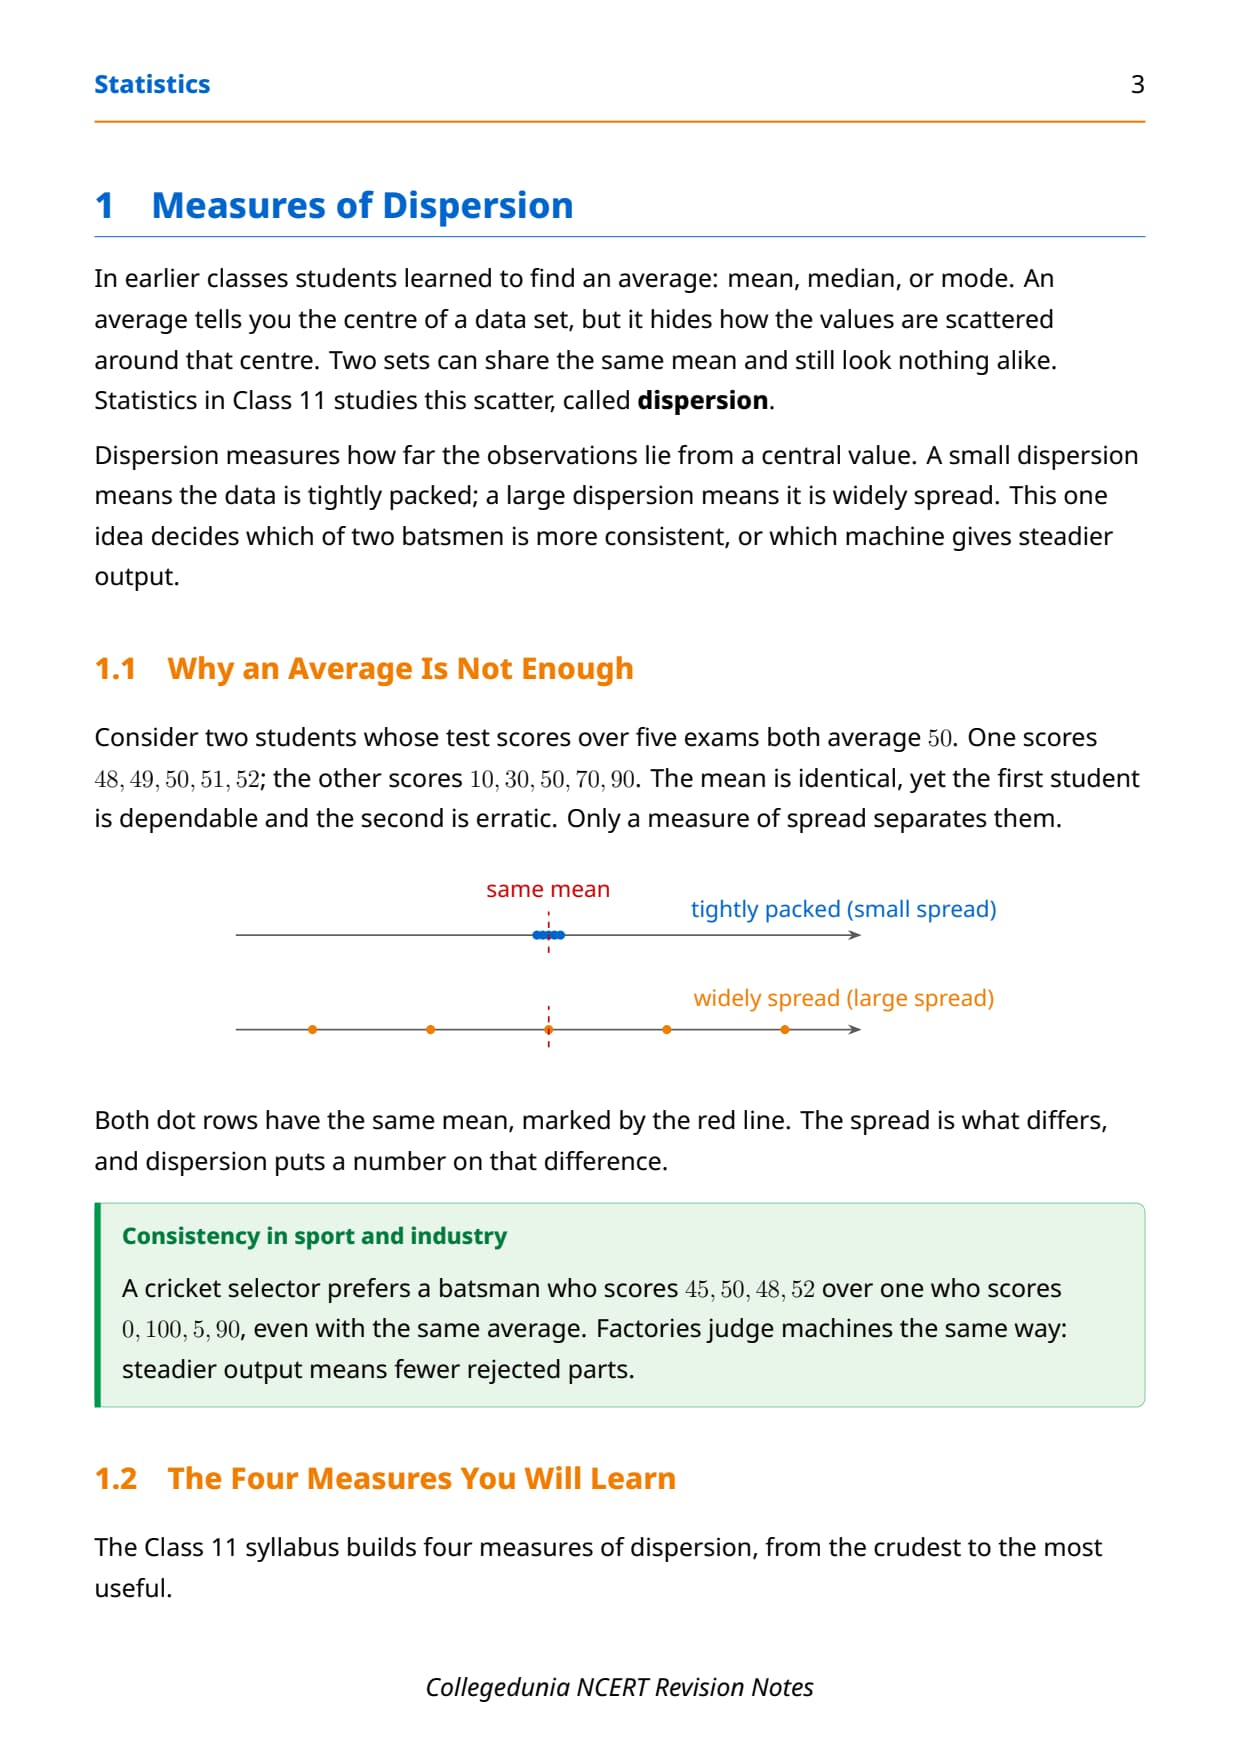
A measure of dispersion tells you how spread out the data is around its average. Two data sets can share the same mean but look completely different, so you need a number for the spread as well. The four measures in Class 11 are range, mean deviation, variance, and standard deviation.
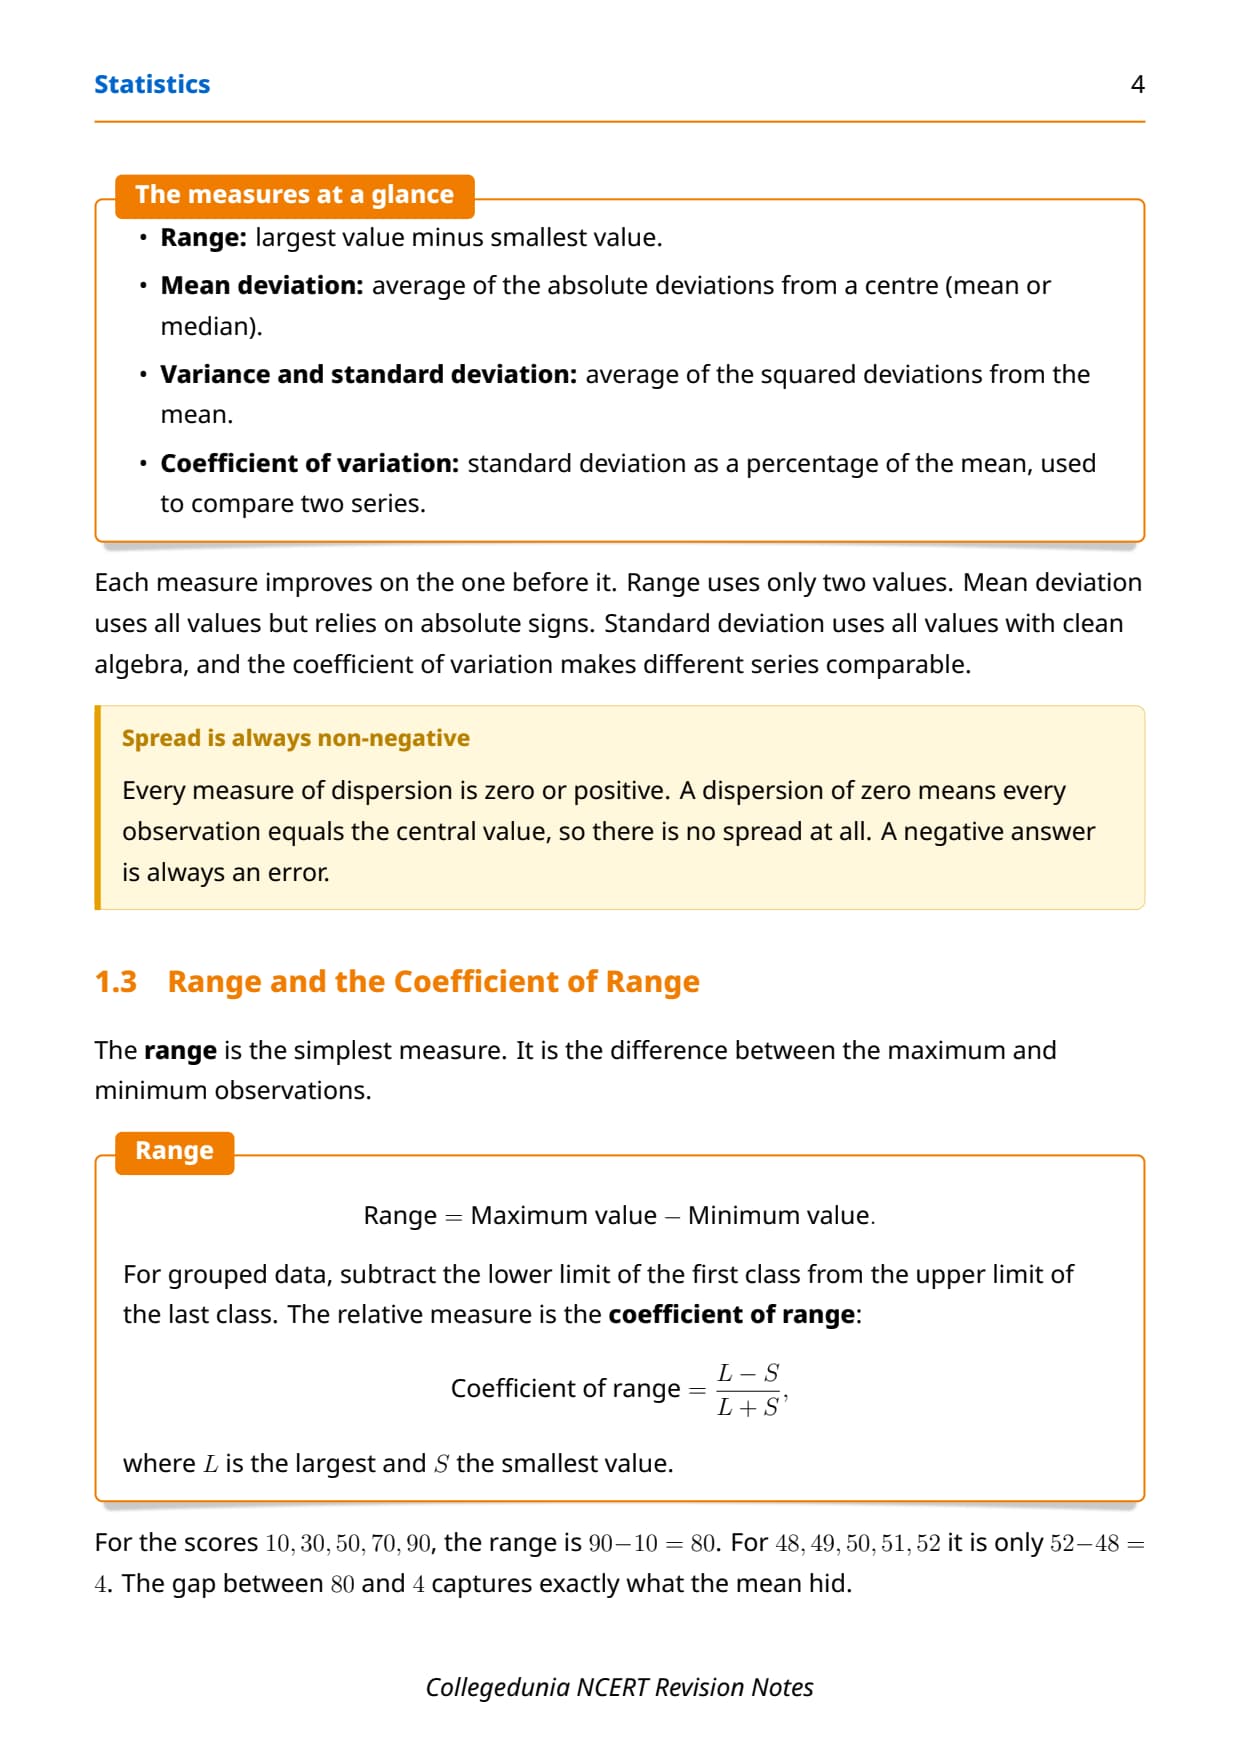
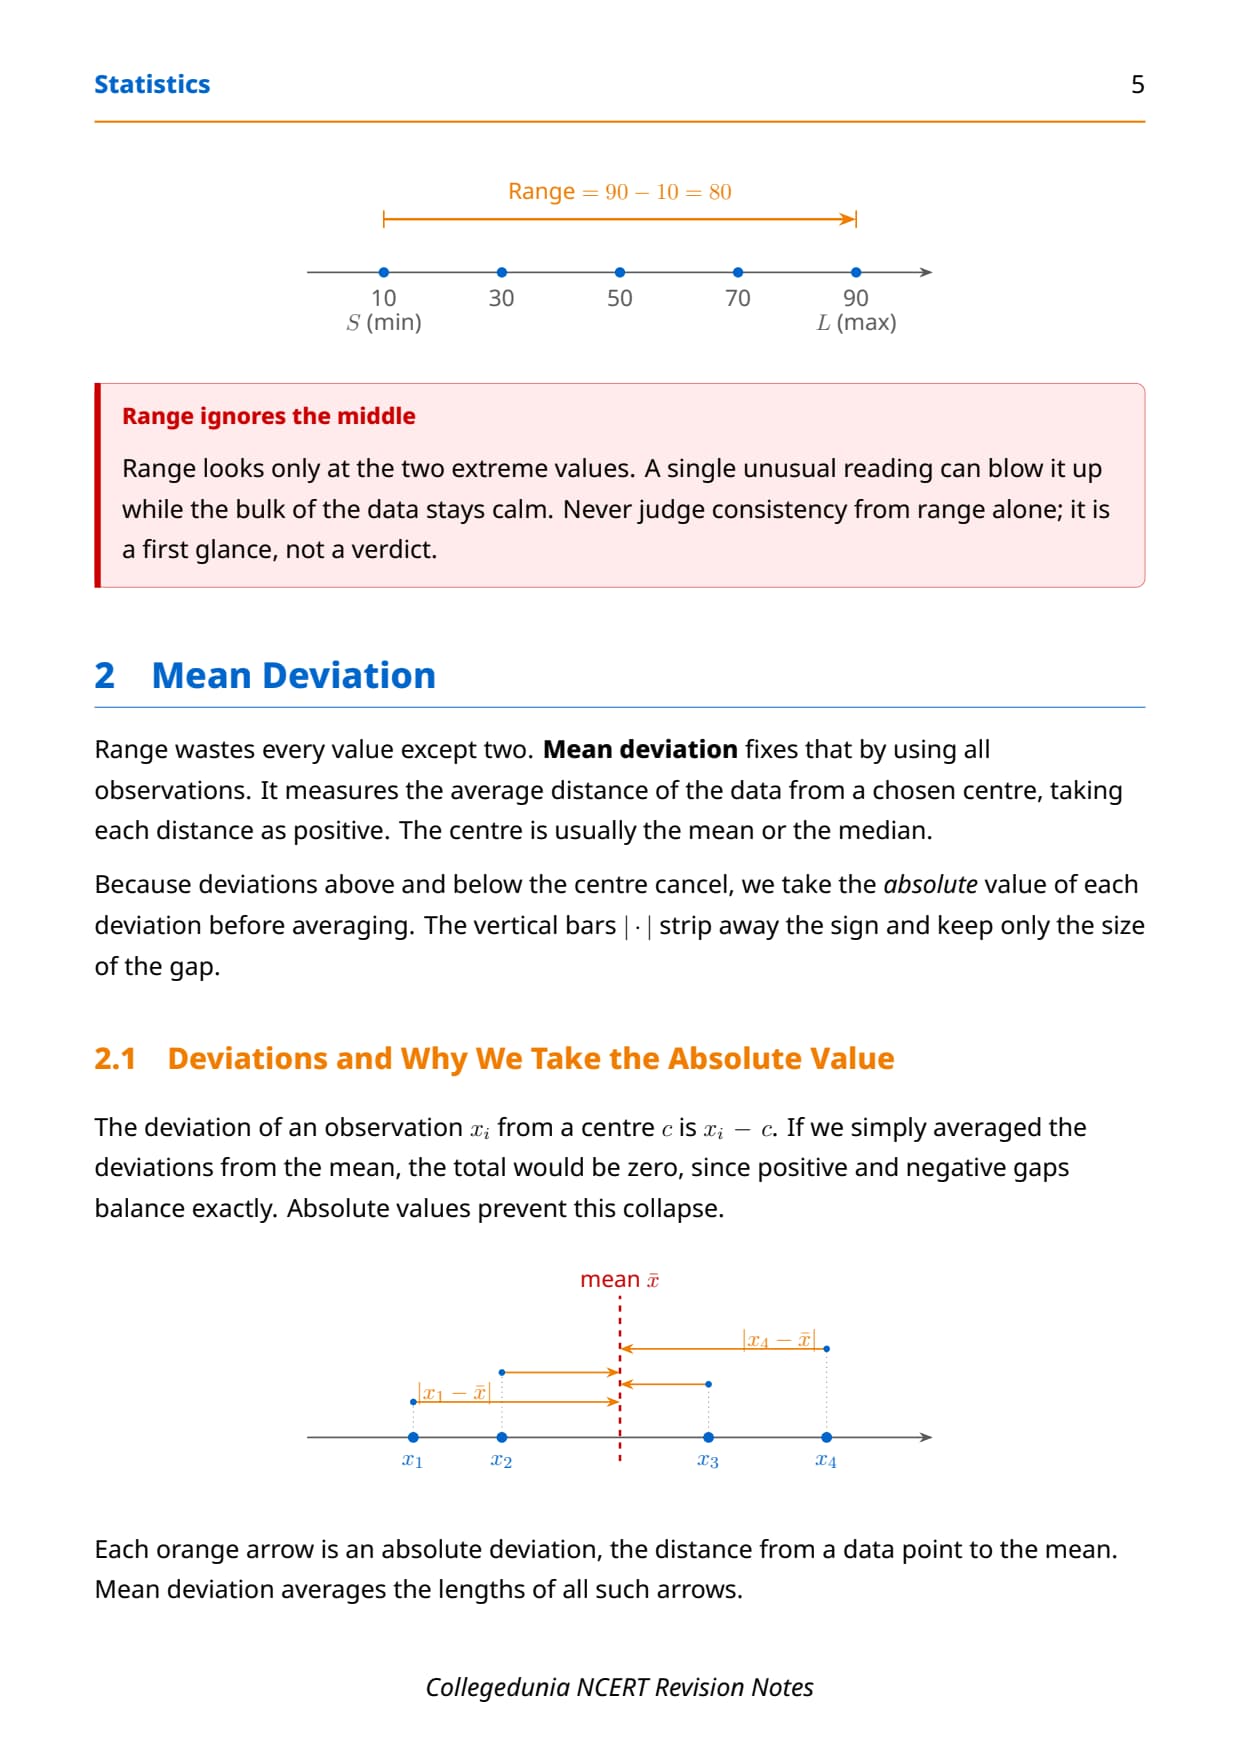
The range is the easiest measure to find. It uses only the two extreme values:
- Range: Range = Maximum value − Minimum value. It ignores every value in between.
- Coefficient of range: (Max − Min) ÷ (Max + Min). A relative measure used to compare two sets.
Key limitation: the range depends on just two data points, so one unusual value can distort it. That is why the exam quickly moves on to mean deviation and standard deviation, which use every observation.
Mean Deviation about the Mean and Median for Class 11 Statistics
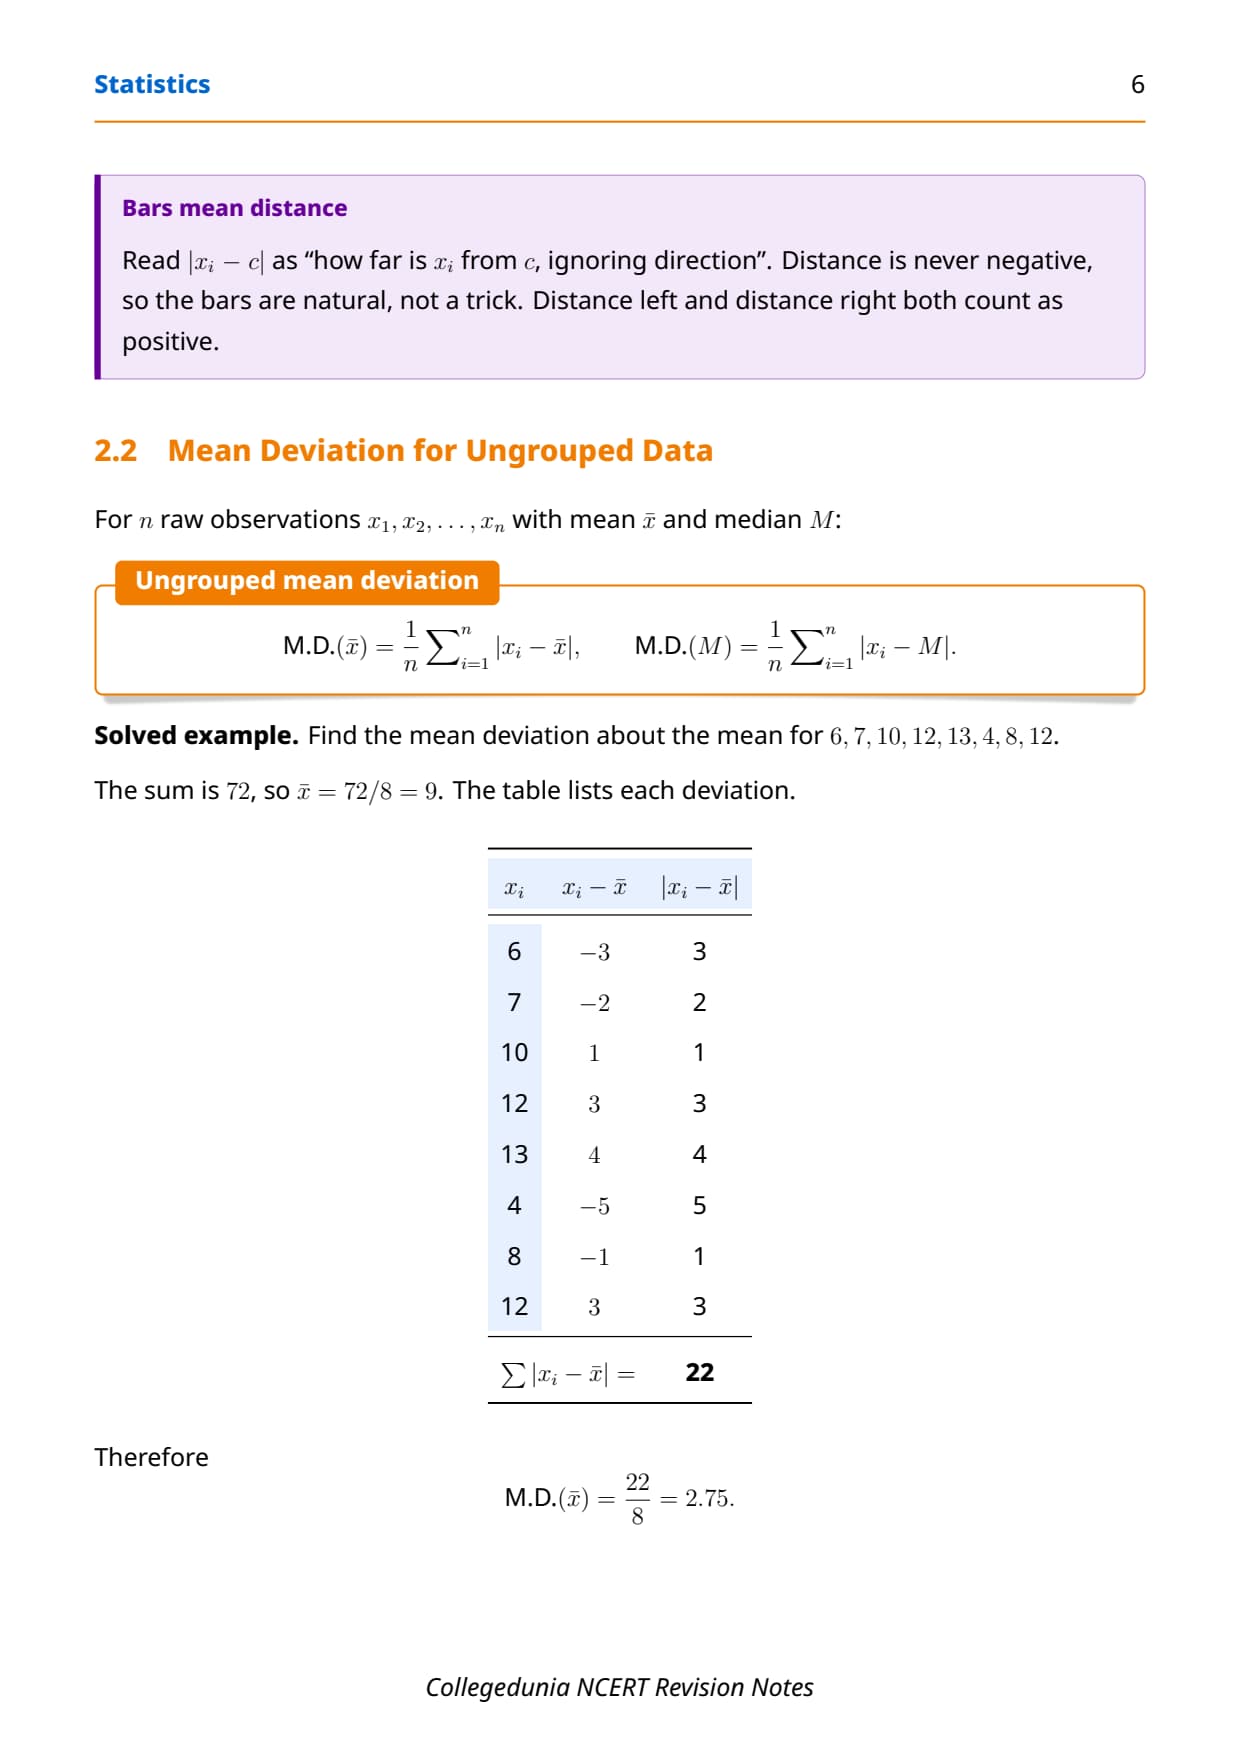
The mean deviation is the average of the absolute distances of the data from a central value, usually the mean or the median. Absolute distance means you drop the minus sign, so distances never cancel out. The class 11 maths notes chapter 13 statistics treat this as the bridge between the range and the variance.
- About the mean (ungrouped): M.D.(x̄) = (1/n) Σ |xi − x̄|, where x̄ is the mean.
- About the median (ungrouped): M.D.(M) = (1/n) Σ |xi − M|, where M is the median.
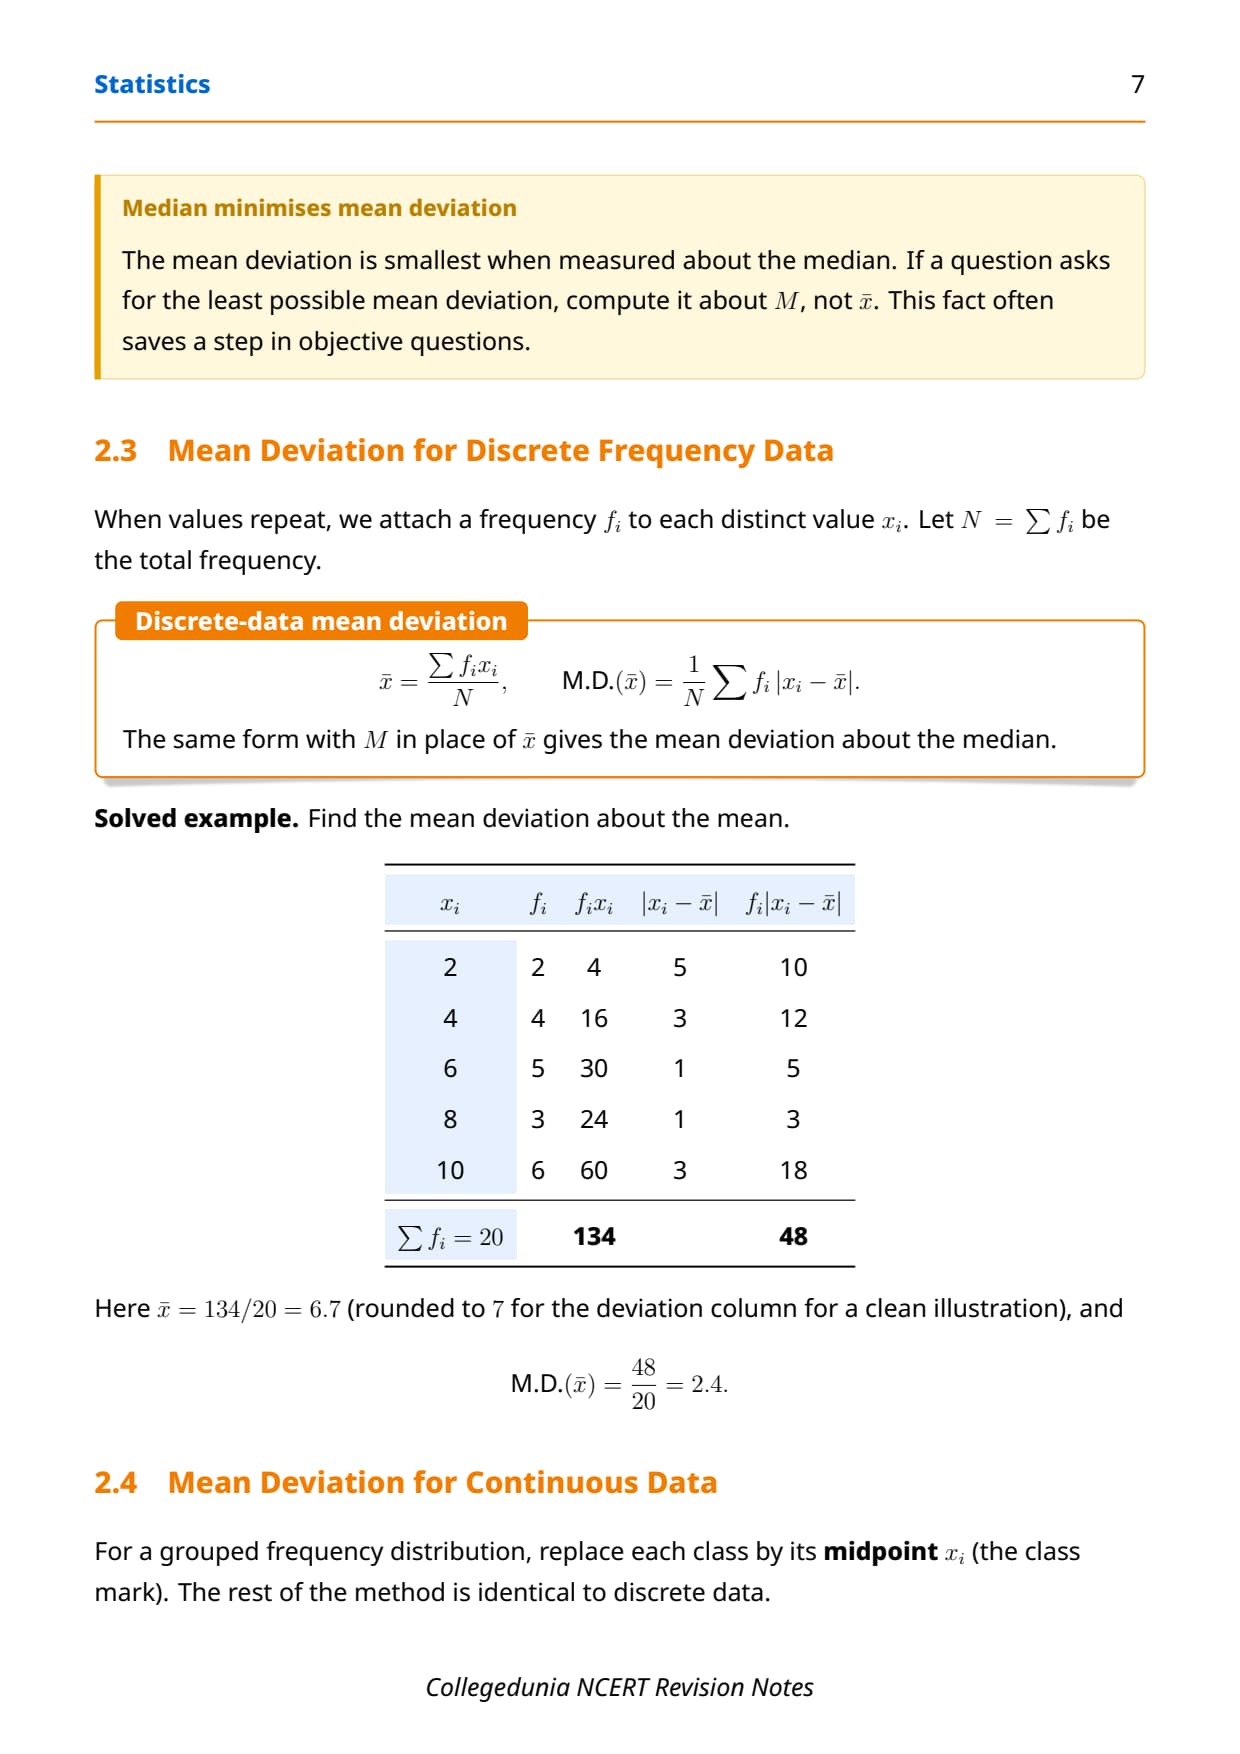
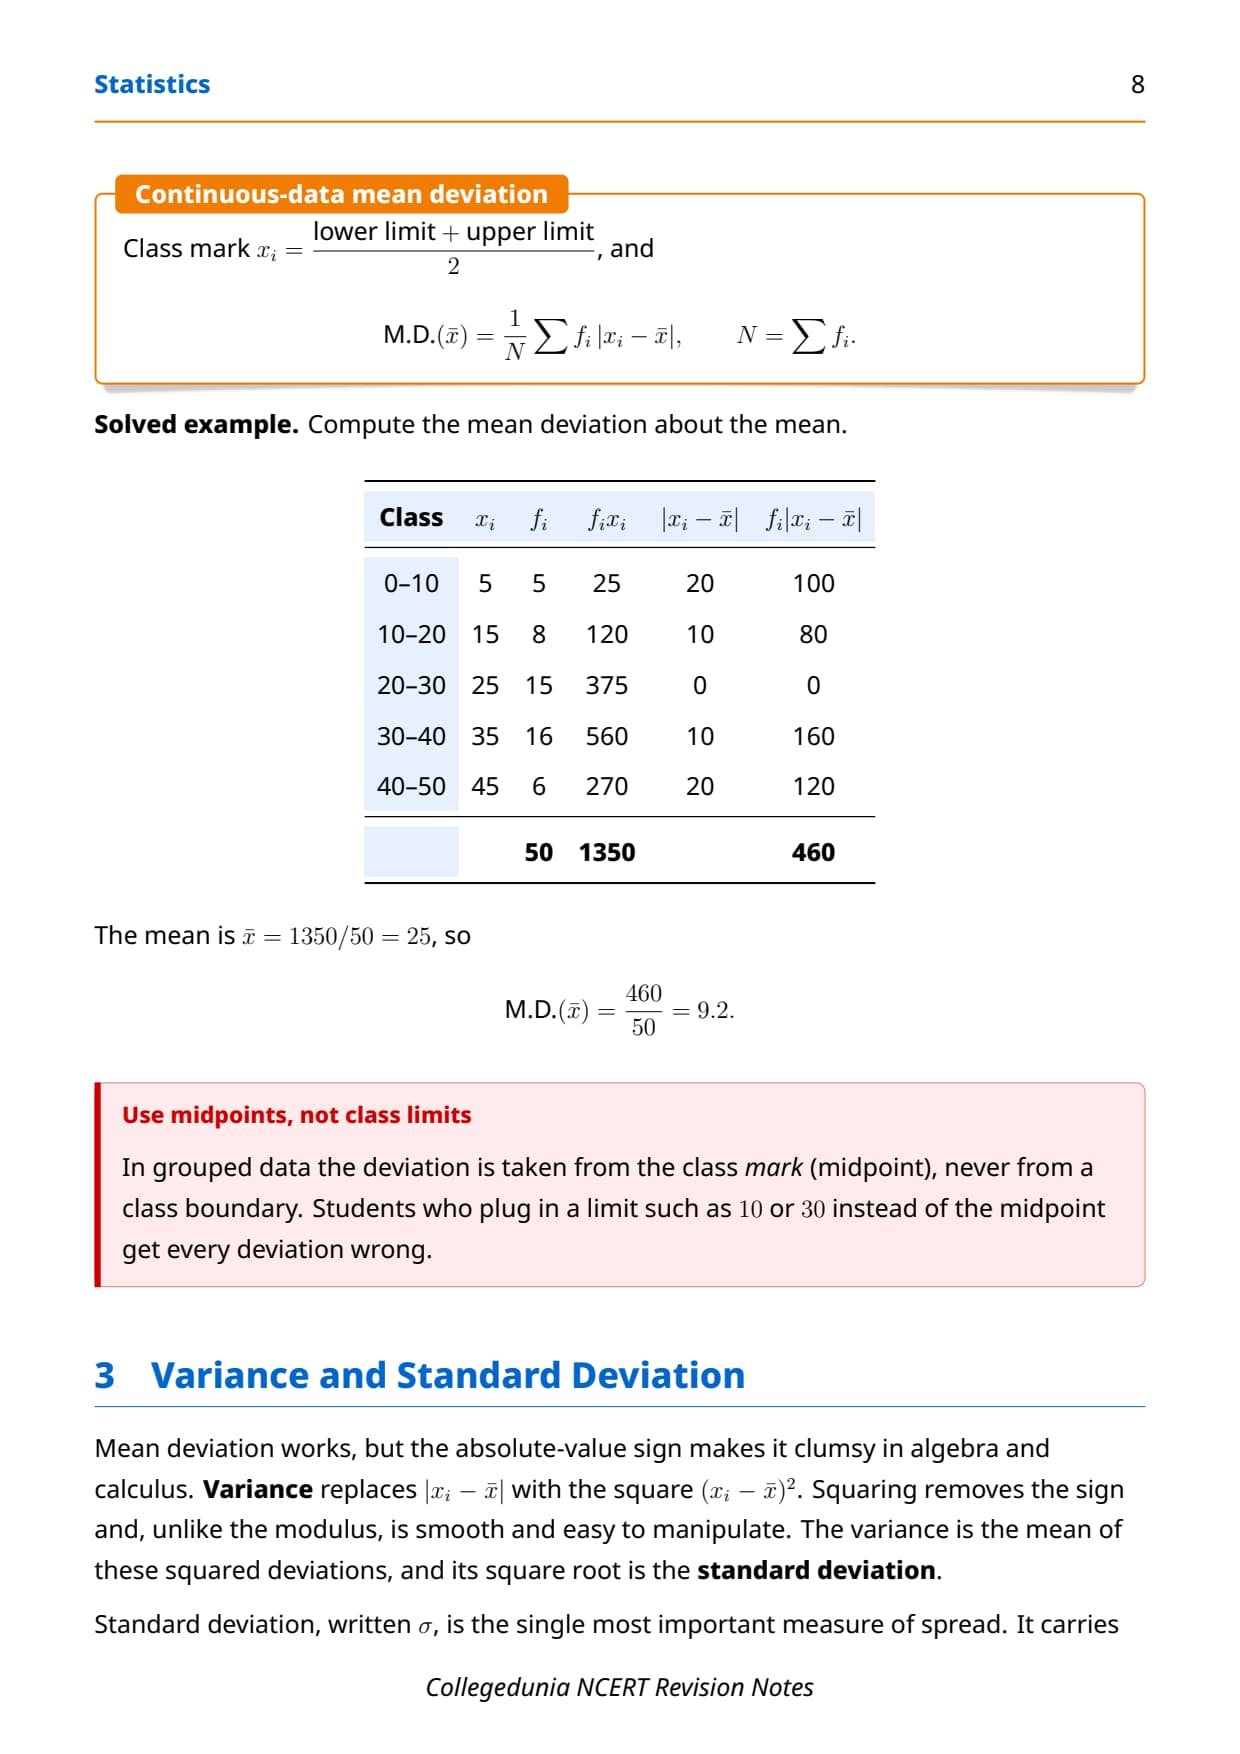
- Grouped data: multiply each absolute distance by its frequency fi, then divide by N = Σ fi.
An important result: the mean deviation taken about the median is the smallest possible mean deviation for any data set. So when a question does not fix the central value, the median gives the least spread. Always find the mean or median first, then the deviations.
Variance and Standard Deviation in Class 11 Maths
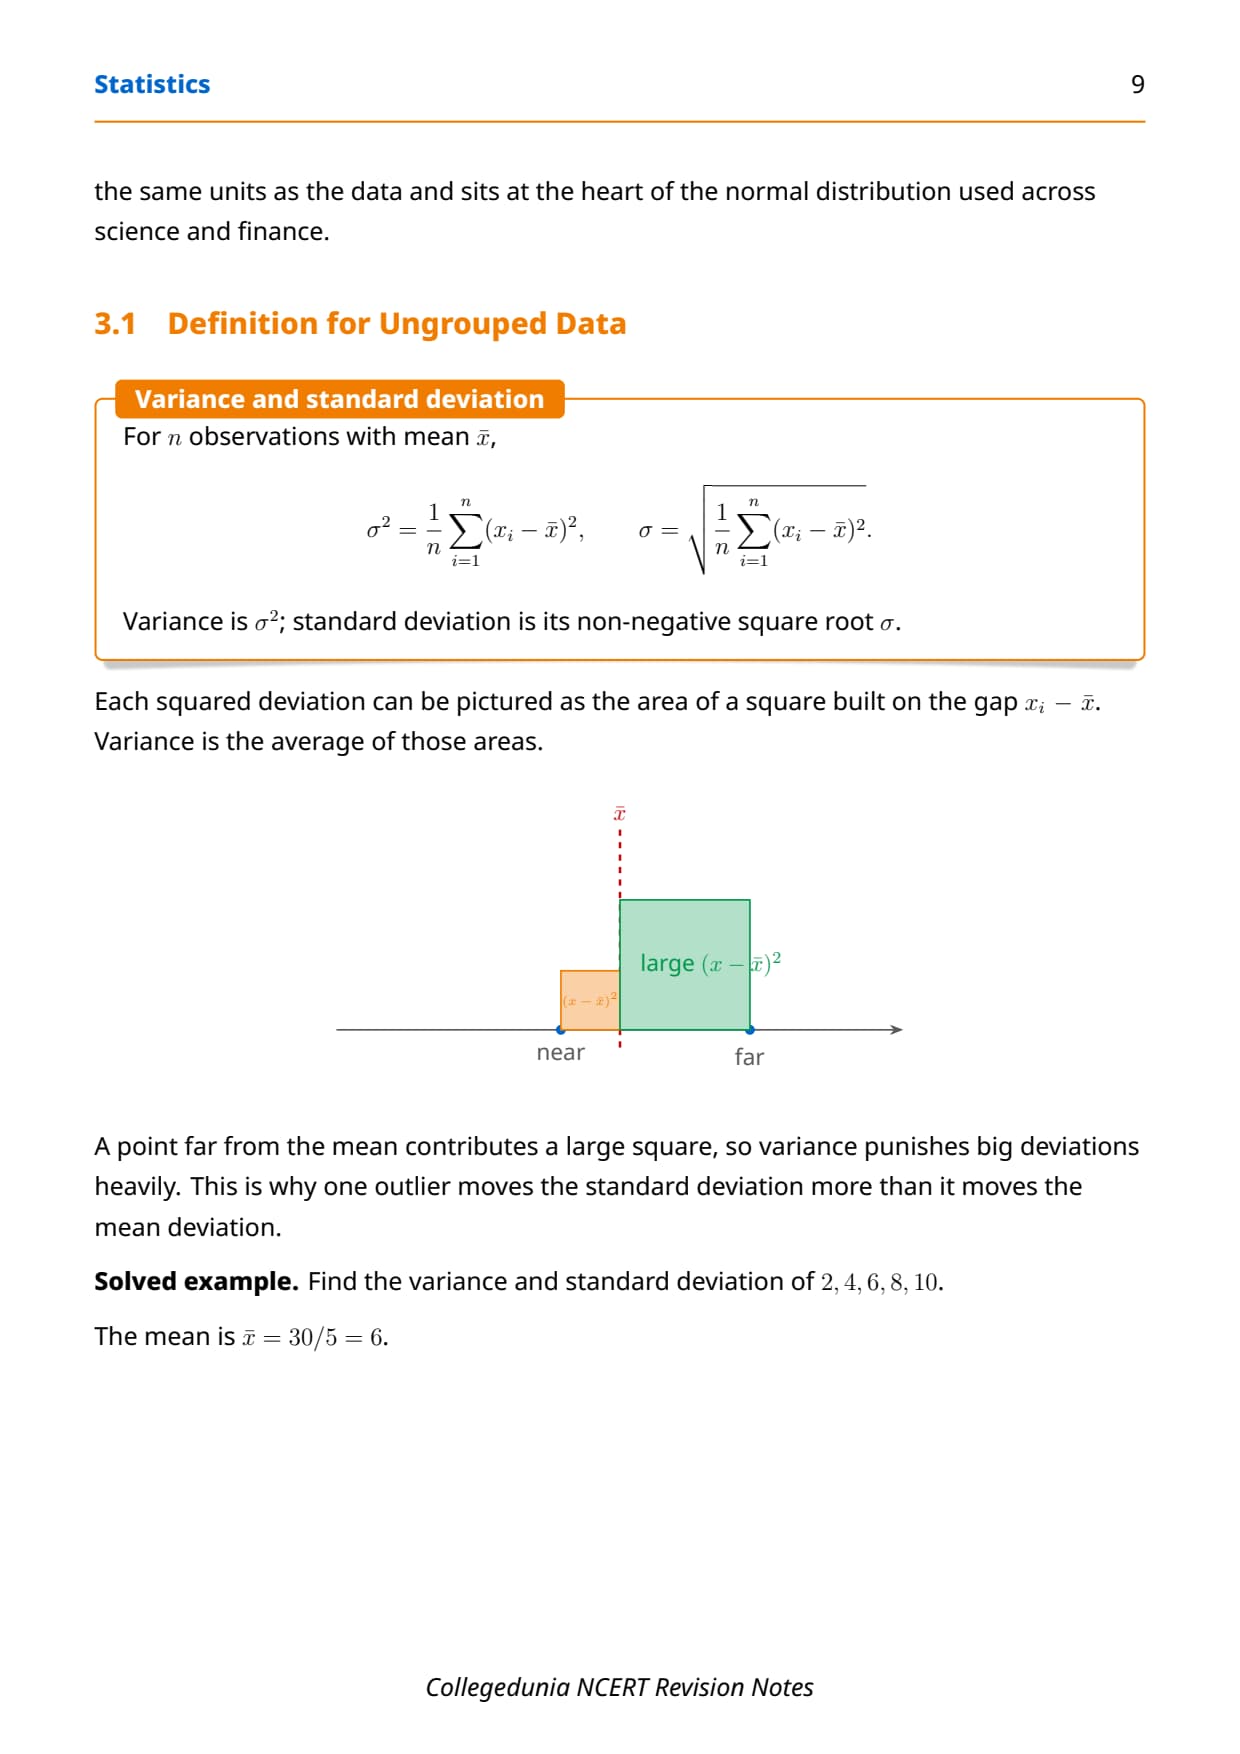
Mean deviation uses absolute values, which are awkward in algebra. To fix this, statistics squares the deviations instead. The average of the squared deviations is the variance, written σ² (sigma squared).
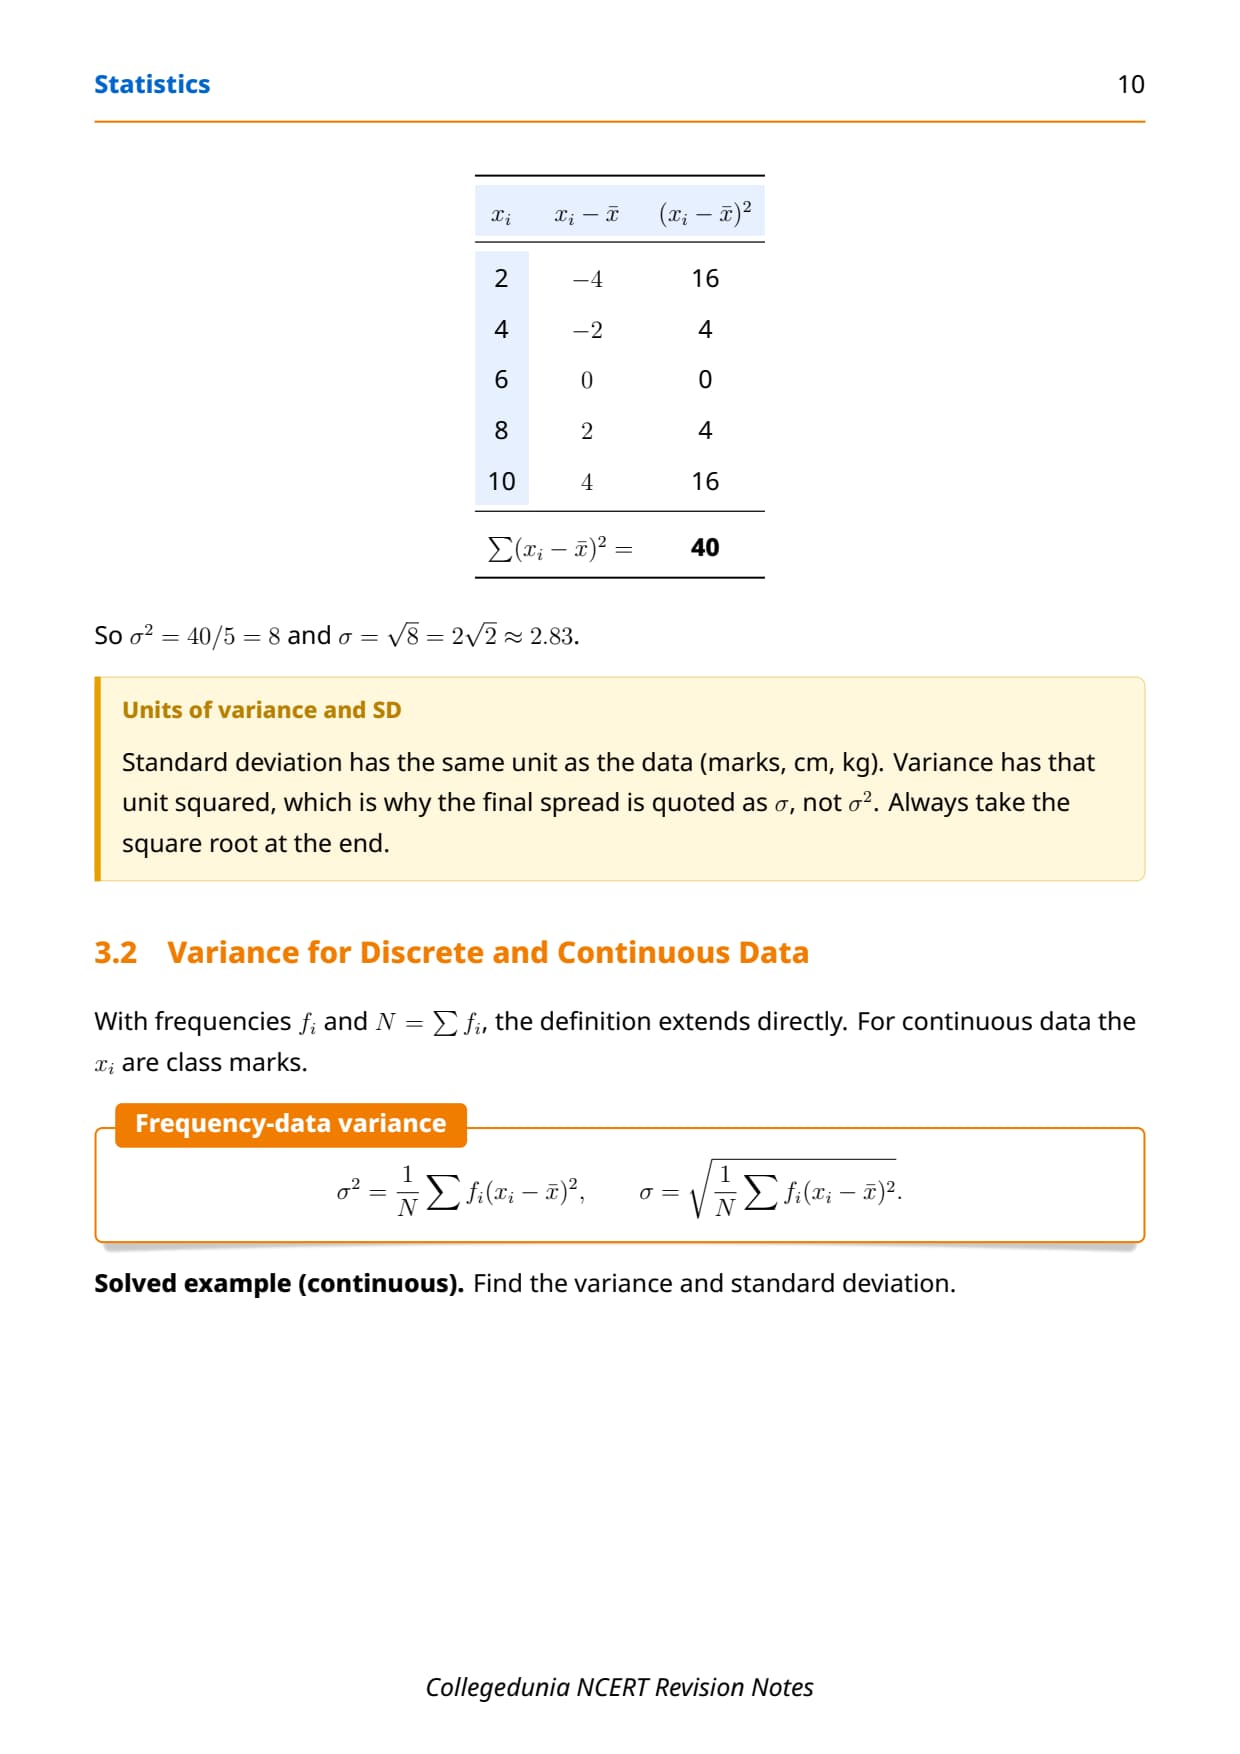
- Variance (ungrouped): σ² = (1/n) Σ (xi − x̄)².
- Standard deviation: σ = the positive square root of the variance.
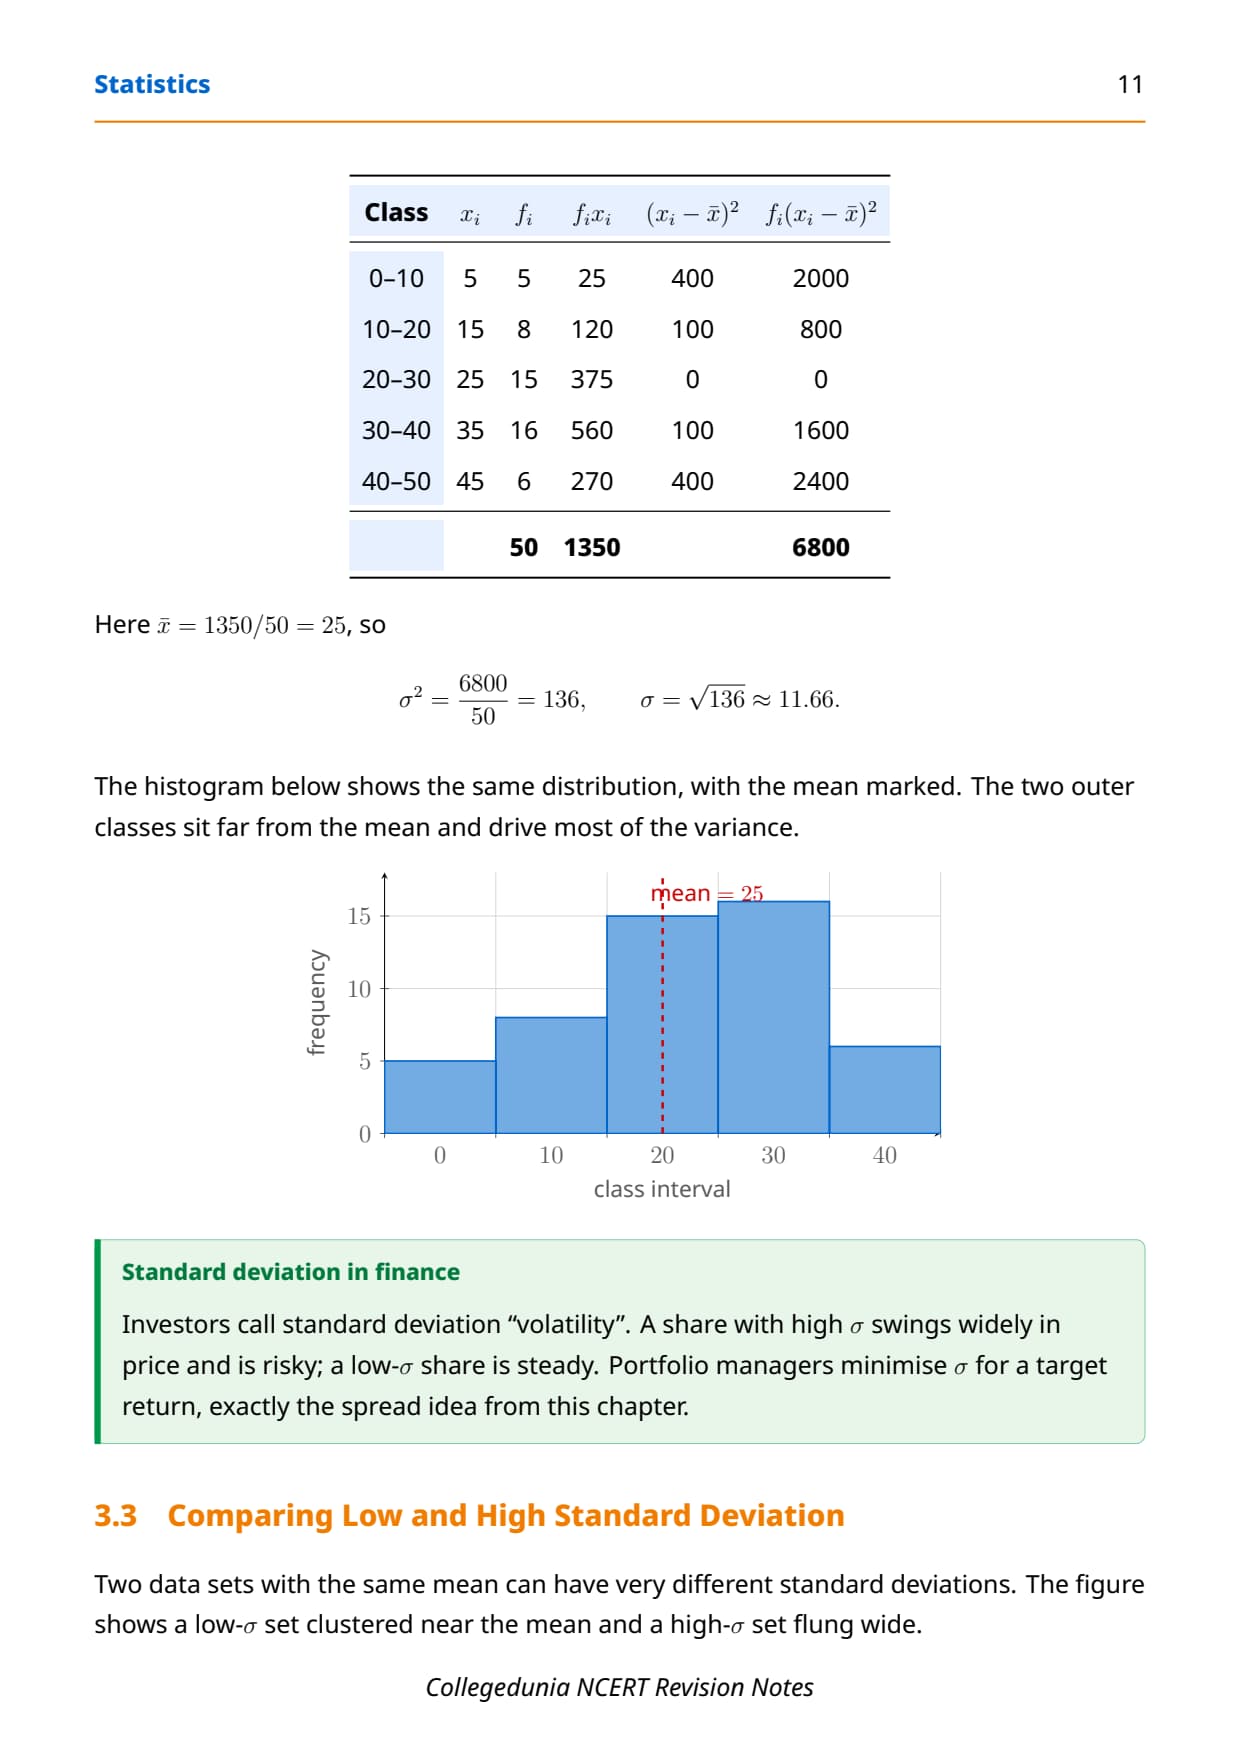
- Grouped data: σ² = (1/N) Σ fi (xi − x̄)², with N = Σ fi.
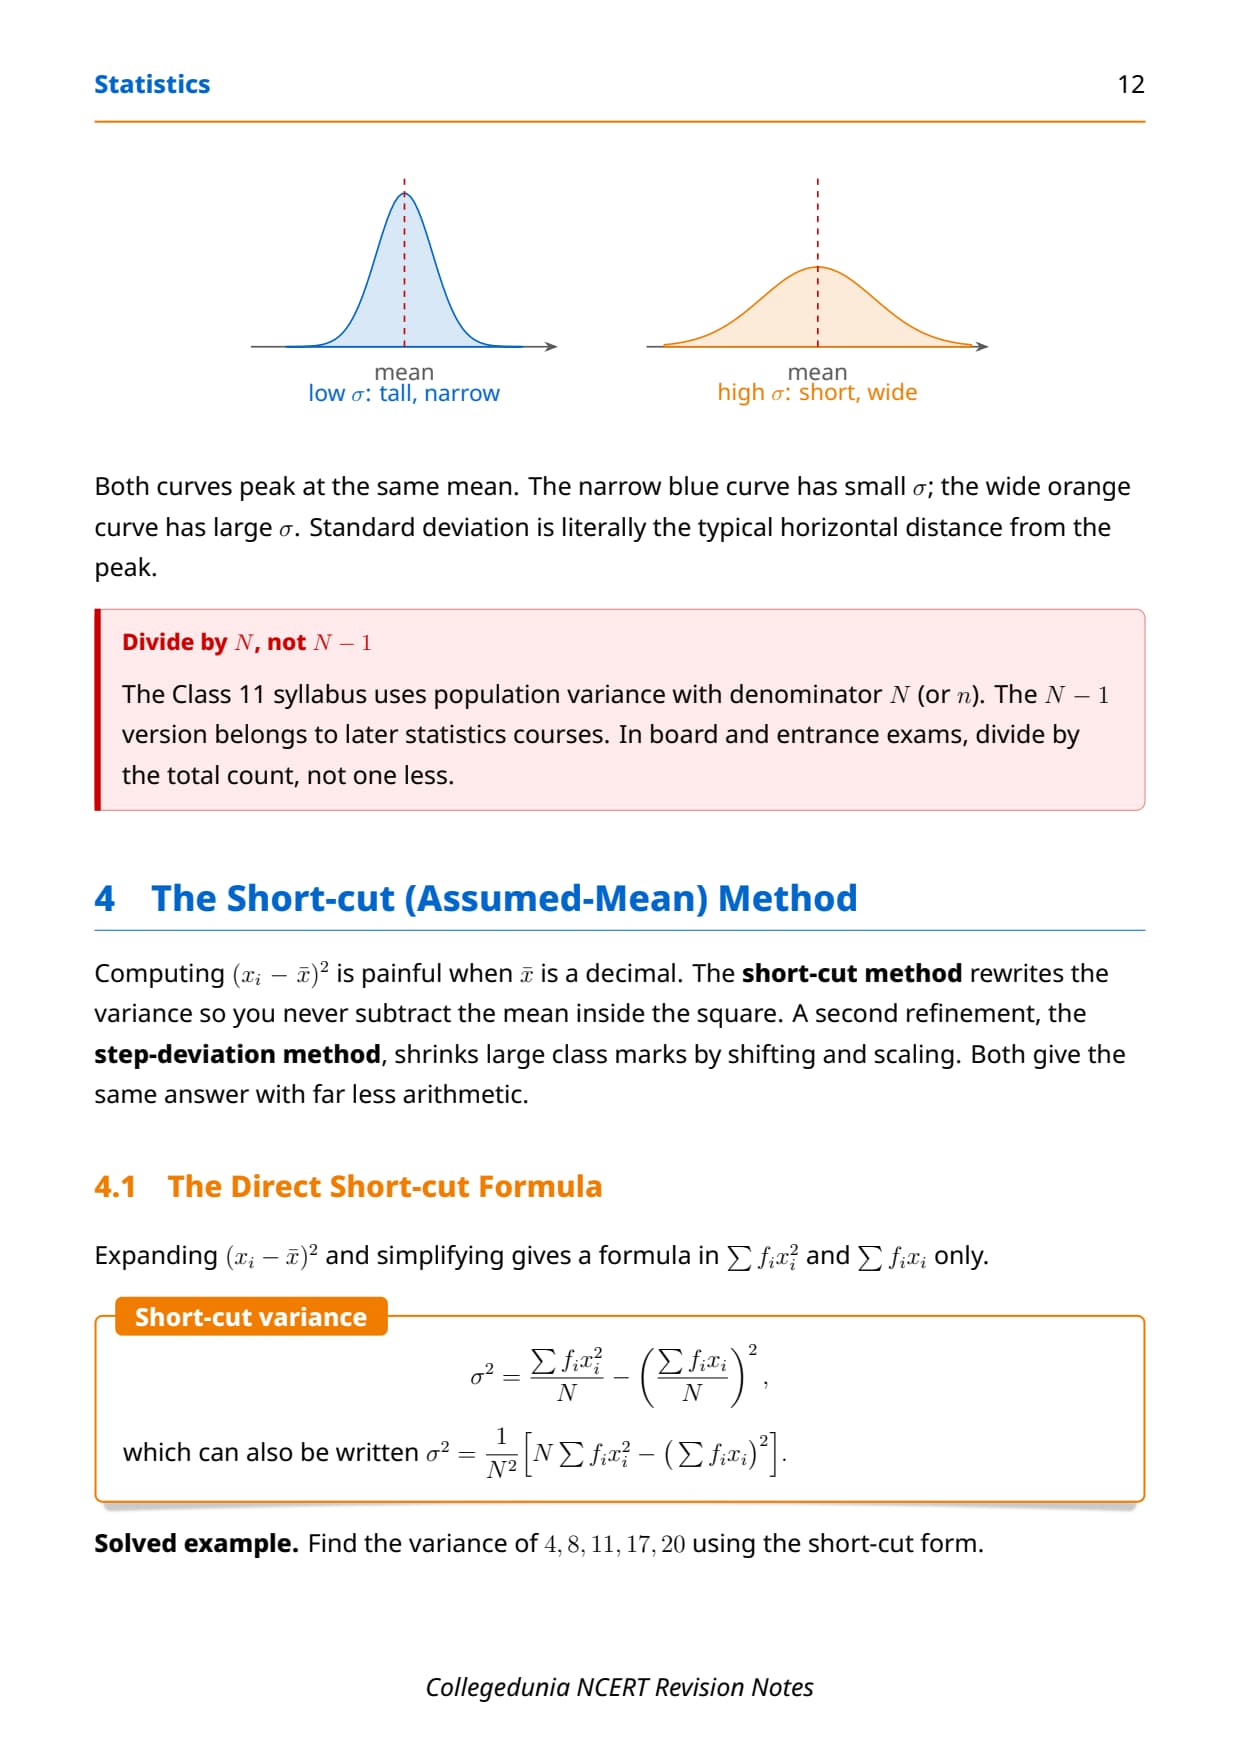
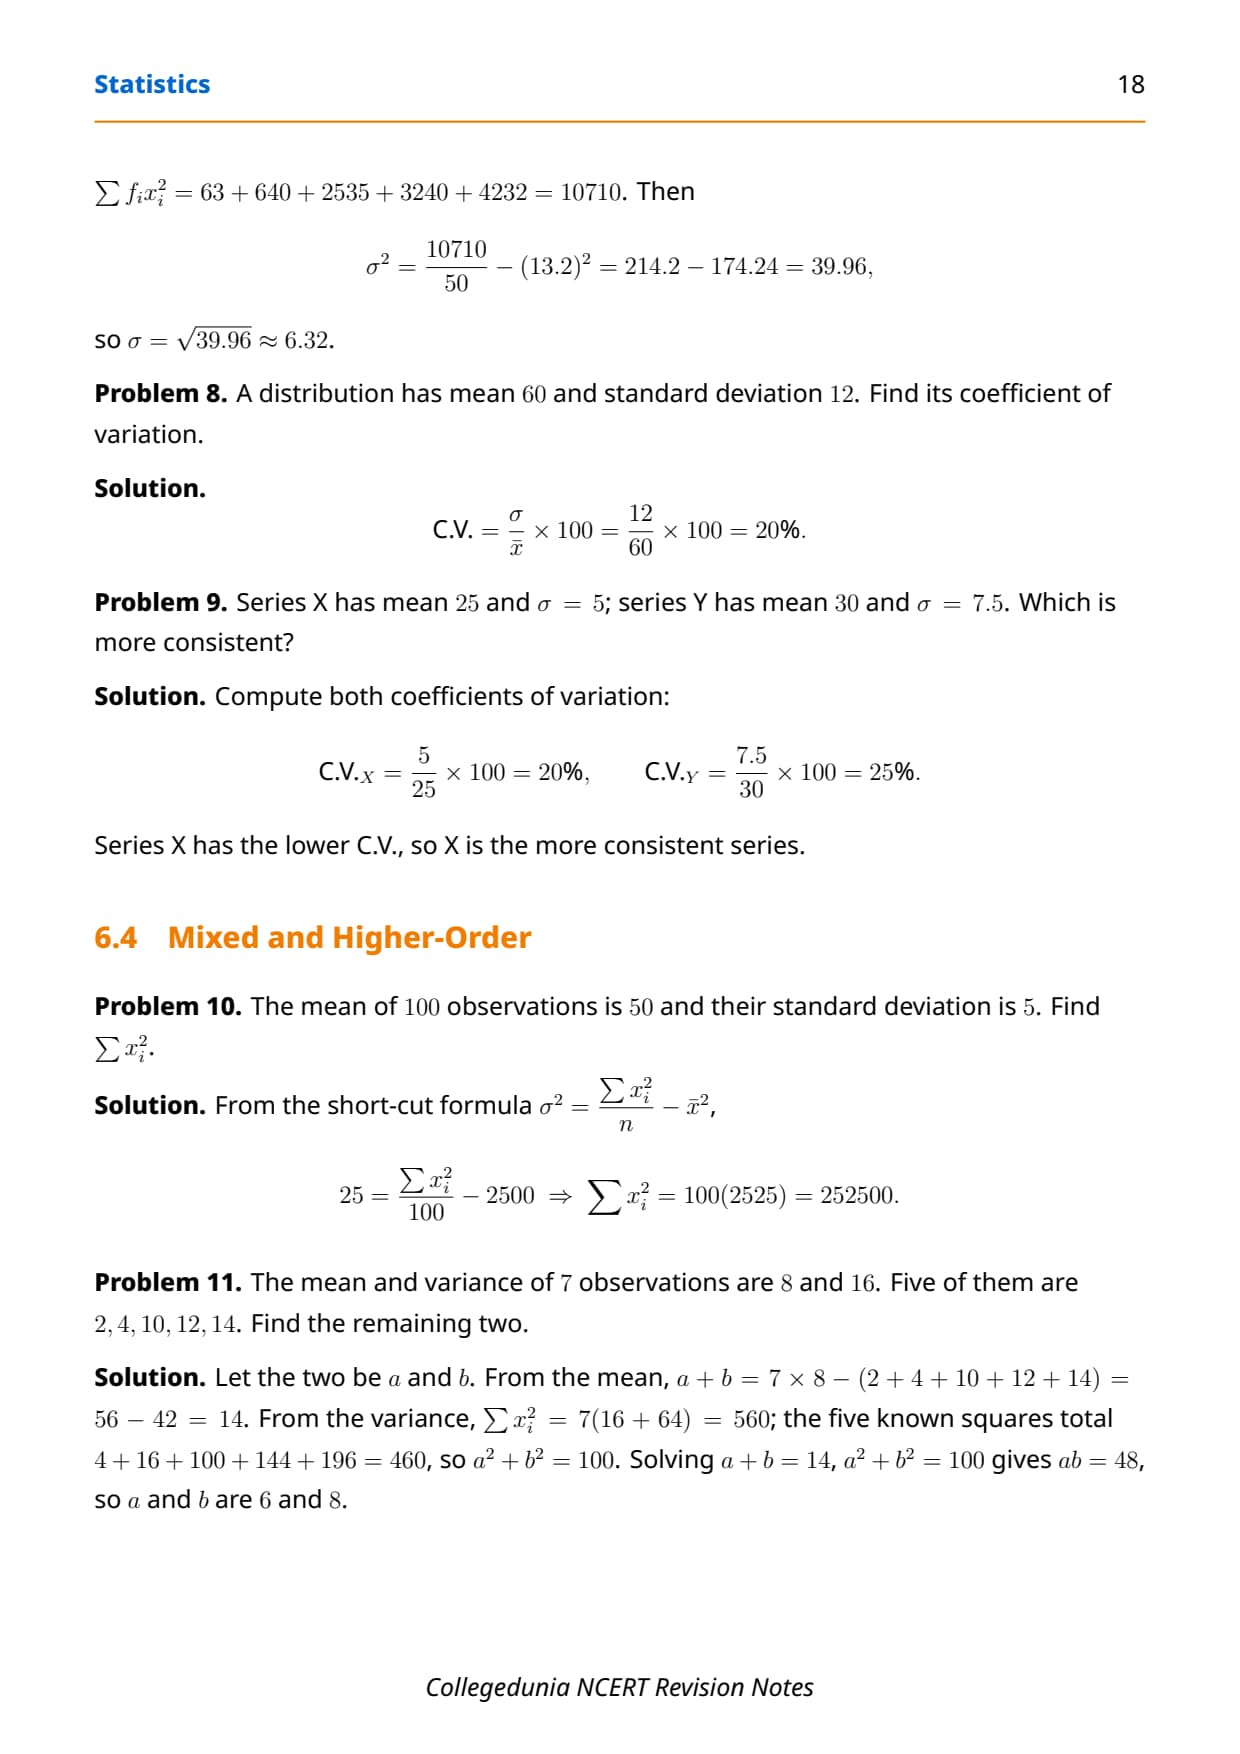
The standard deviation is the single most-used measure of spread because it comes back to the same unit as the data. A larger σ means the values are more scattered around the mean; a smaller σ means they cluster tightly. For quick work, use the shortcut formula σ = (1/N) × √[ N Σ fi xi² − (Σ fi xi)² ], which avoids finding the mean first.
All Formulas for Statistics: Quick-Reference Table
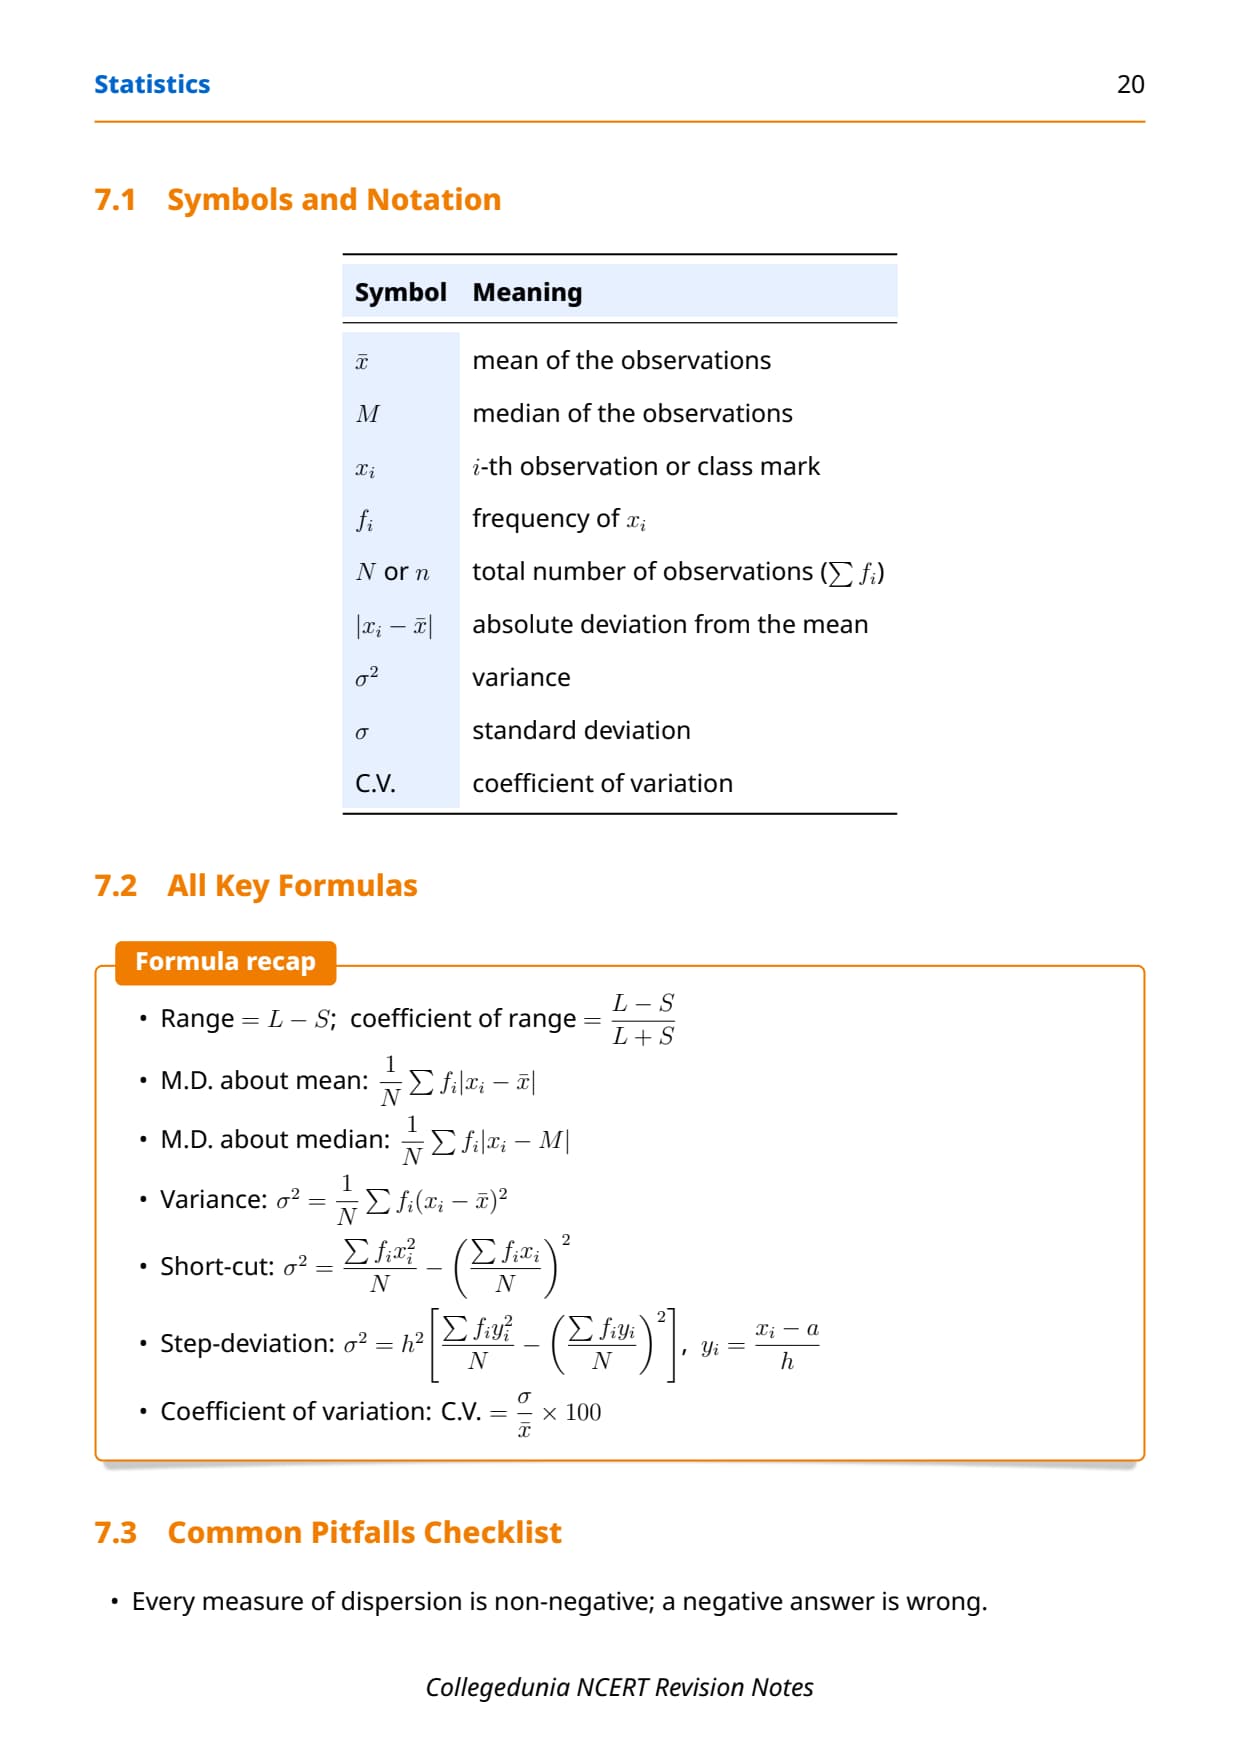
The formula table below covers every measure of dispersion the Statistics chapter can generate. These formulas for statistics are the ones students should copy onto a flashcard before the exam.
| Formula | What It Means | When to Use |
|---|---|---|
| Range = Max − Min | Spread from lowest to highest value | Quick, rough measure of spread |
| M.D.(x̄) = (1/n) Σ |xi − x̄| | Mean deviation about the mean | Ungrouped data, mean given |
| M.D.(M) = (1/n) Σ |xi − M| | Mean deviation about the median | Ungrouped data, least spread |
| M.D. = (1/N) Σ fi |xi − a| | Mean deviation for grouped data | Frequency distributions |
| σ² = (1/n) Σ (xi − x̄)² | Variance of ungrouped data | Small data sets |
| σ² = (1/N) Σ fi (xi − x̄)² | Variance of grouped data | Frequency tables |
| σ = (1/N) √[ N Σ fi xi² − (Σ fi xi)² ] | Standard deviation shortcut | Avoids finding the mean first |
| σ = (h/N) √[ N Σ fi yi² − (Σ fi yi)² ], yi = (xi − A)/h | Step-deviation standard deviation | Large class values, equal width |
| C.V. = (σ ÷ x̄) × 100 | Coefficient of variation | Comparing two different data sets |
Important: the standard deviation shortcut formula is the single most-tested tool from this chapter in both CBSE Boards and CUET, because it removes the messy decimal mean.
Key Definitions and Theorems in the Statistics Chapter
Beyond the formulas, a few named terms and results carry marks in the reasoning-style questions. These are the definitions the class 11 maths notes chapter 13 statistics expect students to state precisely.
- Dispersion: the degree to which numerical data spreads about an average value.
- Range: the difference between the maximum and minimum values in a data set.
- Mean deviation: the mean of the absolute deviations of observations from a central value (mean or median).
- Variance: the mean of the squared deviations from the mean, written σ².
- Standard deviation: the positive square root of the variance, in the same unit as the data.
A useful theorem: the standard deviation is not changed by adding a constant to every observation, but it is multiplied by |k| if every observation is multiplied by k. This property appears often in short reasoning questions.
Coefficient of Variation and Analysis of Frequency Distributions
Two data sets in different units, or with very different means, cannot be compared by standard deviation alone. The coefficient of variation solves this by turning the spread into a percentage of the mean. It is a relative, unit-free measure of dispersion.
- Coefficient of variation: C.V. = (σ ÷ x̄) × 100, where σ is the standard deviation and x̄ is the mean.
- More consistent series: the data set with the lower coefficient of variation is more stable or uniform.
- More variable series: the data set with the higher coefficient of variation is more scattered.
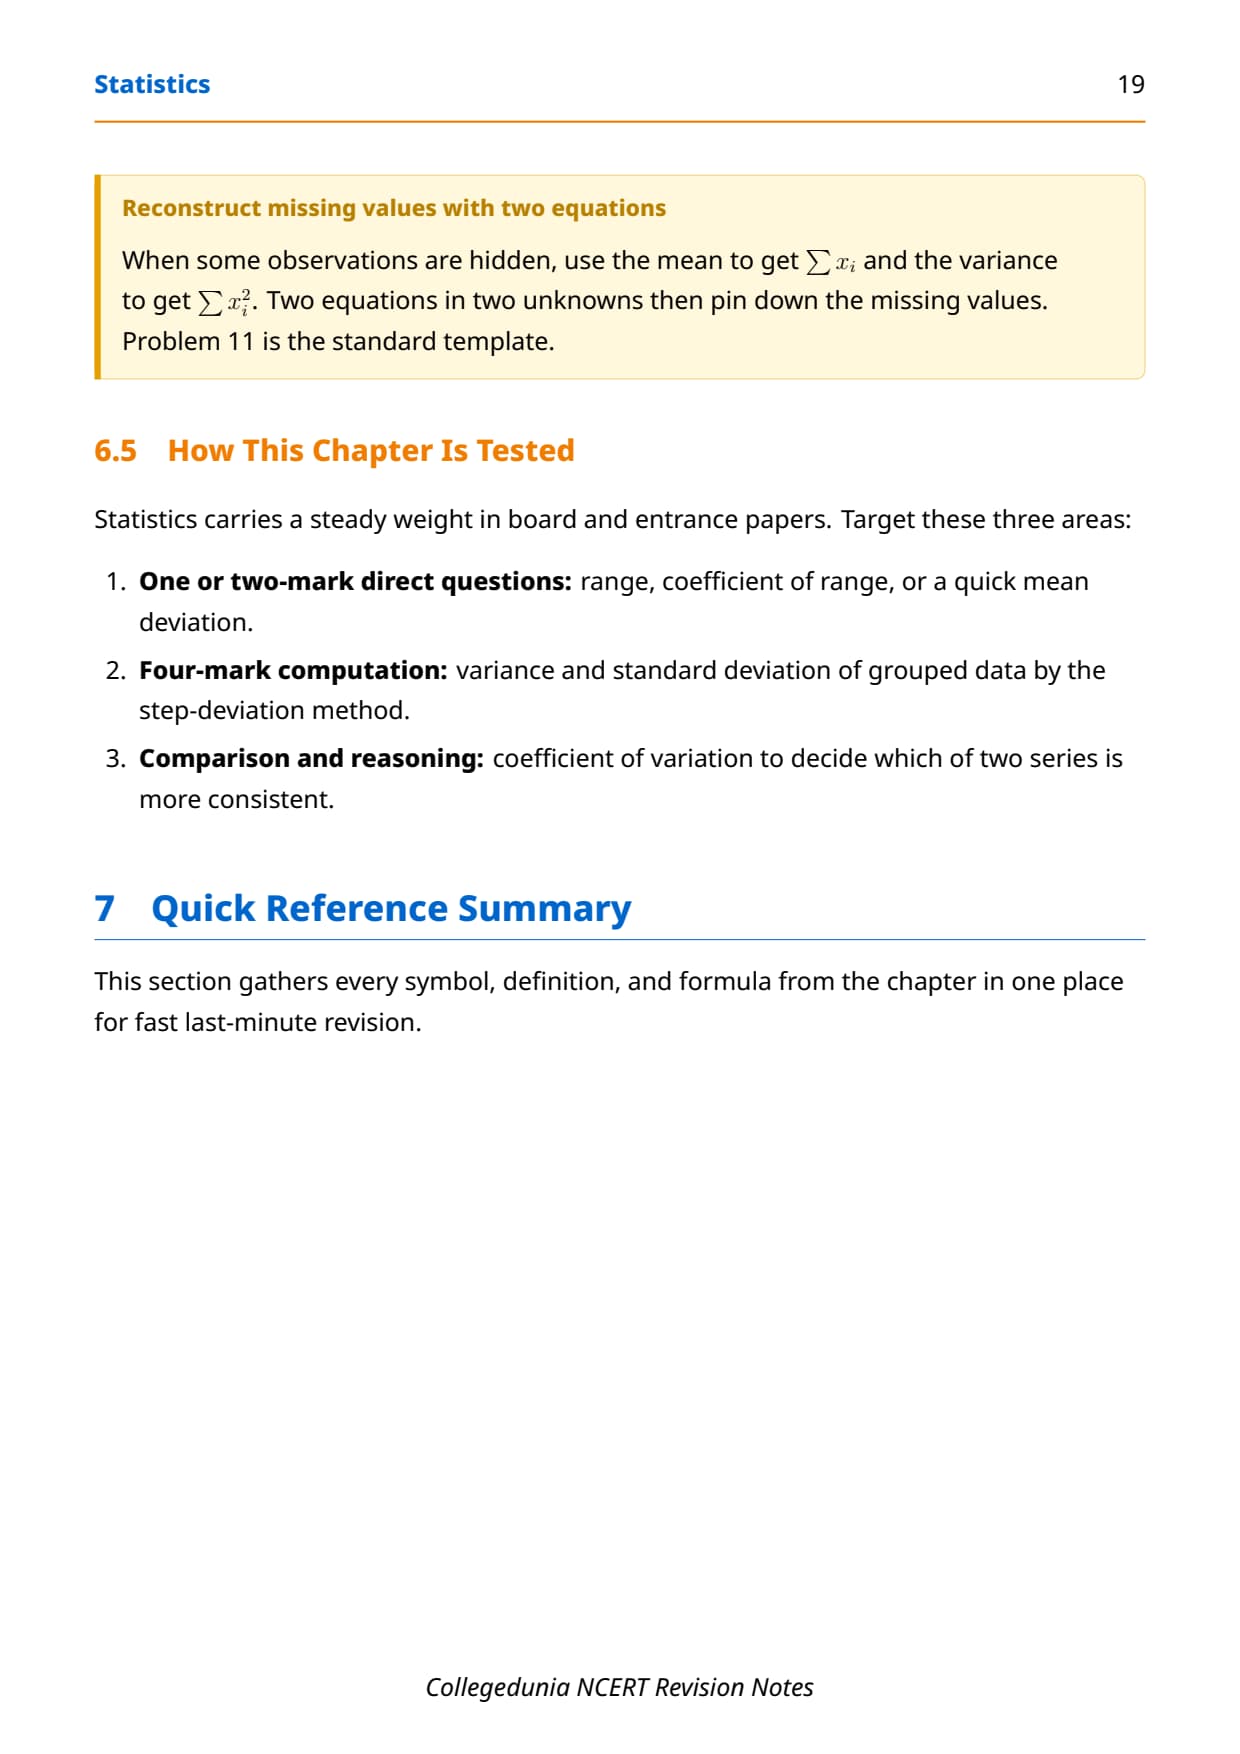
This is the heart of analysis of frequency distributions. A typical board question gives two series, such as the runs of two batsmen or the marks of two classes, and asks which is more consistent. You find each mean and standard deviation, then compare the two coefficients of variation. The smaller C.V. always wins for consistency.
Common Mistakes Students Make in the Statistics Chapter
Mistake 1: Forgetting the absolute value bars in mean deviation. Distances must be positive, so |xi − x̄| never carries a minus sign.
Mistake 2: Confusing variance with standard deviation. Variance is σ²; standard deviation is σ, its square root.
Mistake 3: Dividing by n instead of N = Σ fi in grouped-data problems. Always use the total frequency.
Mistake 4: Reading a higher coefficient of variation as "more consistent". The lower C.V. is the more consistent series.
Each slip costs 1 to 2 marks in the board exam.
Statistics Weightage in CBSE Boards, JEE Main and CUET
Statistics is a scoring chapter because the questions are formula-driven and repetitive. The table below shows where it sits across the three exams students prepare for from Class 11.
| Exam | Typical Weightage | Most-Tested Topic |
|---|---|---|
| CBSE Class 11 Boards | 6 to 8 marks (with Probability) | Standard deviation and variance of grouped data |
| JEE Main | 1 to 2 questions per year | Variance, standard deviation, and mean |
| CUET (UG) Mathematics | 1 to 2 MCQs per paper | Coefficient of variation and mean deviation |
Tip: because standard deviation returns in Class 12 Probability and in the statistics used across science subjects, a strong grip here pays off well beyond Class 11.
How to Revise the Statistics Chapter Quickly
Statistics can be revised in about two hours because most questions follow the same steps. Use the class 11 maths notes chapter 13 statistics in the three-block plan below for a last-minute recap.
- 0 to 40 min: definitions of dispersion, range, mean deviation about the mean and median.
- 40 to 90 min: variance and standard deviation for ungrouped and grouped data, plus the shortcut formula.
- 90 to 120 min: the coefficient of variation and two "which is more consistent" comparison problems.
Finish by working one full grouped-data standard deviation table by hand, since that single question type carries the most marks.
Student Feedback on the Statistics Notes
In a Collegedunia poll of 12,840 Class 11 Maths students conducted before the 2026 boards, 67% of students rated the grouped-data standard deviation table as the trickiest part of the chapter, ahead of the coefficient of variation.
What 12,840 students told us about the Statistics revision journey:
- 67% of students surveyed found the grouped-data standard deviation the hardest sub-topic.
- 59% said they had mixed up variance and standard deviation at least once in a class test.
- 4 out of 5 students revised the formula table the night before the exam.
- Out of 12,840 students, 62% said the shortcut formula saved them time in the exam.
Source: 2026-27 Class 11 Maths student poll. Sample of 12,840 students from CBSE schools across 14 states.
Other Statistics Class 11 Maths Resources
Use these notes together with the linked resources below for the full Statistics study set. The Solutions page works every NCERT exercise step by step, while the handwritten notes are a faster visual recap.
| Resource | What It Gives You |
|---|---|
| NCERT Solutions for Class 11 Maths Statistics | Step-by-step answers to every exercise question |
| Class 11 Maths Statistics Handwritten Notes | Neat handwritten revision notes with formula boxes |
| Class 11 Maths Statistics NCERT Book PDF | The official NCERT chapter PDF to read alongside |
NCERT Notes for Class 11 Maths: All Chapters
| Chapter | Revision Notes |
|---|---|
| Chapter 1 | Sets Notes |
| Chapter 2 | Relations and Functions Notes |
| Chapter 3 | Trigonometric Functions Notes |
| Chapter 4 | Complex Numbers and Quadratic Equations Notes |
| Chapter 5 | Linear Inequalities Notes |
| Chapter 6 | Permutations and Combinations Notes |
| Chapter 7 | Binomial Theorem Notes |
| Chapter 8 | Sequences and Series Notes |
| Chapter 9 | Straight Lines Notes |
| Chapter 10 | Conic Sections Notes |
| Chapter 11 | Introduction to Three Dimensional Geometry Notes |
| Chapter 12 | Limits and Derivatives Notes |
| Chapter 13 | Statistics Notes (this page) |
| Chapter 14 | Probability Notes |
FAQs on Statistics Class 11 Maths Notes
Statistics Notes - Frequently Asked Questions
Ques. What are the main topics in the class 11 maths notes chapter 13 statistics?
Ans. These Statistics notes cover measures of dispersion, the range, mean deviation about the mean and median for ungrouped and grouped data, variance, standard deviation, the coefficient of variation, and the analysis of frequency distributions.
Ques. What is dispersion in statistics?
Ans. Dispersion is the degree to which data spreads around a central value such as the mean. Two data sets can have the same mean but different spreads, so measures of dispersion like the range, variance, and standard deviation describe that spread.
Ques. How is standard deviation defined?
Ans. Standard deviation σ is the positive square root of the variance σ². For ungrouped data, σ = √[(1/n) Σ (xi − x̄)²]. It measures spread in the same unit as the data, so a larger σ means the values are more scattered around the mean.
Ques. What is the difference between variance and standard deviation?
Ans. Variance σ² is the mean of the squared deviations from the mean. Standard deviation σ is the square root of the variance. The key difference is the unit: variance is in squared units, while standard deviation returns to the original unit of the data.
Ques. What is the coefficient of variation?
Ans. The coefficient of variation is C.V. = (σ ÷ x̄) × 100, where σ is the standard deviation and x̄ is the mean. It is a unit-free percentage that lets you compare two data sets. The series with the lower coefficient of variation is more consistent.
Ques. Why is mean deviation smallest about the median?
Ans. The mean deviation about the median is the smallest possible mean deviation because the sum of absolute distances of the observations is least when measured from the median. So when the central value is not fixed, the median gives the least spread.
Ques. Is the Statistics chapter important for JEE Main and CUET?
Ans. Yes. Statistics usually gives 1 to 2 questions in JEE Main and CUET (UG) Mathematics every year, mostly on variance, standard deviation, and the coefficient of variation. It is a formula-driven, scoring chapter, so it is worth revising fully.
Ques. Where can I download the Class 11 Maths Statistics notes PDF?
Ans. The Statistics notes PDF is available on this page through the download card above. It covers all definitions, the full formula table, mean deviation, standard deviation, and the coefficient of variation, and matches the 2026-27 NCERT chapter.



Comments