




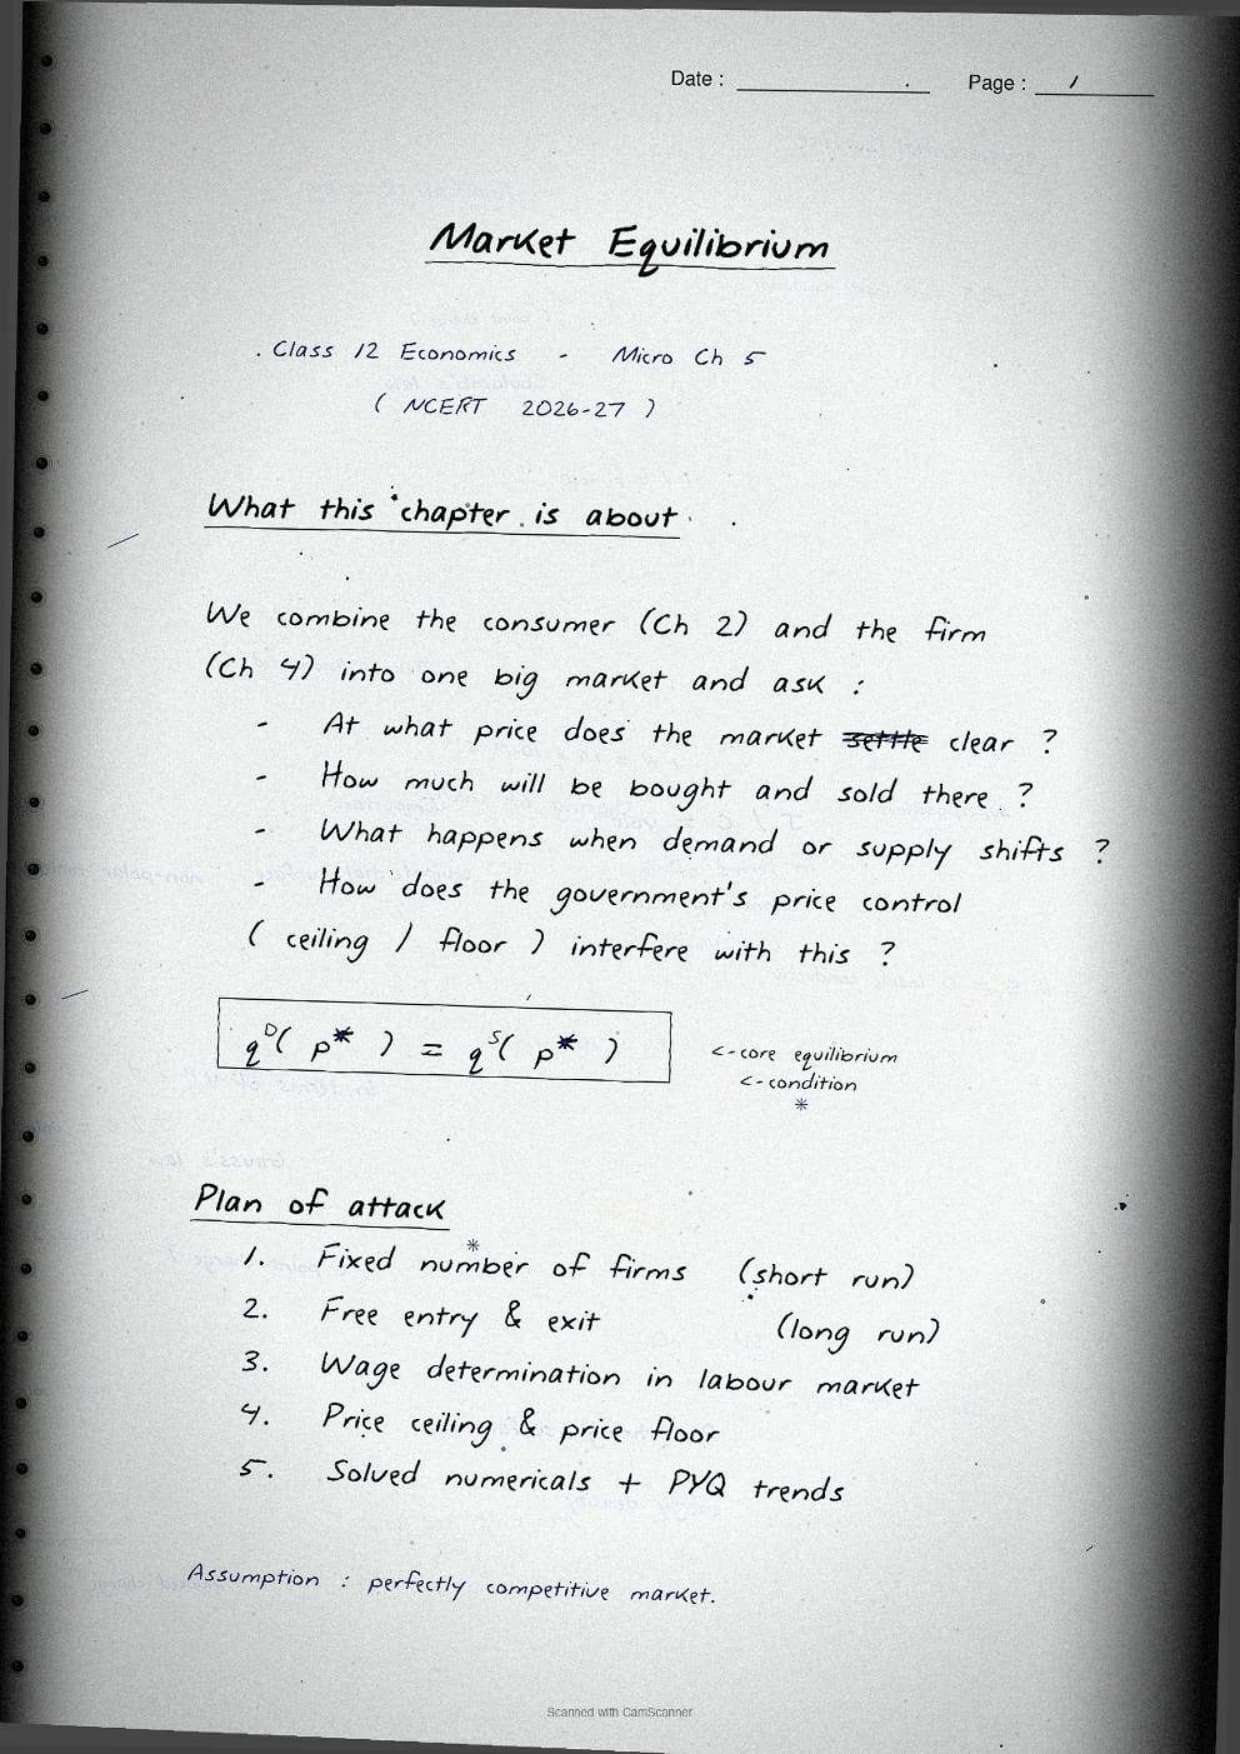
This page hosts the scanned handwritten notes for Class 12 Microeconomics Chapter 5, Market Equilibrium. The notebook covers demand and supply, equilibrium under perfect competition, price ceiling and price floor, and the wheat-market numerical. Download the free PDF below for last-mile board revision.
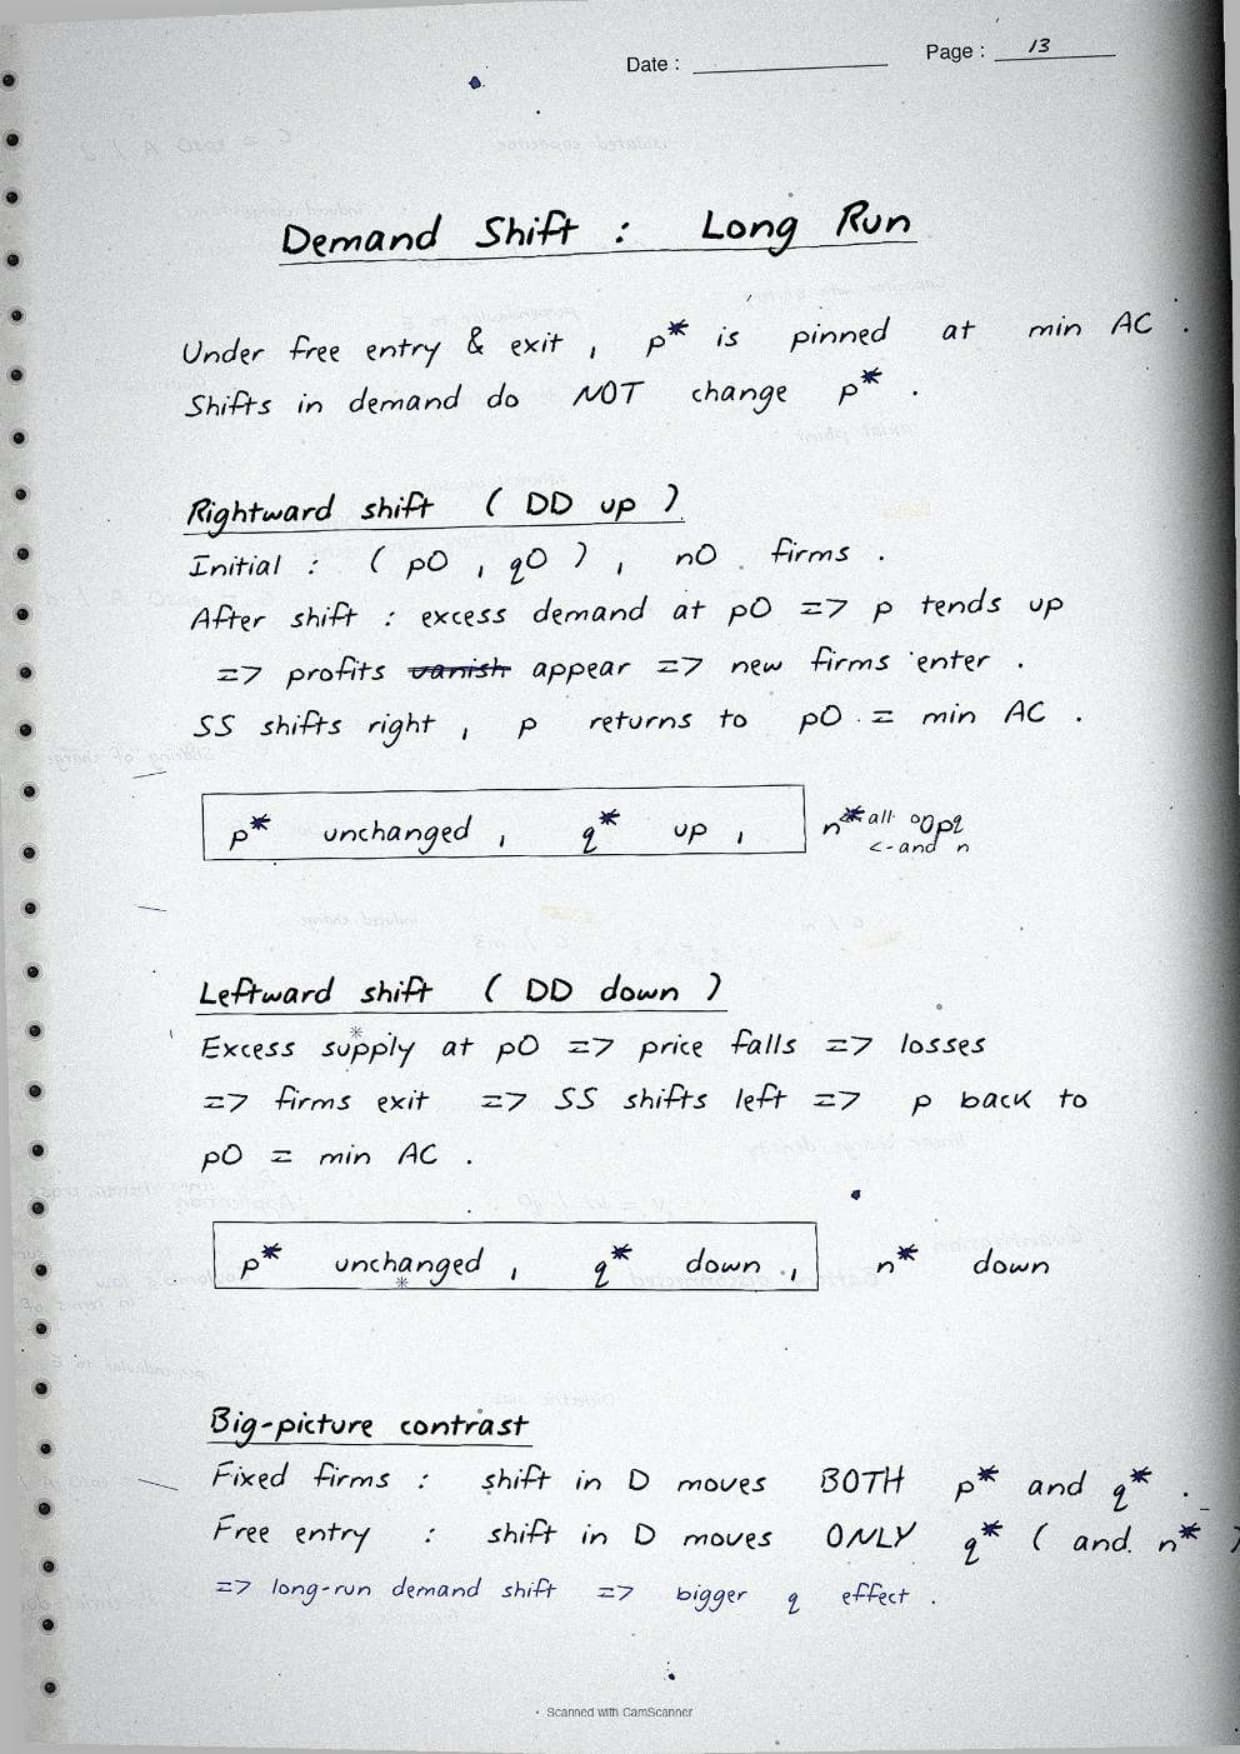
Here is what this chapter is worth in the exam:
- CBSE Boards: about 8 to 10 marks, usually one theory question plus the equilibrium numerical.
- CUET: 2 to 3 questions each year on equilibrium, shifts and price controls.
- Revision time: about 25 minutes with these scanned pages.
What These Market Equilibrium Class 12 Handwritten Notes Cover
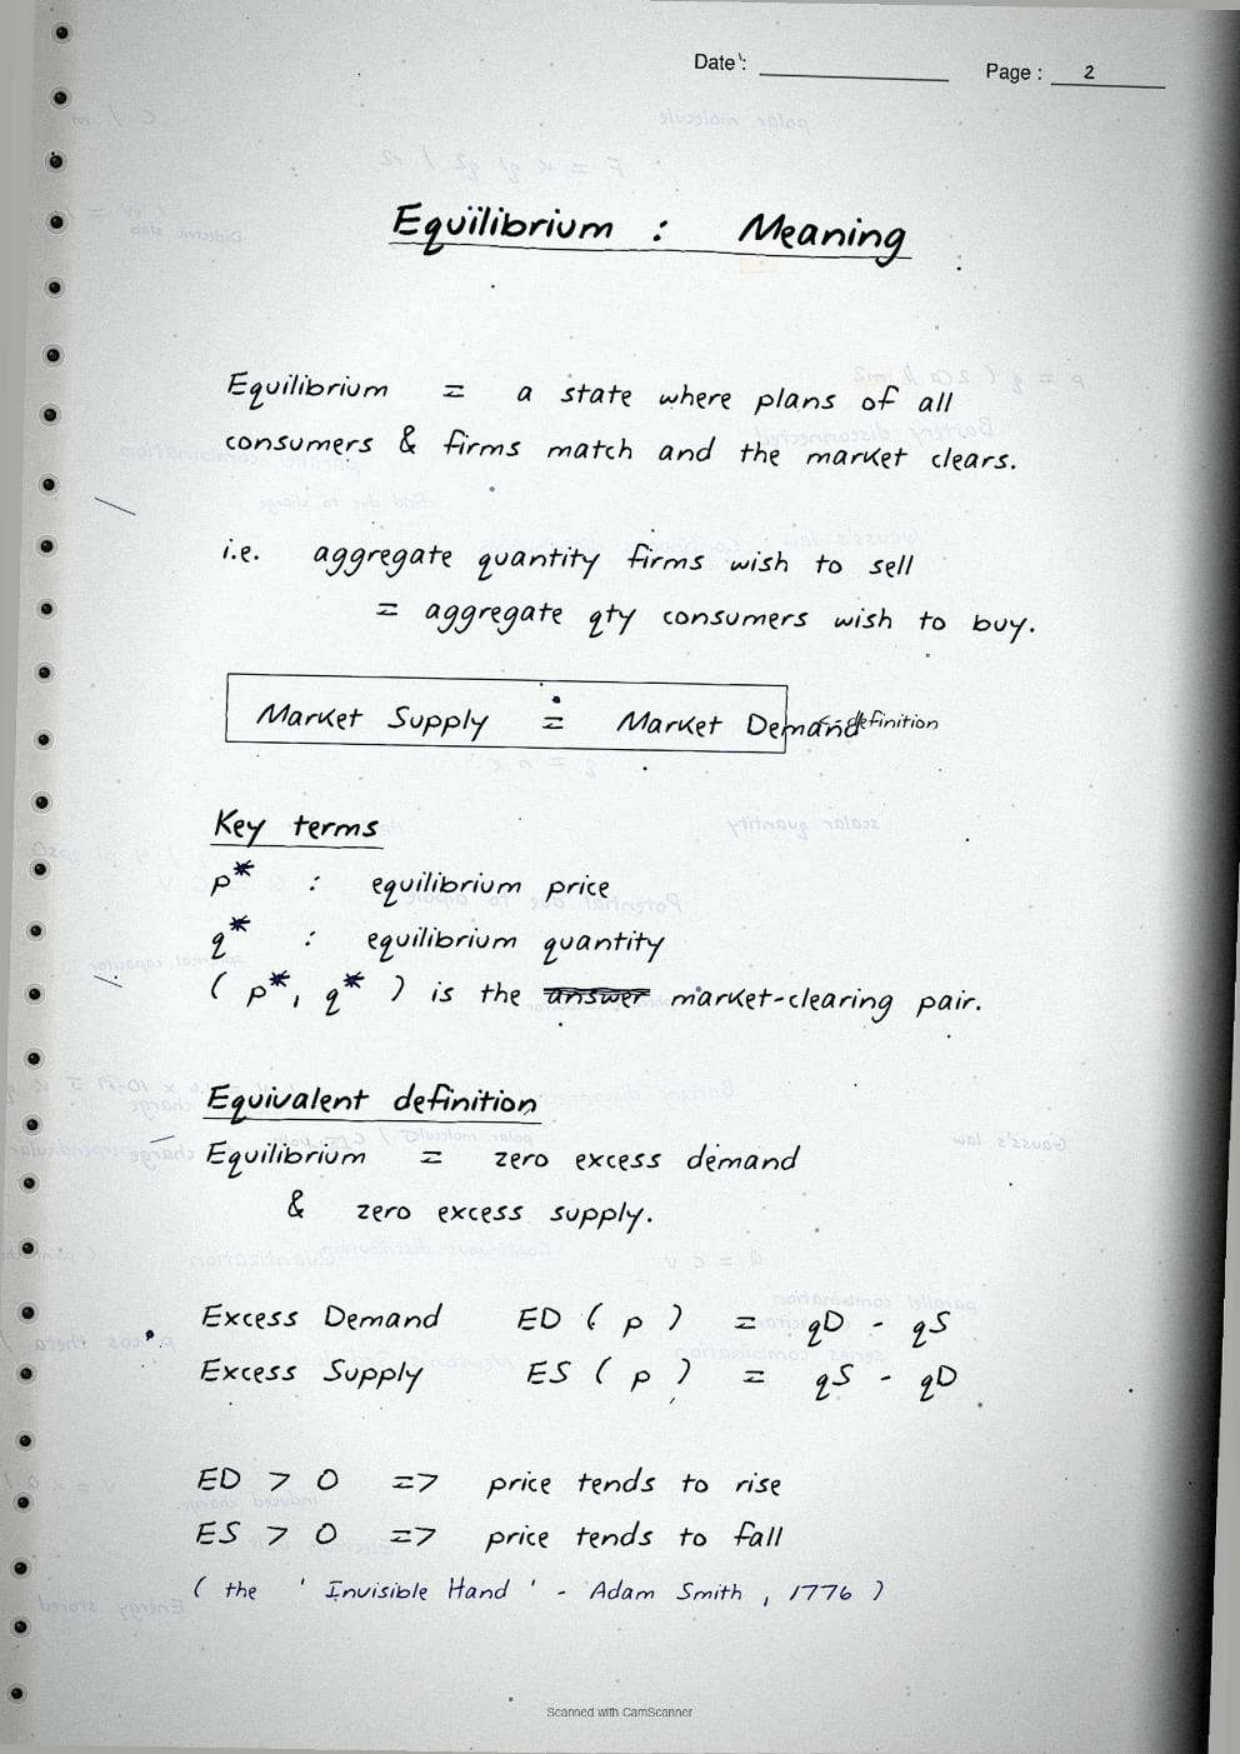
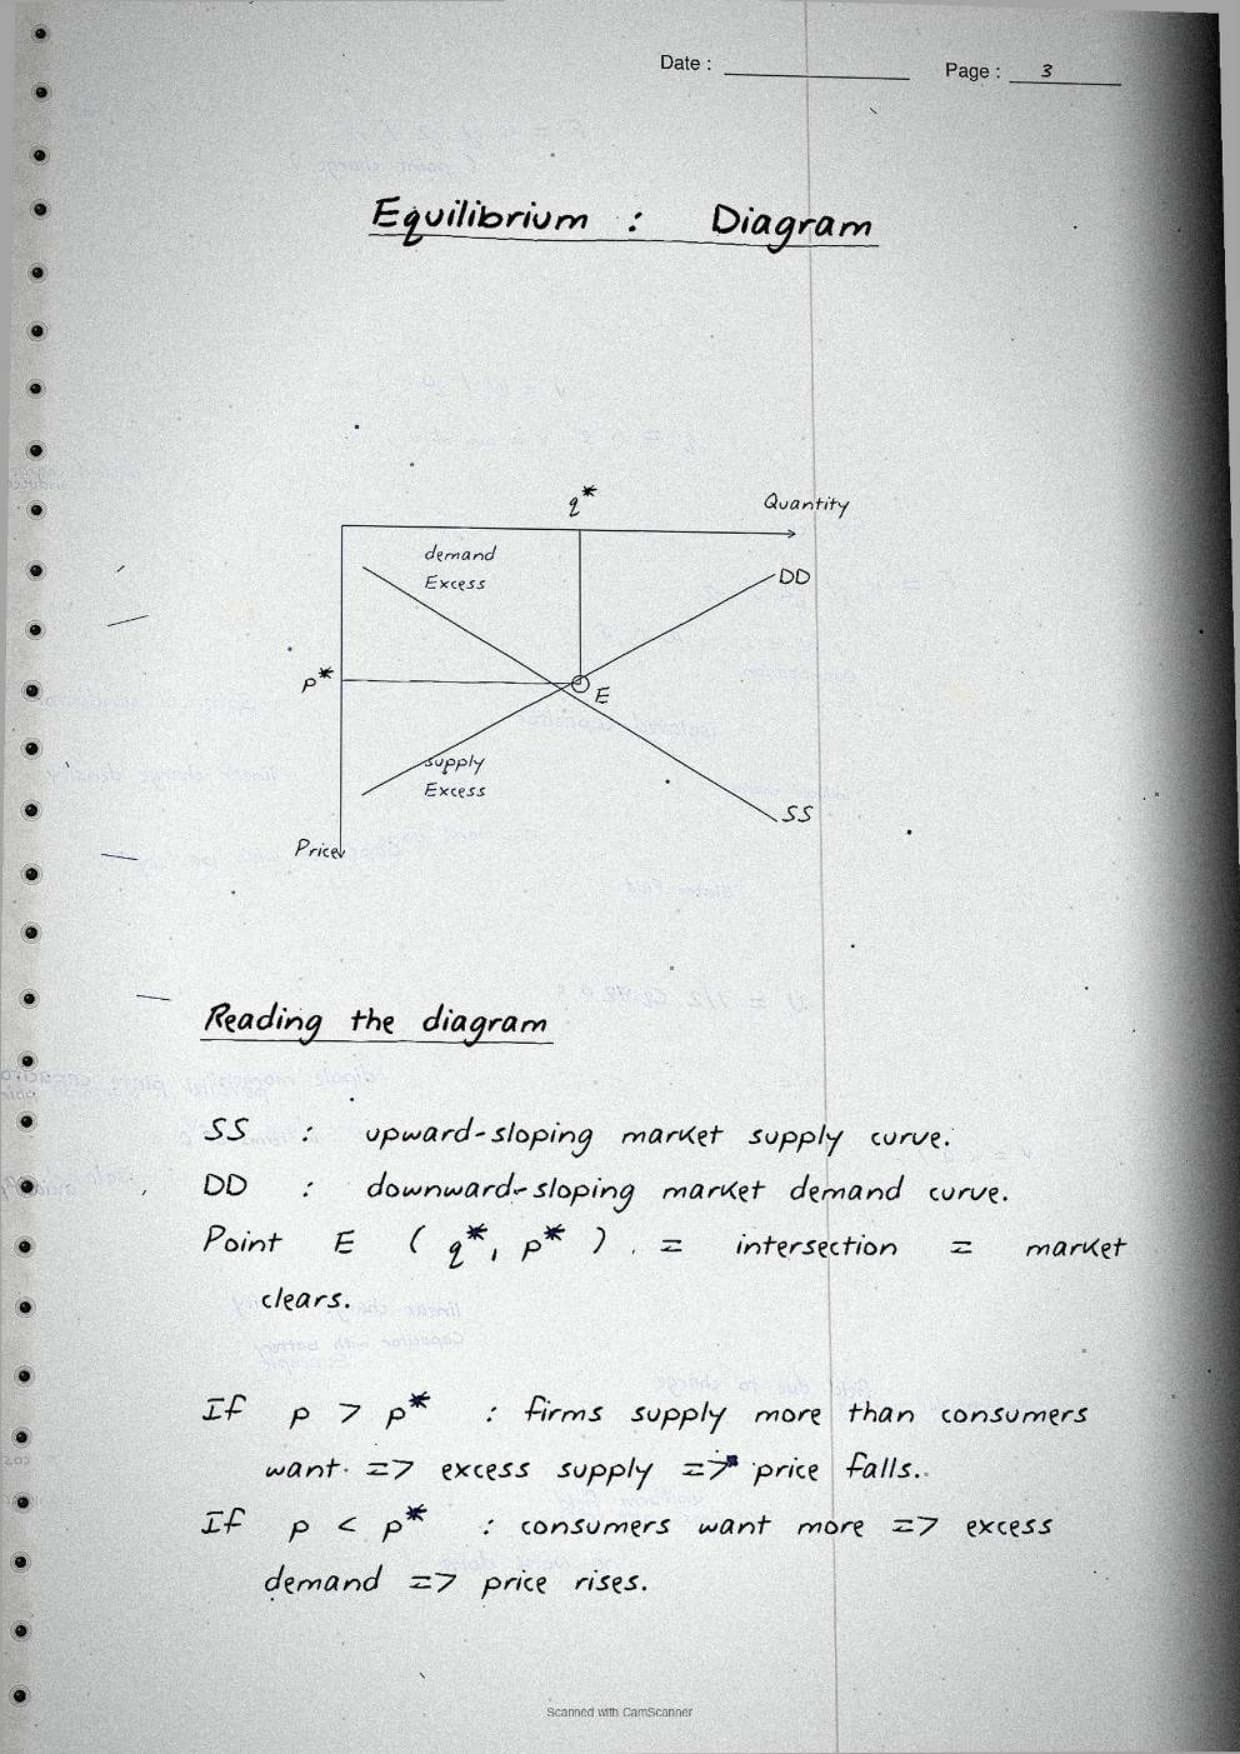
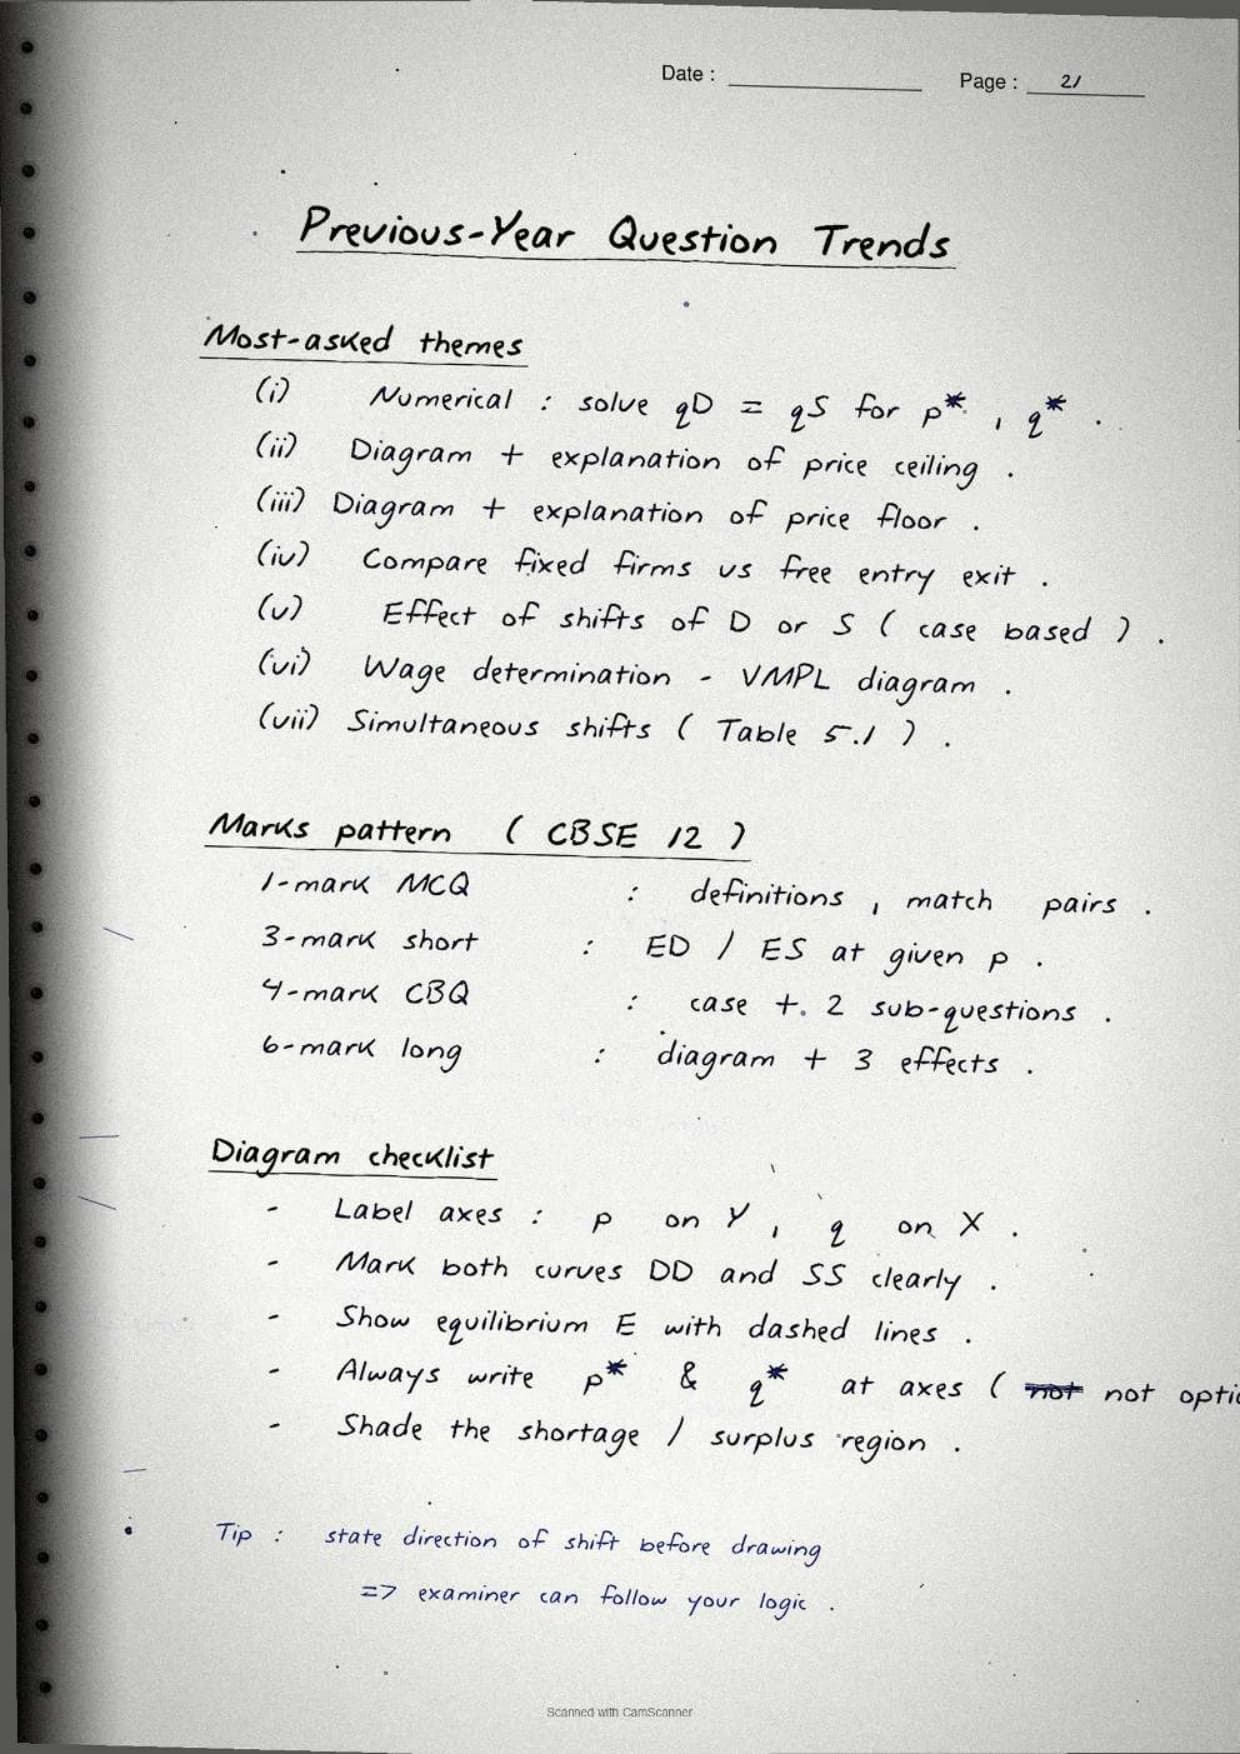
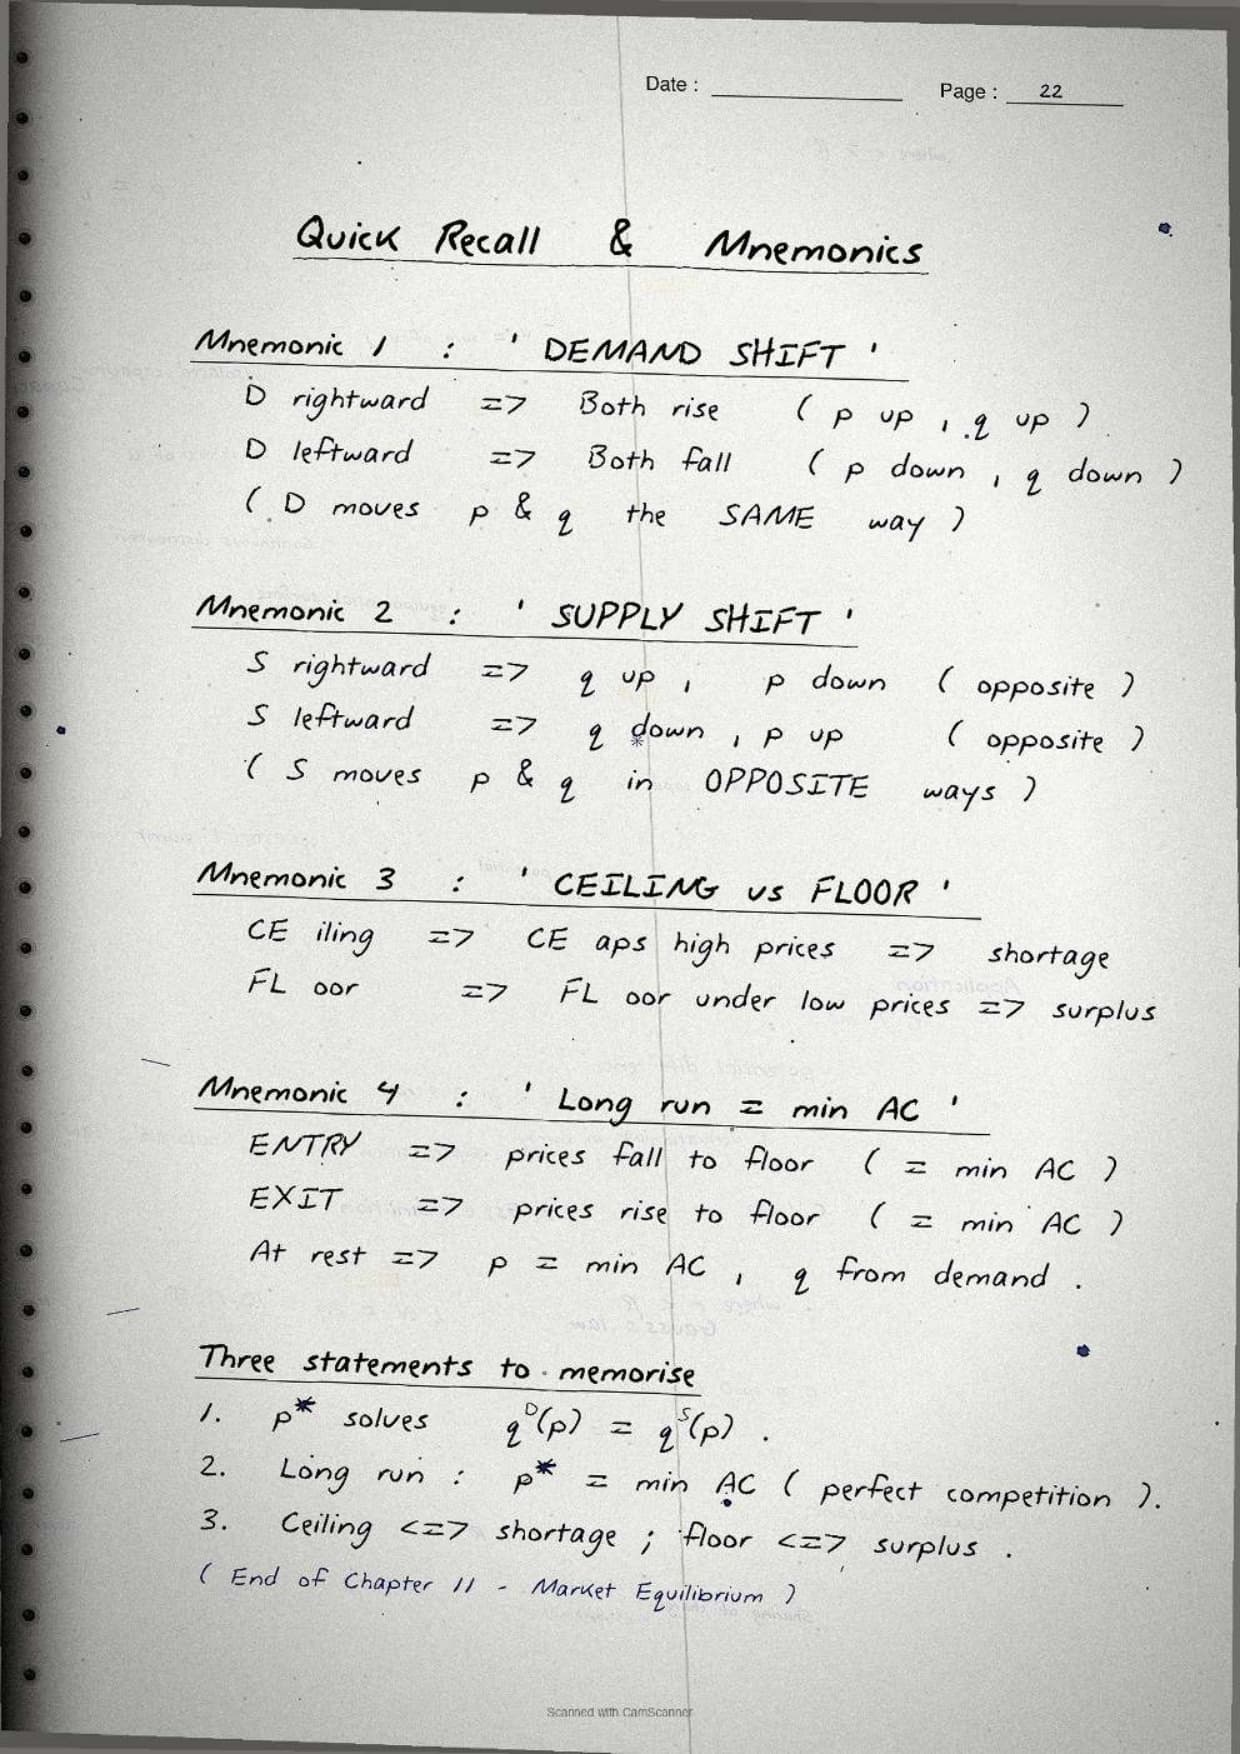
The PDF is a 22-page scanned notebook for NCERT Microeconomics Chapter 5. Every page is in ballpoint pen on ruled paper, with hand-drawn DD and SS curves, equilibrium dots and short margin notes. It is built for quick revision, not first-time learning.
| Pages | What the pages cover | Revision time |
|---|---|---|
| Pages 1-4 | Equilibrium definition, DD/SS curves, the intersection point, excess demand and excess supply. | 6 minutes |
| Pages 5-9 | Shifts in demand and supply, the four standard cases, free entry and exit. | 7 minutes |
| Pages 10-13 | Price ceiling with shortage, price floor with surplus, Indian examples. | 5 minutes |
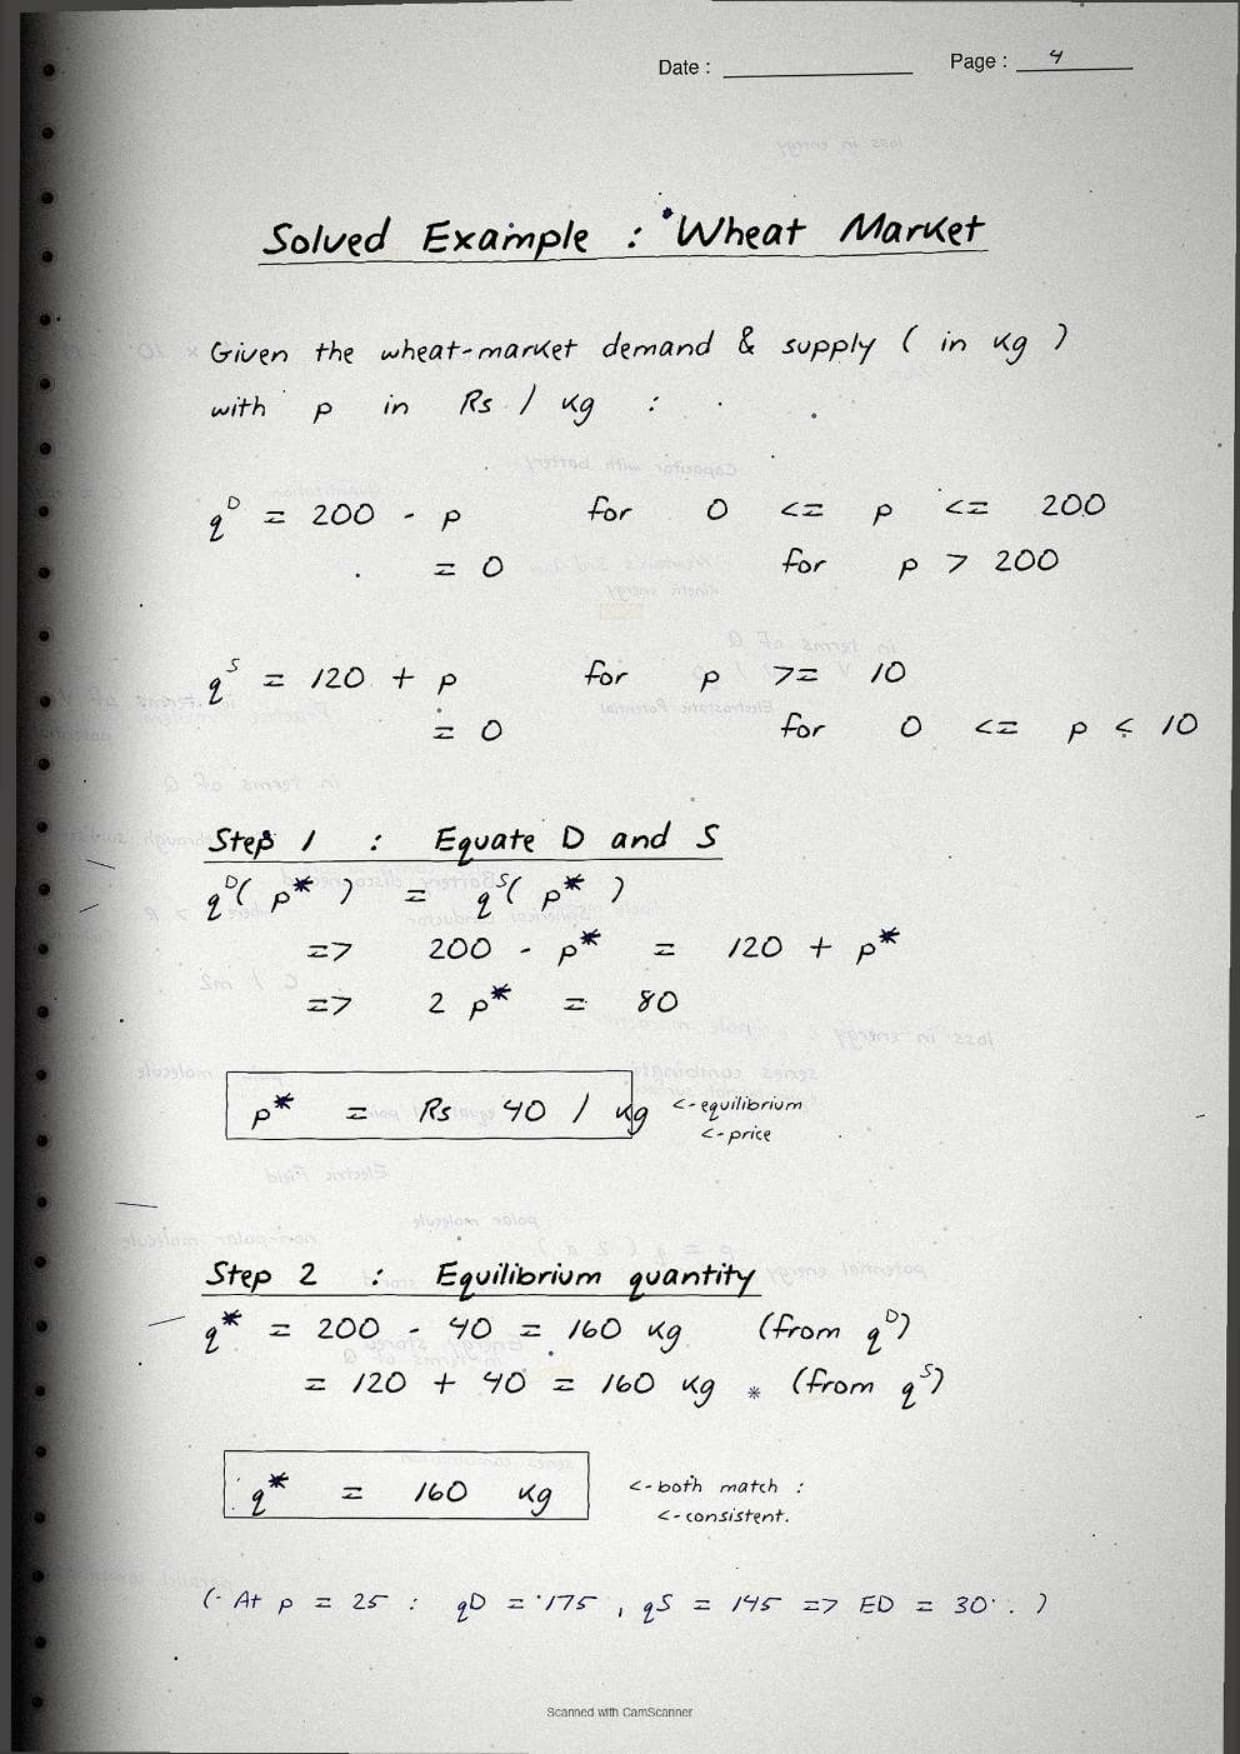
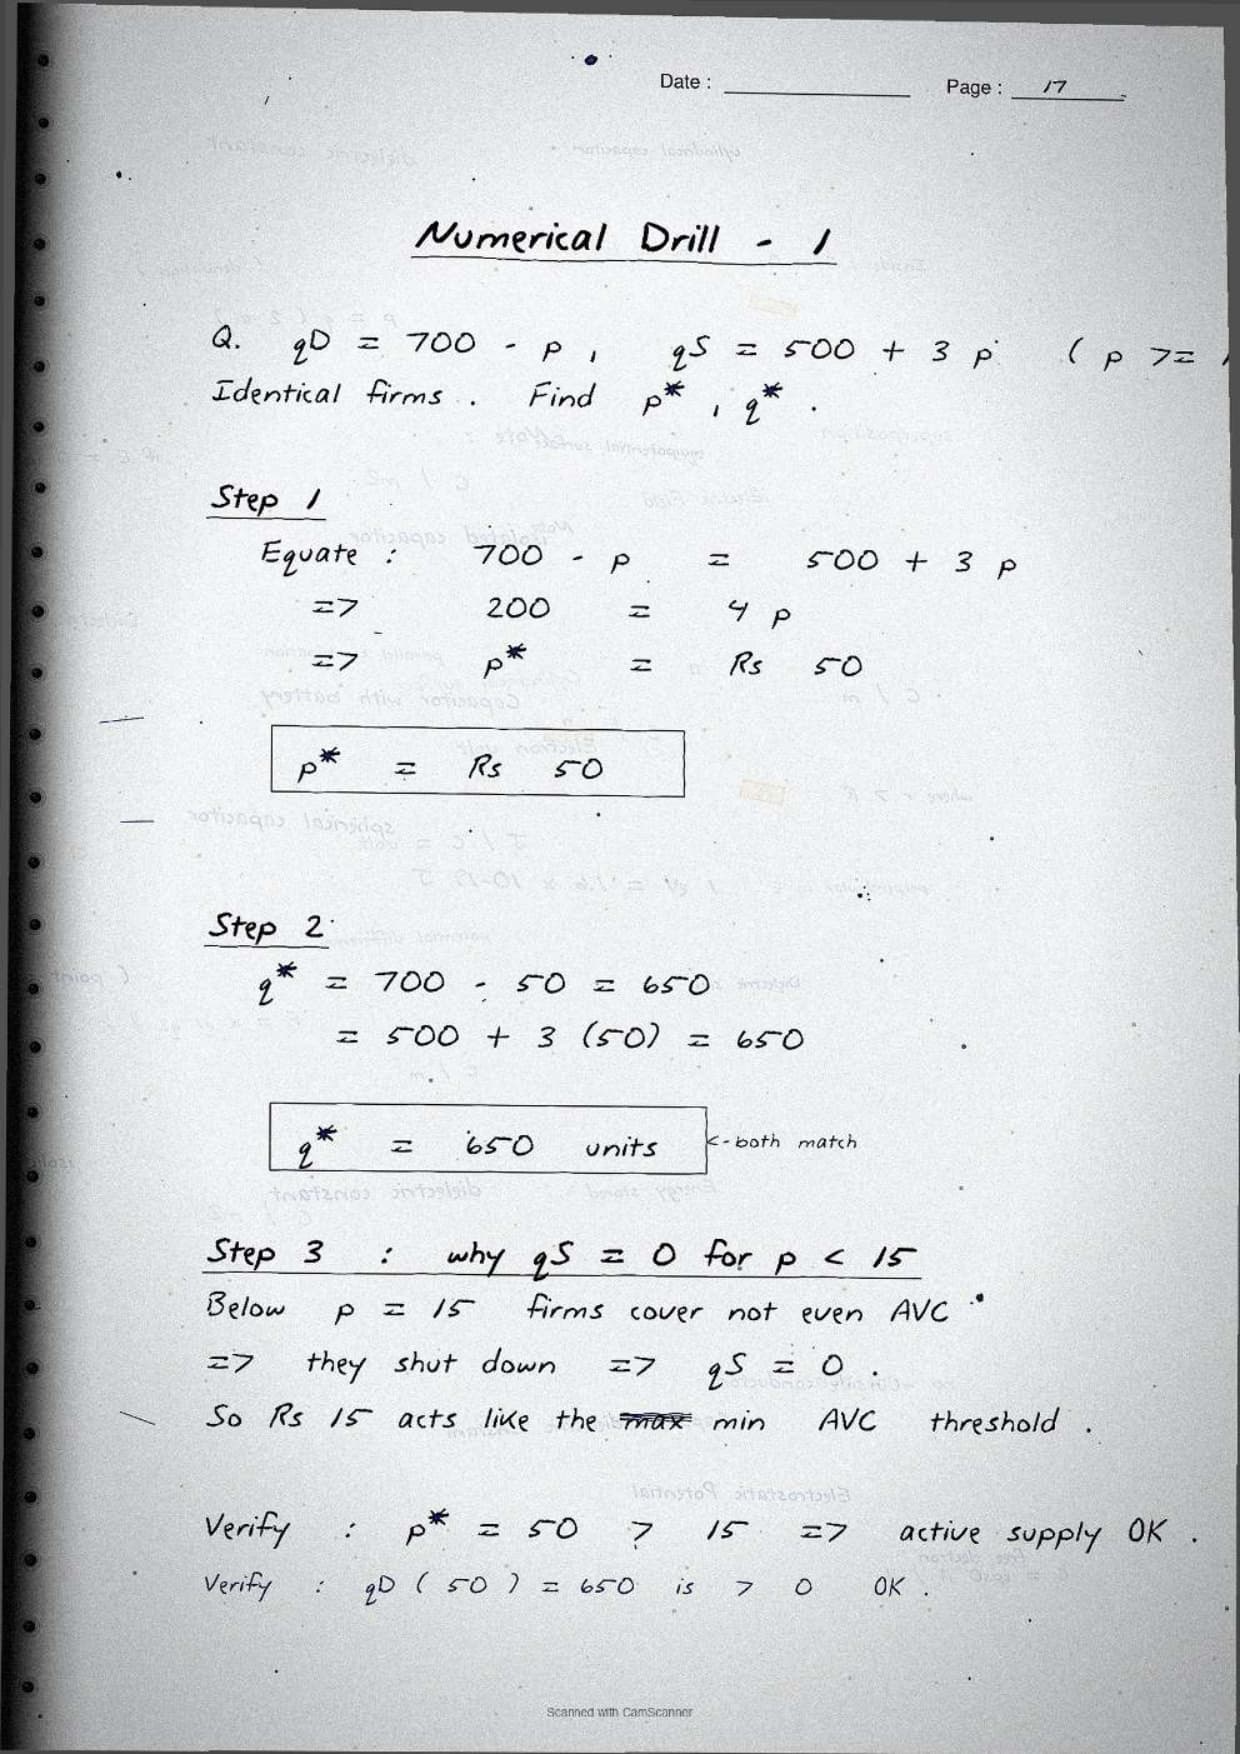
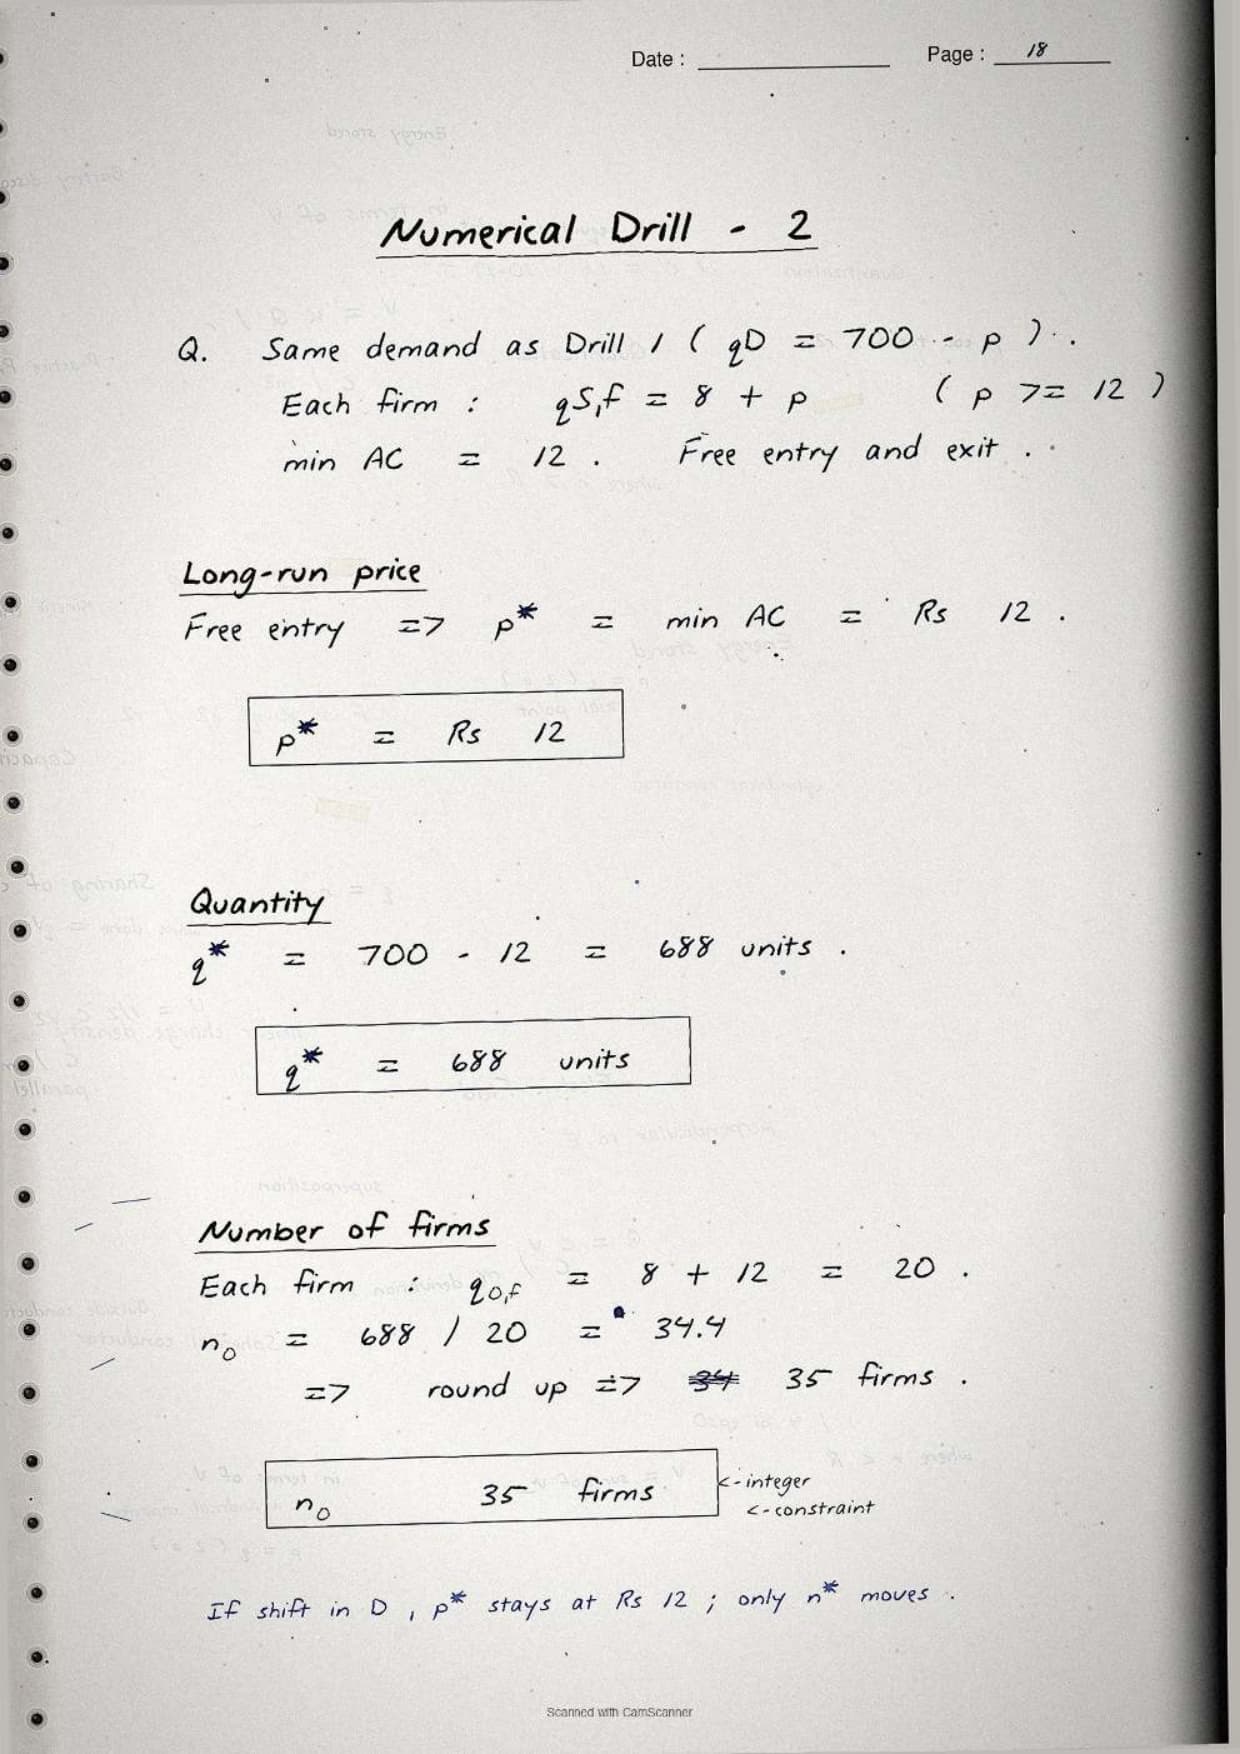
| Pages 14-18 | Wheat-market numerical, equilibrium P and Q from linear DD/SS, the cross-check. | 6 minutes |
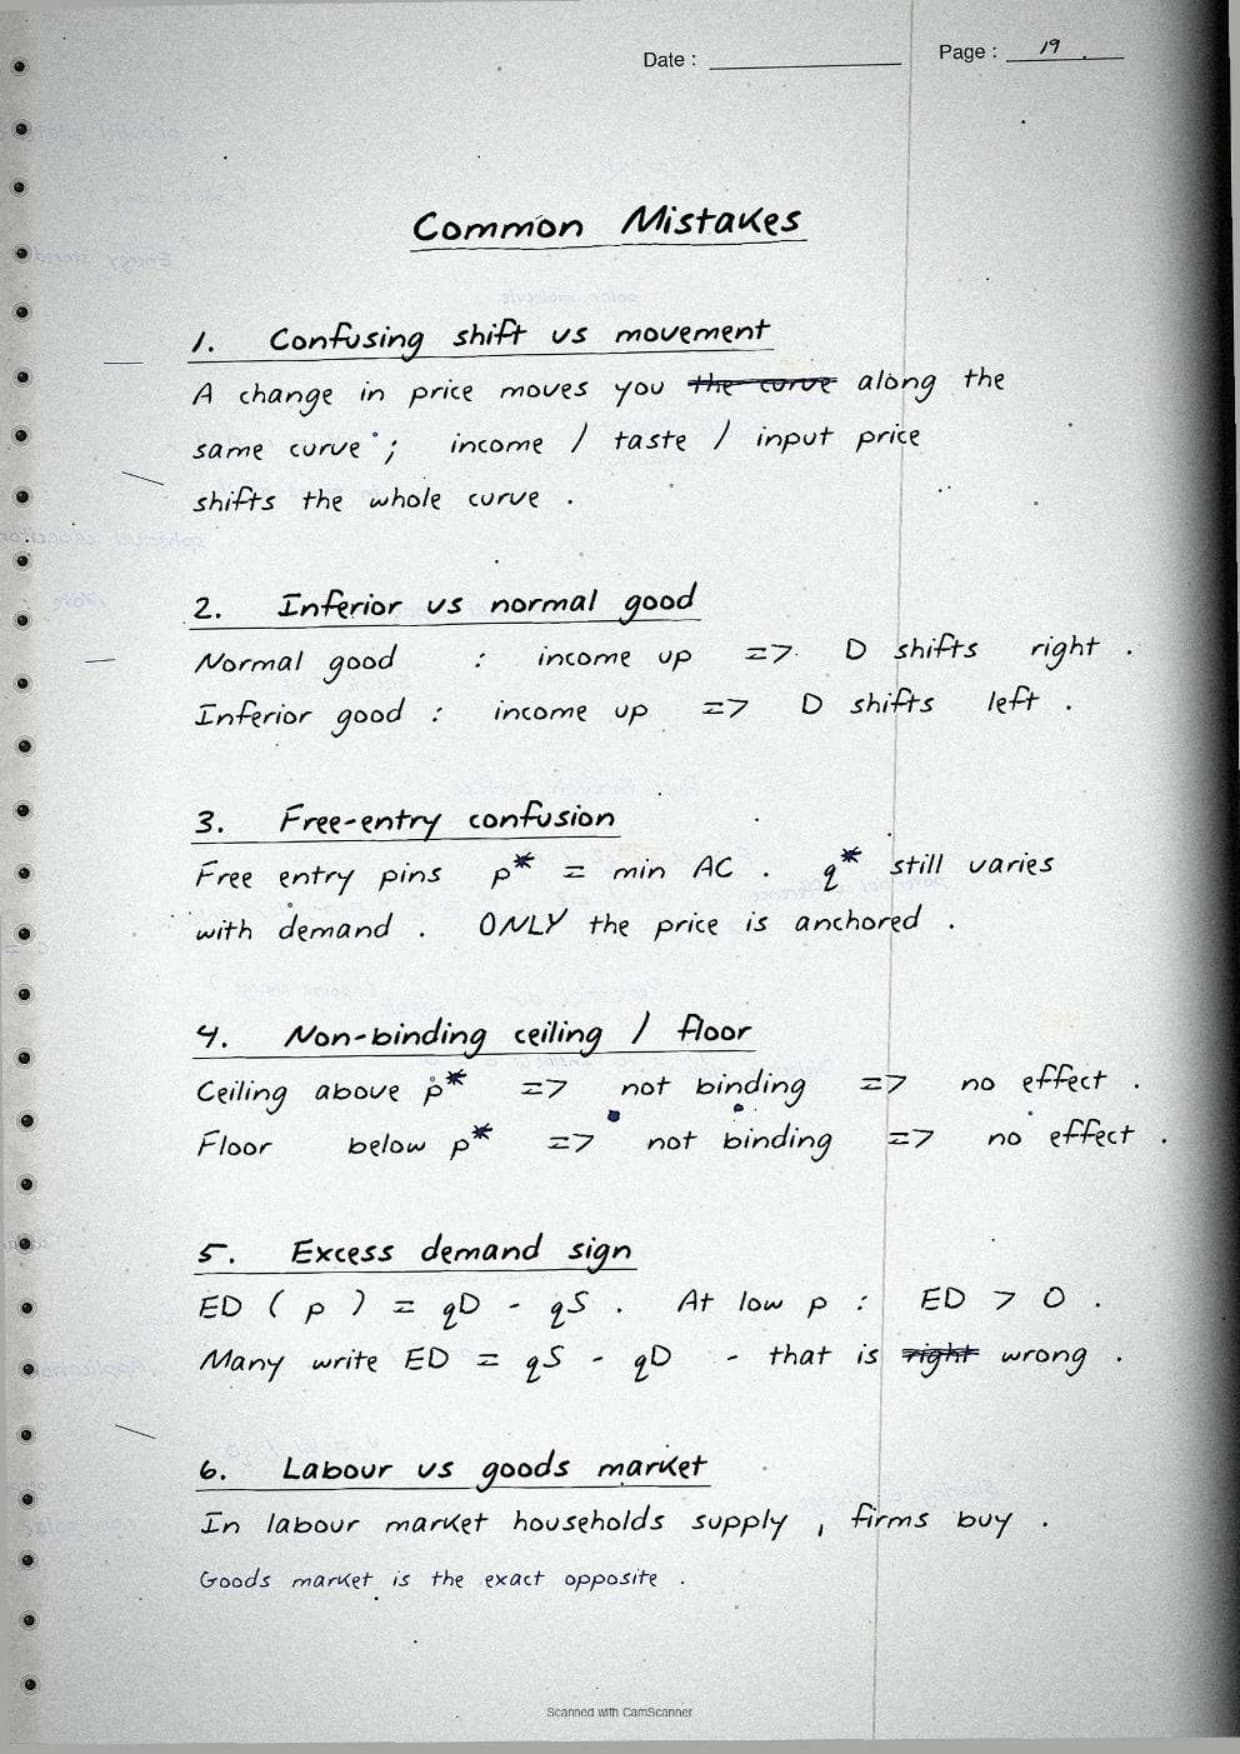
| Pages 19-22 | Wage determination, the labour demand curve and common mistakes. | 5 minutes |

Market Equilibrium under Perfect Competition Class 12 Notes
The whole chapter sits inside perfect competition. The notebook lists the four assumptions (many buyers and sellers, one type of product, free entry and exit, full information). It then finds the equilibrium price where the market demand curve crosses the market supply curve.
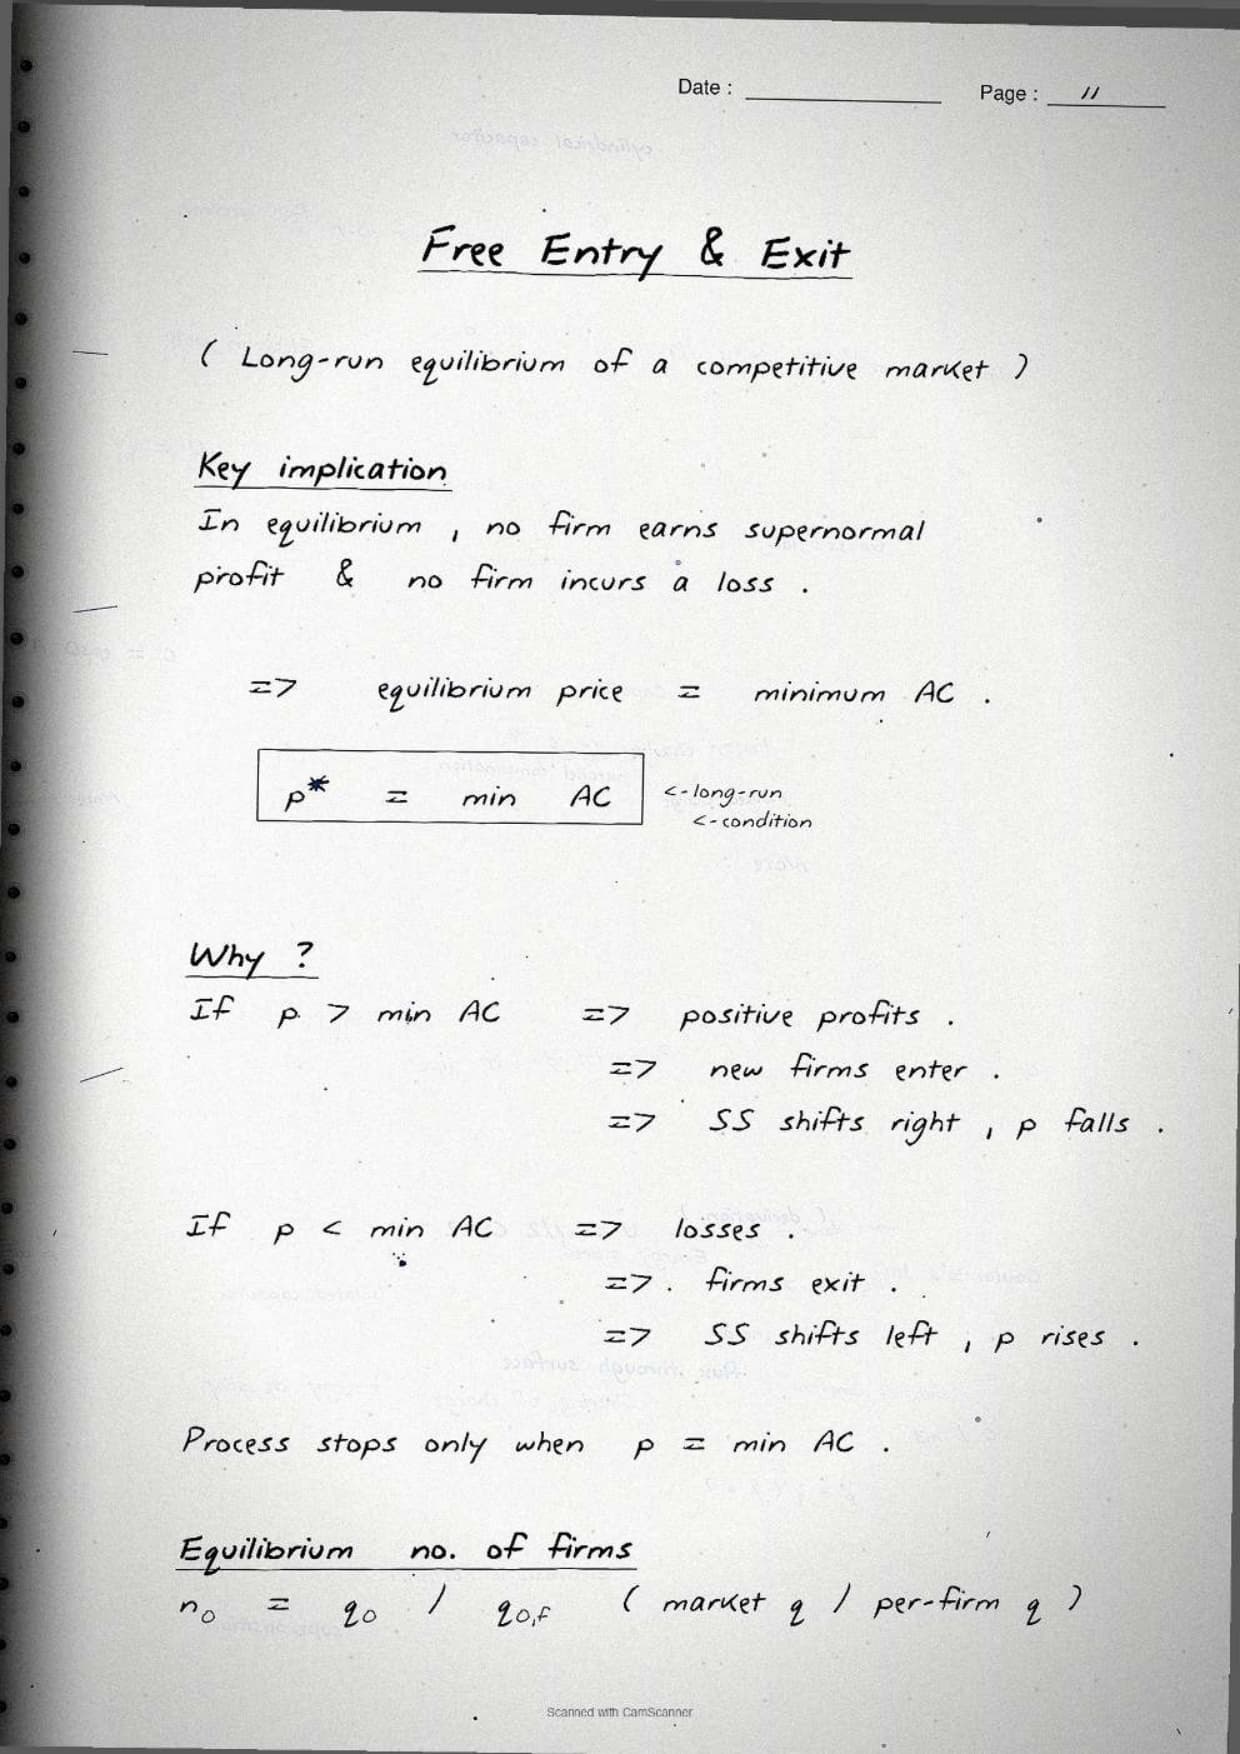
In the short run the number of firms is fixed, so P* can be above or below a firm's break-even price. In the long run, free entry and exit push every firm to zero economic profit, so P* equals minimum average cost. The board paper almost always sets the equilibrium numerical inside this perfect-competition frame.
Shifts in Demand and Supply in Market Equilibrium Class 12
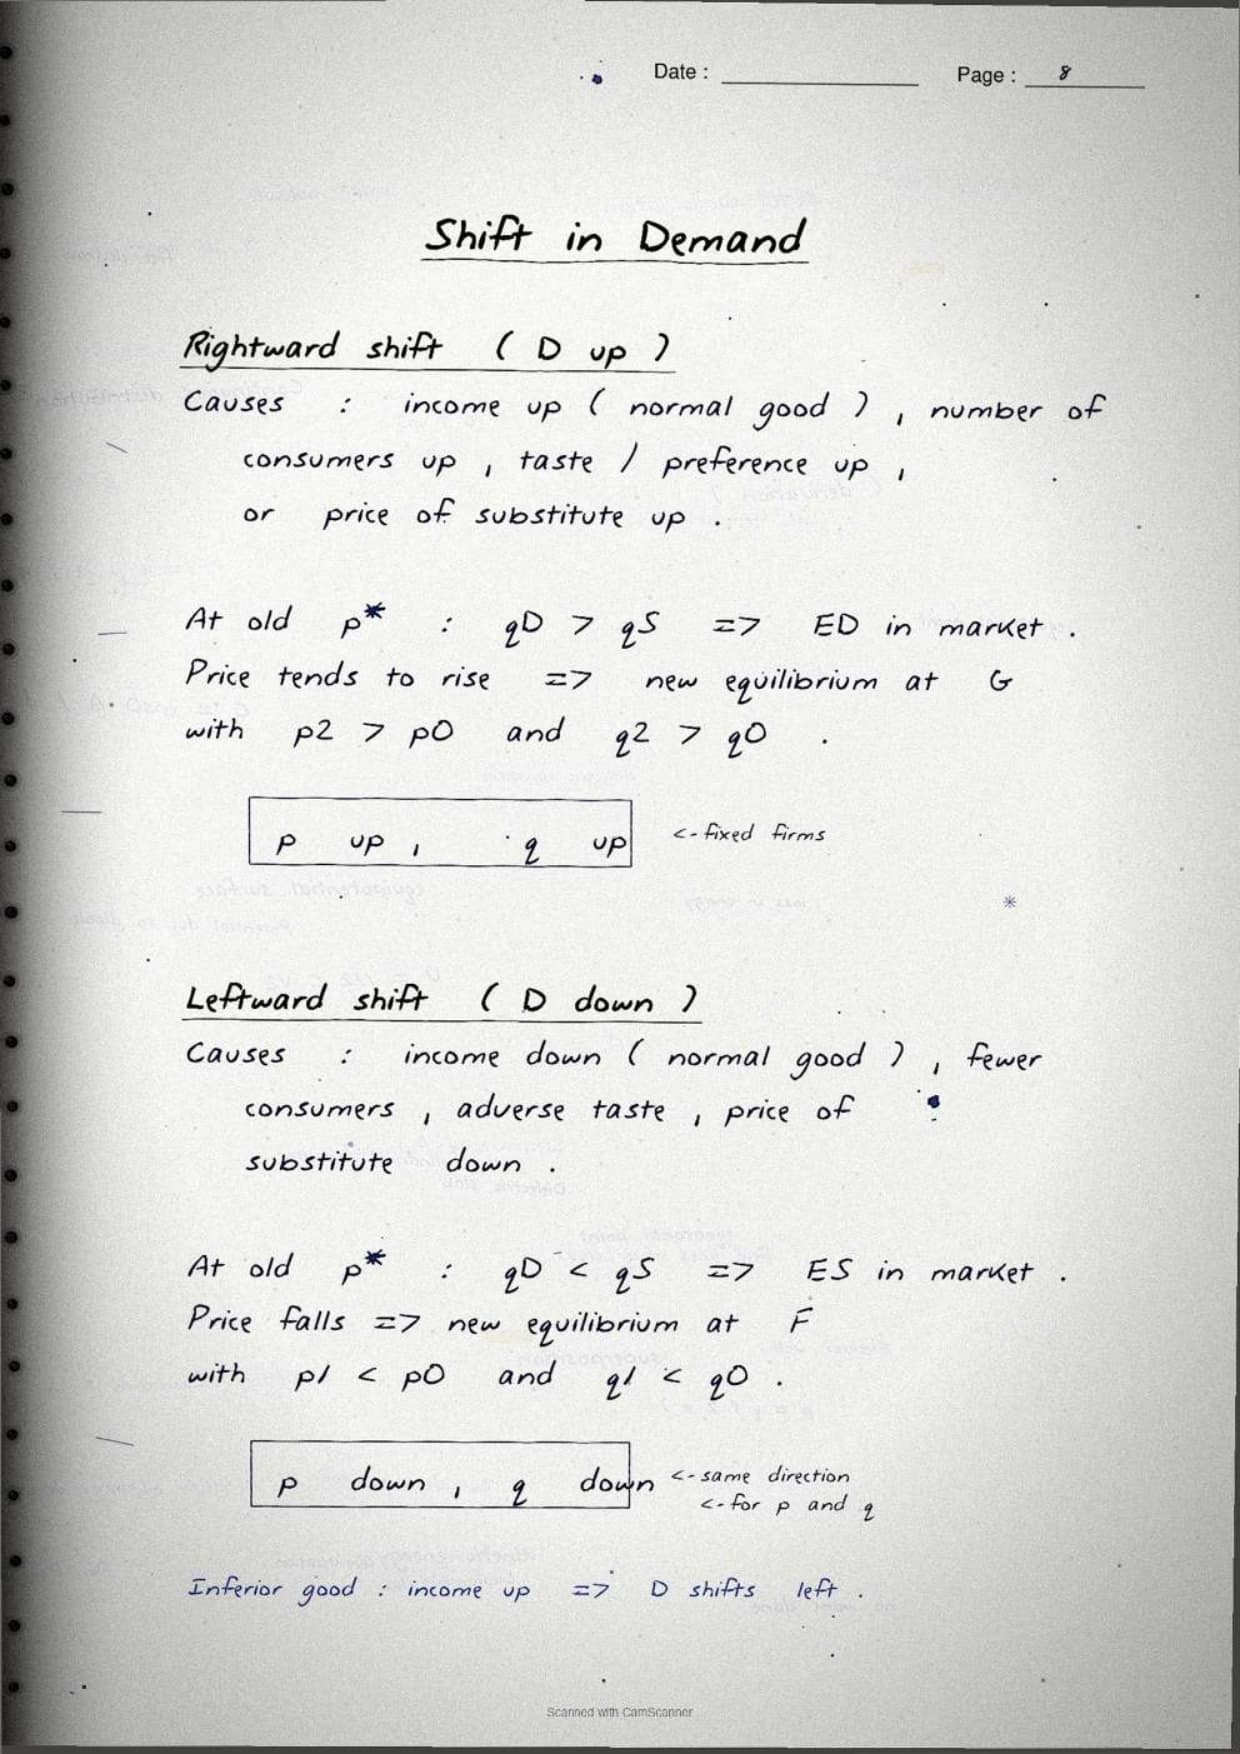
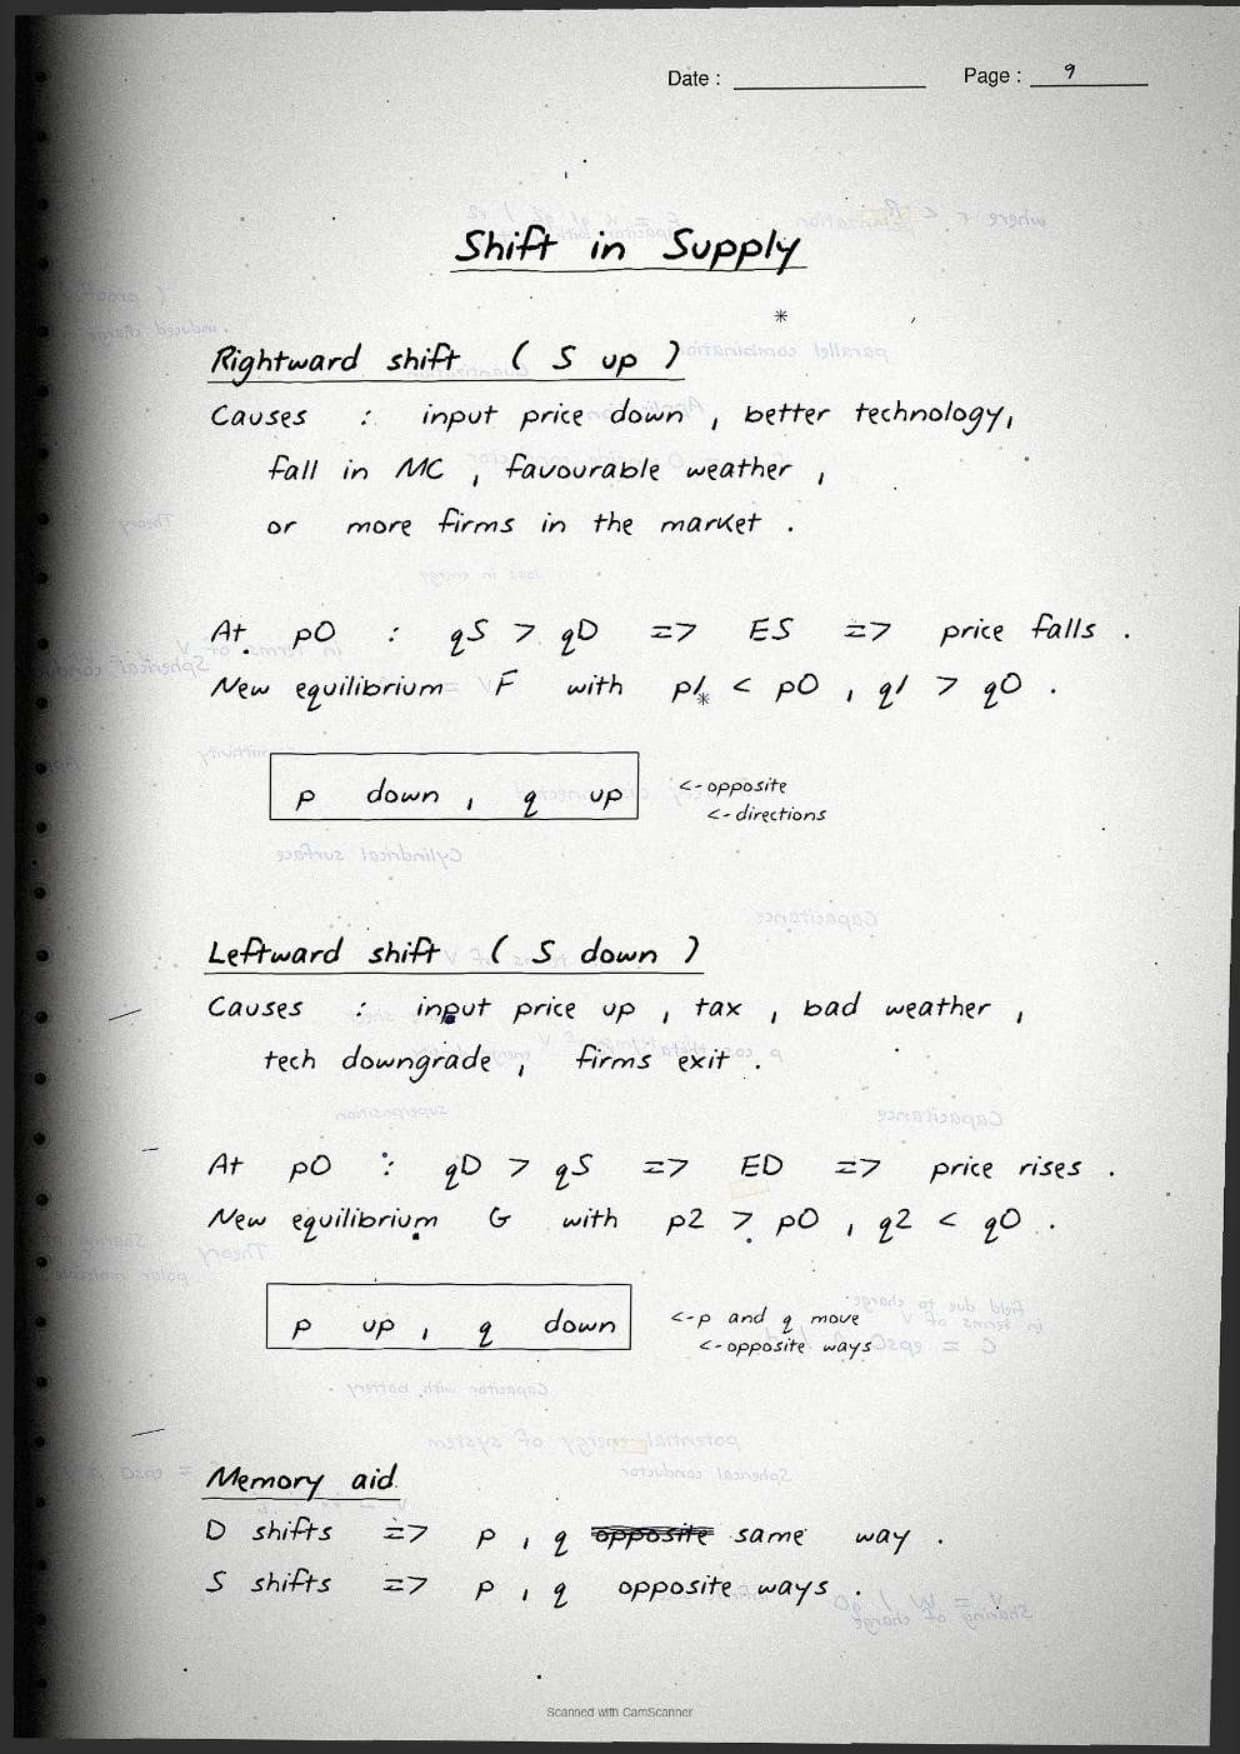
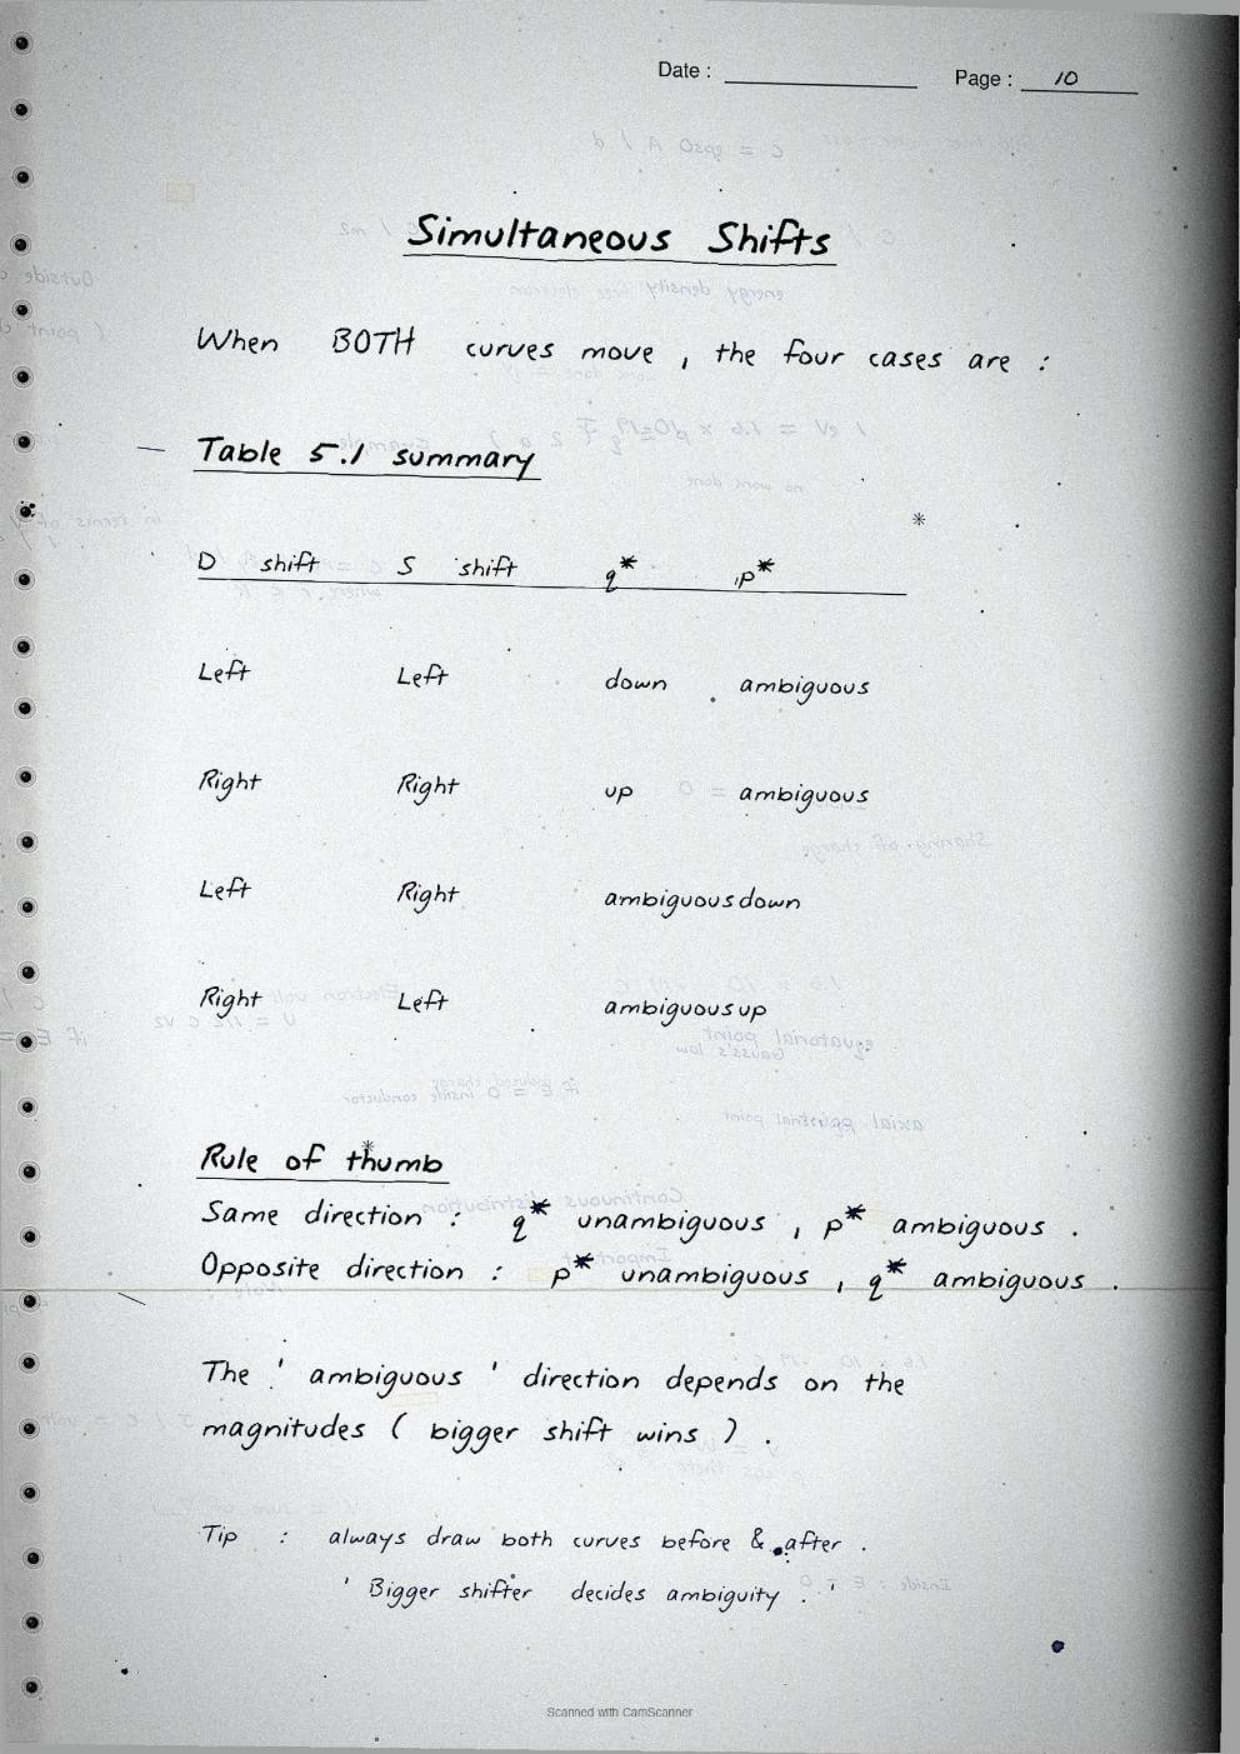
This is the most-tested idea in the chapter. The table shows what happens to P* and Q* when a curve shifts. The last two rows are the ambiguous cases, where you must say which shift is larger.
| Shift | Effect on P* | Effect on Q* |
|---|---|---|
| Demand shifts right | Rises | Rises |
| Demand shifts left | Falls | Falls |
| Supply shifts right | Falls | Rises |
| Supply shifts left | Rises | Falls |
| Both demand and supply rise | Ambiguous | Rises |
| Demand rises, supply falls | Rises | Ambiguous |
Price Ceiling and Price Floor in Market Equilibrium Class 12
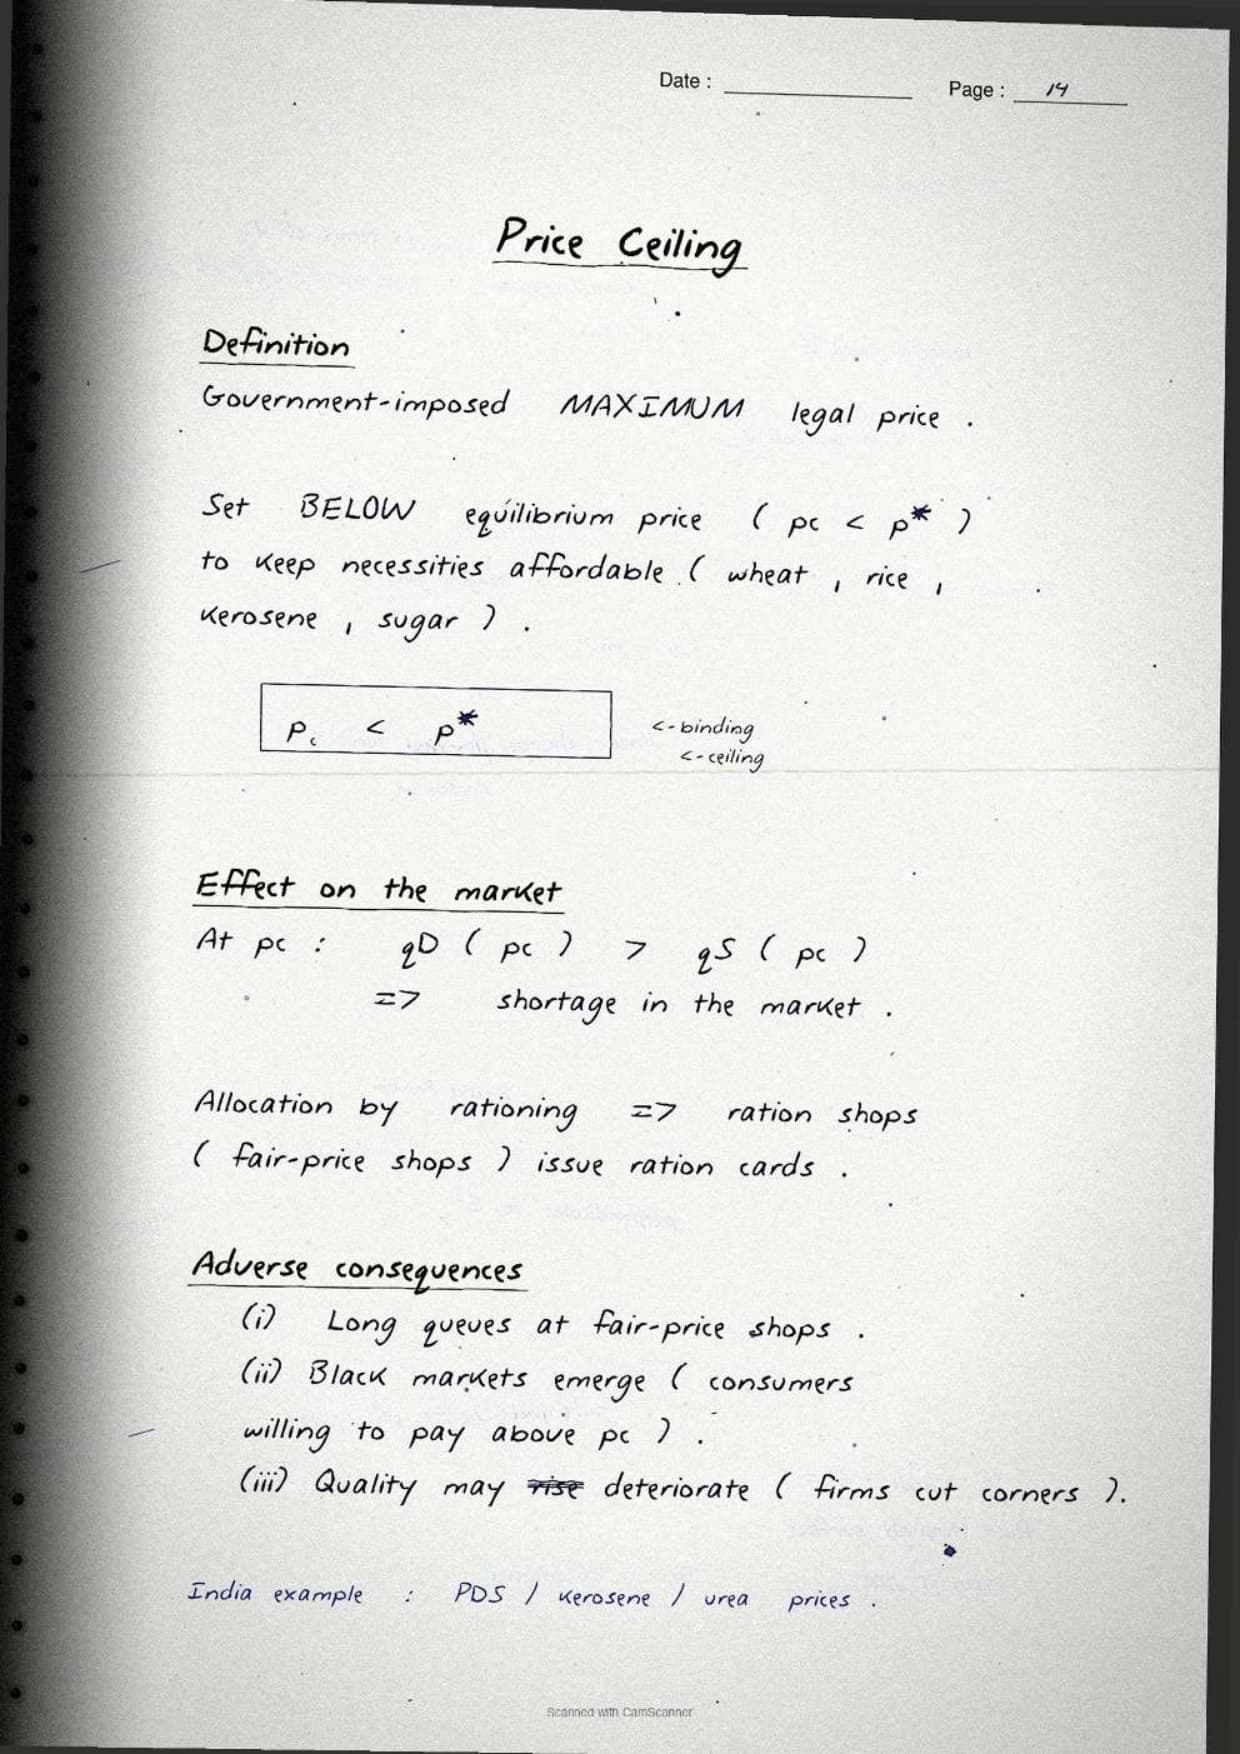
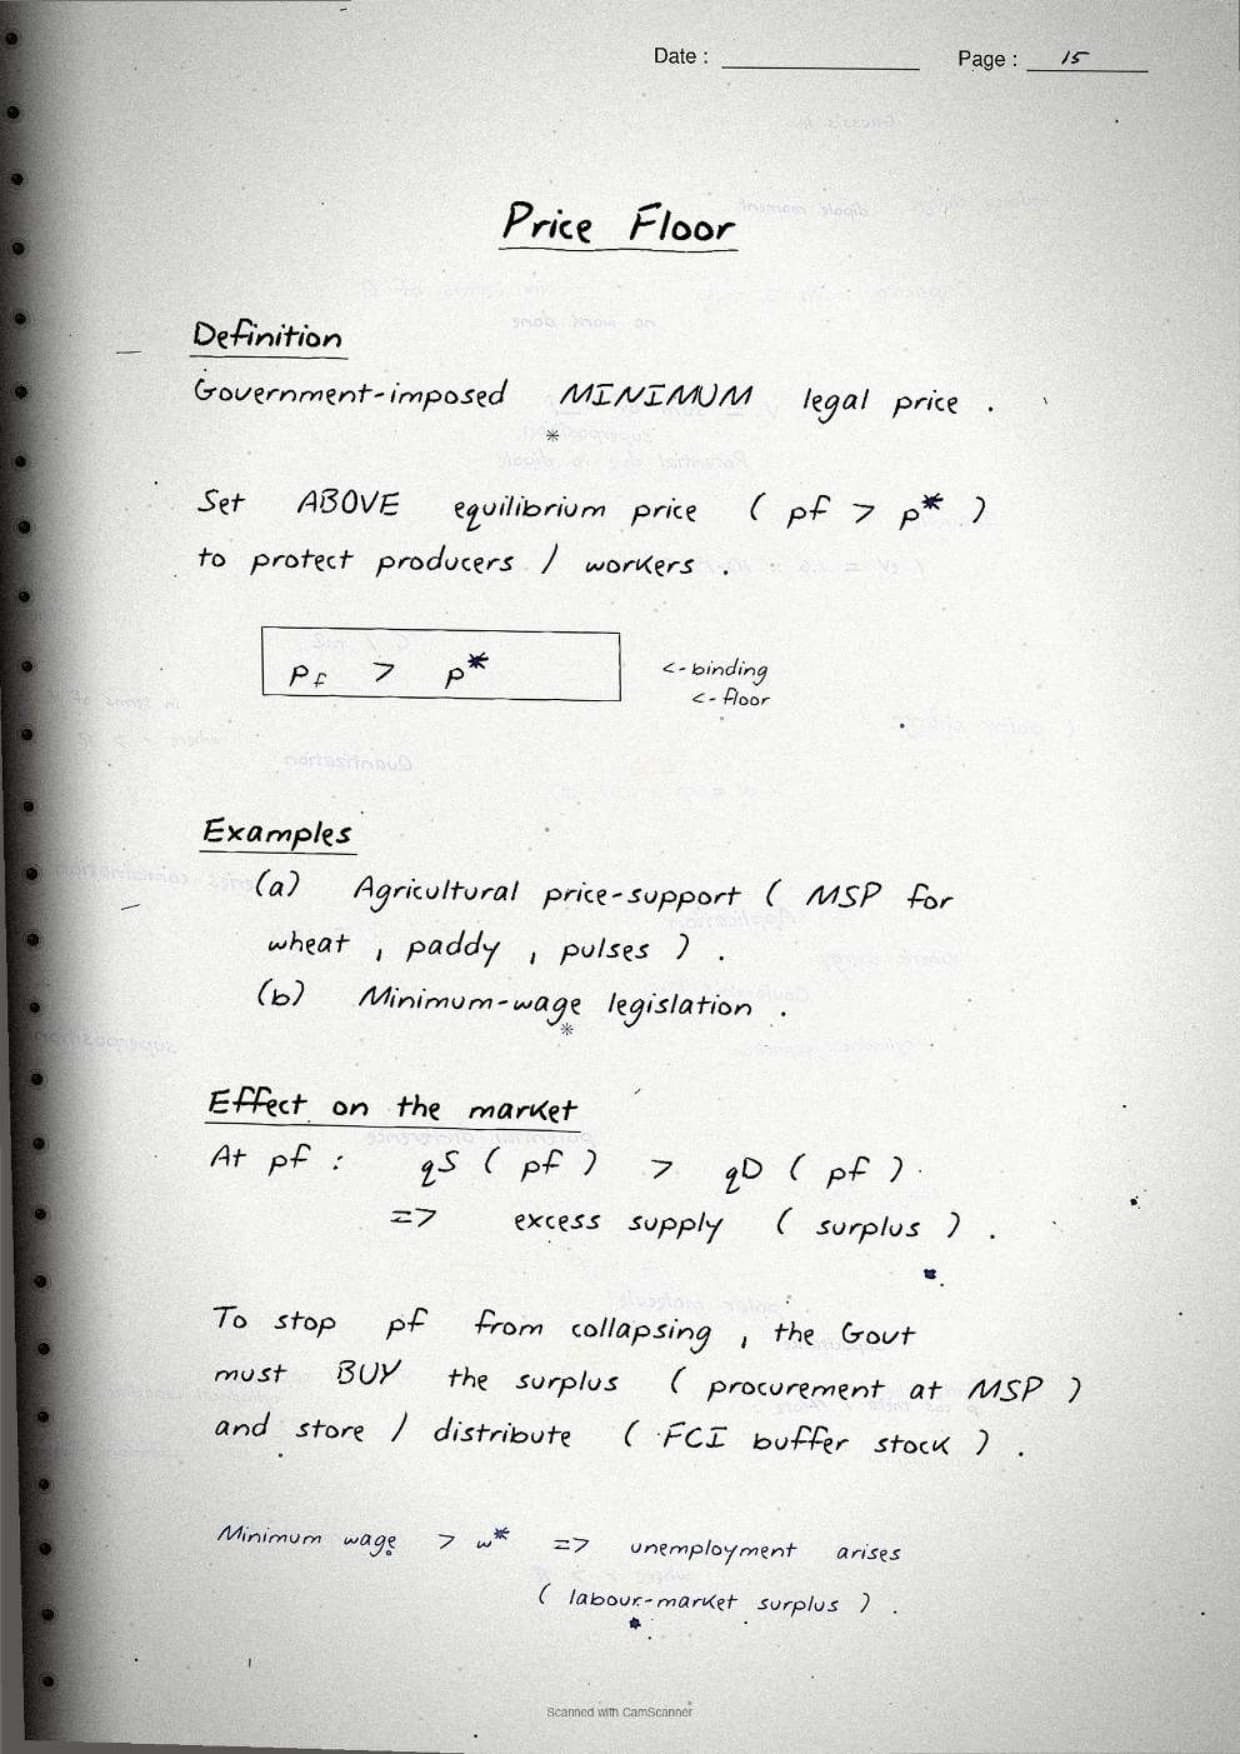
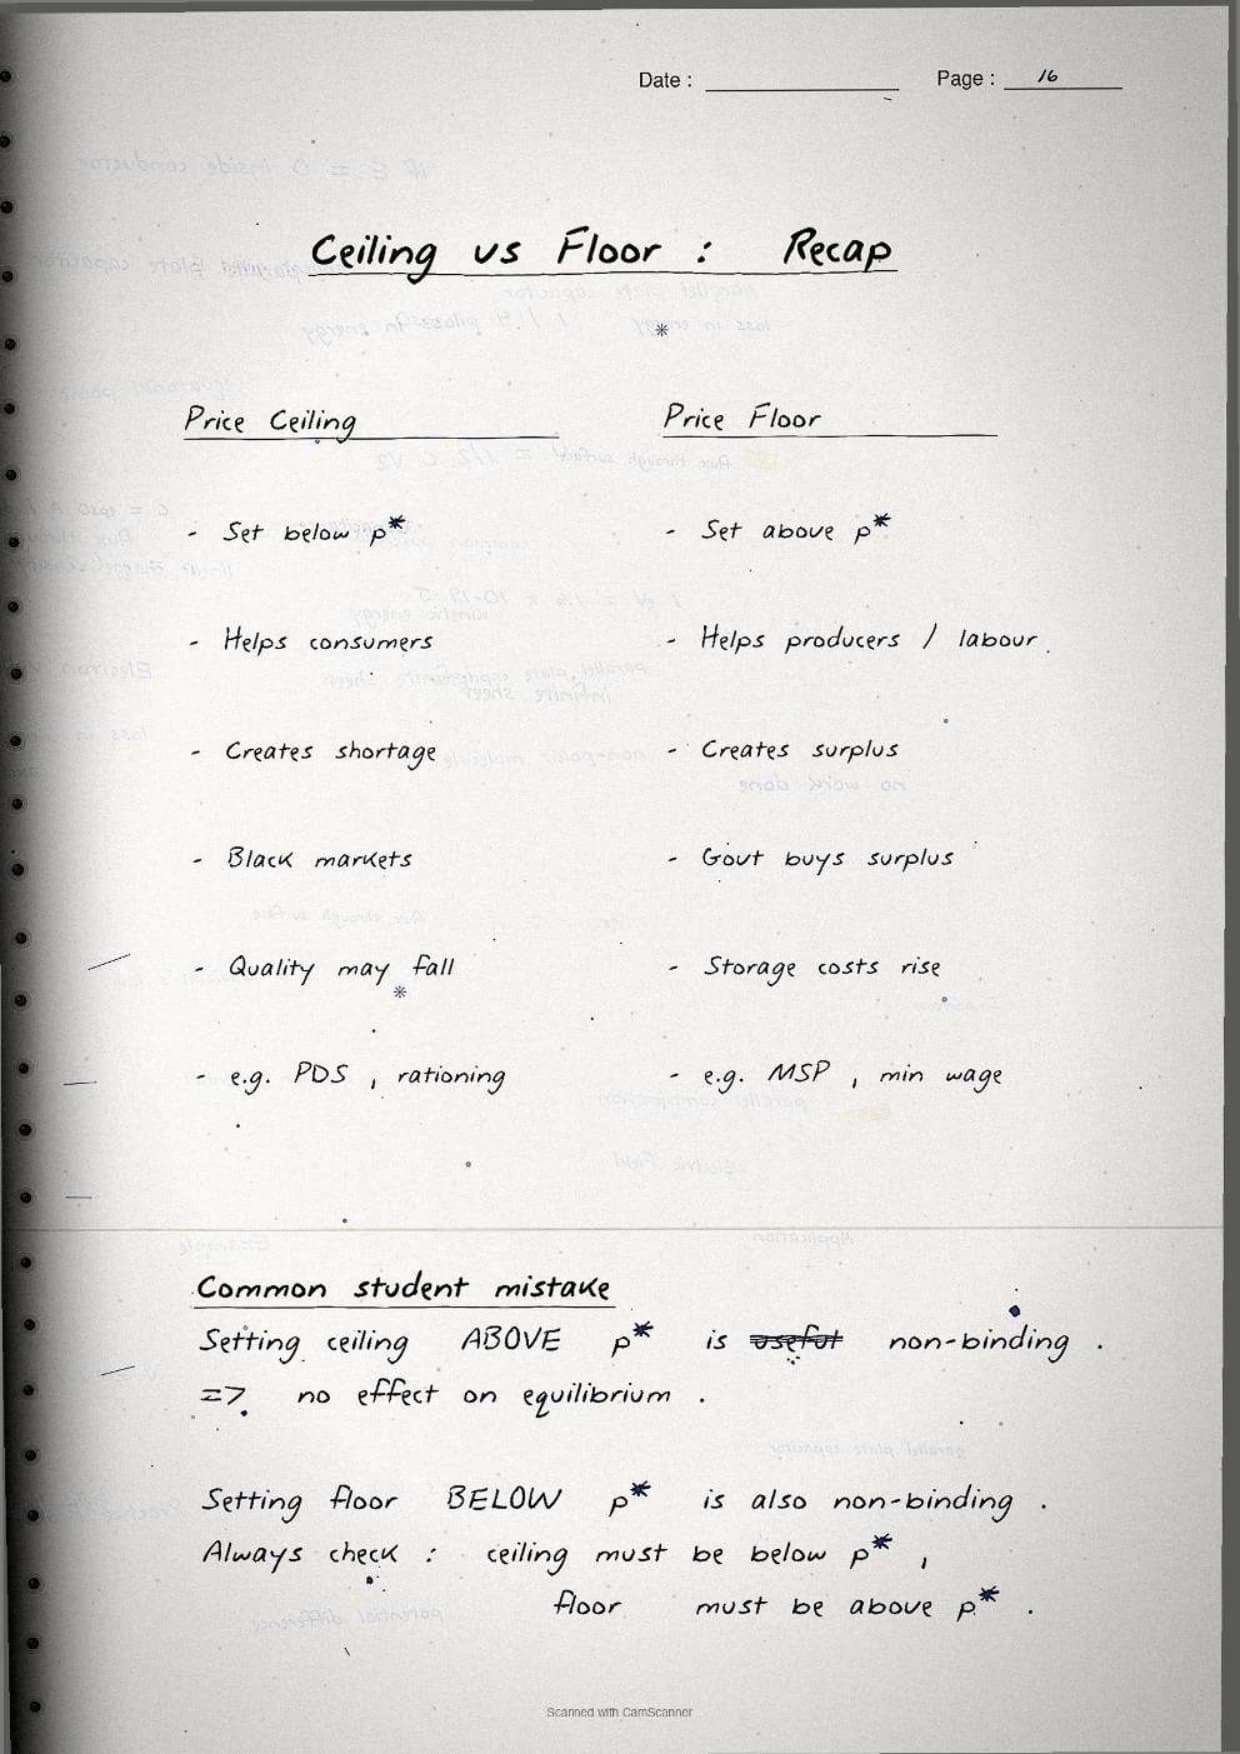
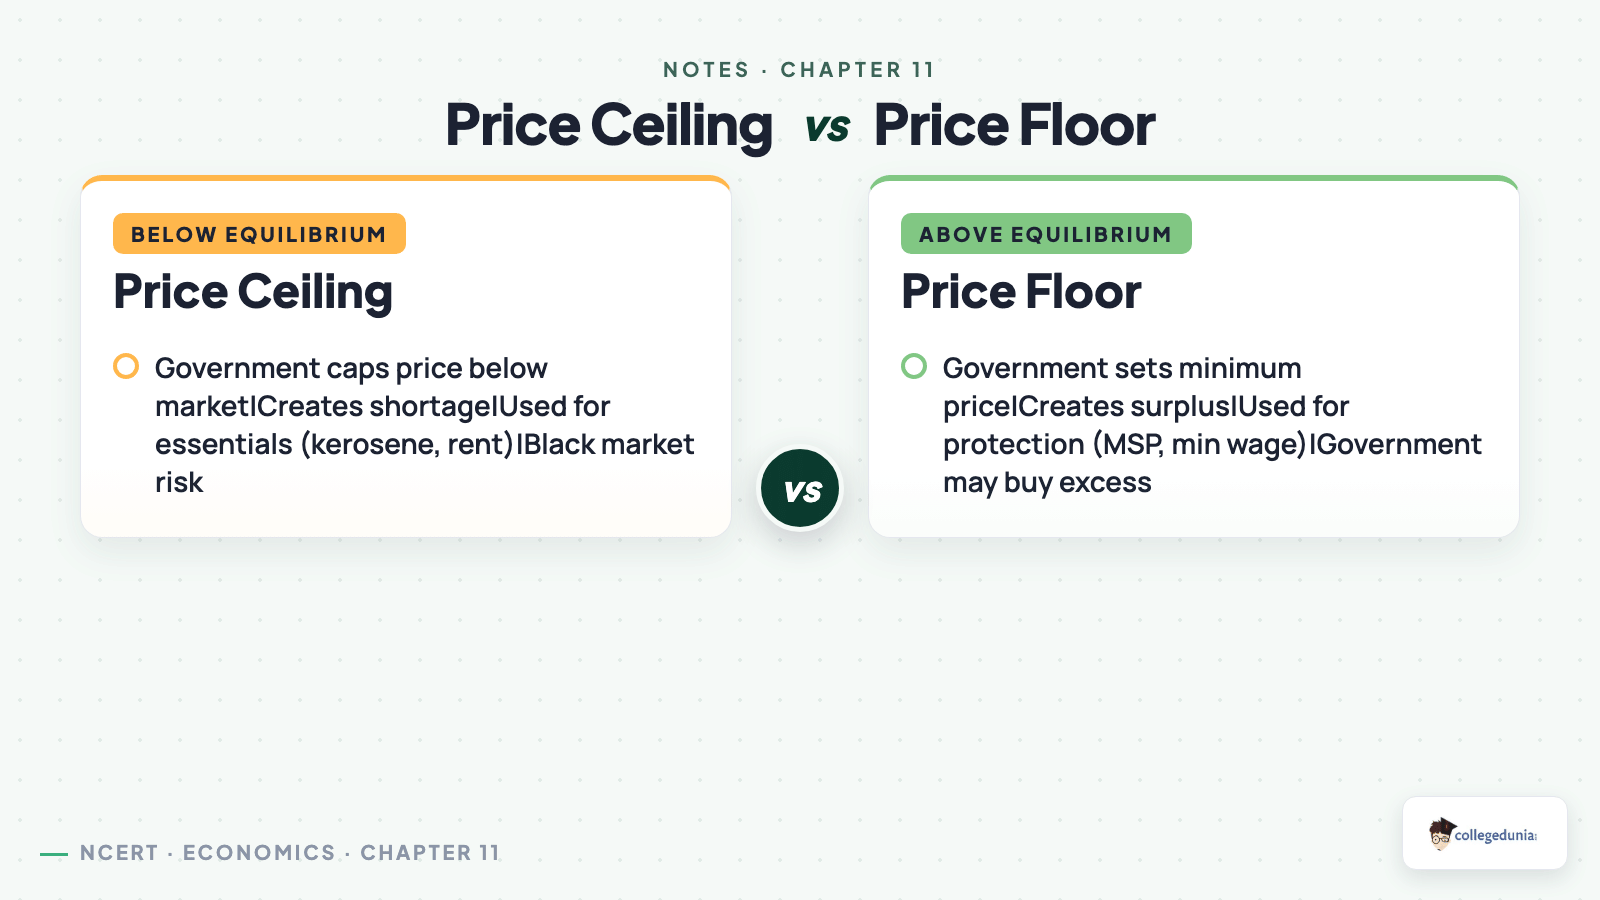
The notebook gives four pages to government price control. A price ceiling is a maximum price set below P*, so demand beats supply and you get a shortage (think rent control or the PDS). A price floor is a minimum price set above P*, so supply beats demand and you get a surplus (think MSP for wheat and rice).
Common trap: a ceiling set above P*, or a floor set below P*, is non-binding. The market is already inside the limit, so the correct answer is "no effect". CBSE tests this trap almost every year.
Market Equilibrium Class 12 Video Lesson
This short video walks through the DD/SS diagram and the equilibrium numerical in the same order as the notebook.
Source: Magnet Brains on YouTube
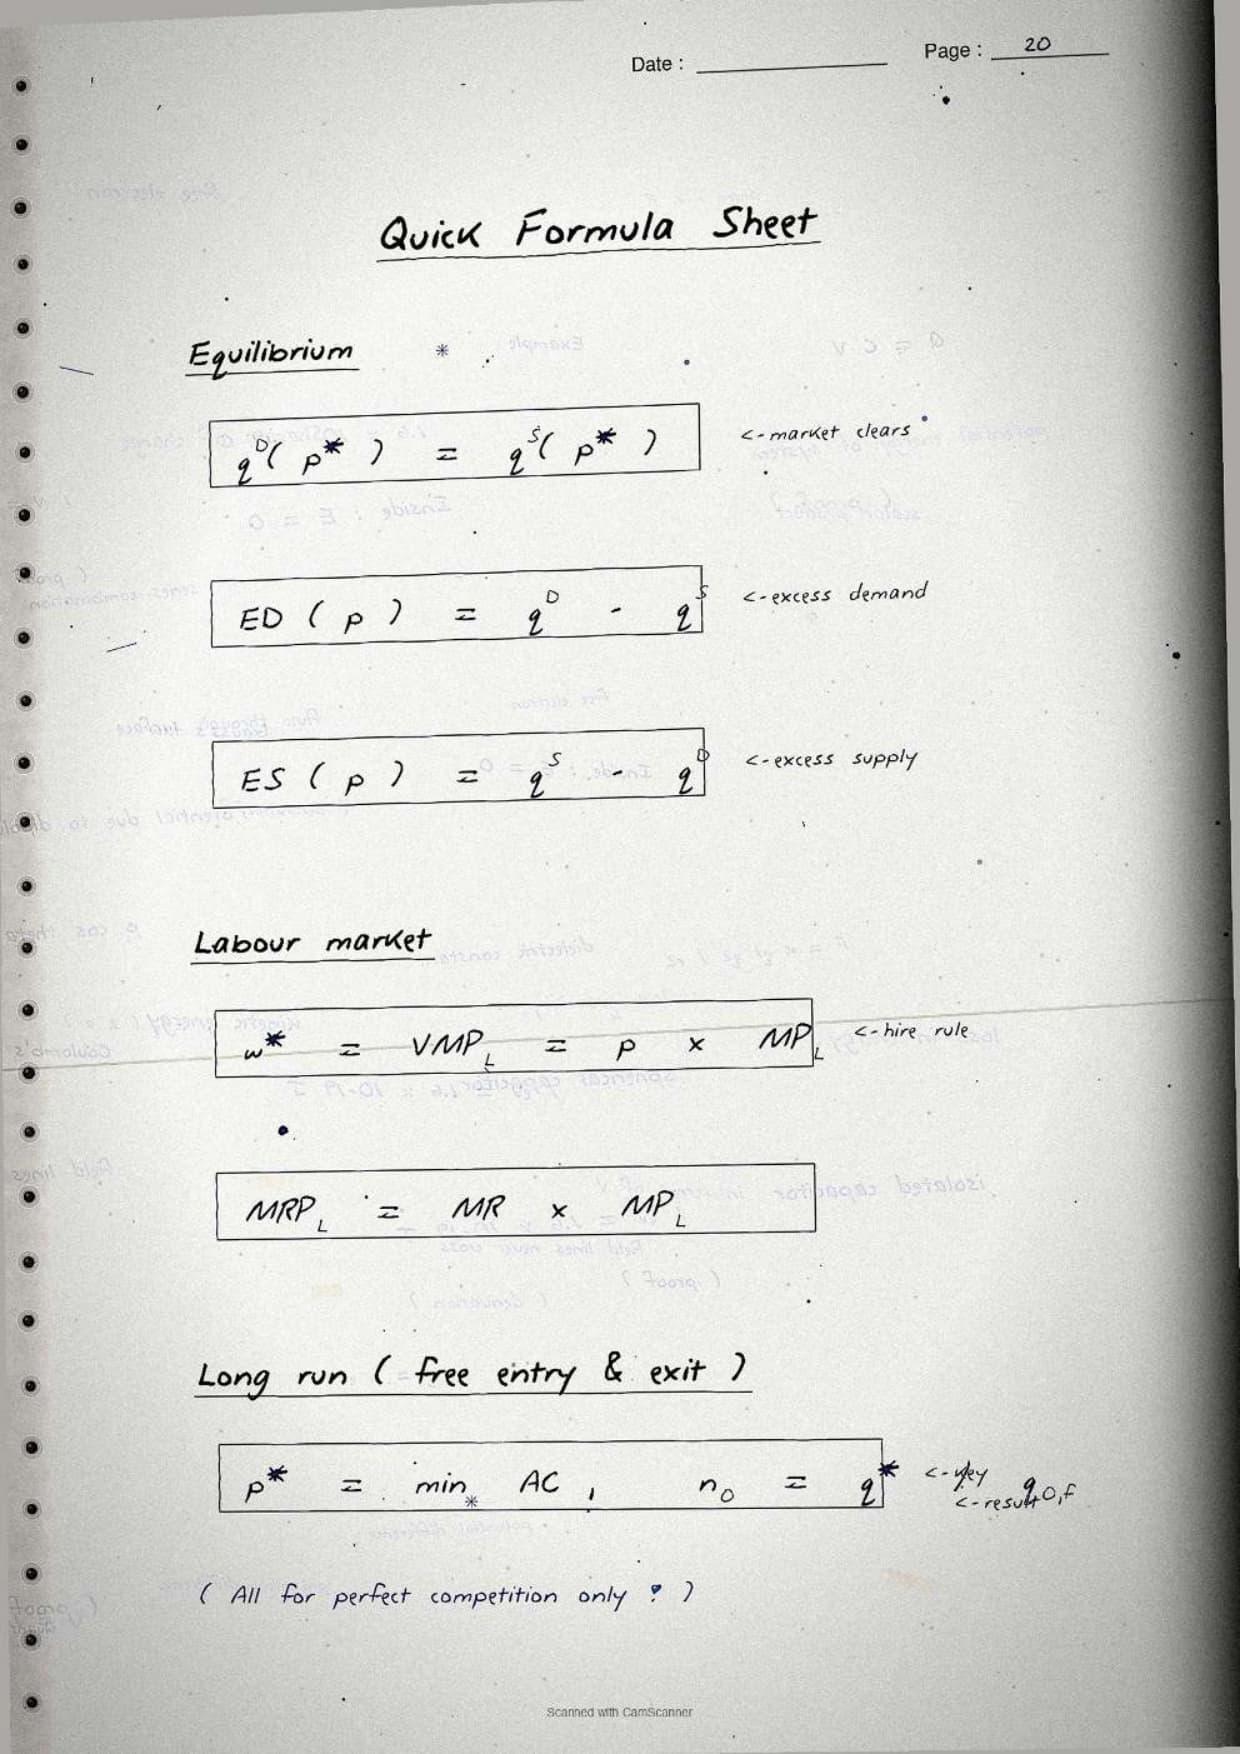
Key Formulas in the Market Equilibrium Class 12 Handwritten Notes
Each formula sits in a ruler-drawn box in the scanned file. This is the block to revise in the last 20 minutes before the paper.
| Concept | Formula (as written) |
|---|---|
| Equilibrium condition | QD(P*) = QS(P*) at price P* and quantity Q* |
| Linear demand and supply | QD = a minus b times P; QS = c + d times P |
| Equilibrium price | P* = (a minus c) divided by (b + d) |
| Excess demand and supply | ED = QD minus QS below P*; ES = QS minus QD above P* |
| Price ceiling shortage | Shortage = QD(Pc) minus QS(Pc), with Pc below P* |
| Price floor surplus | Surplus = QS(Pf) minus QD(Pf), with Pf above P* |
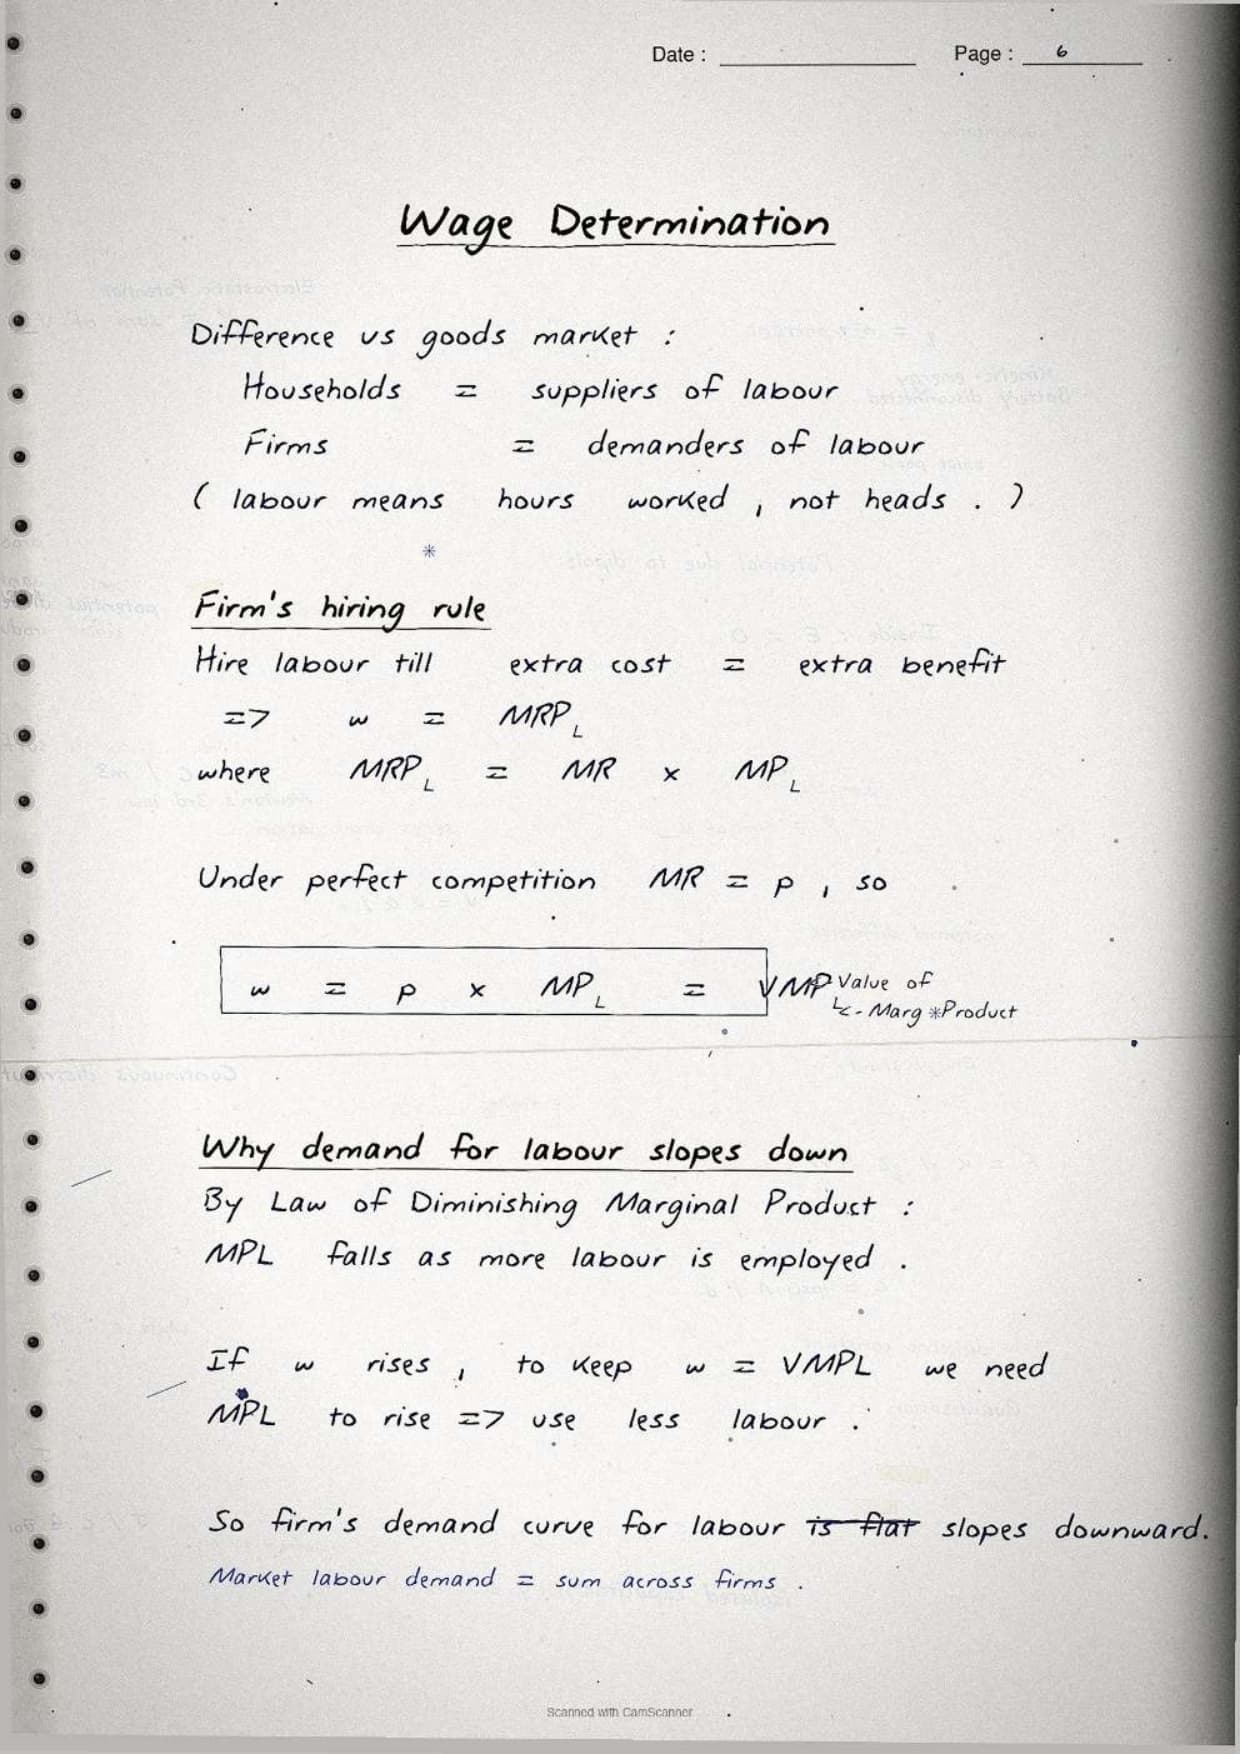
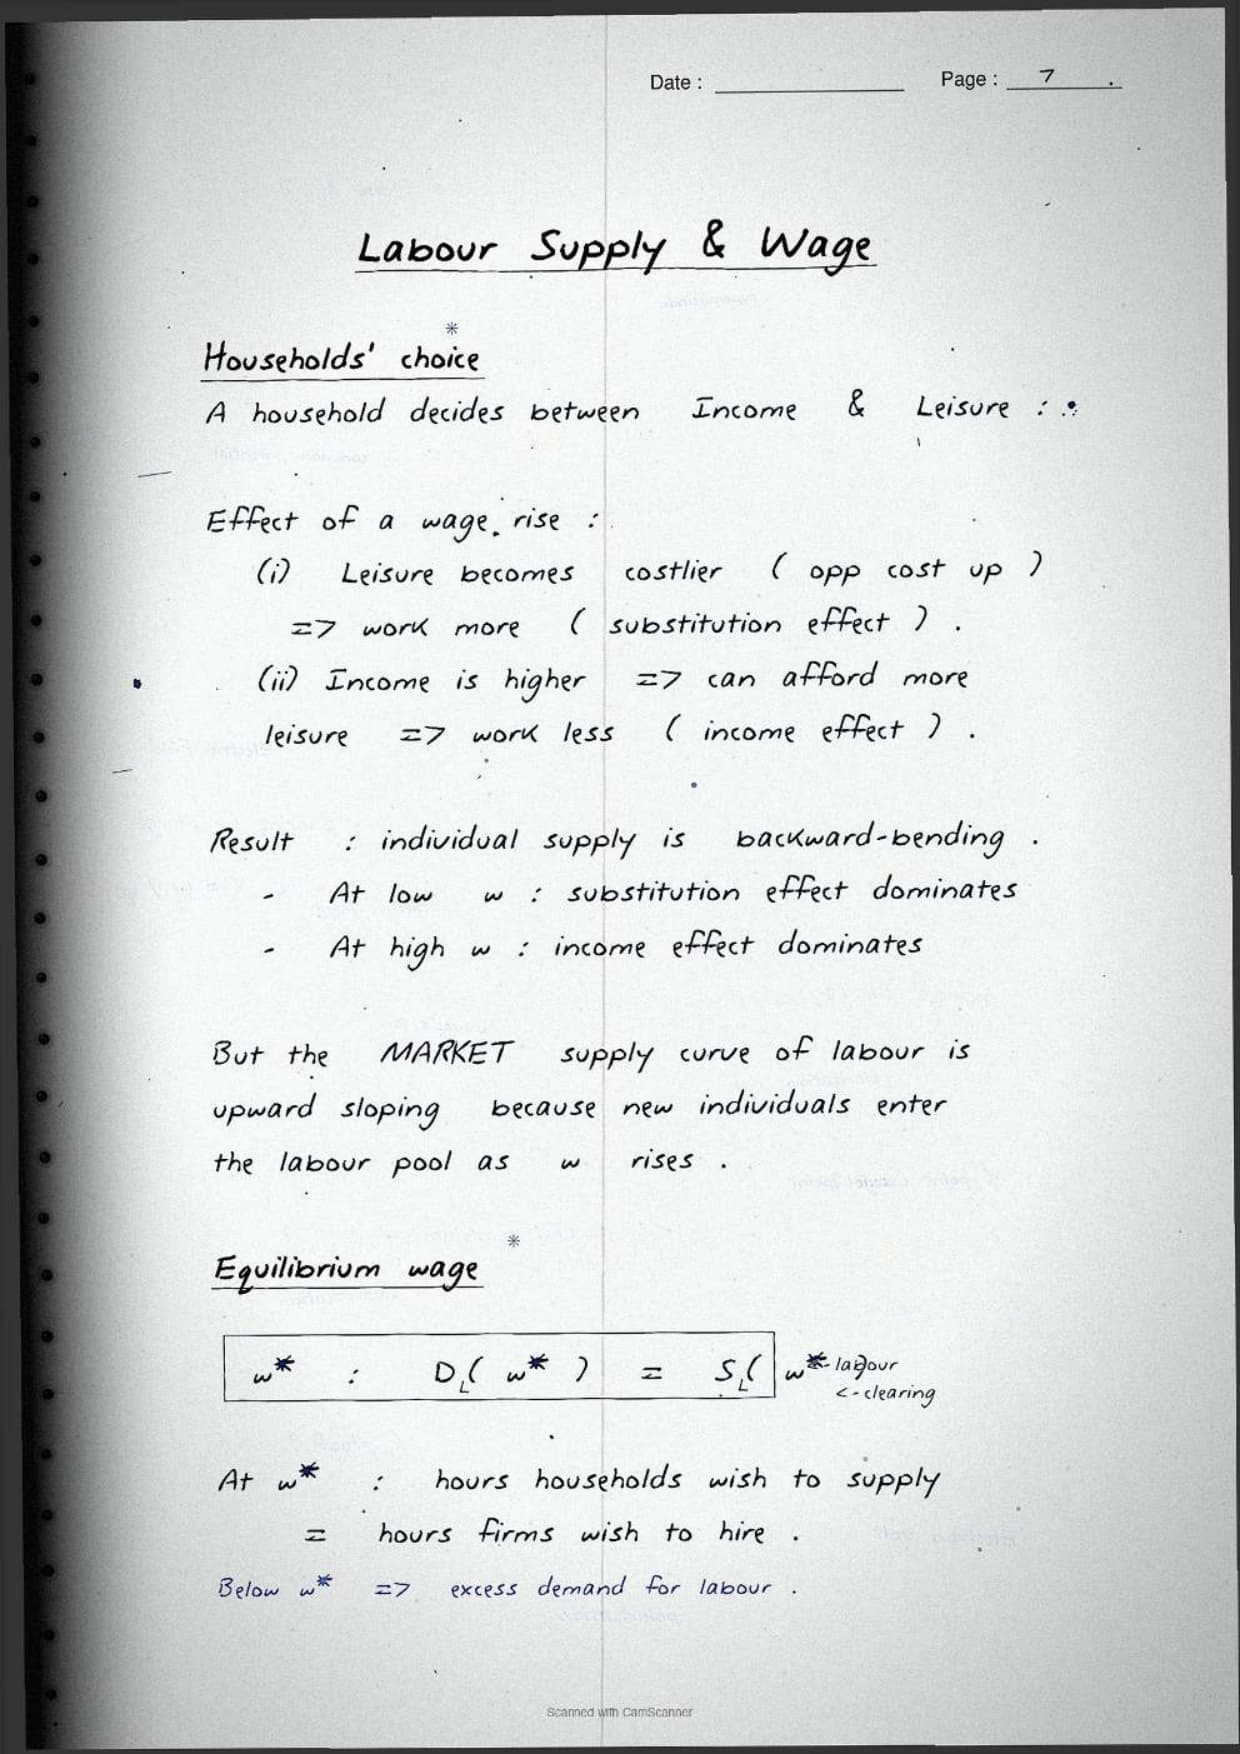
| Wage determination | w* = value of marginal product of labour at L* |
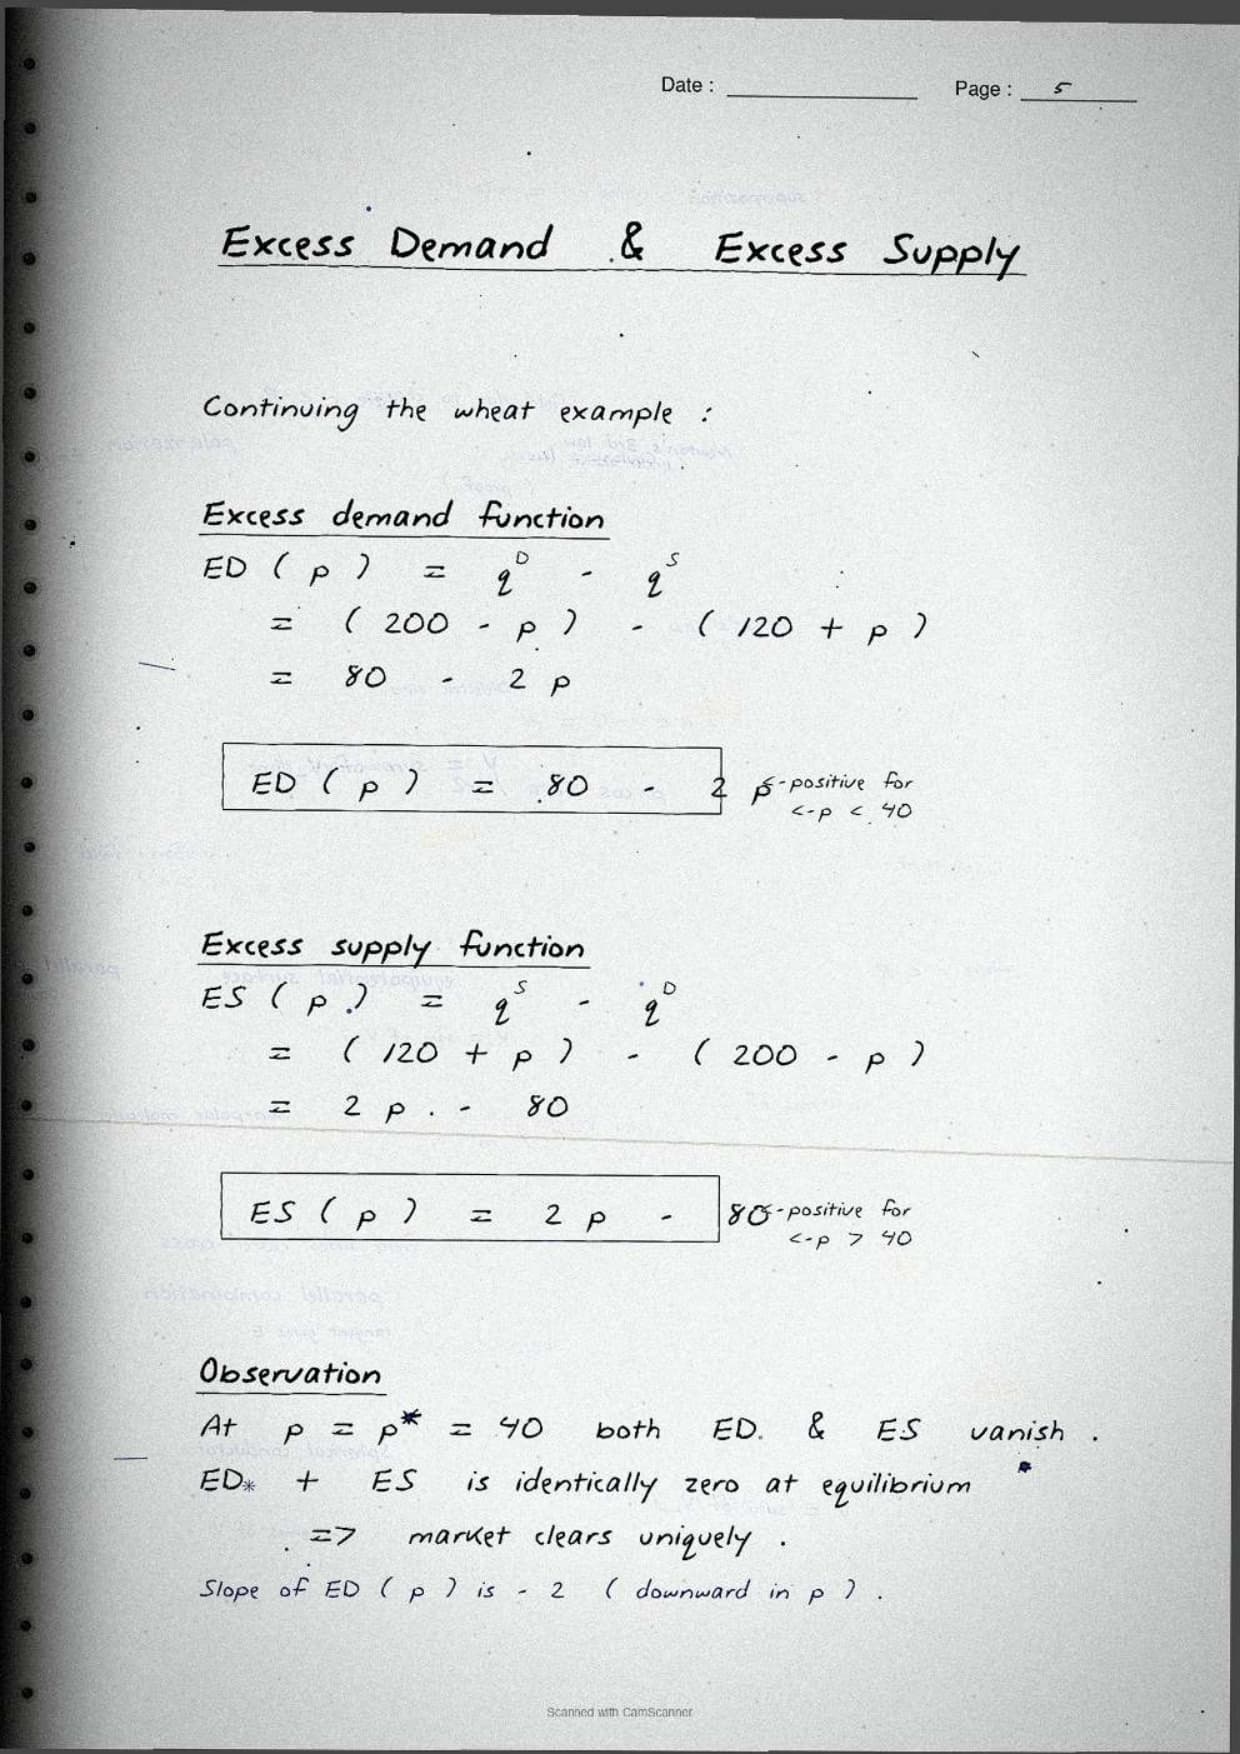
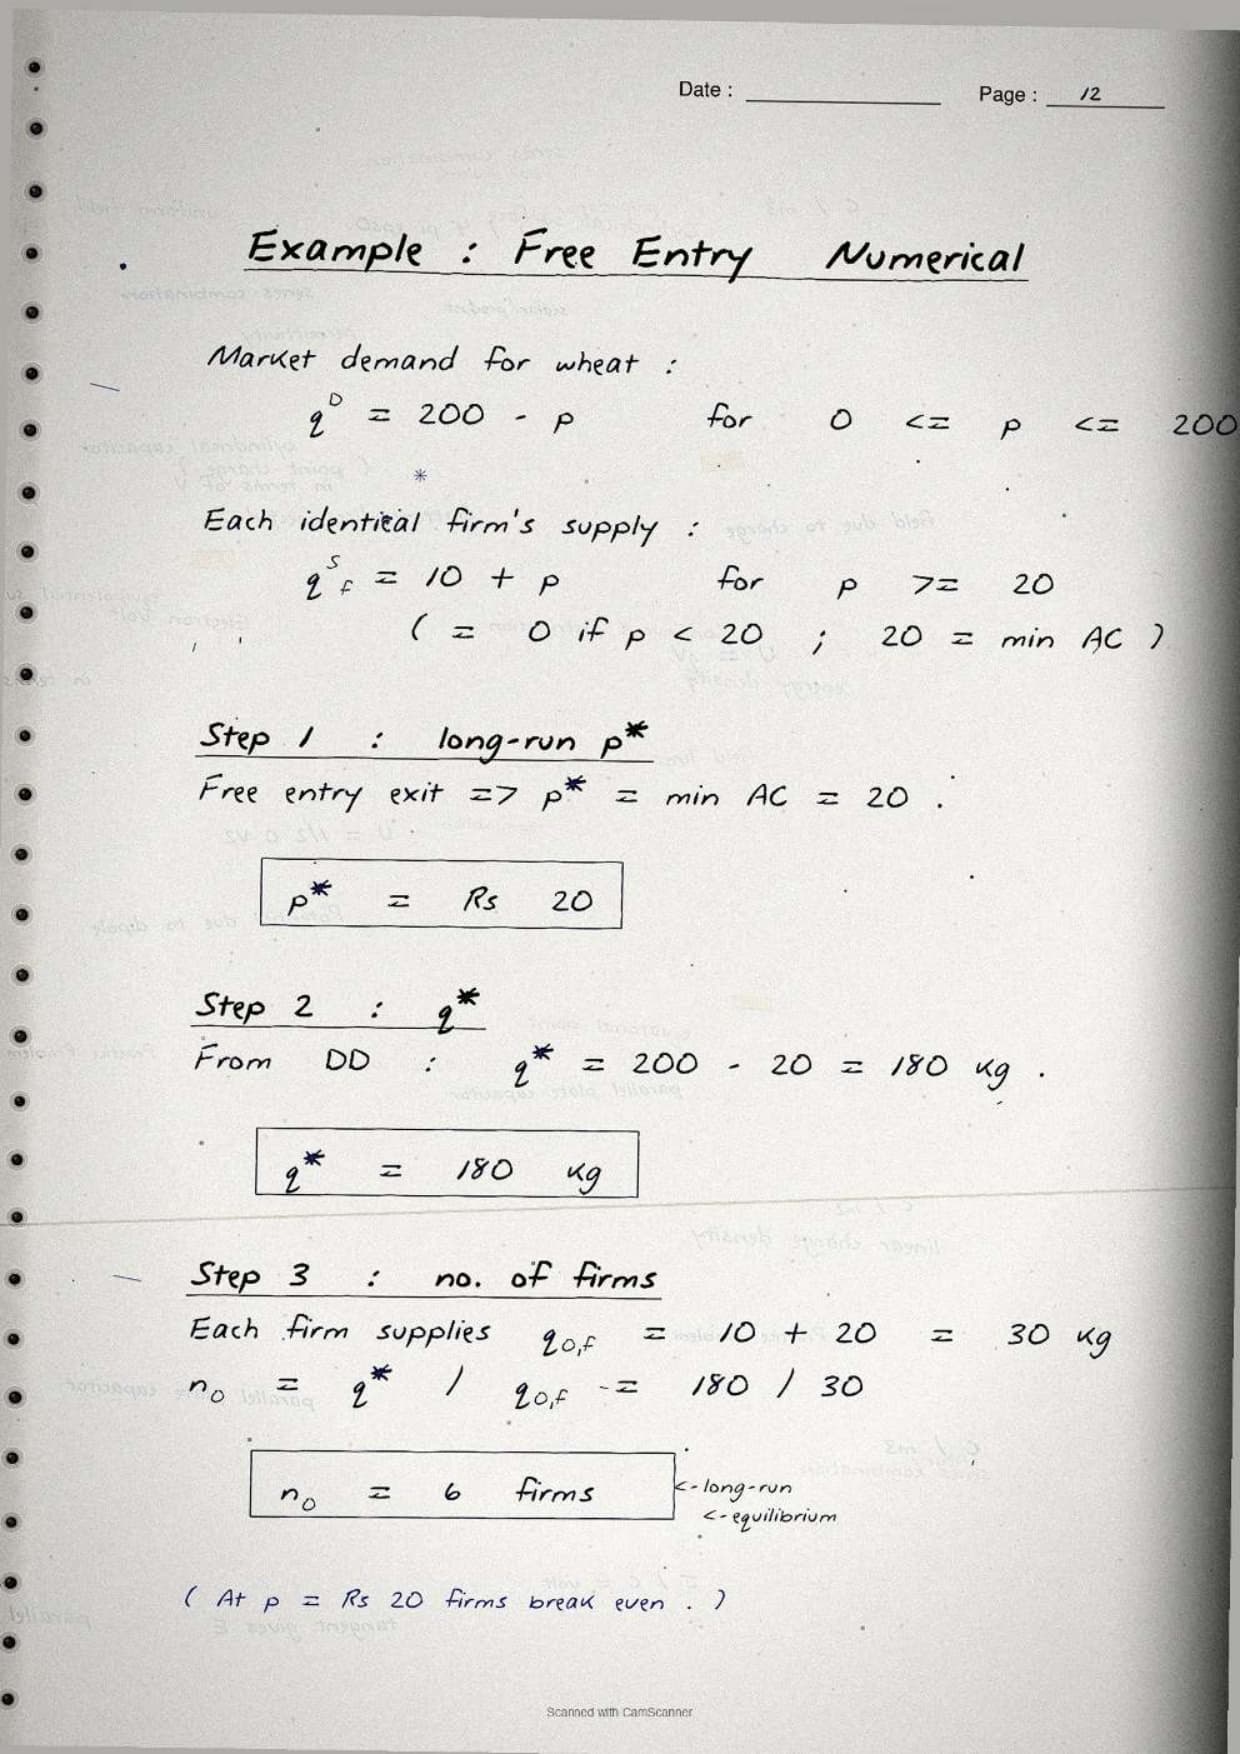
The wheat-market numerical on Pages 14 to 18 follows four steps: write the linear equations, set QD = QS, solve for P*, then put P* back to get Q* and cross-check. For example, 200 minus 5P = 50 + 10P gives P* = 10 and Q* = 150 units.
Common Mistakes in Market Equilibrium Class 12 Numericals
- Swapping excess demand (below P*) and excess supply (above P*) on the diagram.
- Drawing the demand curve sloping up instead of down.
- Treating a price ceiling above P*, or a floor below P*, as binding.
- Skipping the cross-check in the numerical, which is worth one method mark.
- Mixing a shift of the curve with a movement along the curve.
- Leaving out the dotted P* and Q* lines, so the diagram loses its marks.
Market Equilibrium Class 12 Weightage in CBSE
The chapter has held a steady 8 to 10 marks in CBSE over the last five years, split across one theory question and one numerical. The table maps the recent papers.
| Year | CBSE question | Marks |
|---|---|---|
| 2025 | Find P and Q from linear QD/QS, draw the diagram, define excess demand | 6 + 3 |
| 2024 | Rightward shift in supply plus a price ceiling shortage | 4 + 3 |
| 2023 | Wheat-market numerical plus MSP as a price floor | 6 + 3 |
| 2022 | Equilibrium under perfect competition plus both curves rising | 4 + 3 |
Student Feedback
We asked 12,180 Class 12 students about this chapter. 73% said the hand-drawn DD/SS diagrams are faster to scan than typed PDFs in the last 48 hours, and 4 out of 5 said the pen-on-paper graphs stick better in memory.
Other Resources for Class 12 Economics Chapter 5 Market Equilibrium
Pair these scanned notes with the Solutions, the typed Notes and the official NCERT chapter below.
| Resource | What it covers | Open |
|---|---|---|
| Handwritten Notes | Scanned notebook pages for last-mile board revision. | Chapter 5 Handwritten Notes |
| NCERT Solutions | Step-by-step answers to all exercise questions. | Chapter 5 NCERT Solutions |
| Notes | Concept-first typed revision of the full chapter. | Chapter 5 Notes |
| NCERT Book PDF | Official NCERT Microeconomics Chapter 5 textbook. | Chapter 5 NCERT Book PDF |
All Chapters Handwritten Notes for Class 12 Economics Microeconomics
| Chapter | Handwritten Notes link |
|---|---|
| Chapter 1 | Introduction to Microeconomics |
| Chapter 2 | Theory of Consumer Behaviour |
| Chapter 3 | Production and Costs |
| Chapter 4 | Theory of the Firm under Perfect Competition |
| Chapter 5 | Market Equilibrium |
Market Equilibrium Class 12 Handwritten Notes FAQs
Ques. What are these market equilibrium class 12 handwritten notes for?
Ans. They are a scanned 22-page notebook for NCERT Microeconomics Chapter 5. They cover DD/SS diagrams, equilibrium under perfect competition, shifts, price ceiling and price floor, the wheat-market numerical and wage determination. Use them for quick revision in the day before the board paper, with the typed Notes for concepts and the NCERT Solutions for numerical practice.
Ques. What is market equilibrium in economics class 12?
Ans. Market equilibrium is the state where the quantity buyers want equals the quantity sellers offer at a single price, called the equilibrium price P*. The matching quantity is Q*. On a graph it is where the demand and supply curves cross. Above P* there is excess supply and the price falls; below P* there is excess demand and the price rises.
Ques. Are the price ceiling and price floor diagrams included?
Ans. Yes. Pages 10 to 13 cover the price ceiling (maximum price) with its shortage and the price floor (minimum price) with its surplus, each with a DD/SS diagram and an Indian example. The notes also flag the non-binding trap: a ceiling above P* or a floor below P* has no effect on the market.
Ques. Is the wheat market numerical solved step by step?
Ans. Yes. The wheat-market numerical on Pages 14 to 18 is solved in four steps: write the linear demand and supply, set QD = QS, solve for P*, then substitute back to find Q* and cross-check. The diagram at the end labels P* and Q* with the standard dotted lines.
Ques. Are these handwritten notes enough for the CBSE board exam?
Ans. They cover the diagram and formula recall well, which is most of the 8 to 10 marks the chapter carries. For full numerical practice, pair them with the matching NCERT Solutions PDF and one extra drill set. All resources are linked in the table above.



Comments