




Class 10 Maths Chapter 13 Statistics carries about 4 to 6 marks in the CBSE Board exam and closes the Statistics and Probability unit. These class 10 maths handwritten notes chapter 13 Statistics cover the mean of grouped data by three methods, plus the mode and median of grouped data, in a hand-drawn revision style.
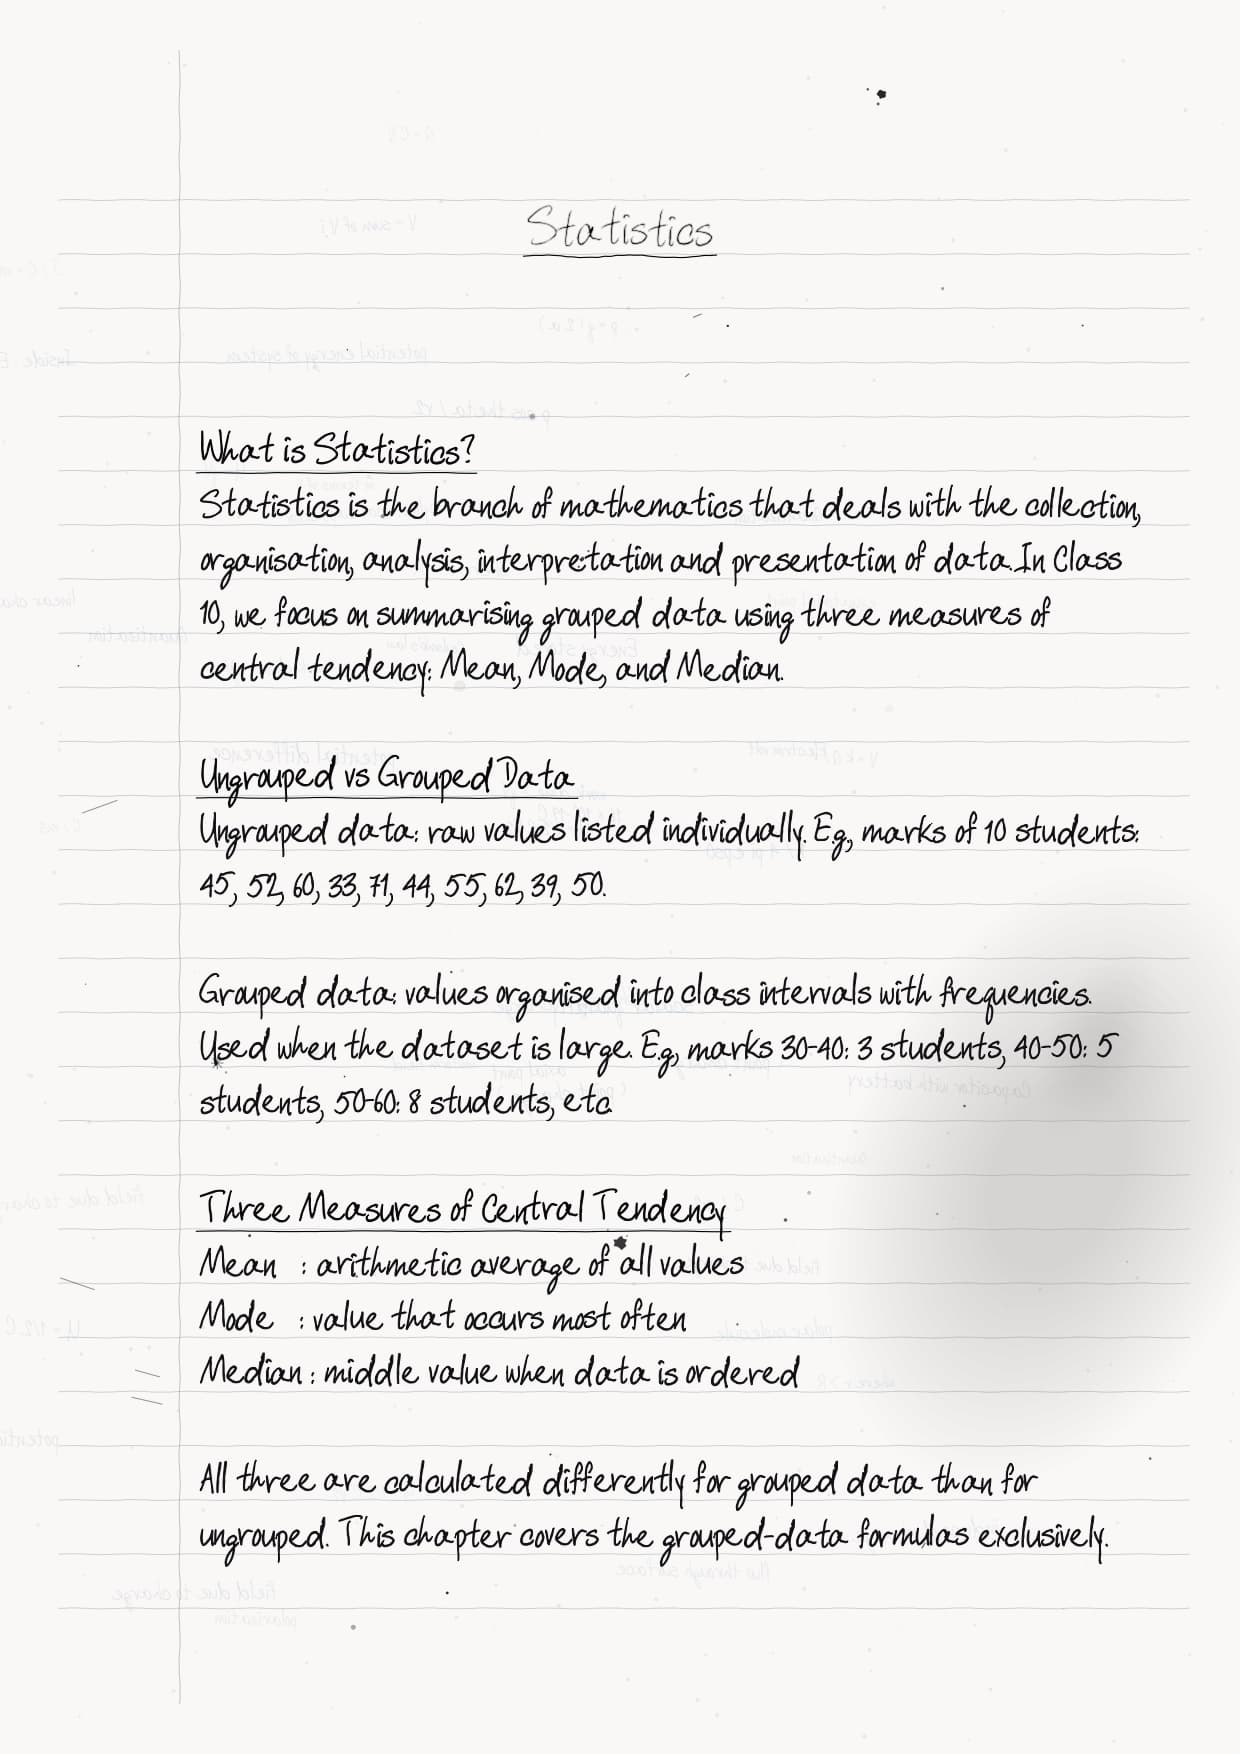
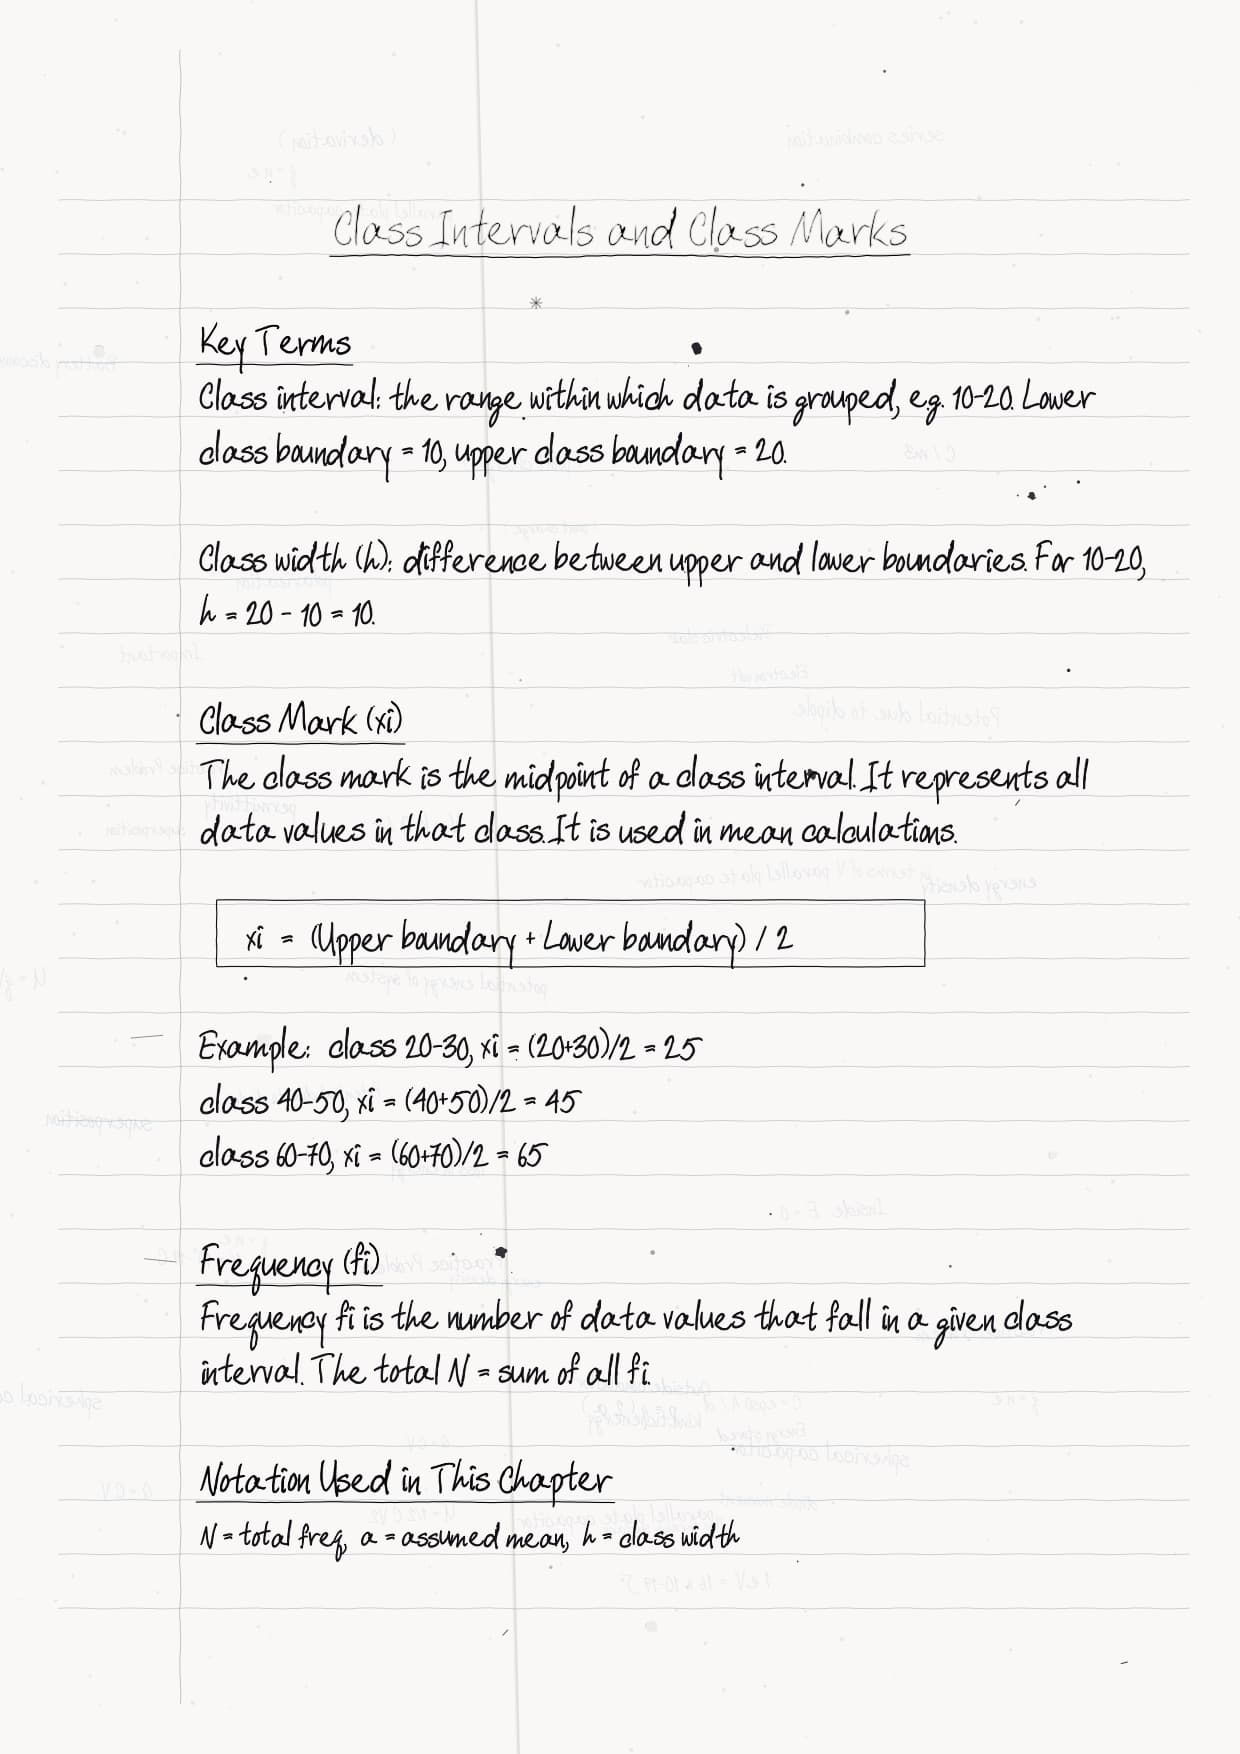
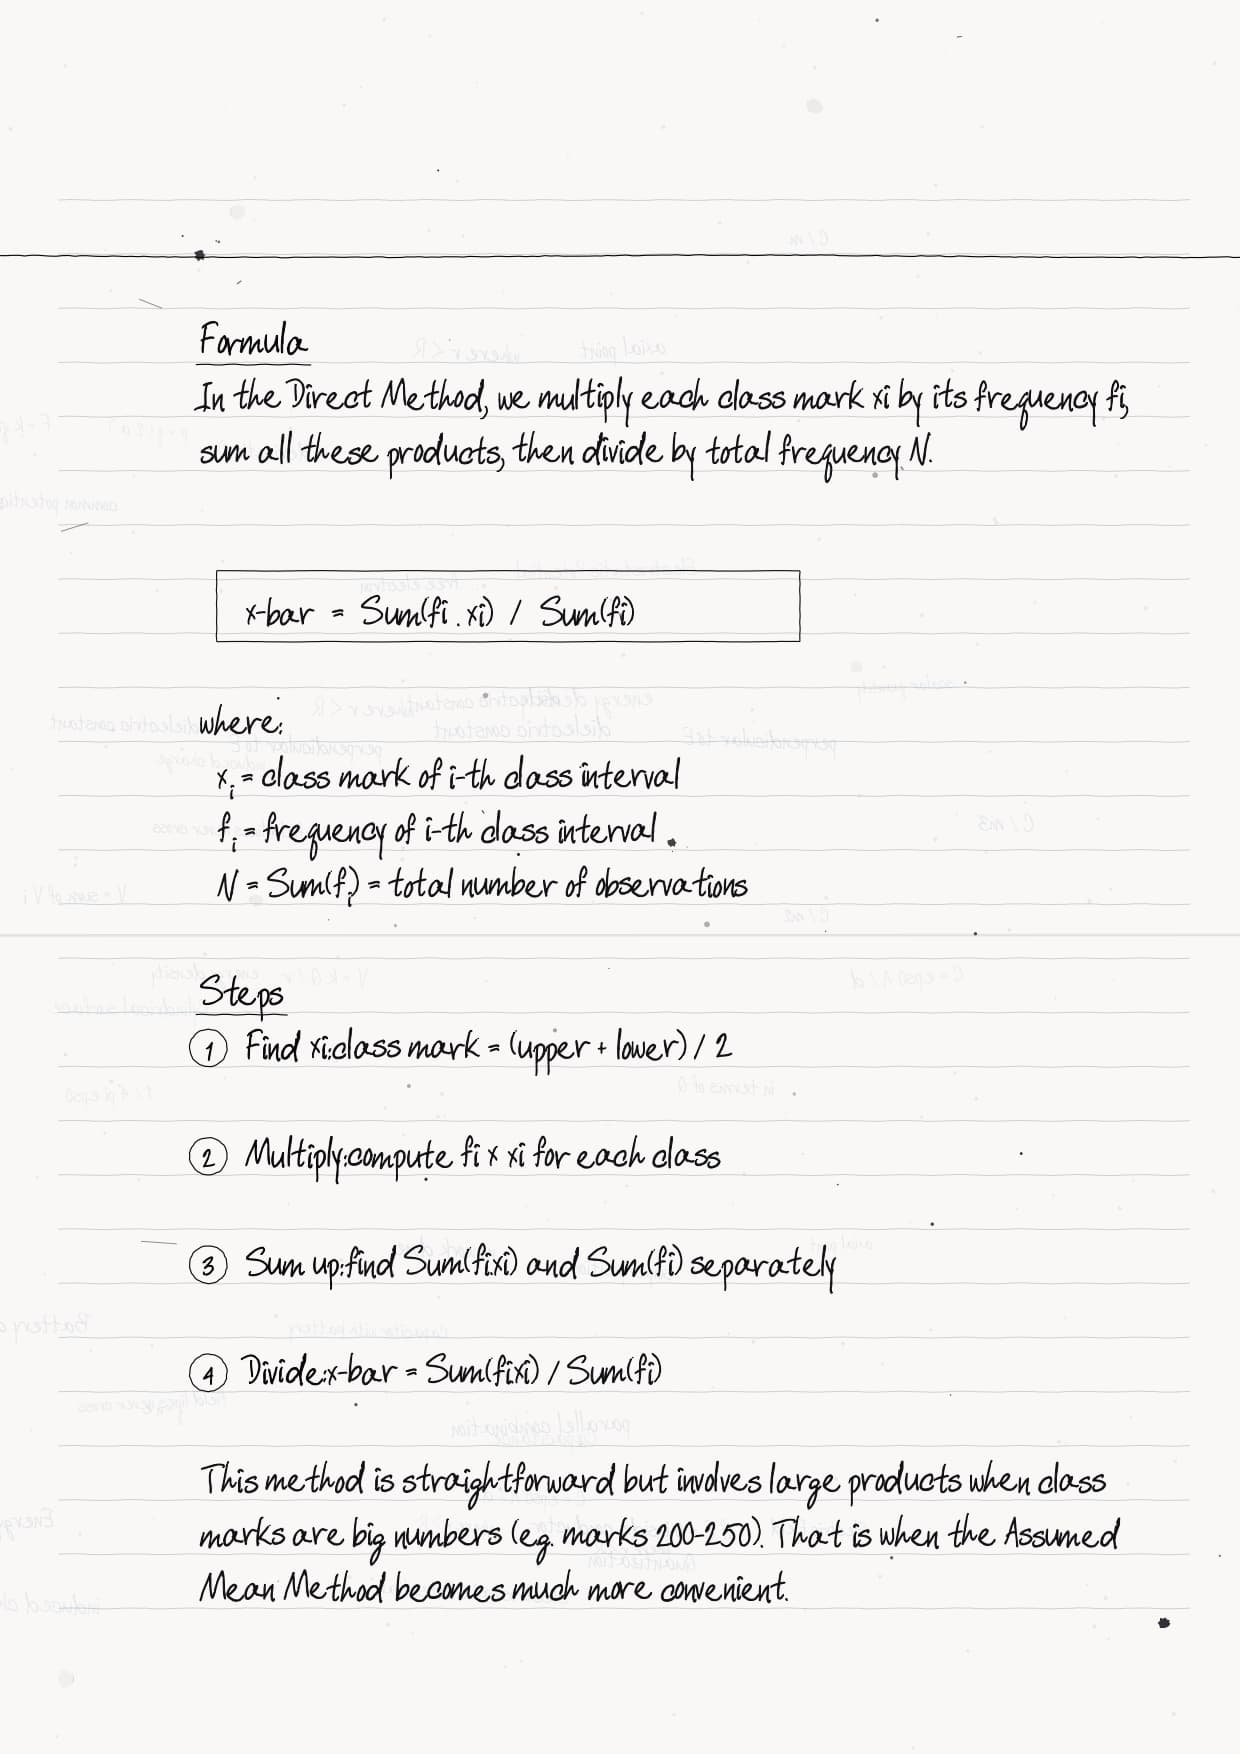
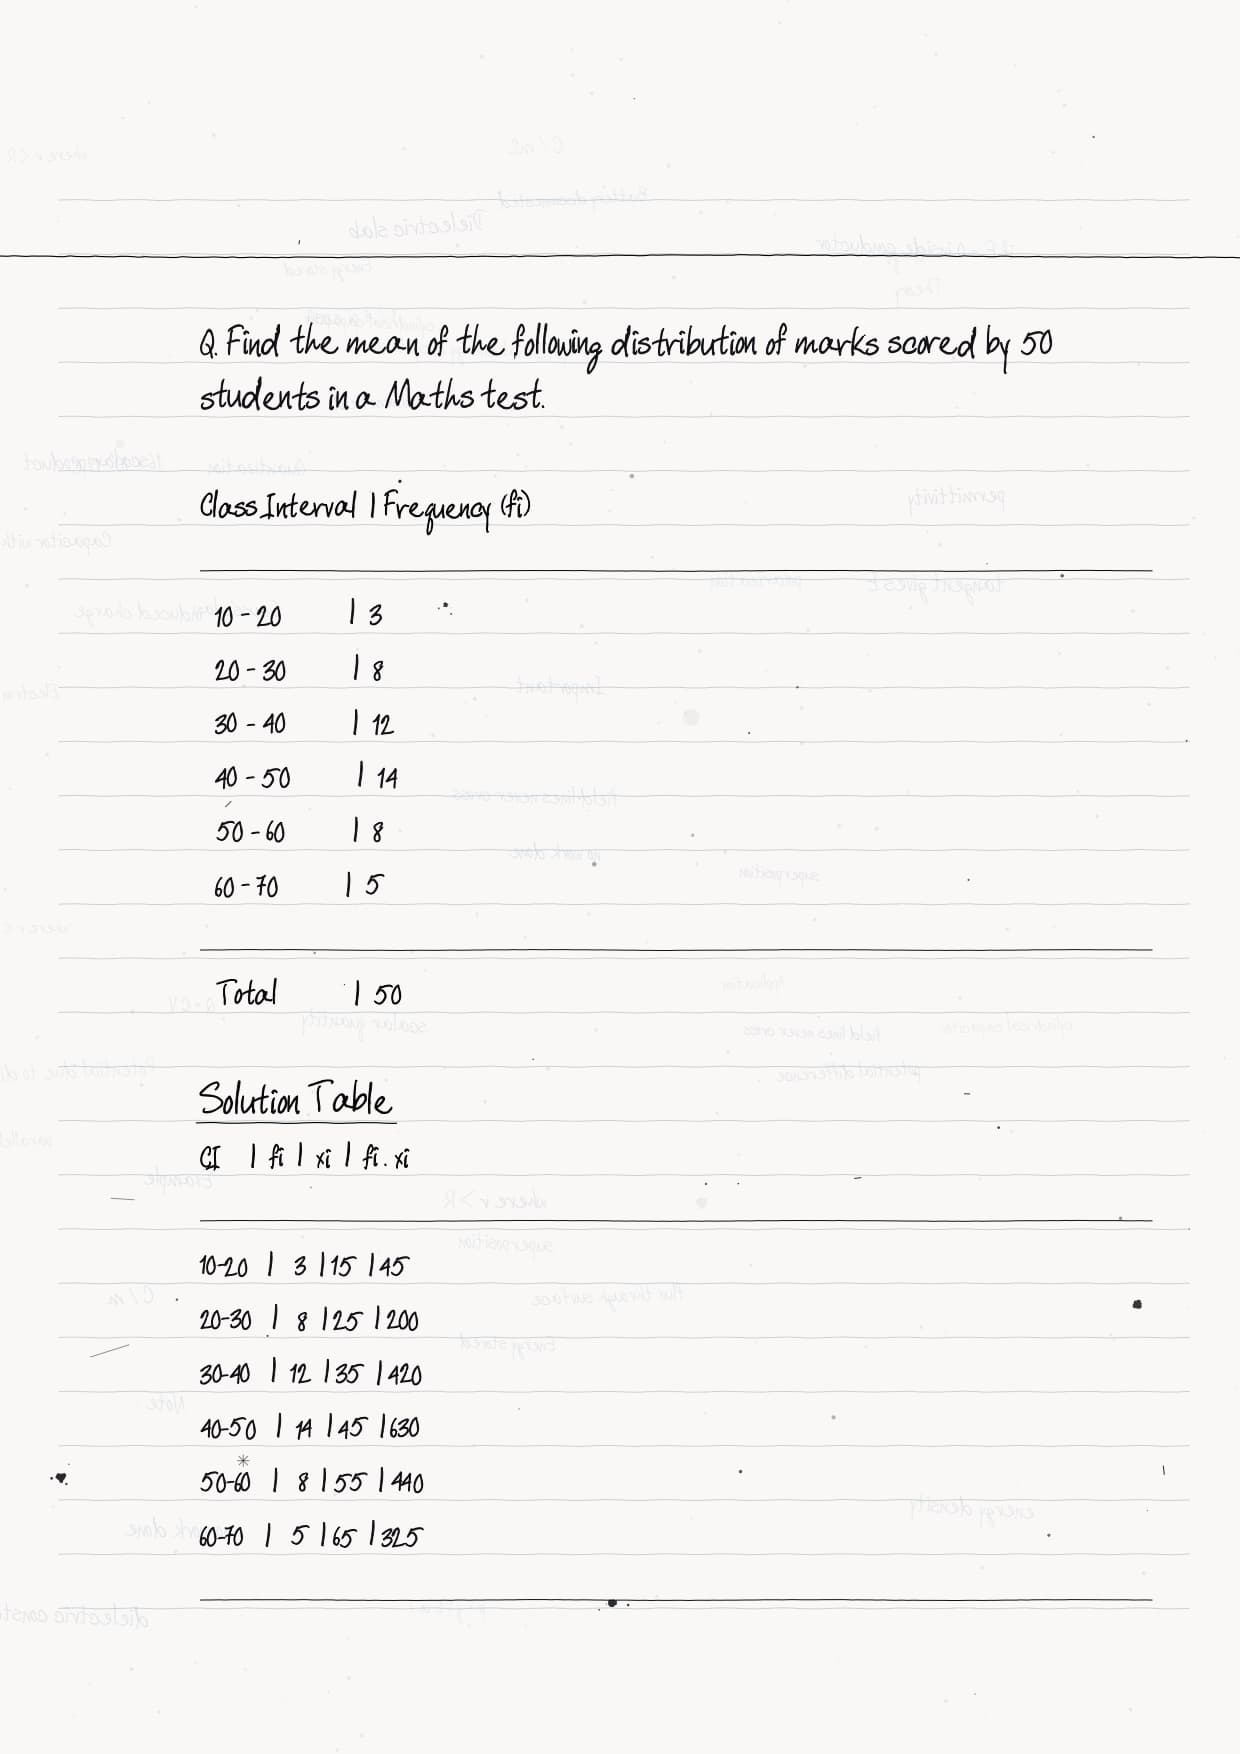
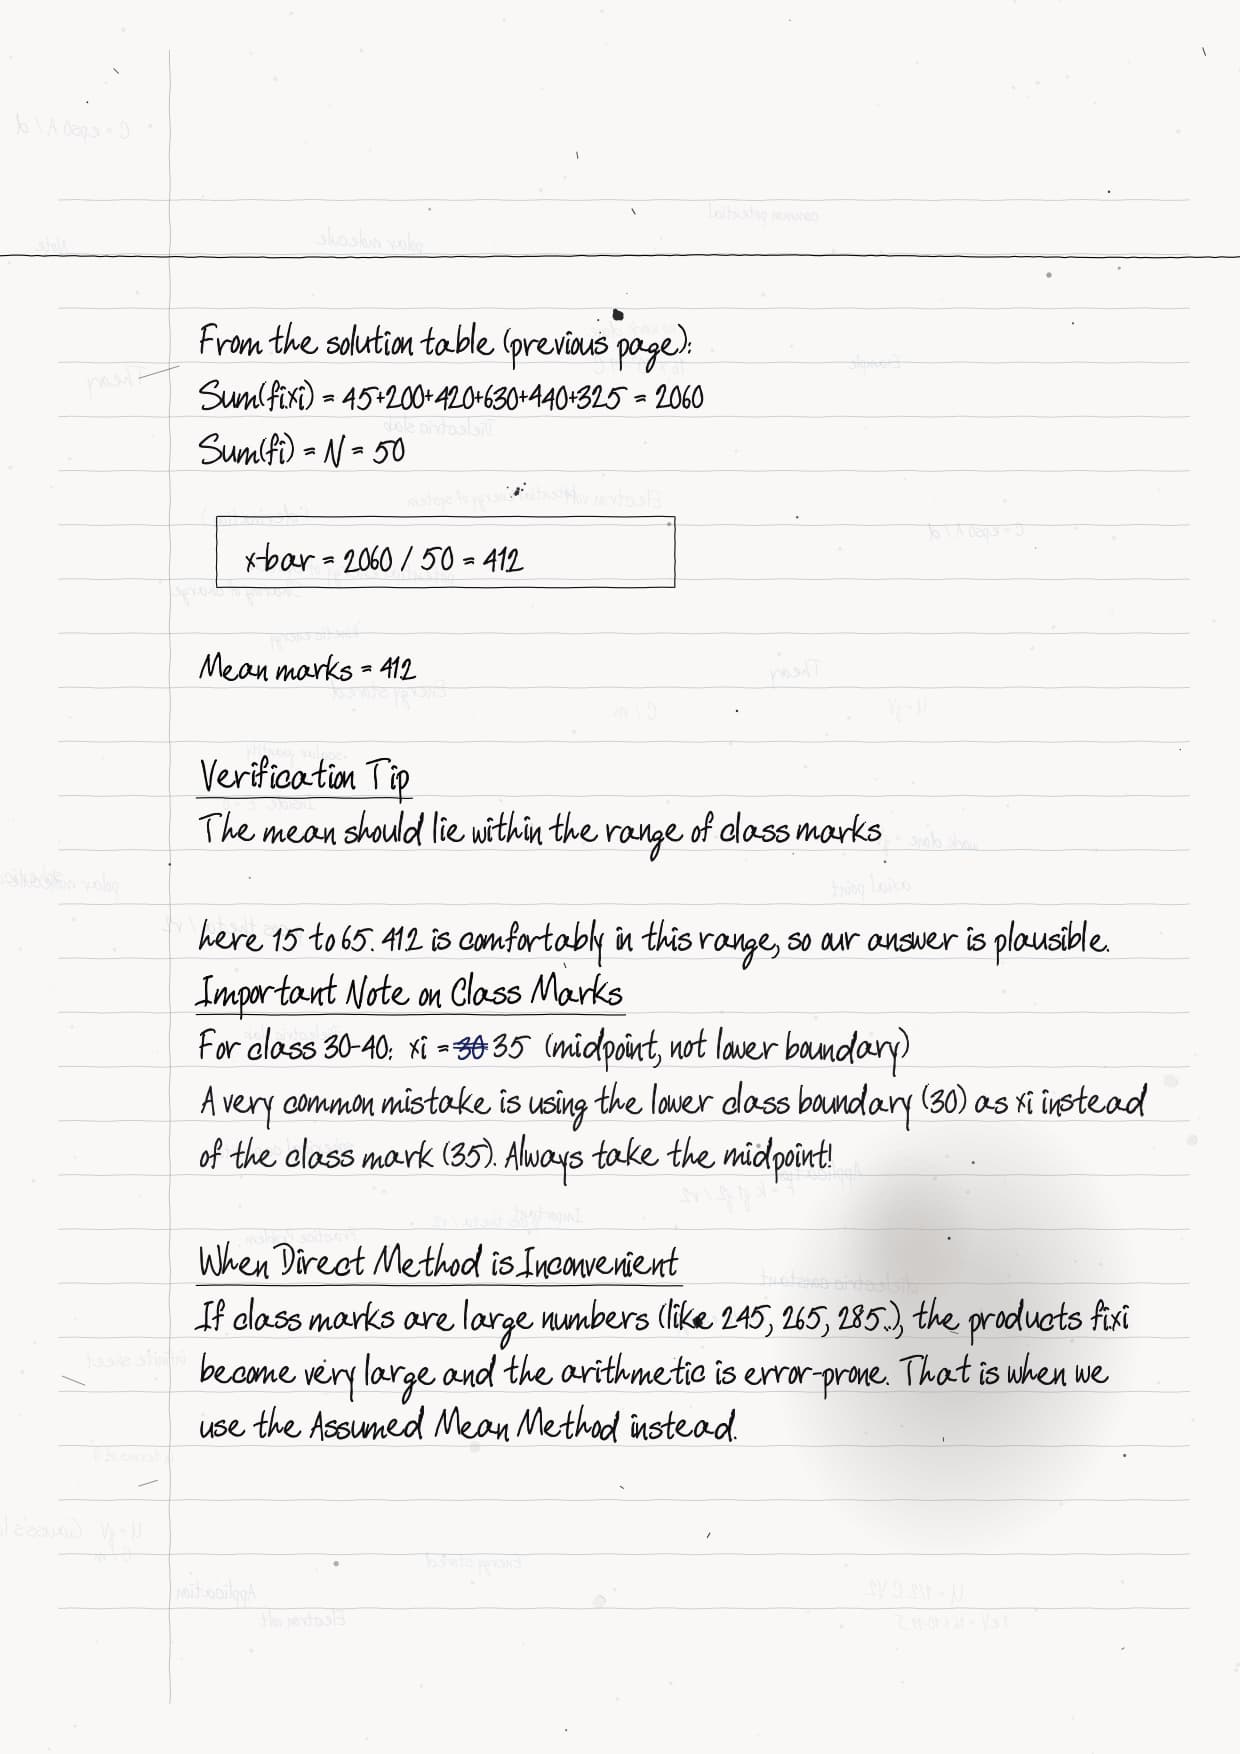
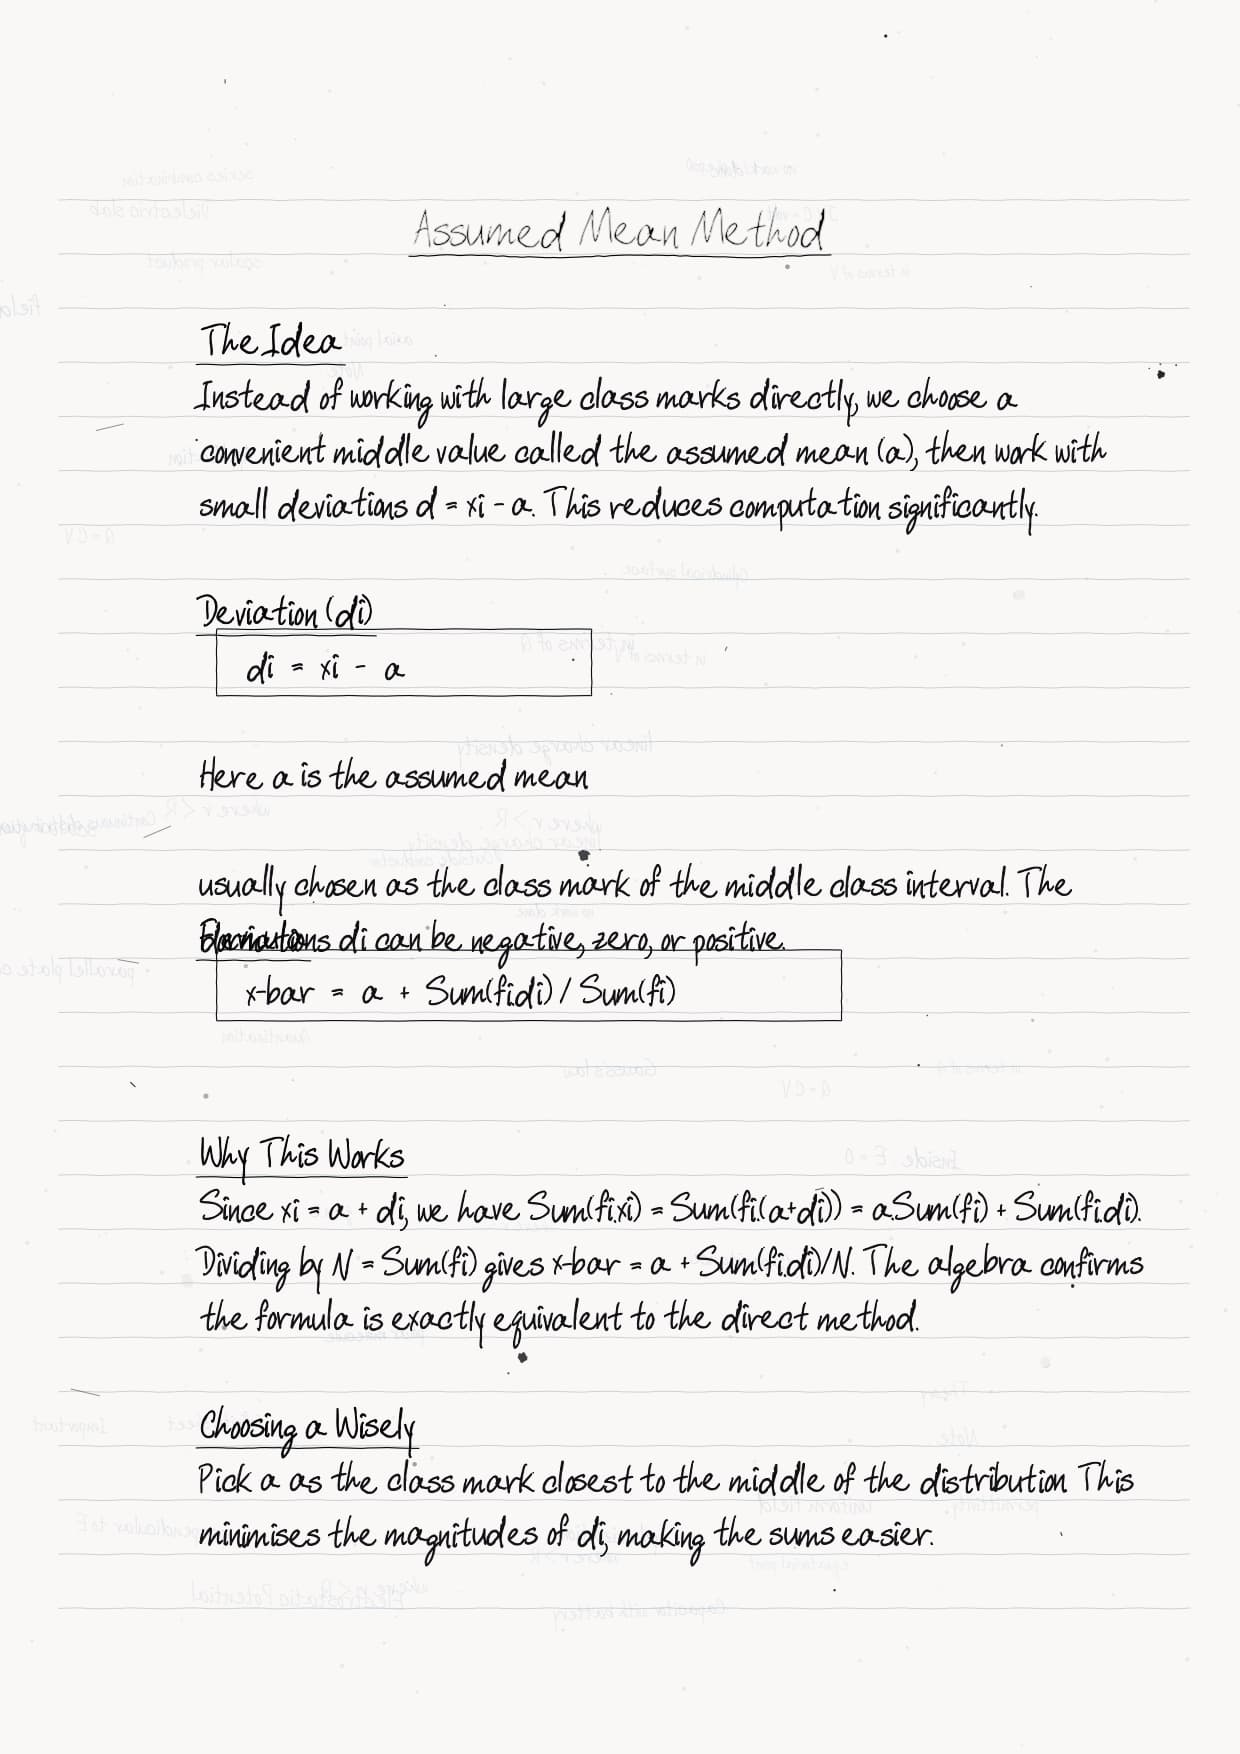
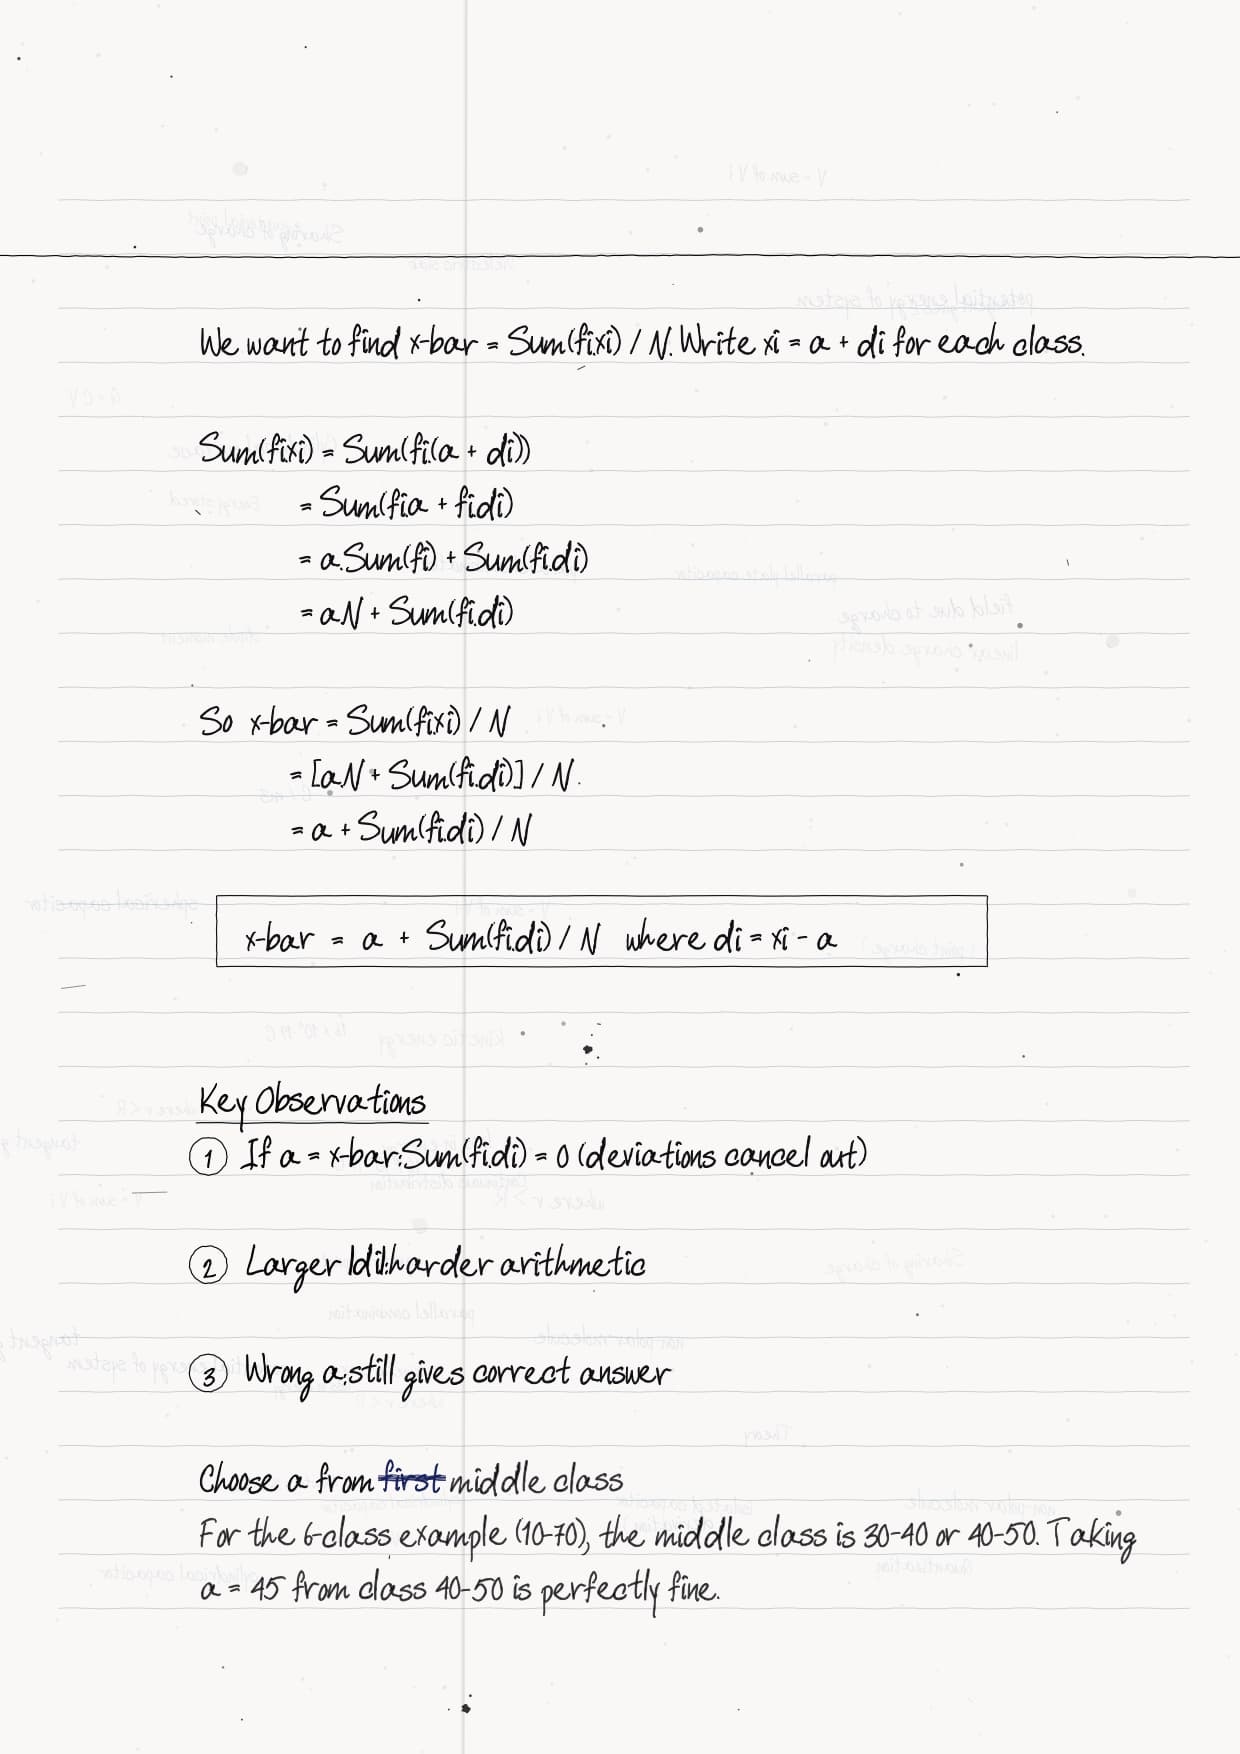
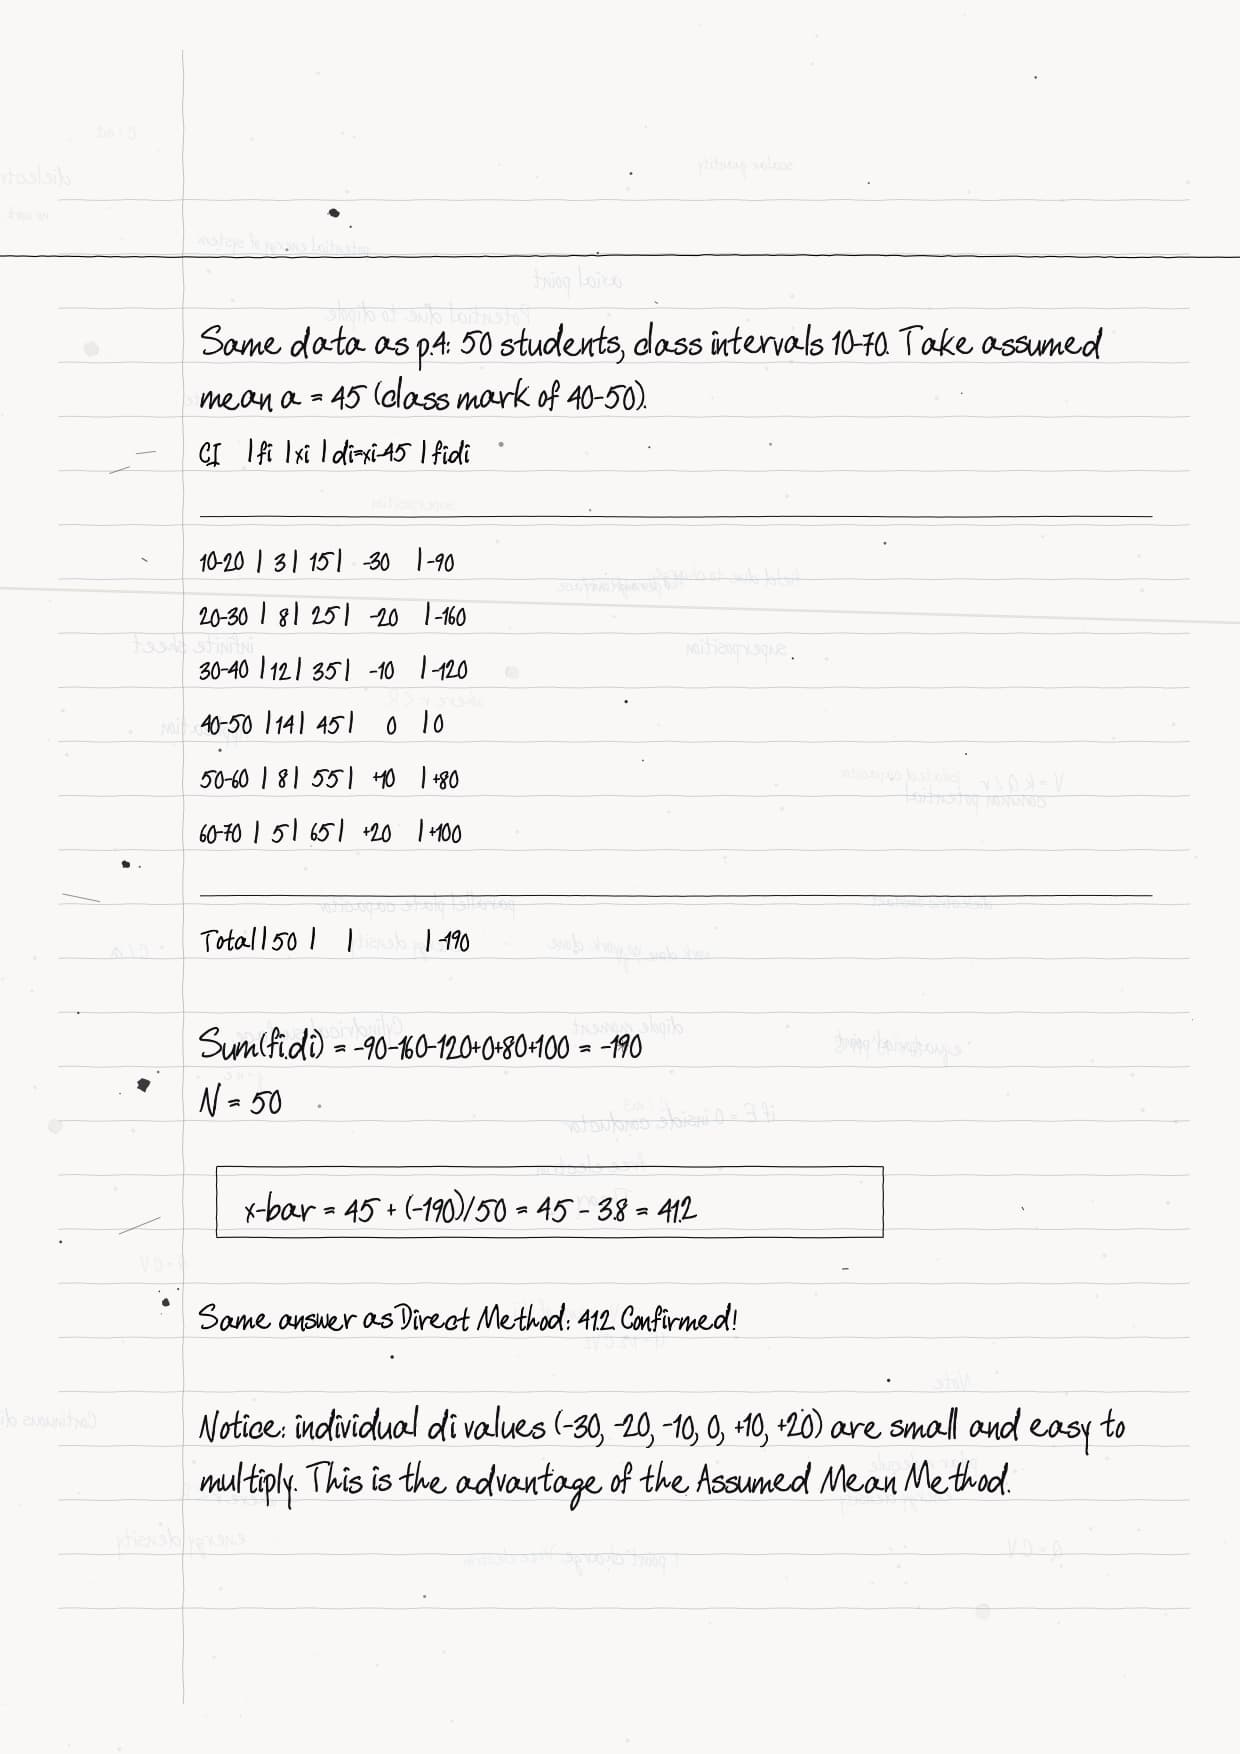
- CBSE Board: about 4 to 6 marks, usually one long-answer sum on grouped mean, mode, or median
- JEE Main: rarely a direct question, but central-tendency ideas support data-handling problems
The handwritten notebook below opens with the diagram list, walks through the three mean methods, then mode and median, and shuts with a night-before-exam recall card.
These notes are prepared by Collegedunia subject mentors, matched to the 2026-27 NCERT print and recent CBSE Board papers.
|
Table of Contents |
Watch Statistics Class 10 Maths Chapter 13 Explained
Source: Magnet Brains on YouTube
Statistics Handwritten Notes: Complete Diagram List for Class 10 Maths
The class 10 maths handwritten notes chapter 13 Statistics hold 6 hand-sketched diagrams you can copy onto rough paper during revision. The table maps each figure to its page so you can jump straight to the spread you need.
| Page | Diagram | What It Shows |
|---|---|---|
| 2 | Grouped frequency table | Class intervals, frequencies, and class marks laid out as the starting grid for every method |
| 3 | Direct-method working strip | Columns for class mark, frequency, and their product, ready to total |
| 4 | Assumed-mean column sketch | How deviations are taken from a chosen assumed mean, with signs marked |
| 5 | Step-deviation ladder | Dividing each deviation by the class size to shrink the numbers |
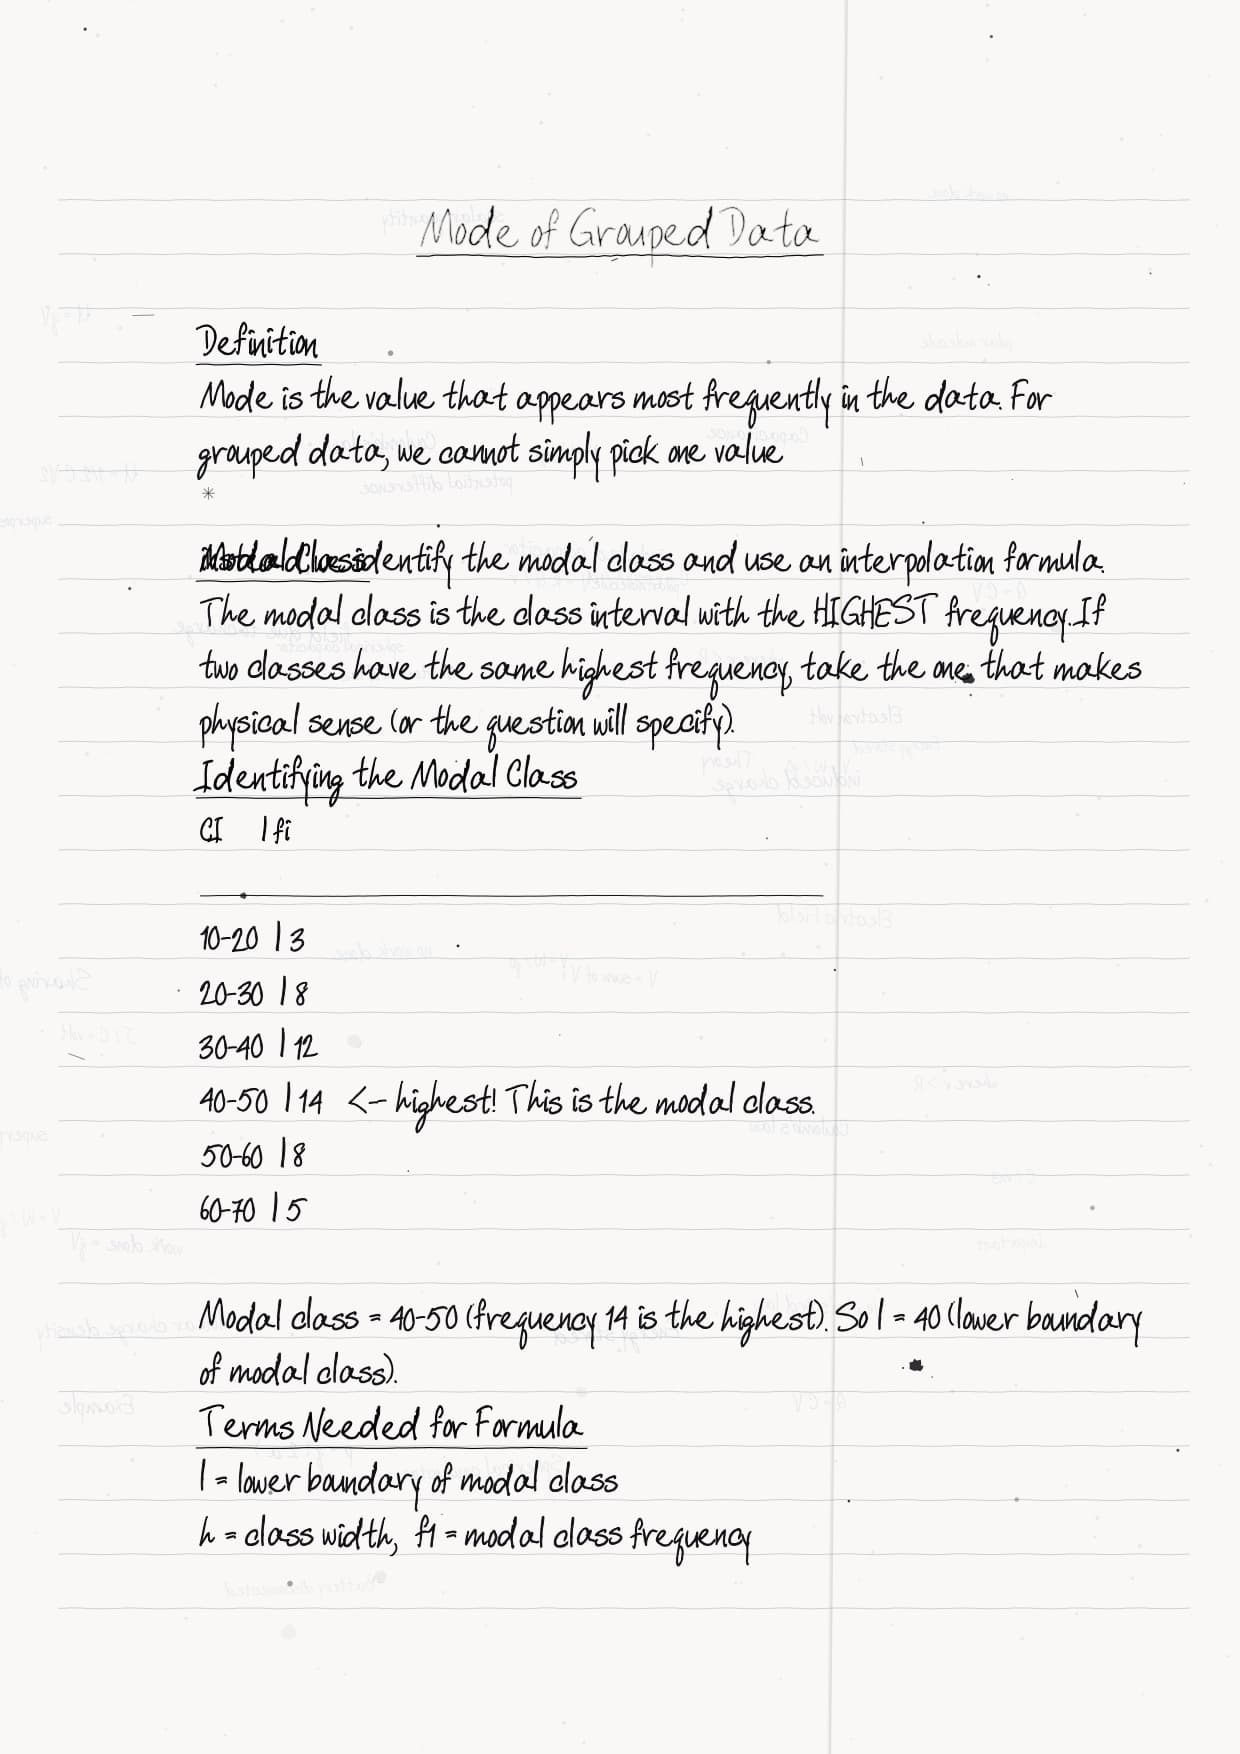
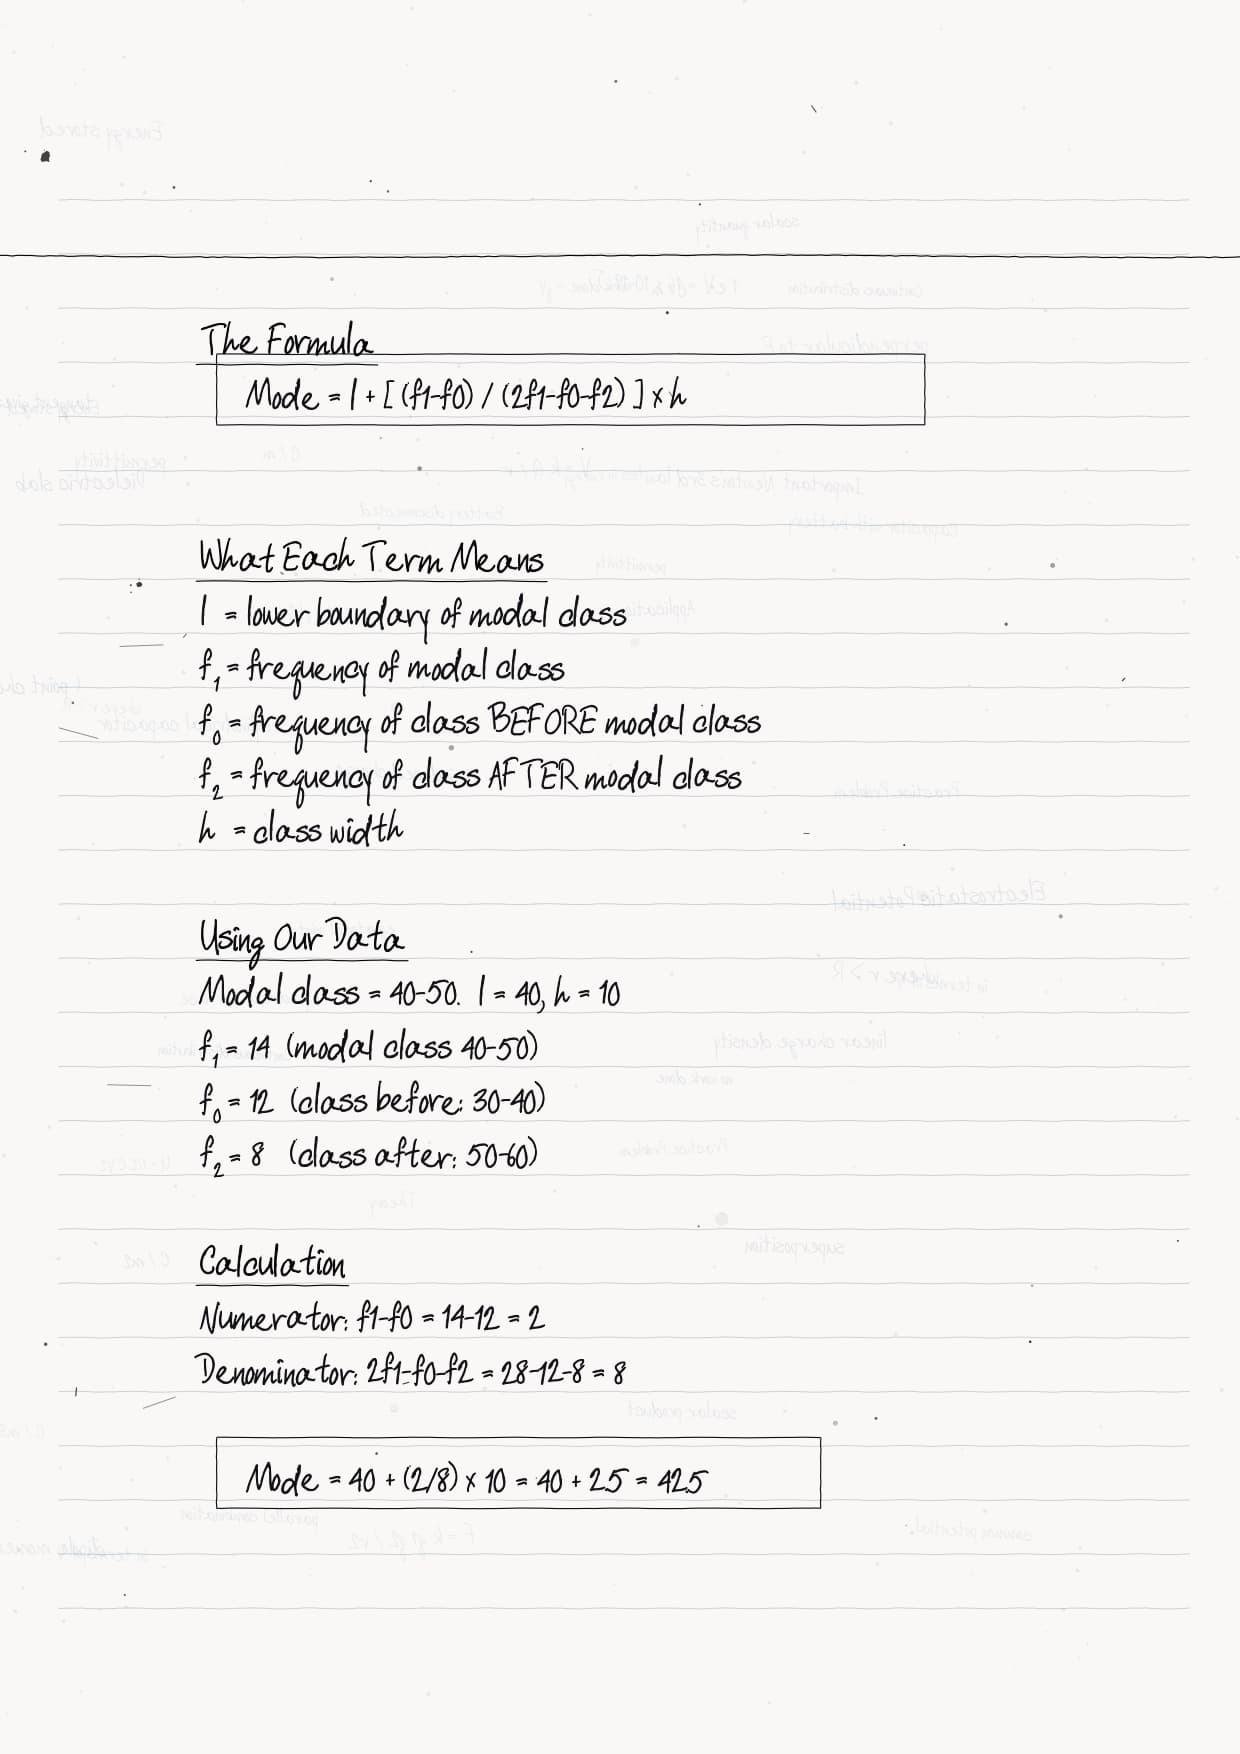
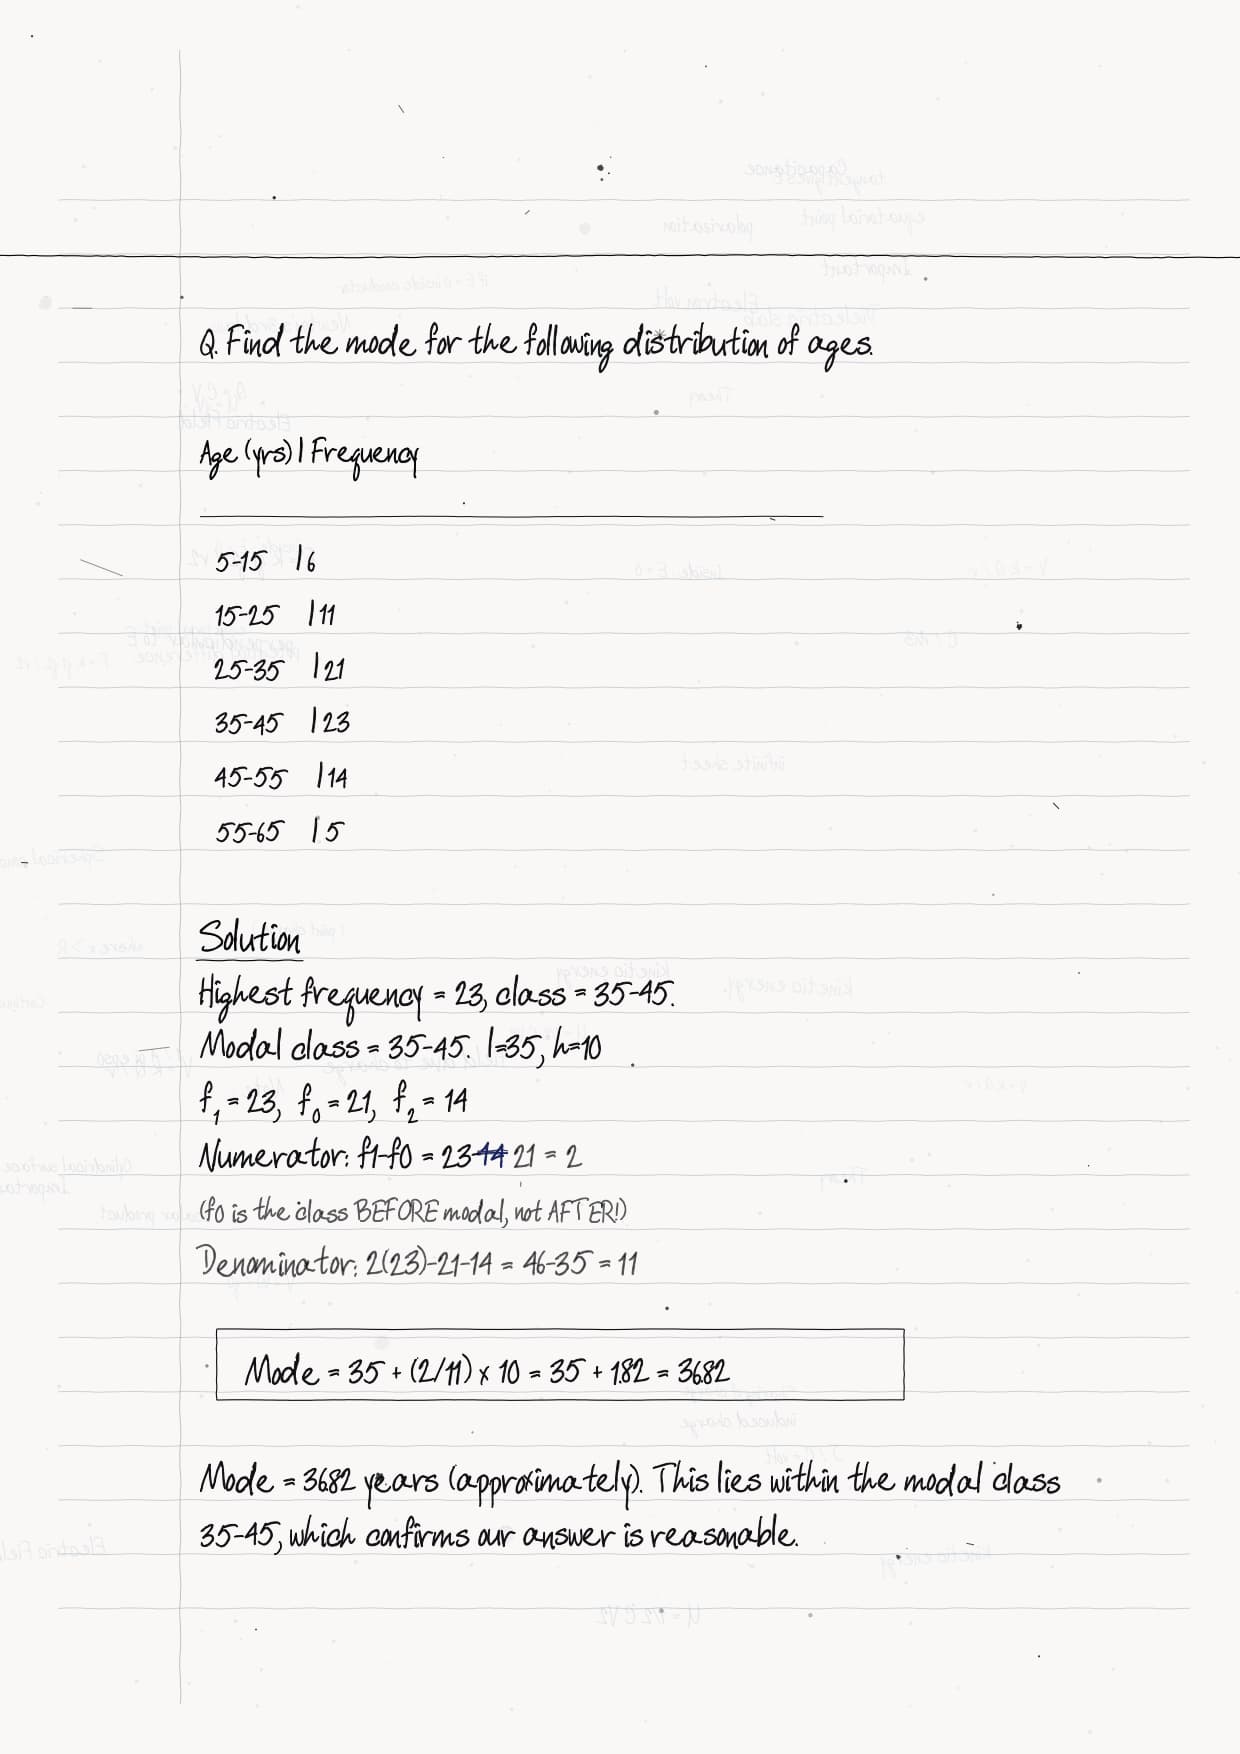
| 6 | Modal-class bar sketch | The tallest bar picked out, with the three frequencies the mode formula needs |
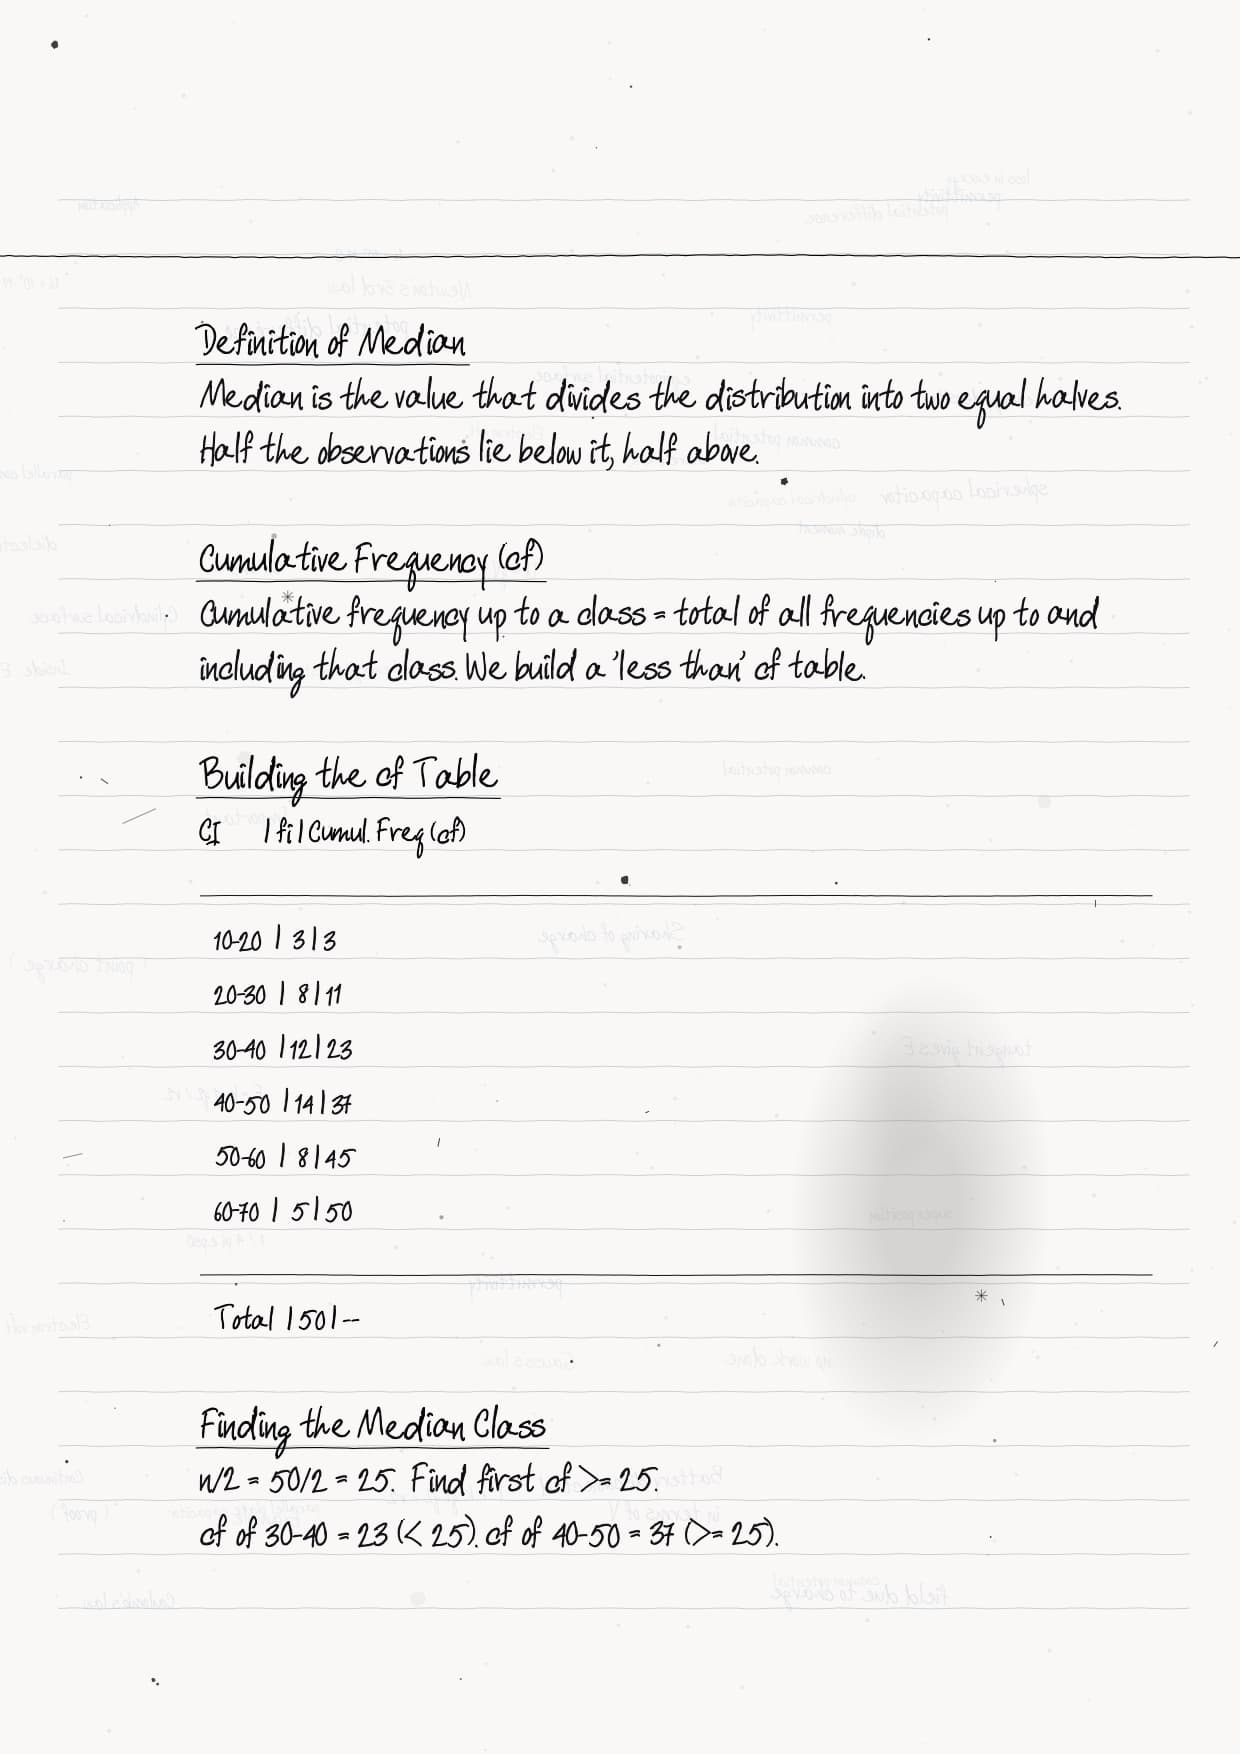
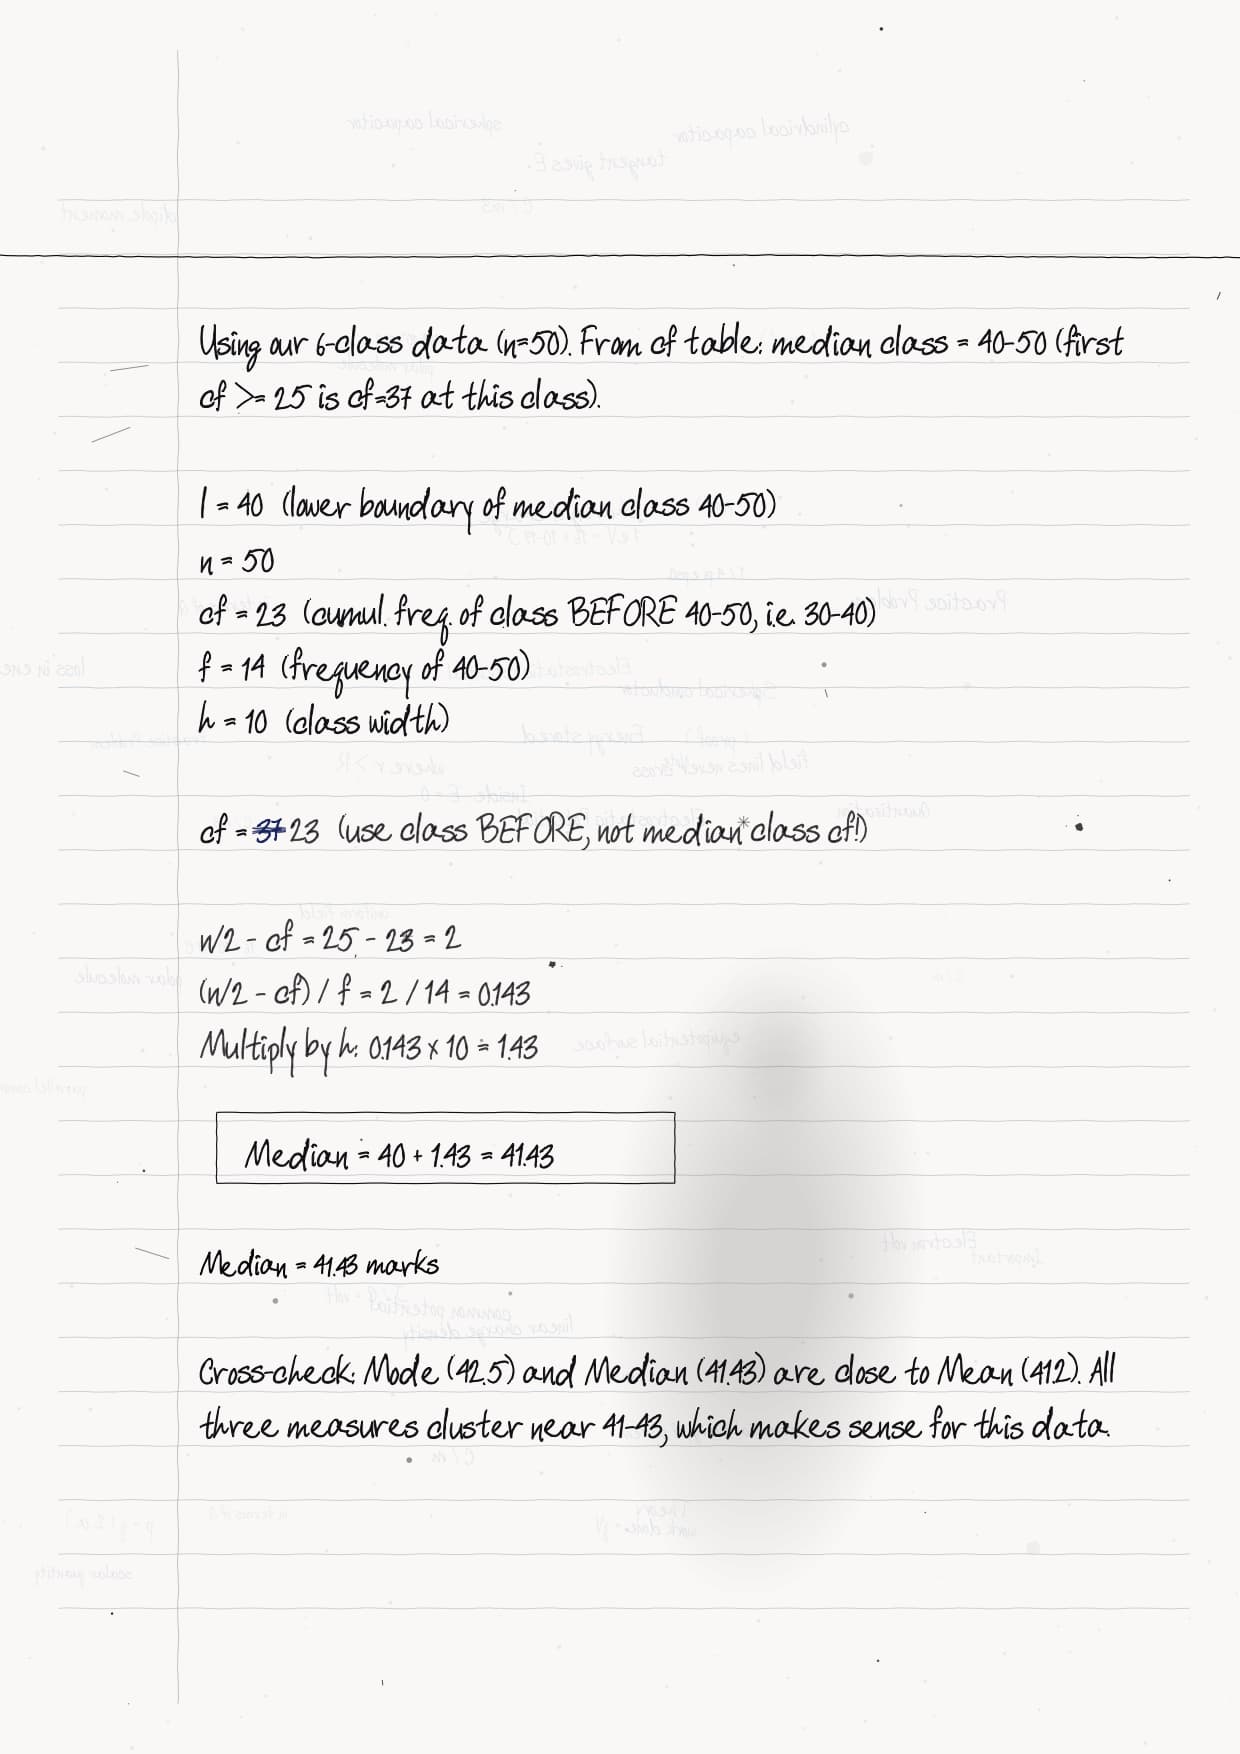
| 7 | Median cumulative-frequency strip | Running totals that find the class holding the middle value |
Topics Covered in Class 10 Maths Chapter 13 Statistics Handwritten Notes
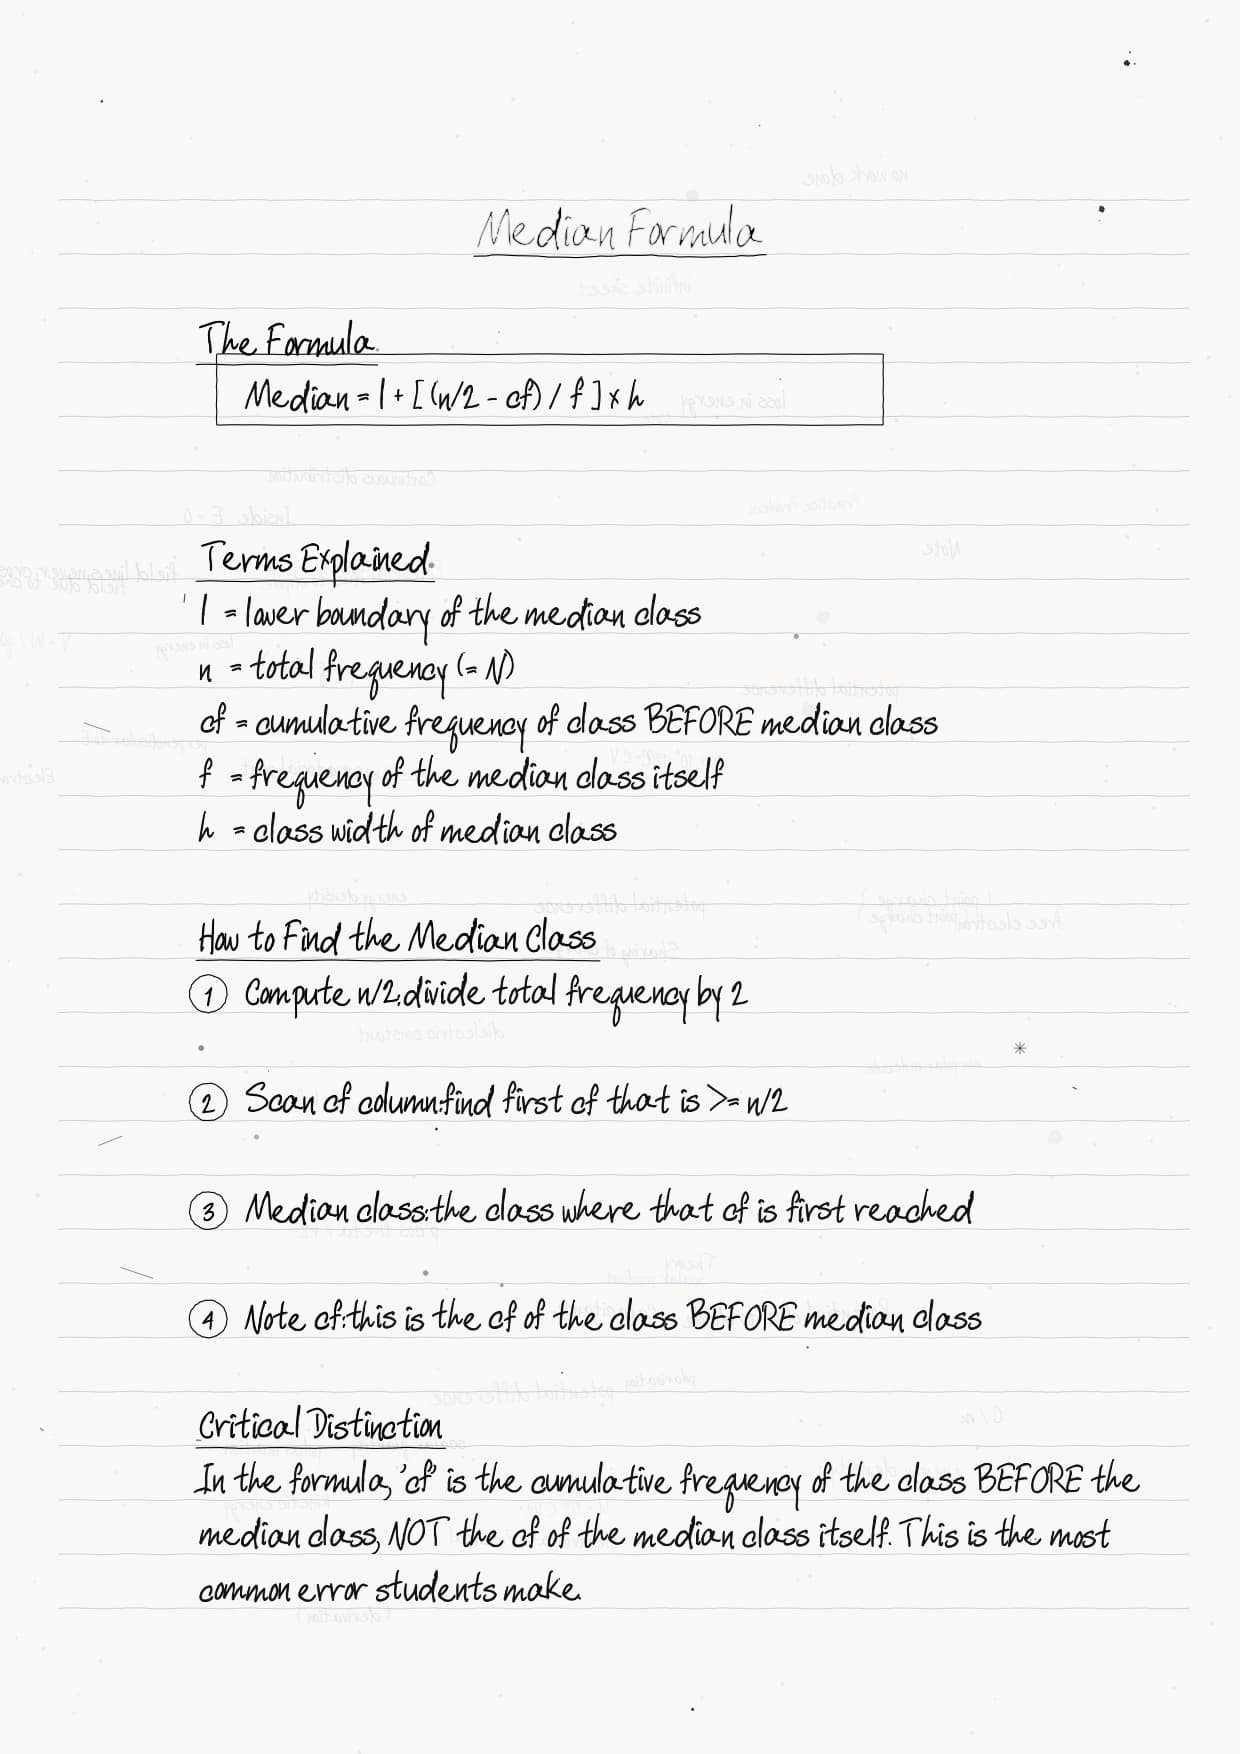
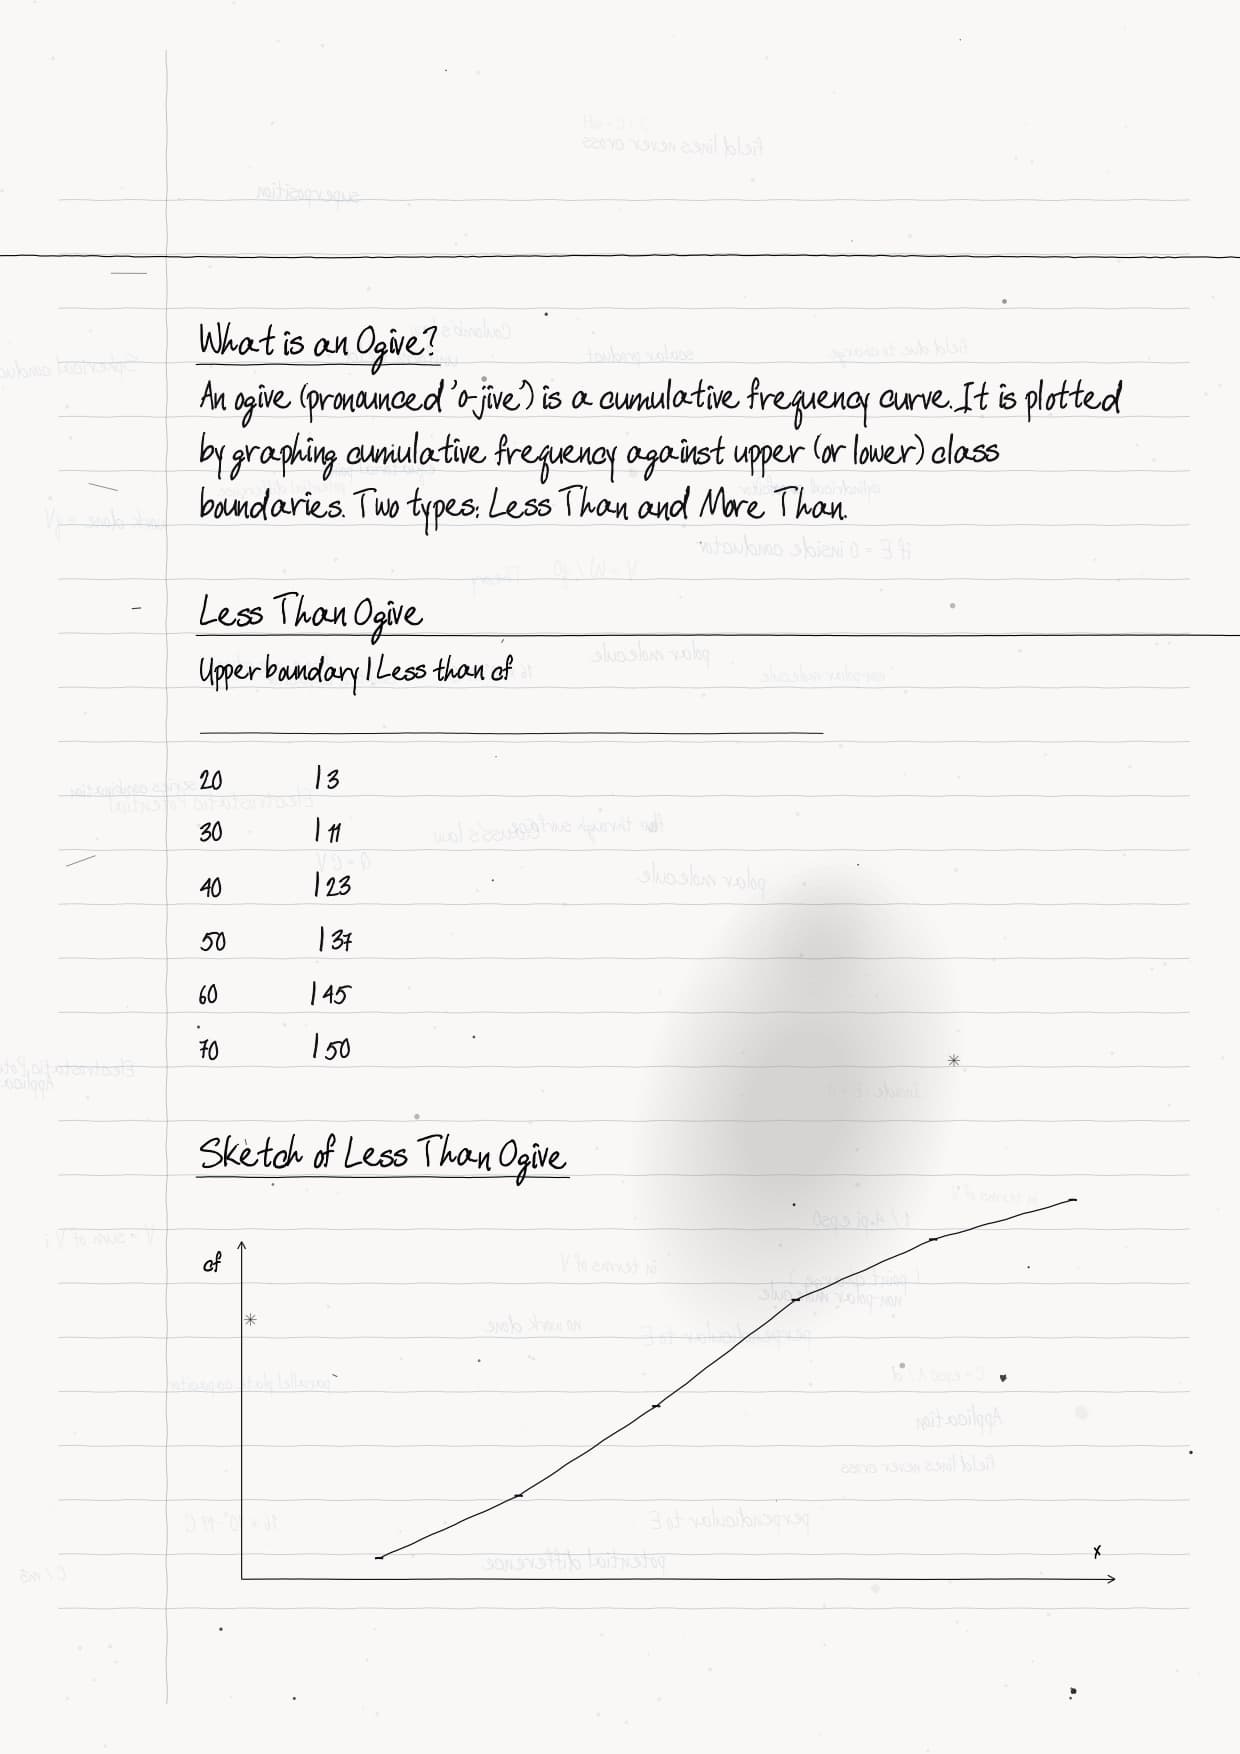
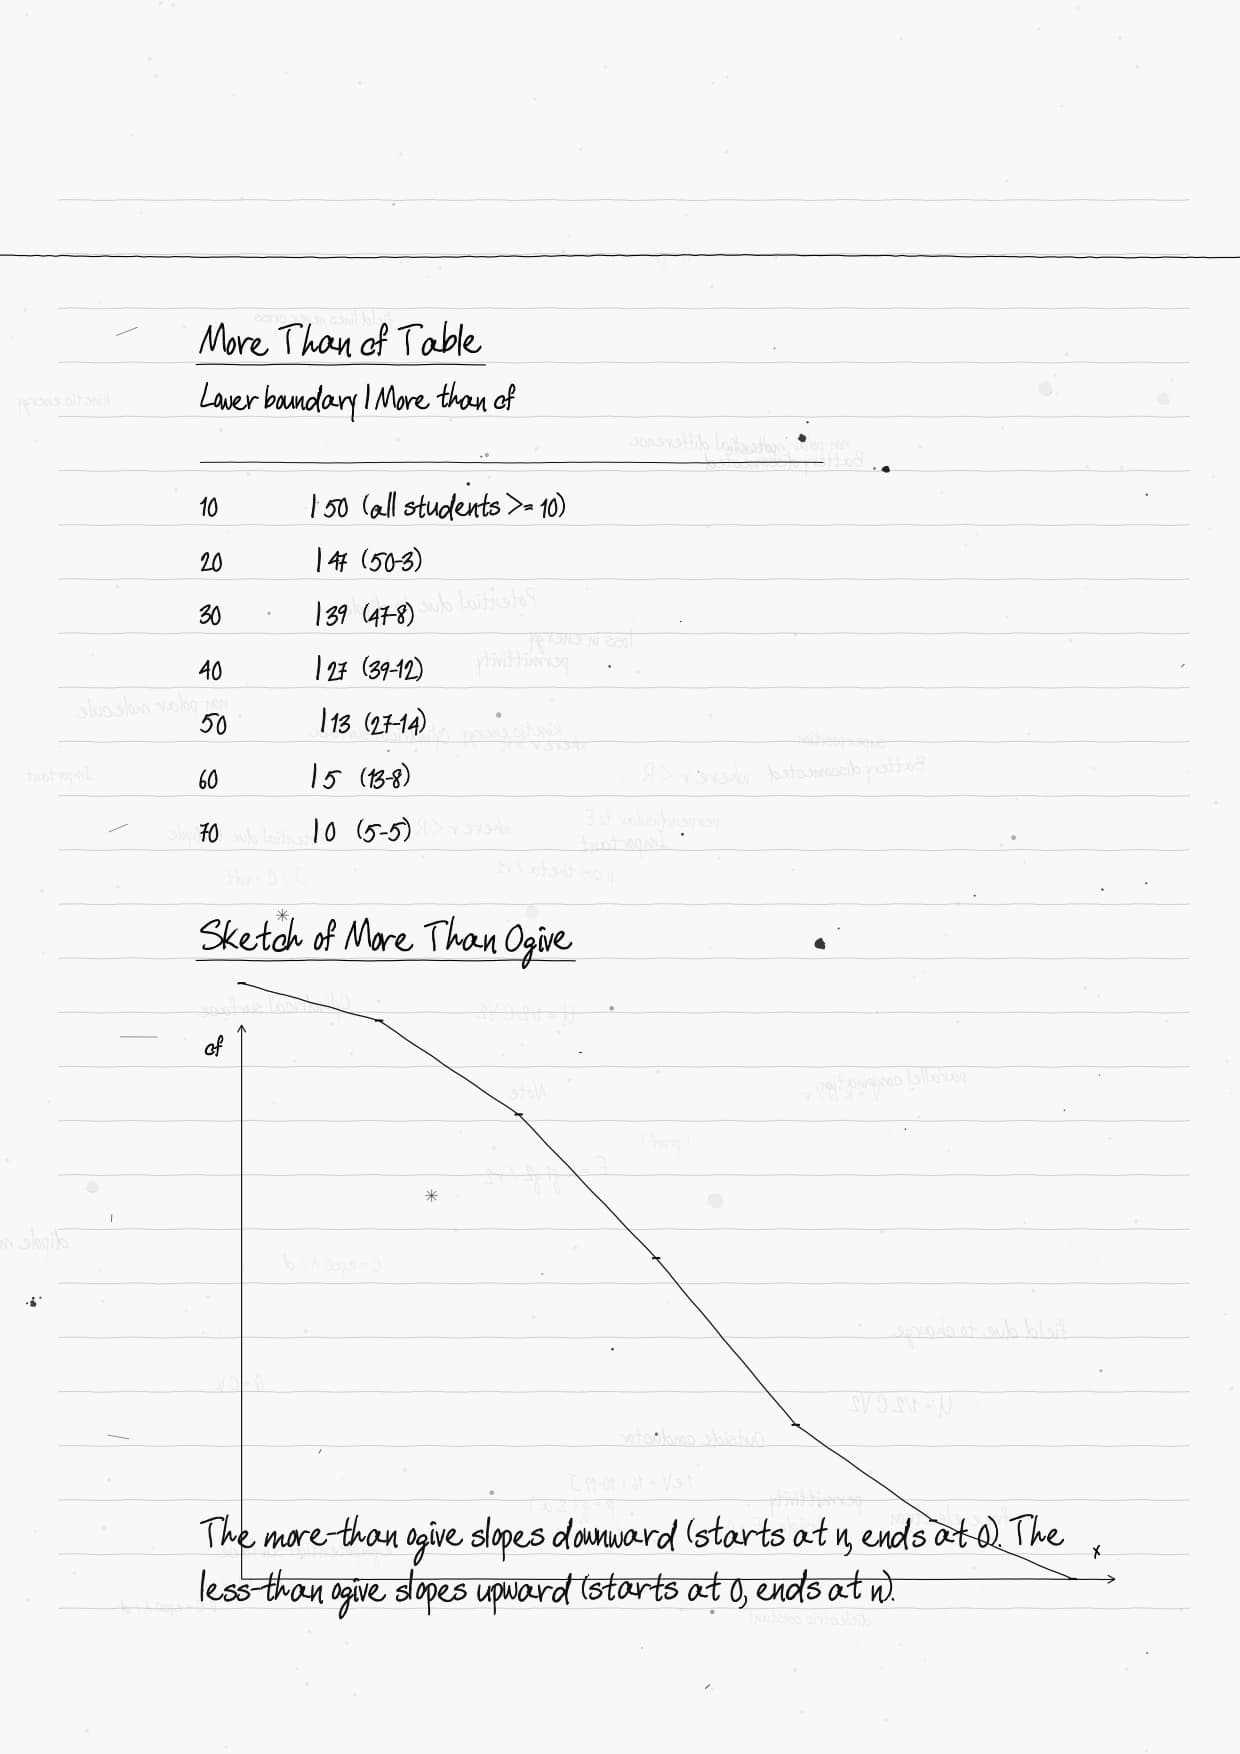
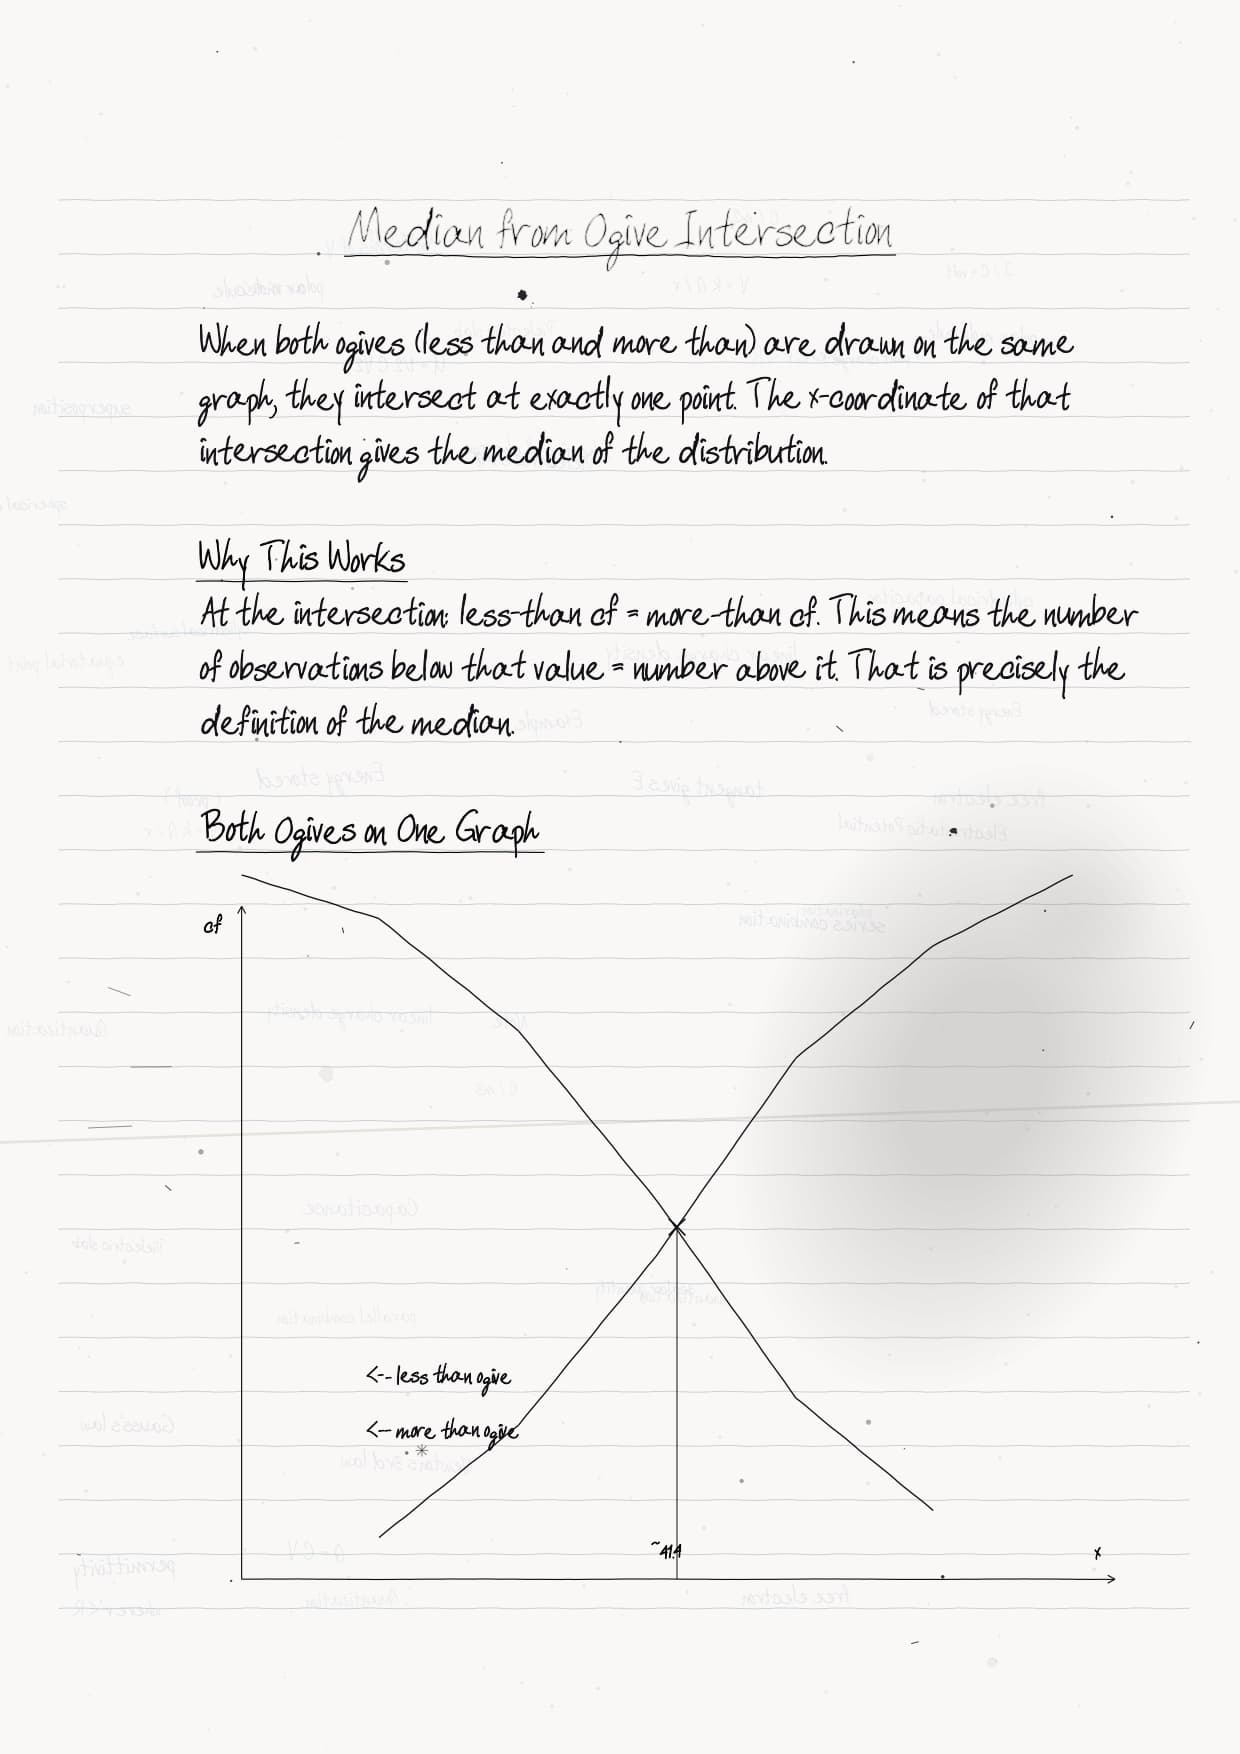
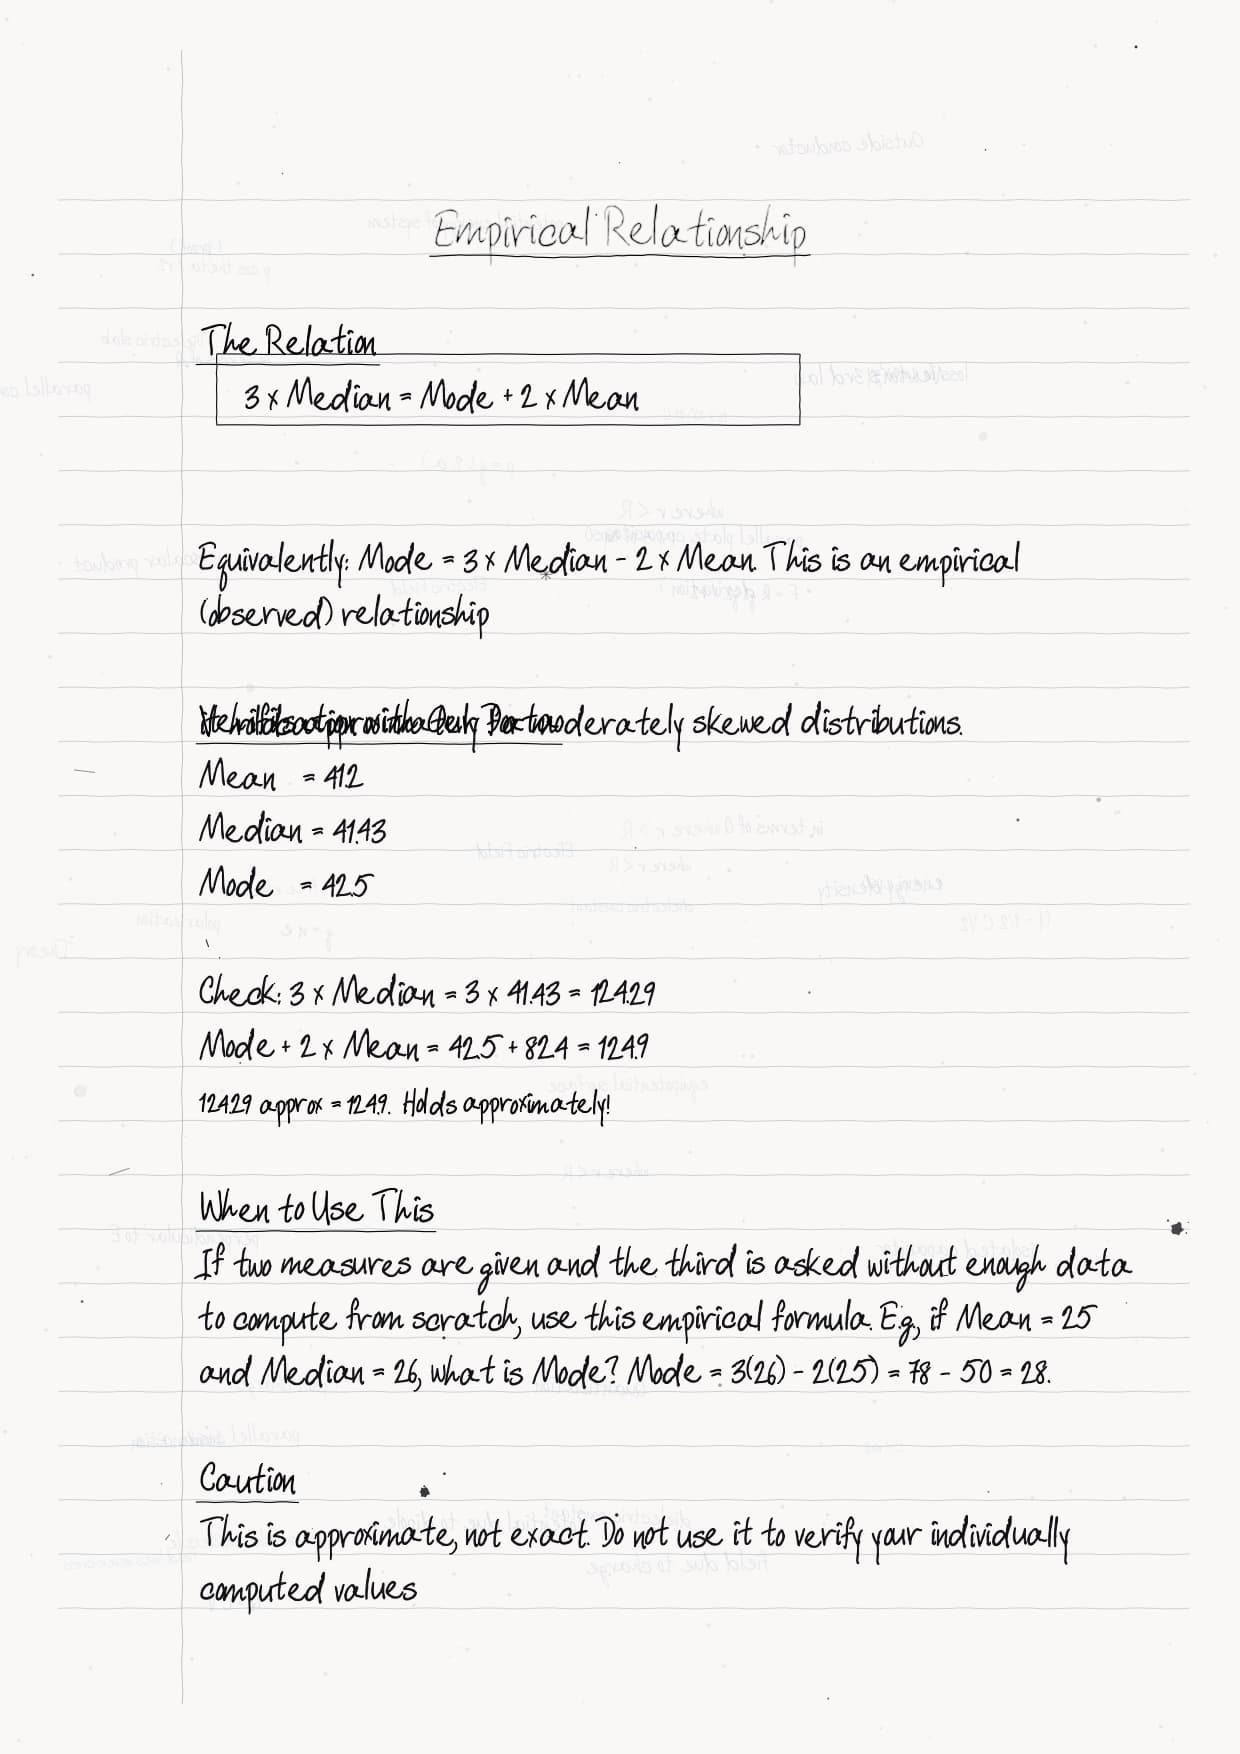
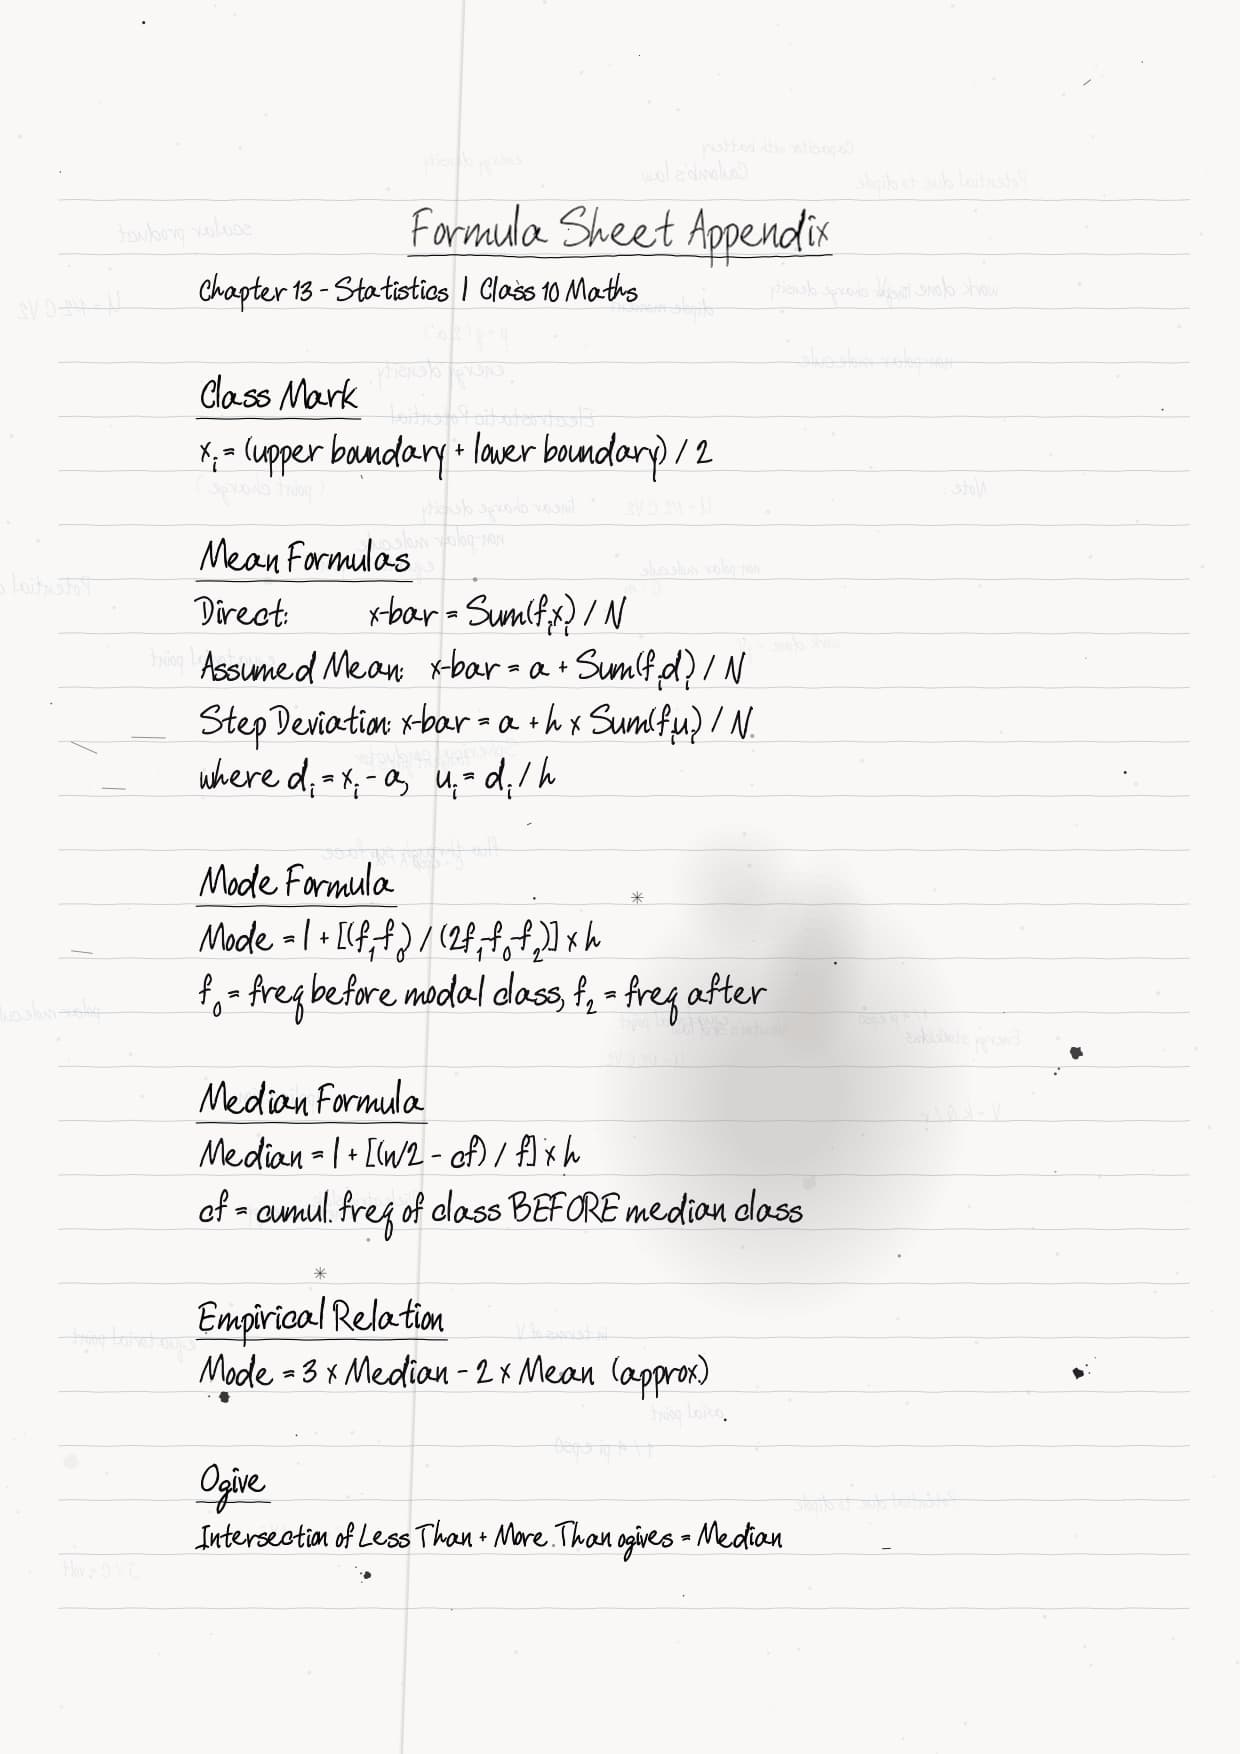
The handwritten notebook maps every current topic onto its own ink-coded page. The chapter opens with the mean of grouped data found three ways: the direct method using class marks, the assumed-mean method using deviations, and the step-deviation method that shrinks those deviations with the class size. Next comes the mode of grouped data, where the tallest class becomes the modal class and the boxed formula Mode = l + f1 - f02f1 - f0 - f2 h finishes the work. The last block builds the median of grouped data from cumulative frequencies, closing with Median = l + n2 - cff h. The cumulative-frequency curve and the empirical mean-median-mode relation are not part of the current core, so the notebook keeps focus on the three averages.
Statistics Handwritten Notes: Color Legend for the Notebook
The class 10 maths handwritten notes chapter 13 Statistics use four ink colours in a fixed way. Knowing the legend lets you skim all 11 pages in a few minutes during last-day revision.
| Colour | Box Type | What's Inside |
|---|---|---|
| Orange | Definition box | Class mark, class size, frequency, cumulative frequency, modal class, median class |
| Blue | Formula box | The three mean formulas plus the mode and median relations, each with a worked column |
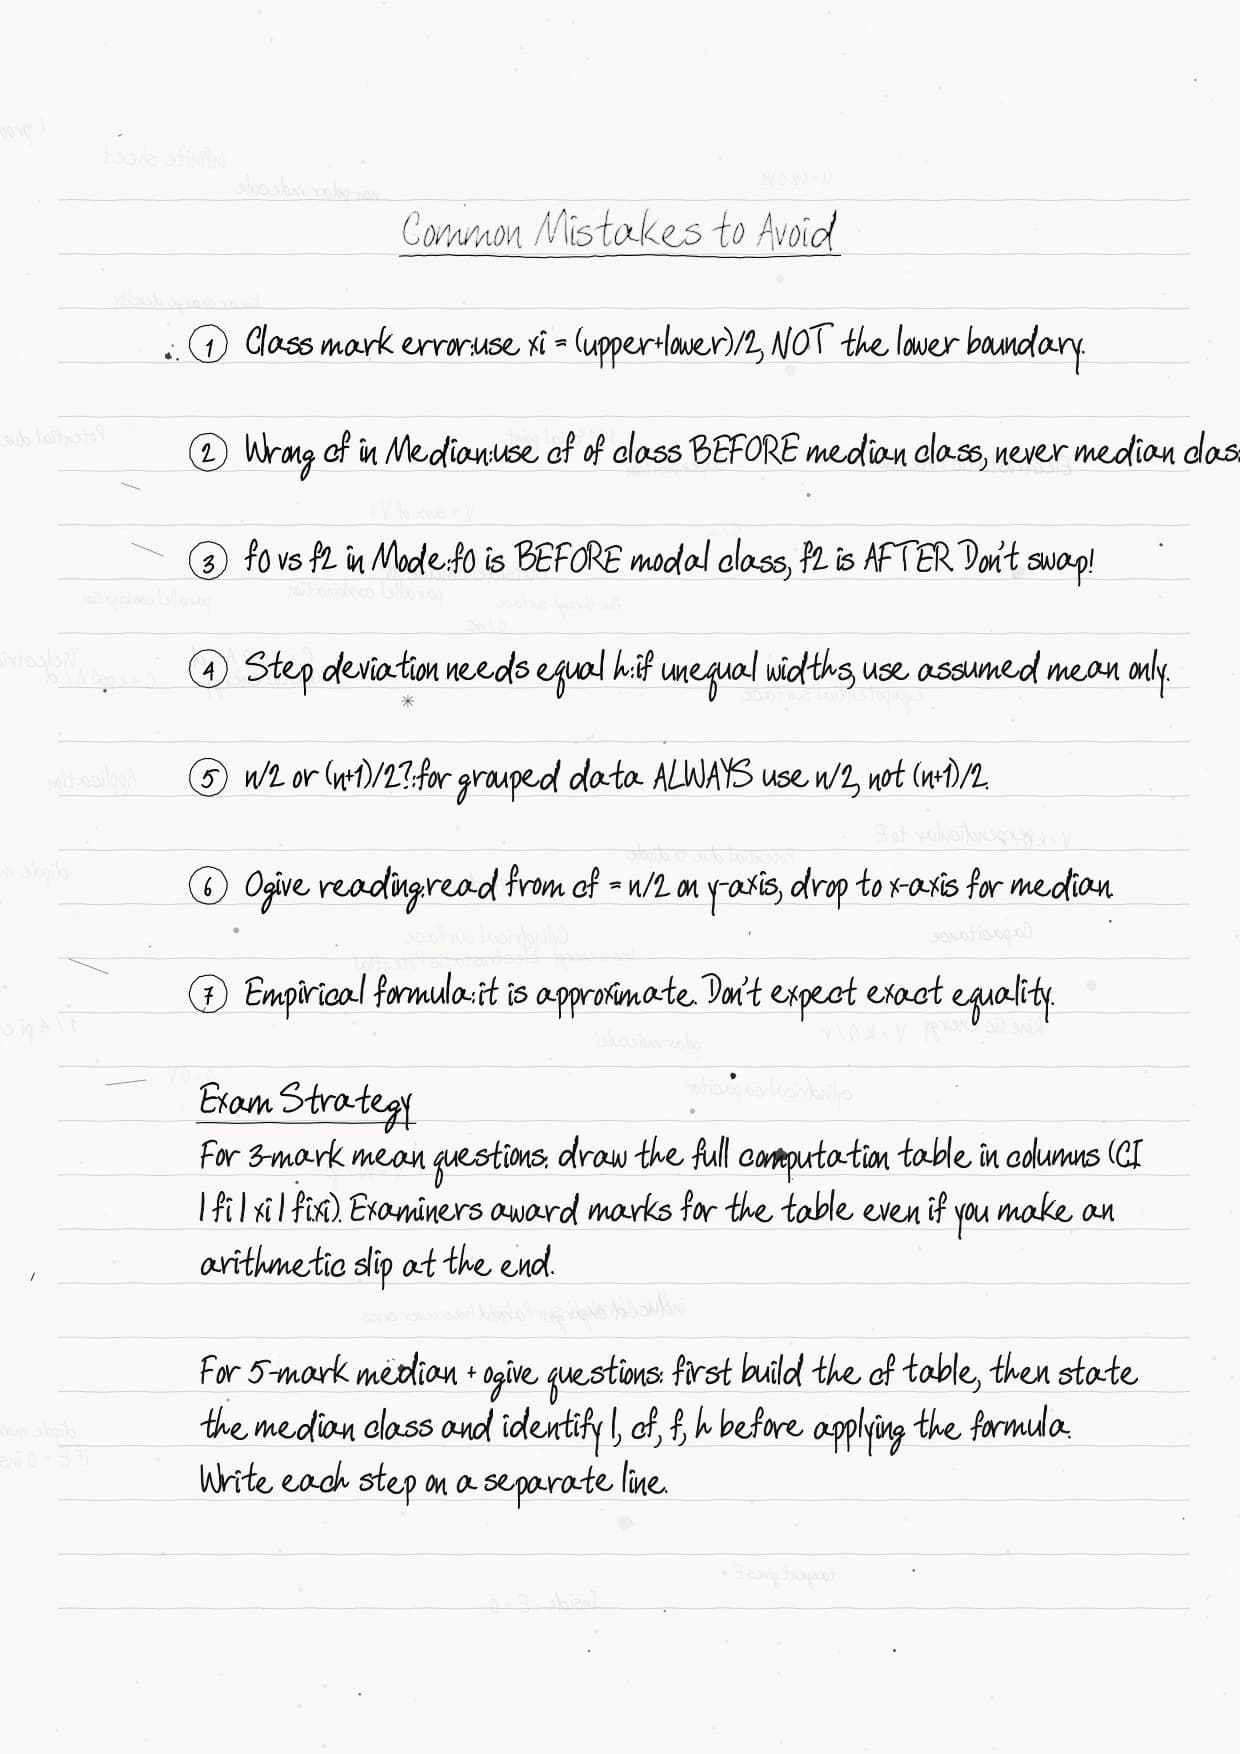
| Yellow | Exam-trap callout | Common traps, like using the upper limit instead of the lower limit l in the formula |
| Red | Common-mistake box | Wrong cumulative-frequency totals shown next to the correct running sum |
Statistics Handwritten Notes Concept-Flavoured Memory Mnemonics
Three mnemonics the notebook uses again and again. Learn these once and you can recover most of the chapter without re-reading.
How will Collegedunia's Handwritten Notes Help You with Statistics?
The class 10 maths handwritten notes chapter 13 Statistics turn a formula-heavy chapter into an 11-page revision stack you can finish in one sitting.
- Hand-Sketched Visual Anchors: The frequency table, the modal-class bars, and the cumulative-frequency strip are drawn freehand so you can redraw each from memory in under a minute.
- Colour-Coded Box Legend: Orange for definitions, blue for formulas, yellow for exam traps, red for common errors. The same legend runs through every chapter so revision stays fast.
- 2026-27 NCERT Alignment: Every page matches the current 2026-27 print, so you revise only the three averages the latest syllabus actually tests.
- Worked-Column Layout: Each method shows a full worked column, the exact form CBSE wants in the answer sheet, so you earn each step mark.
Statistics Top Formulae for Class 10 Maths Quick Recall
These few relations cover nearly every numerical CBSE asks. The full step-by-step working sits on the Formula Sheet.
| Idea | Relation |
|---|---|
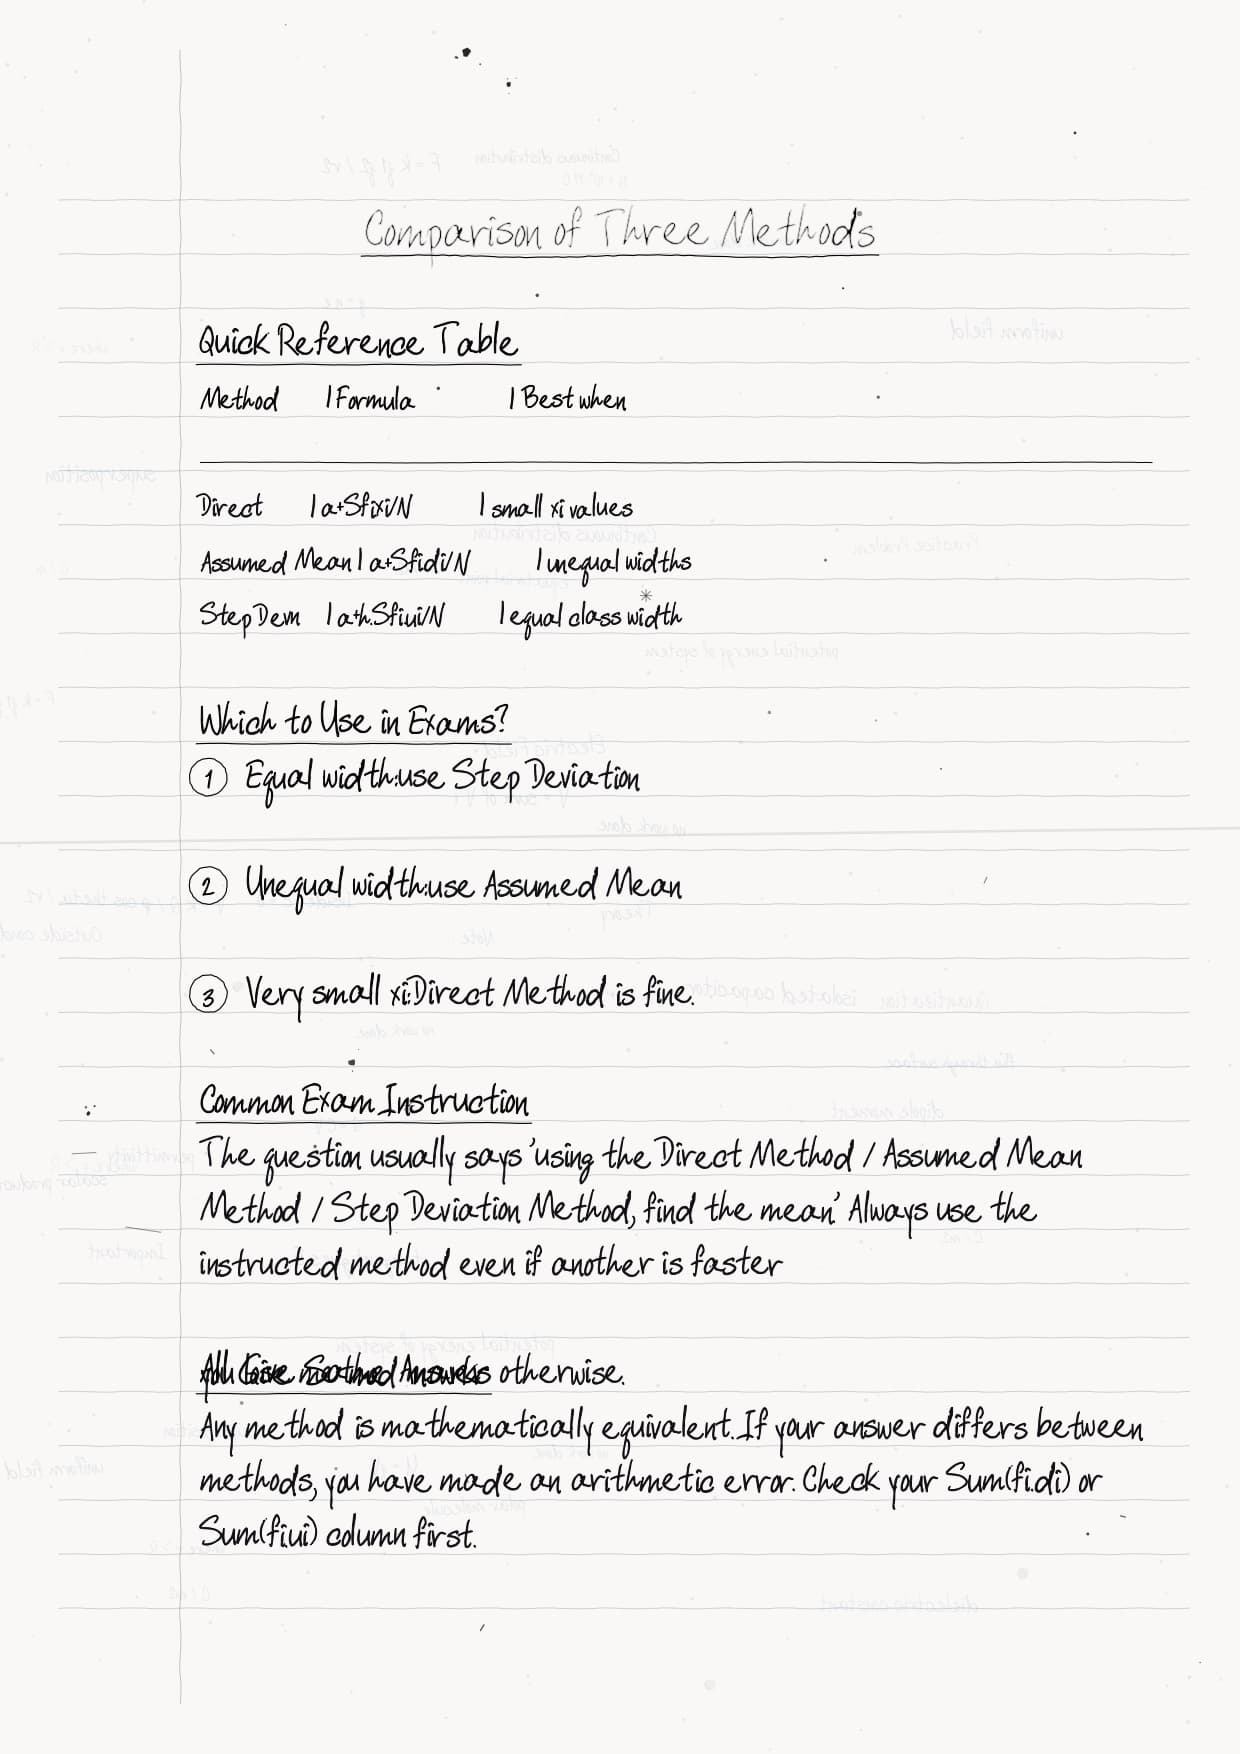
| Mean, direct method | x̄ = ∑ fi xi∑ fi |
| Mean, assumed-mean method | x̄ = a + ∑ fi di∑ fi |
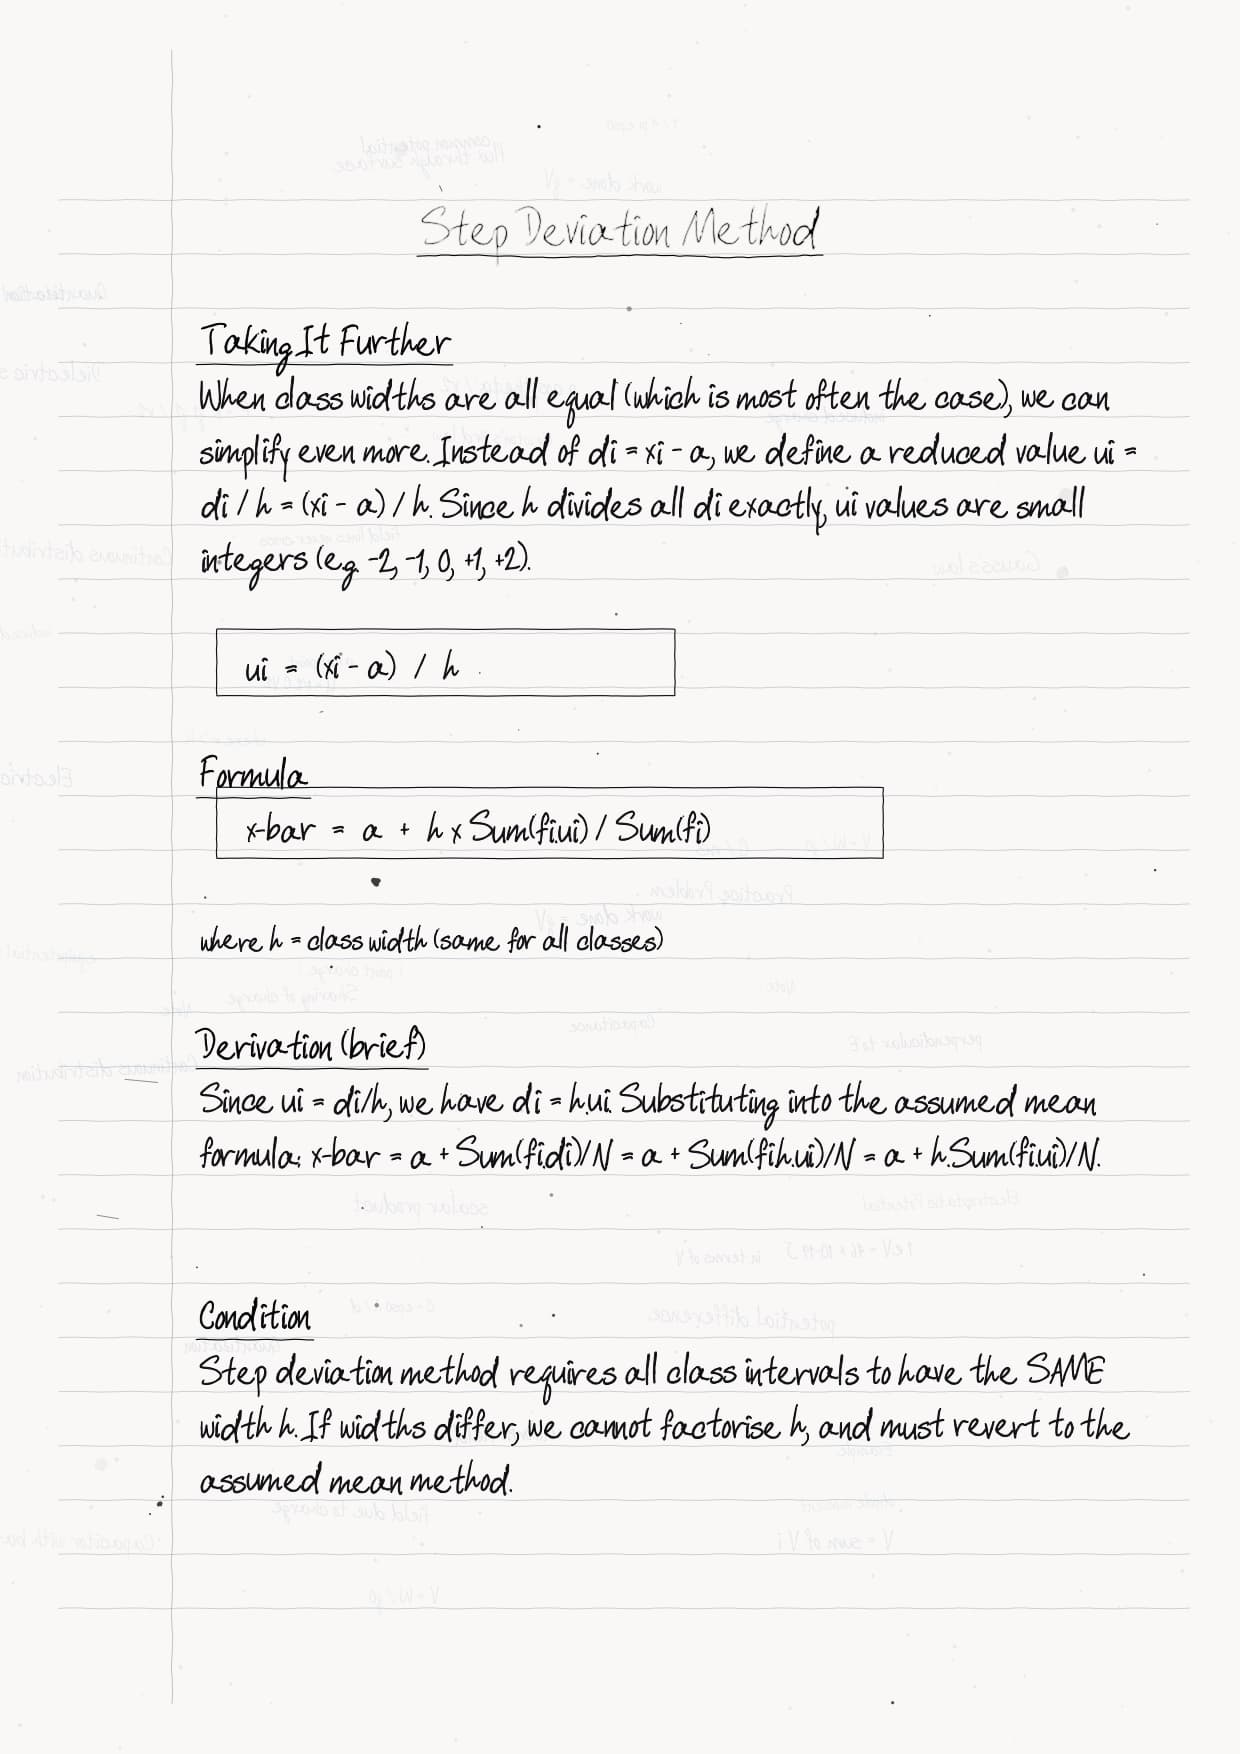
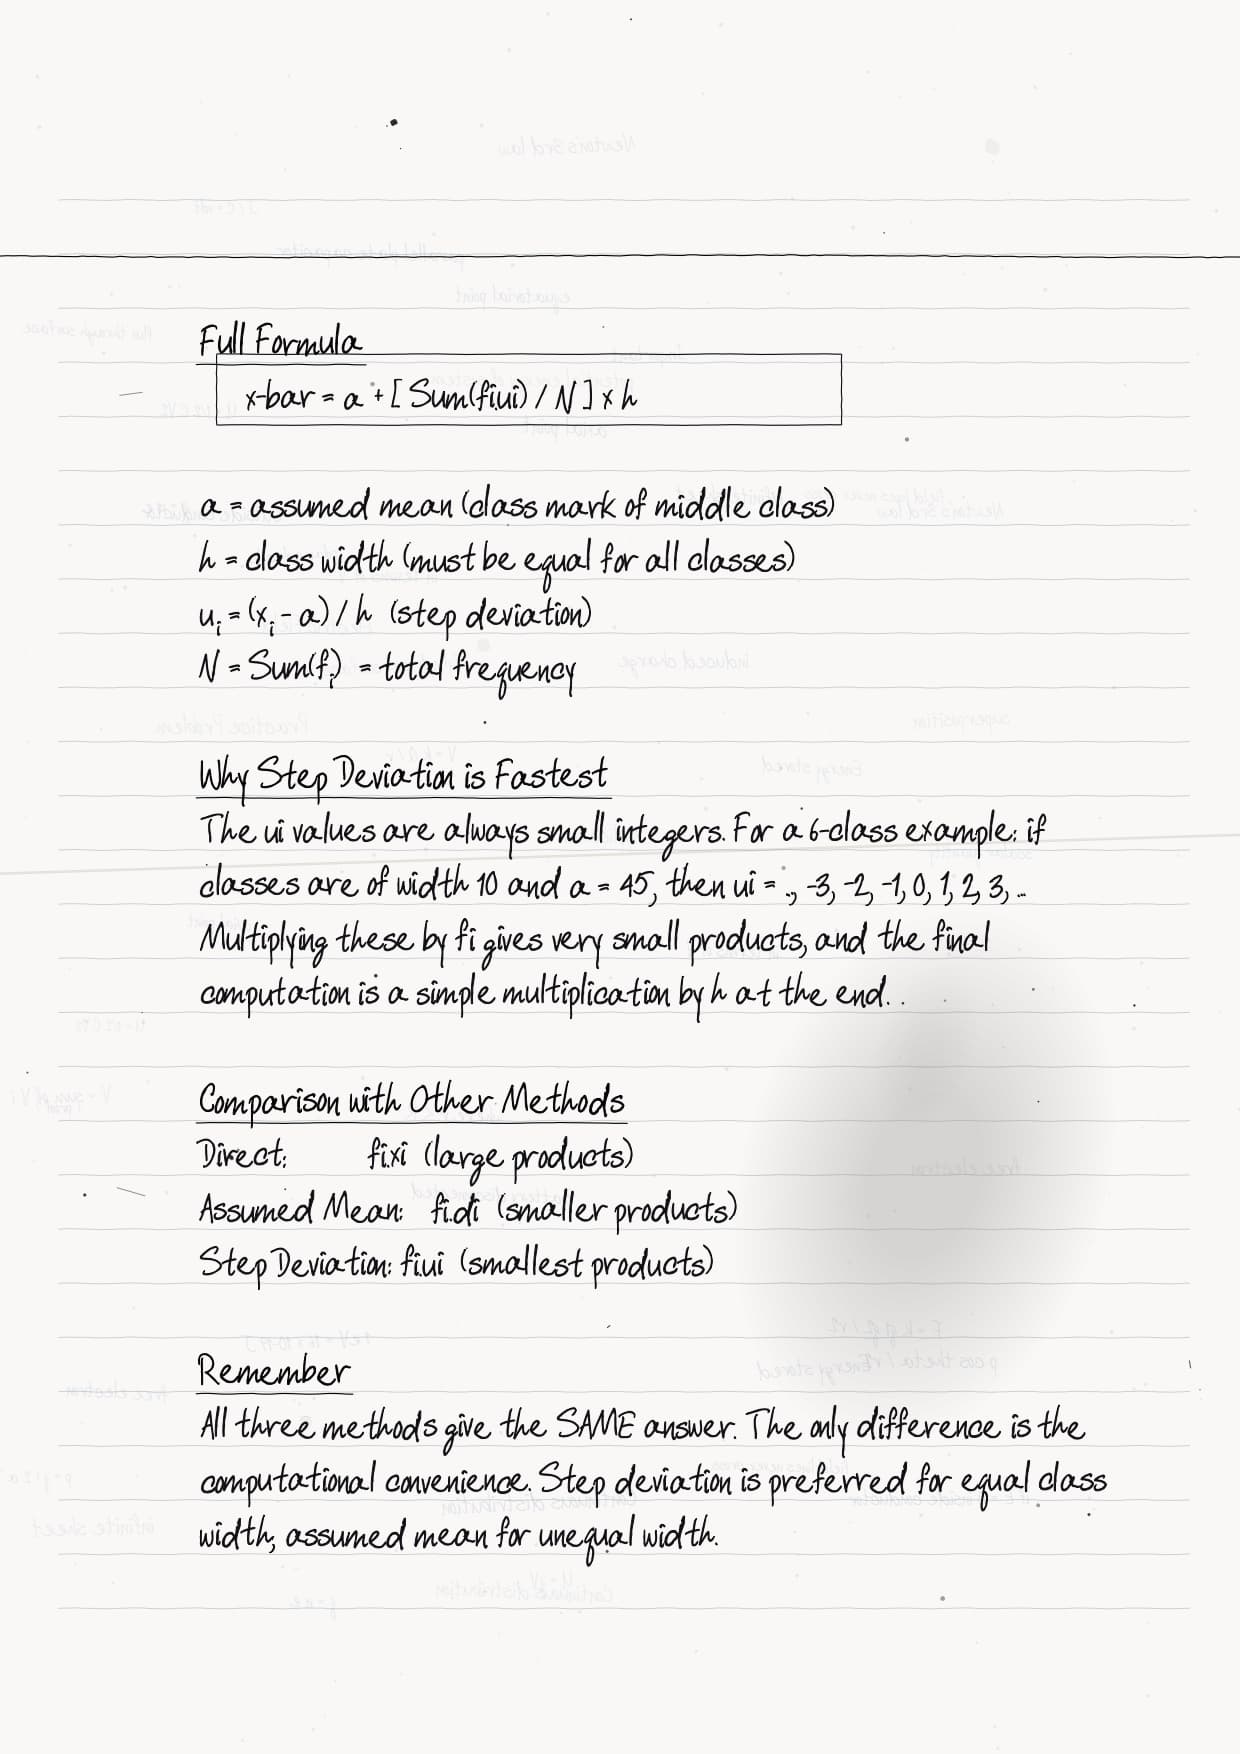
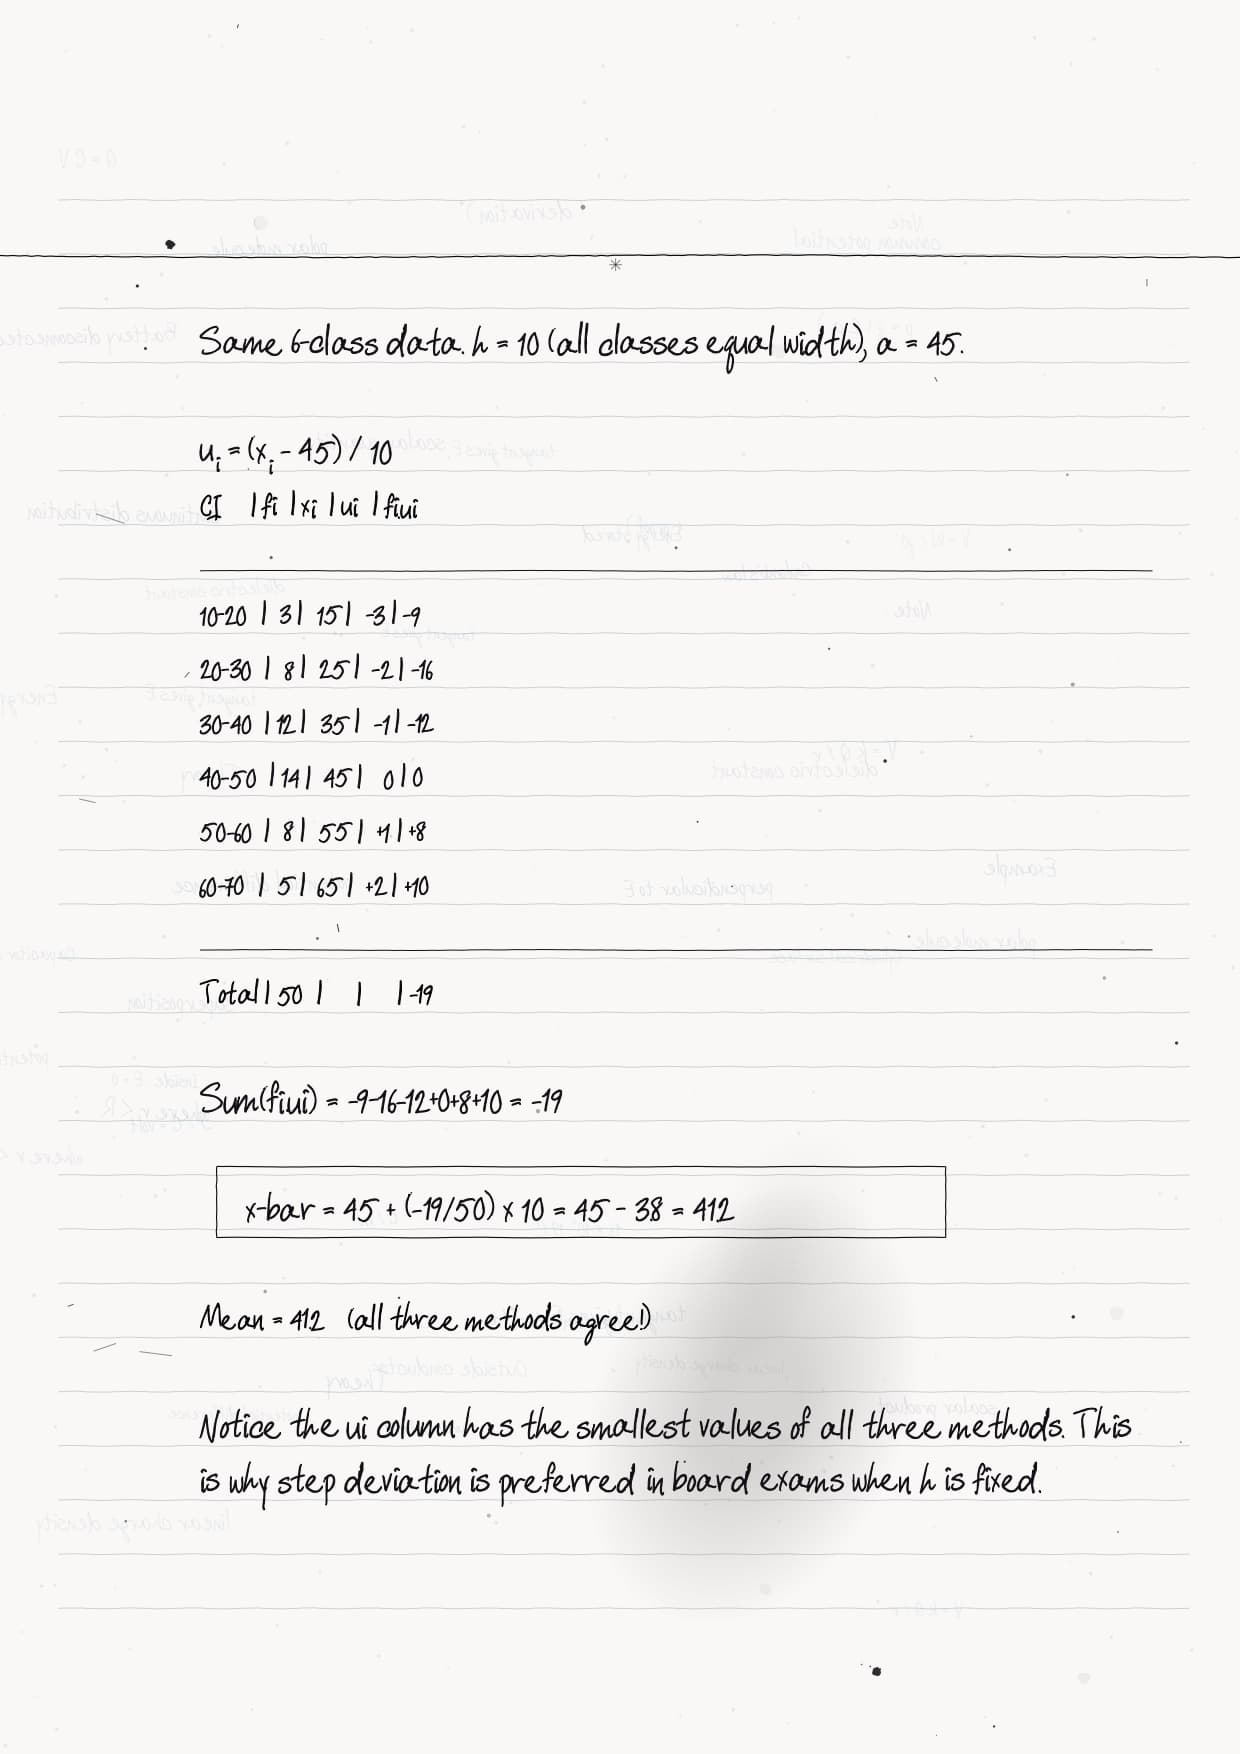
| Mean, step-deviation method | x̄ = a + (∑ fi ui∑ fi)h |
| Mode of grouped data | l + f1 - f02f1 - f0 - f2 h |
| Median of grouped data | l + n2 - cff h |
Full formula table: Statistics Class 10 Maths Formula Sheet
Statistics: Last 24-Hour Revision Card for Class 10 Maths
Scan the single page below the night before the Board exam. The marks come from a clean frequency table plus the right average formula.
- Class mark: the average of a class interval's upper and lower limits. Every mean method starts from these.
- Direct mean: total of frequency times class mark, divided by total frequency.
- Step-deviation mean: pick an assumed mean a, divide each deviation by the class size h, then scale back up. The fastest method when class sizes are equal.
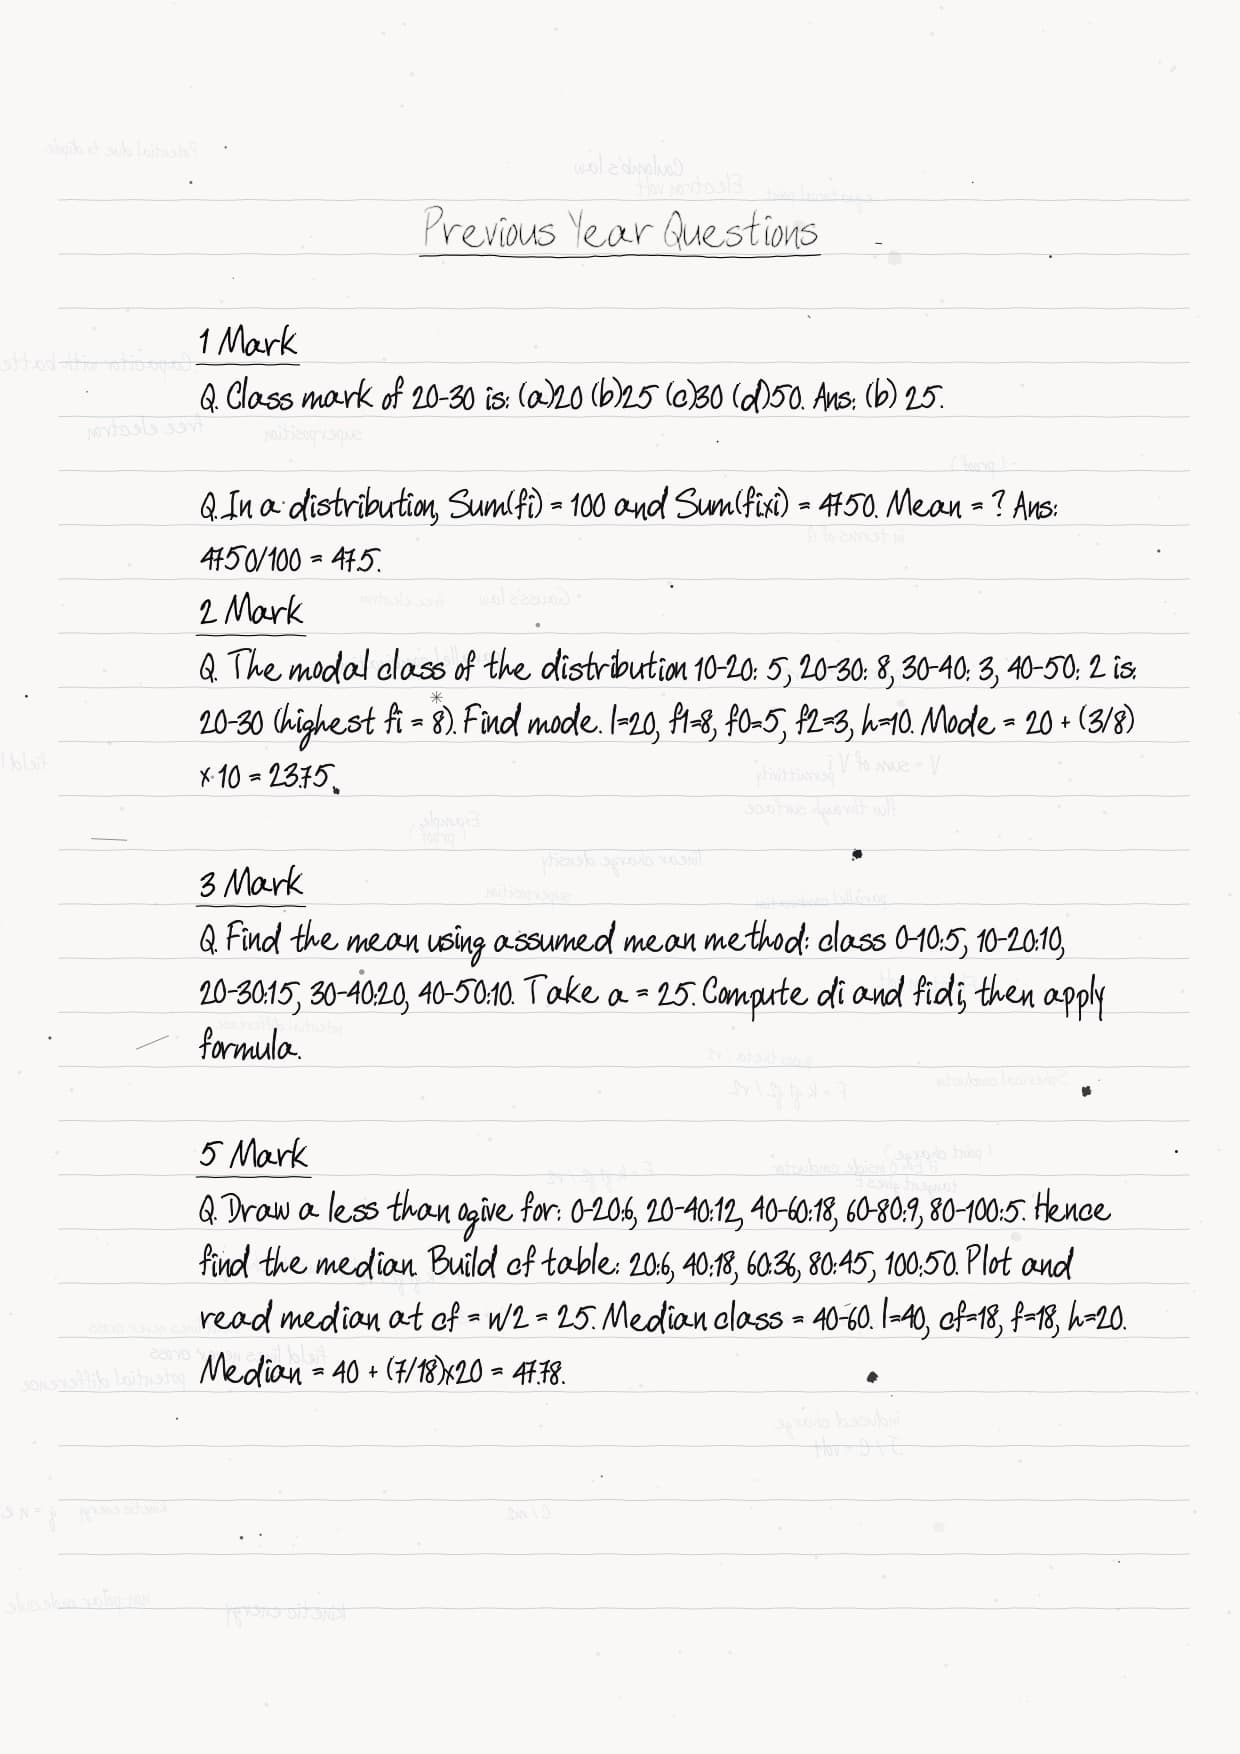
- Mode: spot the modal class, then apply l + f1 - f02f1 - f0 - f2 h.
- Median: build cumulative frequencies, find the class crossing n/2, then apply l + n2 - cff h.
Student Feedback
71% of Class 10 students told us they revise Statistics fastest from hand-drawn pages, and 4 out of 5 said the freehand worked columns made the three mean methods finally click the night before the board exam. The most-redrawn sketch was the step-deviation ladder for the mean.
Students who copied the colour-coded boxes onto rough paper reported finishing the whole chapter recall in under 30 minutes, and the 24-hour revision card was rated the single most useful page by 64% of the poll.
Source: 2026-27 Class 10 Maths student poll, 9,800 students from CBSE schools in 14 states, before the 2026 boards.
Other Resources for This Chapter
Pair these handwritten notes with the other Class 10 Maths resources for this chapter, all linked below.
| Resource | Open |
|---|---|
| NCERT Solutions | Statistics Class 10 Maths NCERT Solutions |
| Notes | Statistics Class 10 Maths Notes |
| Formula Sheet | Statistics Class 10 Maths Formula Sheet |
| NCERT Book PDF | Statistics Class 10 Maths NCERT Book PDF |
| NCERT Exemplar Solutions | Statistics Class 10 Maths NCERT Exemplar Solutions |
| Handwritten Notes | Statistics Class 10 Maths Handwritten Notes |
NCERT Handwritten Notes for Class 10 Maths: All Chapters
Use the table below to jump to another Class 10 Maths chapter's handwritten notebook.
| Chapter | Resource |
|---|---|
| Chapter 10 | Circles Handwritten Notes |
| Chapter 11 | Areas Related to Circles Handwritten Notes |
| Chapter 12 | Surface Areas and Volumes Handwritten Notes |
| Chapter 14 | Probability Handwritten Notes |
Statistics Class 10 Maths Handwritten Notes FAQs
Ques. Where can I download Statistics Class 10 Maths Handwritten Notes PDF?
Ans. You can download the Statistics Class 10 Maths Handwritten Notes PDF directly from this page. The notes are free and ready to print.
Ques. Are these handwritten notes aligned with the 2026-27 NCERT?
Ans. Yes. The notebook follows the current 2026-27 syllabus for Class 10 Maths. It centres on the mean of grouped data by three methods, the mode of grouped data, and the median of grouped data.
Ques. What is data in statistics?
Ans. Data is the set of facts or figures collected for a purpose, such as the marks of a class. In this chapter the data is grouped into class intervals before the averages are found. The frequency table on page 2 of the notebook shows this layout.
Ques. What is the meaning of statistics in this chapter?
Ans. Statistics here means the study of collecting, organising, and summarising numerical data. The Class 10 chapter focuses on summarising grouped data through three measures of central tendency: mean, mode, and median.
Ques. What are the three methods to find the mean of grouped data?
Ans. The three methods are the direct method using class marks, the assumed-mean method using deviations, and the step-deviation method that divides each deviation by the class size. The blue formula box on page 3 carries a solved example for each.
Ques. How do the notes find the mode of grouped data?
Ans. The notes first pick the modal class, the class with the highest frequency. They then apply Mode = l + f1 - f02f1 - f0 - f2 h, where f1 is the modal frequency and f0 and f2 are the frequencies before and after it.
Ques. What's the difference between Collegedunia's Handwritten Notes and the regular Notes for this chapter?
Ans. The regular Notes give the full concept walkthrough with detailed text. The Handwritten Notes compress the same content into a faster, more visual tool with hand-drawn tables, colour-coded boxes, and a 24-hour recall card. Use Notes for the first read and Handwritten Notes for quick revision.



Comments