




Choosing a statistical method starts with knowing what your data can tell you. The NCERT Solutions for Class 11 Informatics Practices Chapter 5, Understanding Data, explain the textbook's ten exercise questions for 2026-27. They cover school records, scholarship selection, surveys and temperature calculations. Use the answers to check both your calculations and the reasons behind your choice of method.
- Ten exercise questions, including their subparts, from textbook pages 92 to 94.
- Mean, median, mode, range and standard deviation explained through data questions.
- Data collection and processing answers with examples you can adapt.
Check your understanding
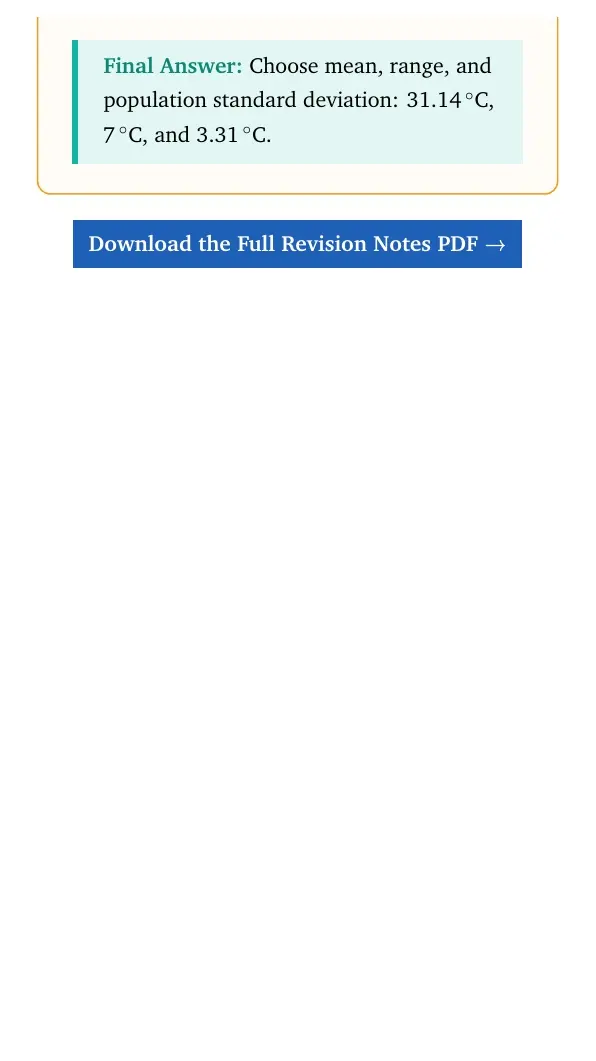
Try question 5 first, then check your results: mean 31.14°C, range 7°C and standard deviation 3.31°C. Note any calculation you need to repeat. For each scenario answer, explain why your chosen method answers the question.
Collegedunia's solutions follow the exercises in the NCERT Understanding Data chapter, reprint 2026-27.
These answers cover the NCERT textbook exercises. Check the current CBSE syllabus and your school's teaching plan for examination coverage.
Understanding Data Exercise Questions and Answer Checklist
The exercise moves from choosing data fields to explaining statistical results. Use this checklist to spot what each answer needs. The question numbers follow the official NCERT chapter.
| Question | Task | Include in your answer |
|---|---|---|
| 1 | Data for four services | Relevant fields for results, exhibition registration, image search and hospital appointments |
| 2 | Scholarship selection | Input fields, checks, filtering conditions and the final list |
| 3 | Bank popularity survey | Collection method, household records and useful comparisons |
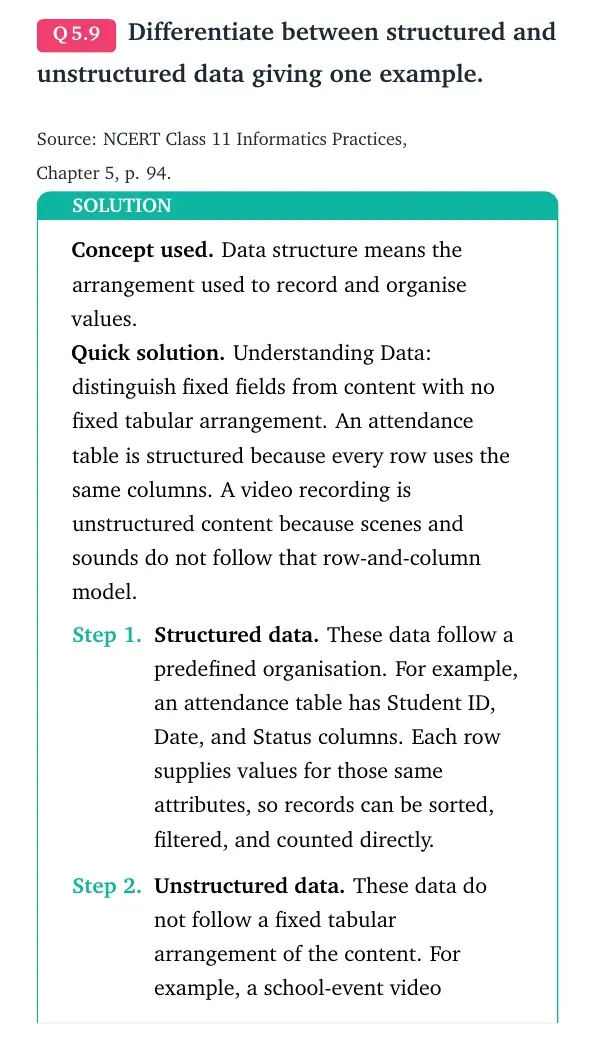
| 4 and 9 | Data classification | Structured or unstructured, with reasons and examples |
| 5 | Seven-day temperature data | Mean, range and standard deviation calculations |
| 6 and 7 | School results and parent records | A method that matches each requested comparison or count |
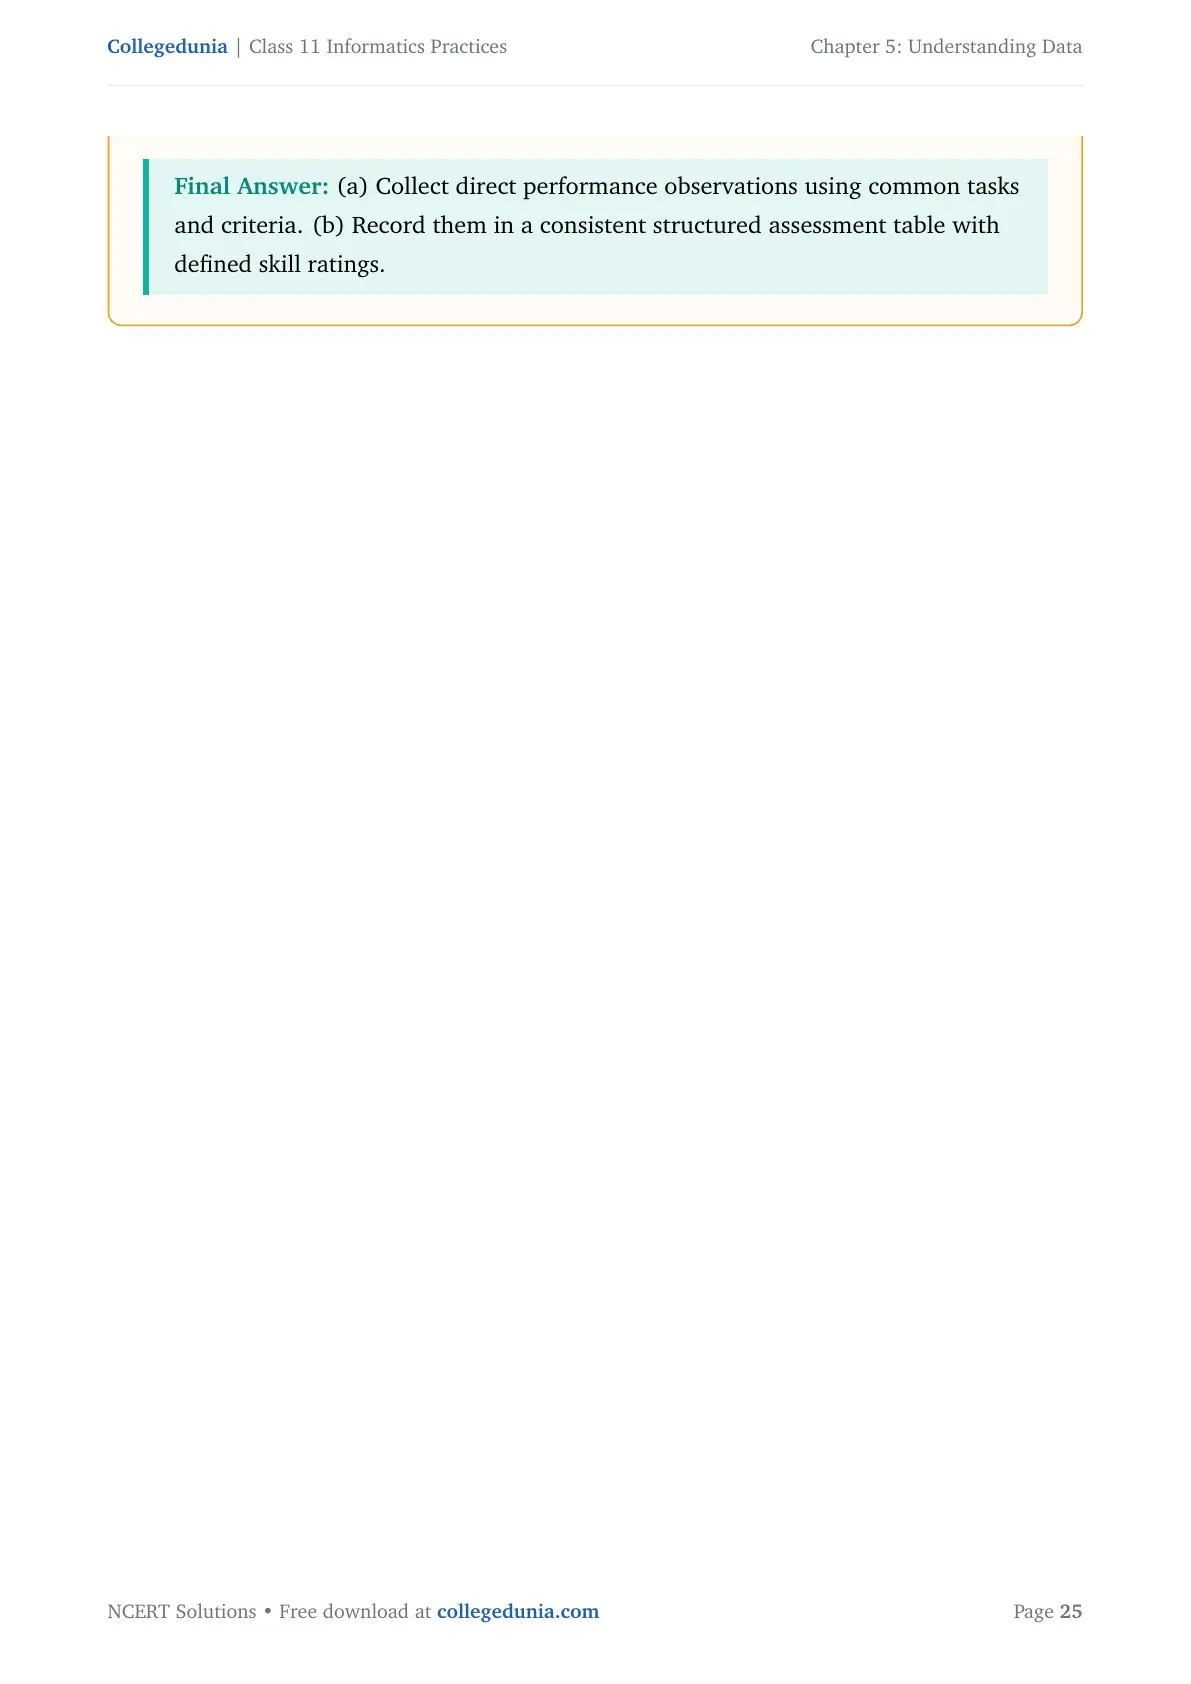
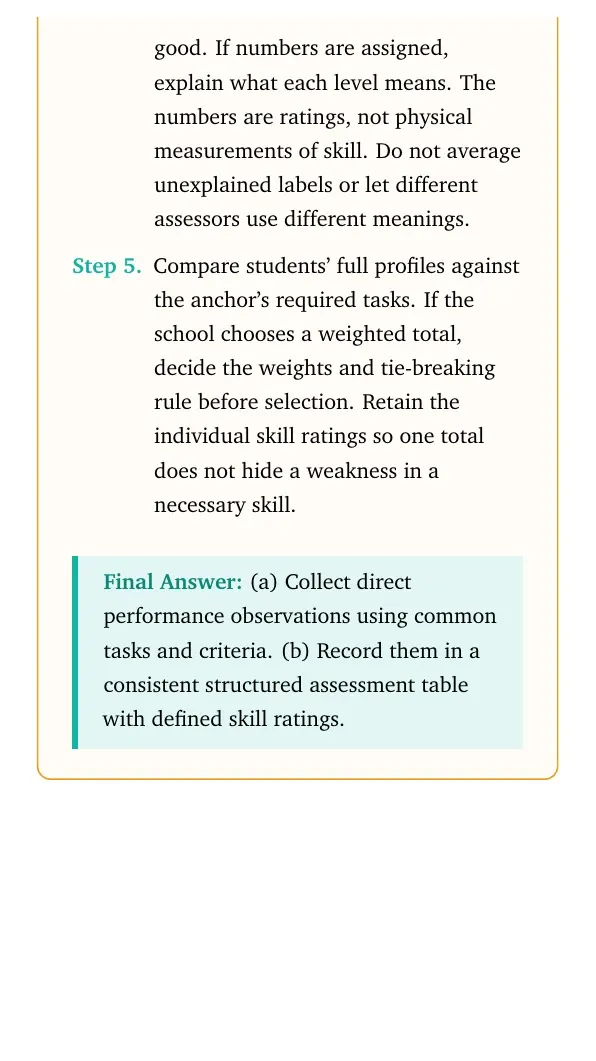
| 8 | Anchor selection | A collection method and consistent skill records |
| 10 | Canteen comparisons | A stated example dataset, units and calculations |
Understanding Mean, Median and Mode
Source: Magnet Brains on YouTube
Understanding Data: Choosing the Right Statistical Method
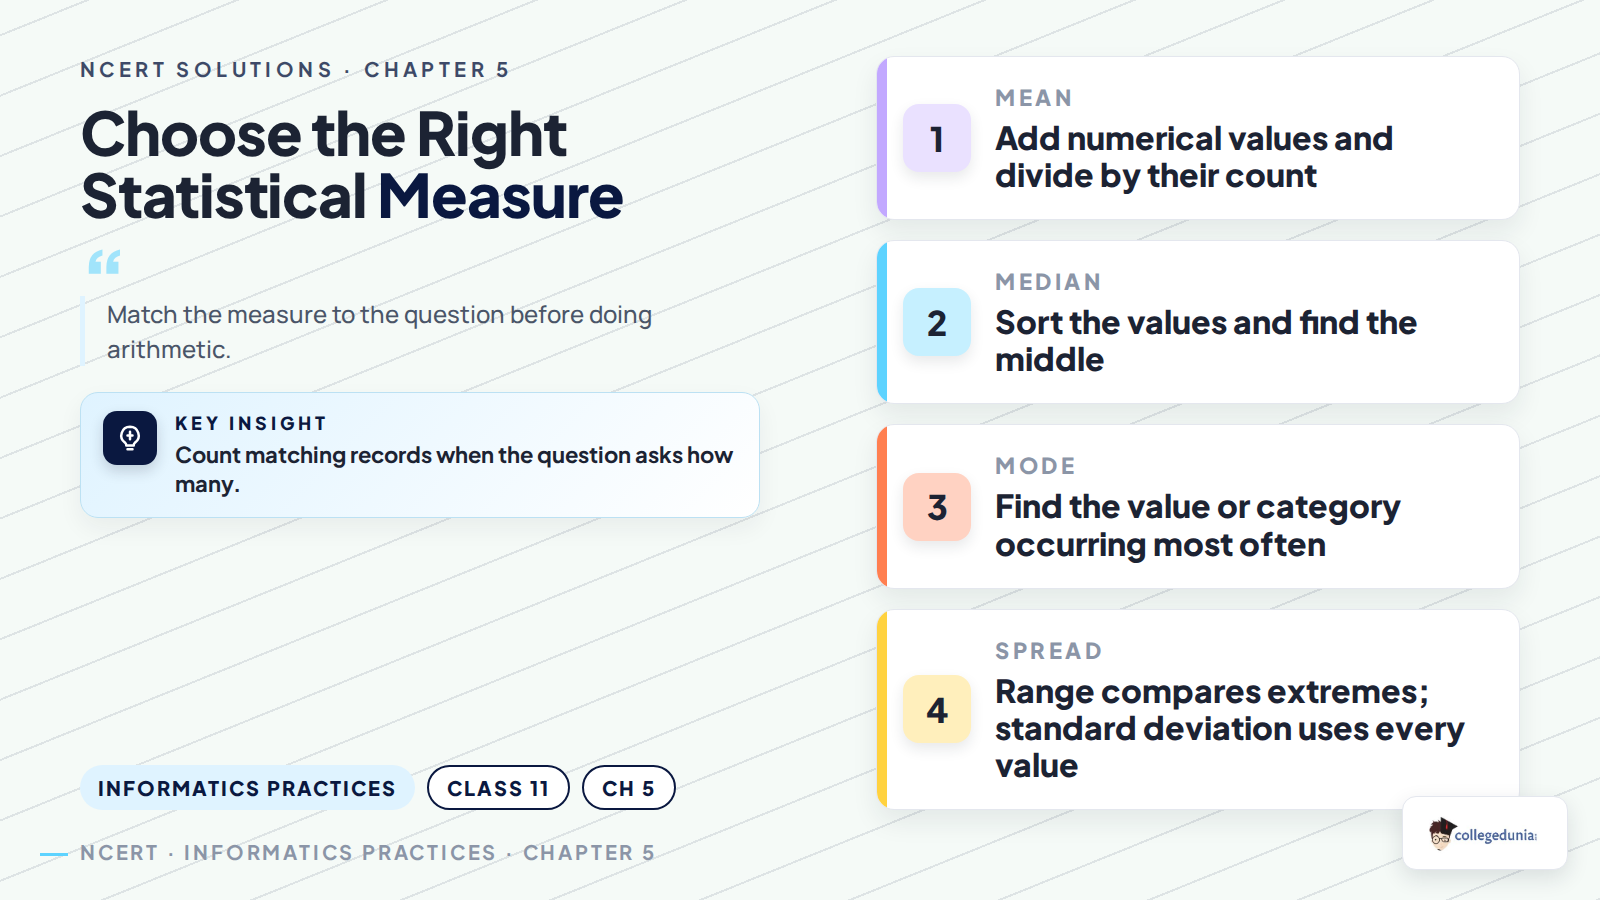
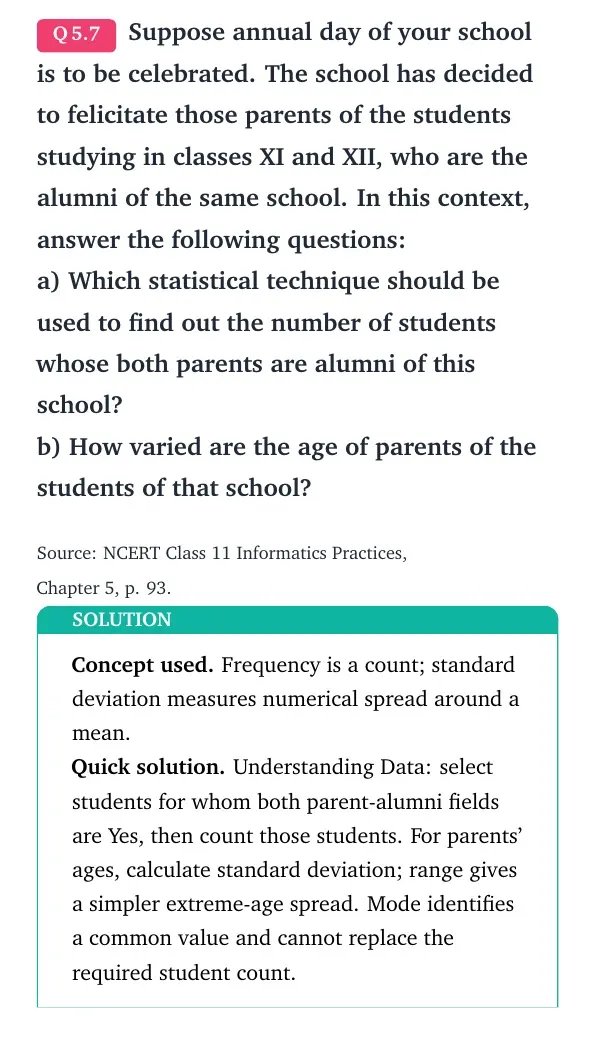
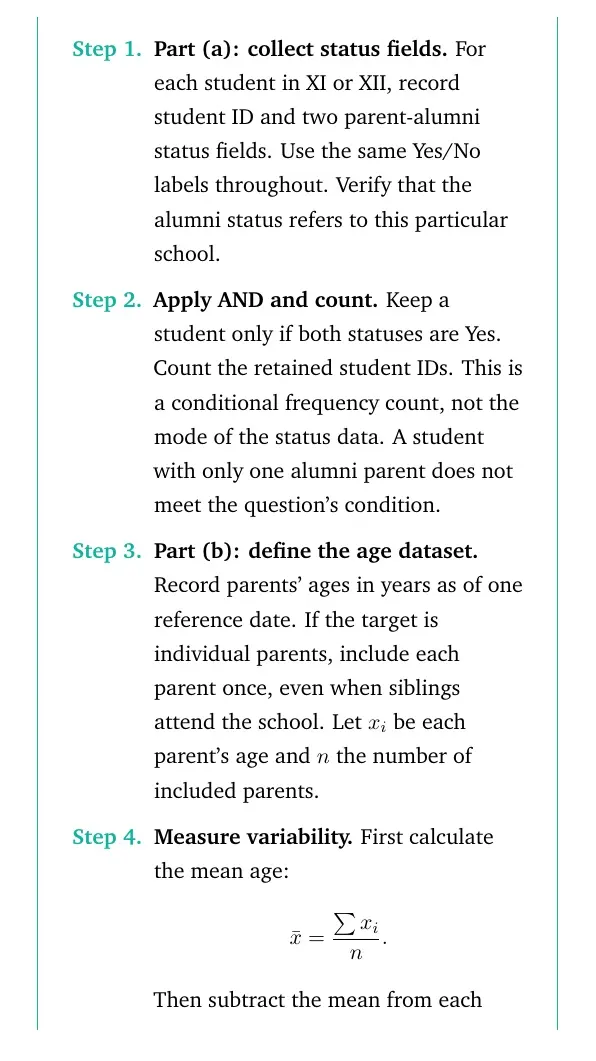
Read the requested result before choosing a formula. An average, a popular category and a count answer different questions. A count of eligible records is not a mode. For question 7(a), test both parents' alumni status and count records that satisfy both conditions.
| Need | Method | Check before using it |
|---|---|---|
| Average numerical value | Mean | Add all values and divide by their count |
| Middle numerical value | Median | Sort the values first |
| Most frequent value or category | Mode | Compare frequencies |
| Distance between extremes | Range | Subtract the minimum from the maximum |
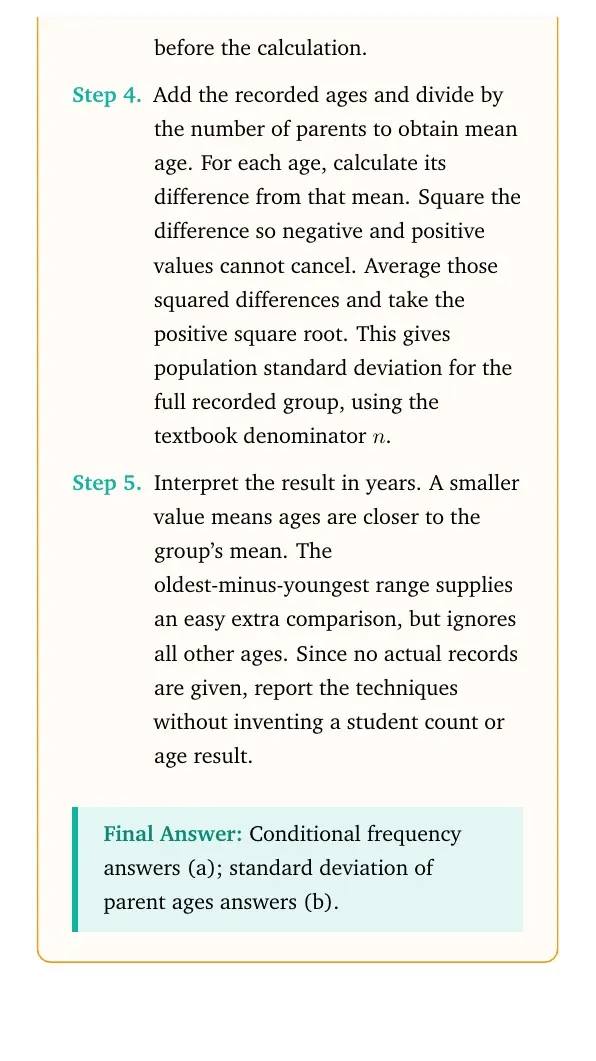
| Spread using every value | Standard deviation | Use the same units and the stated population formula |
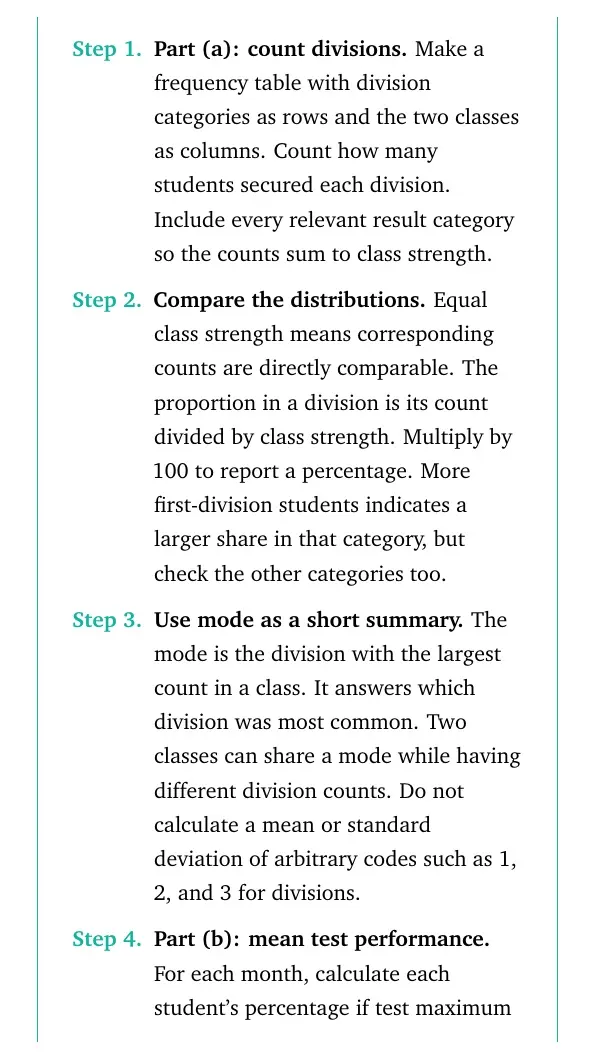
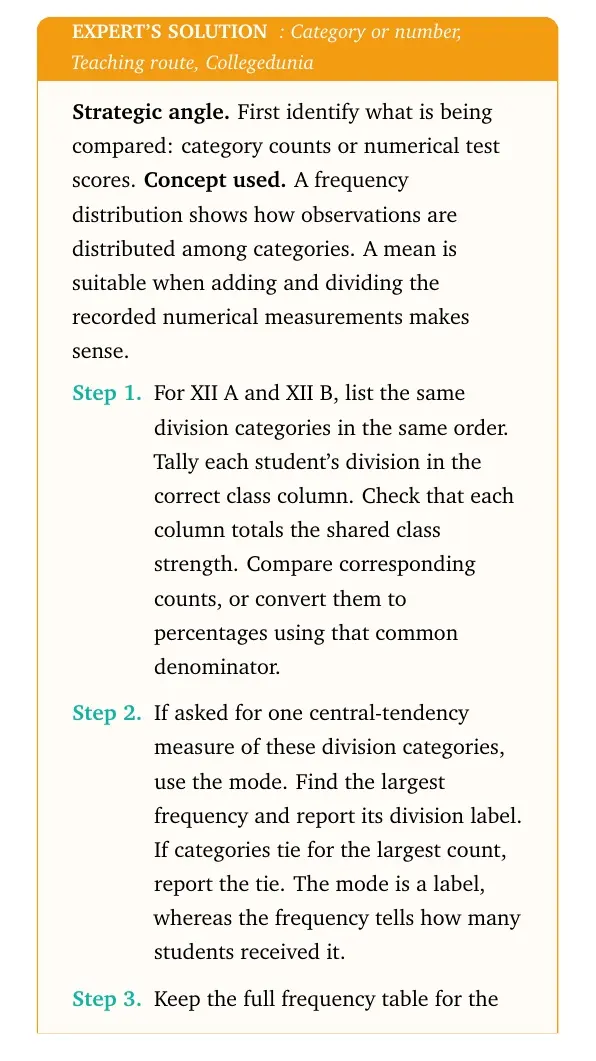
For divisions in question 6(a), compare the number of students in each division across the two classes. The mode identifies only the most common division. It does not describe the complete distribution.
Understanding Data Temperature Question: Calculation Check
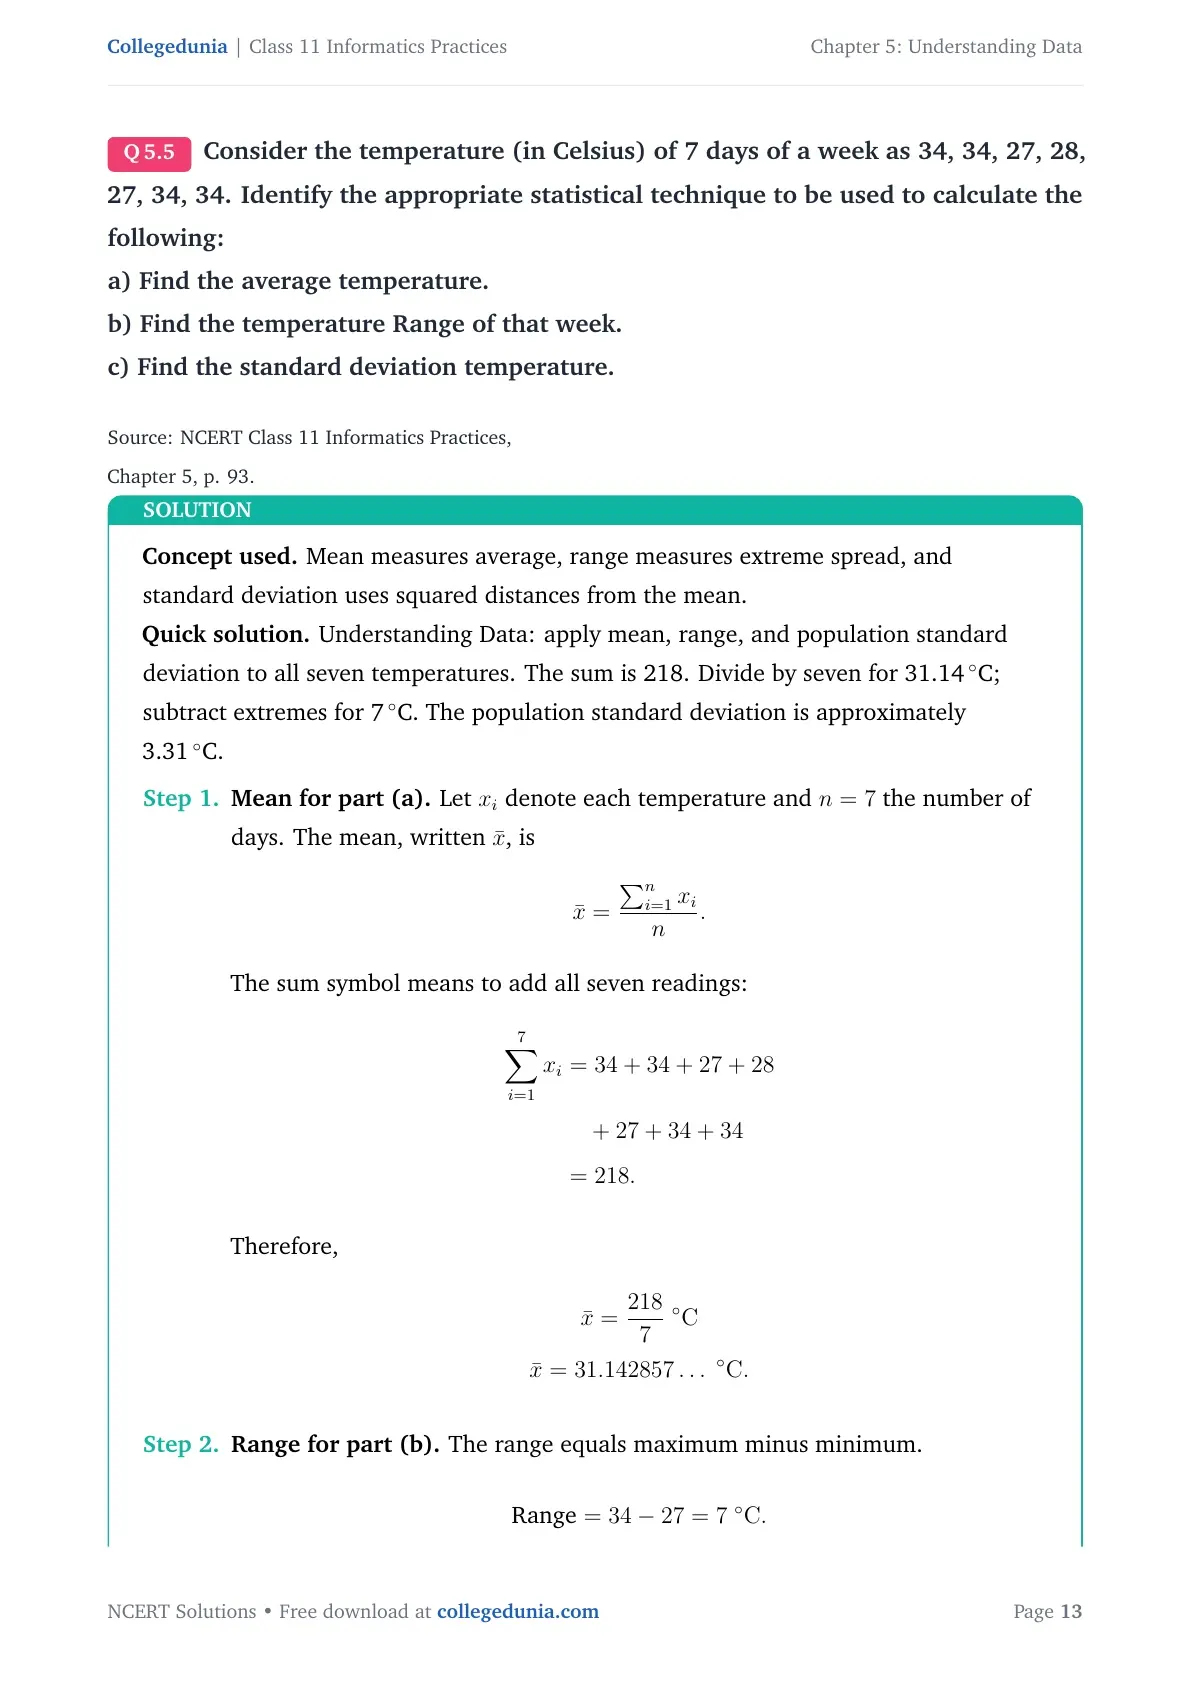
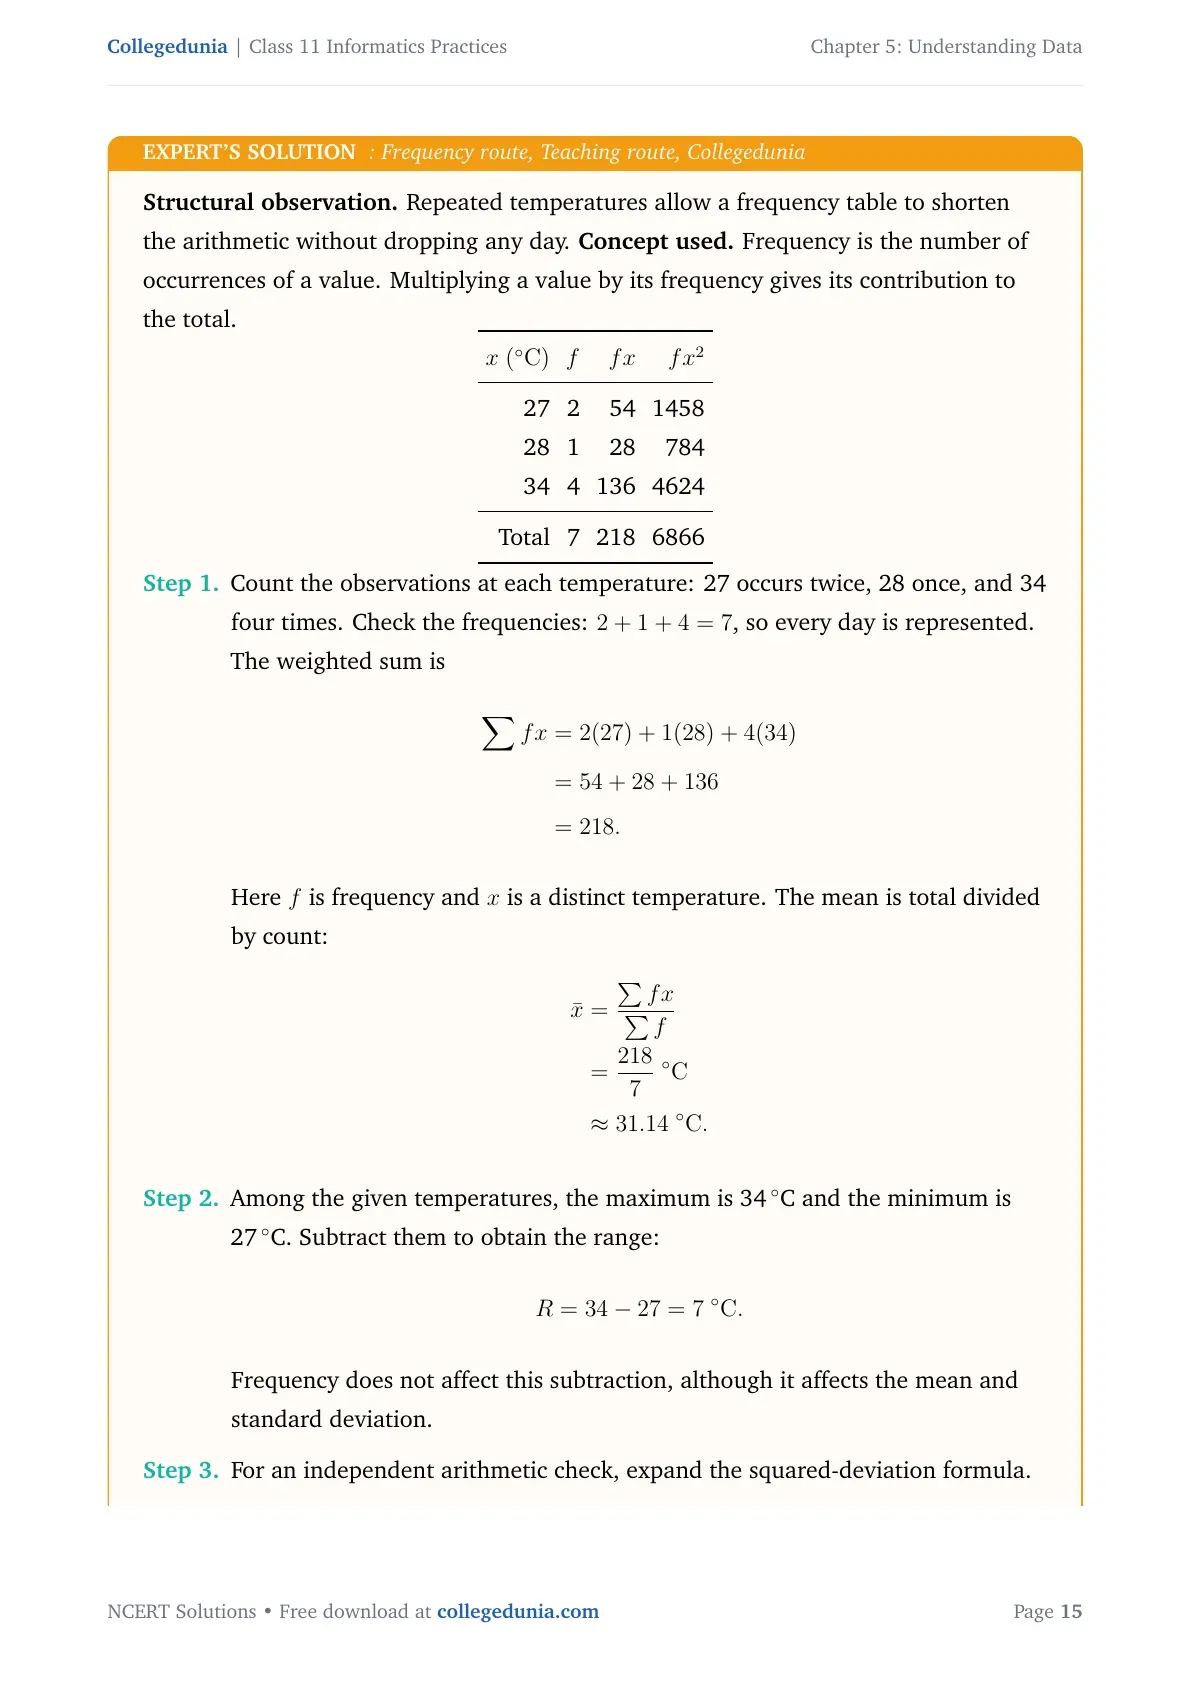
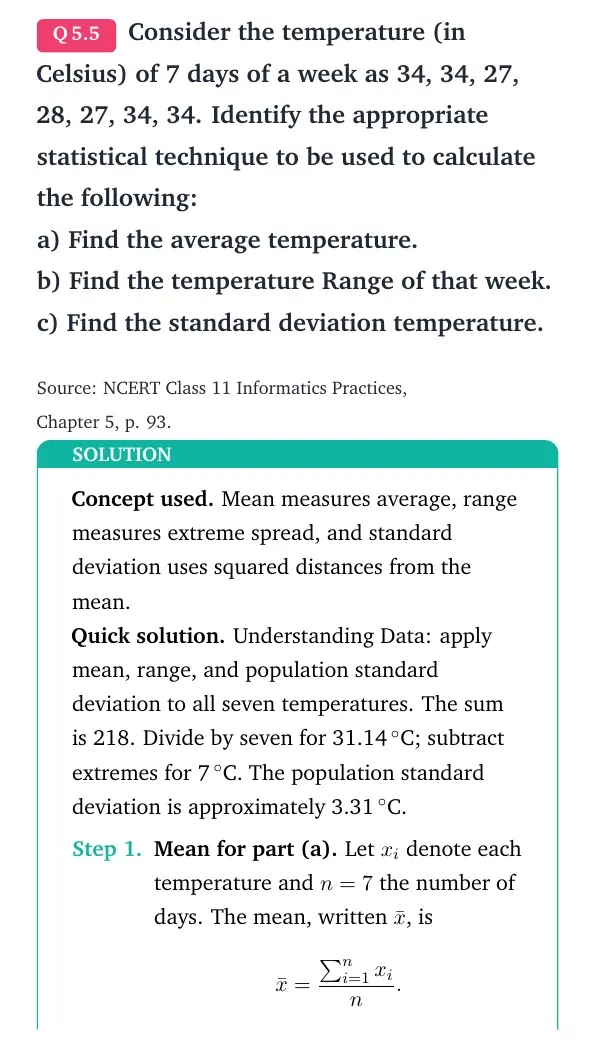
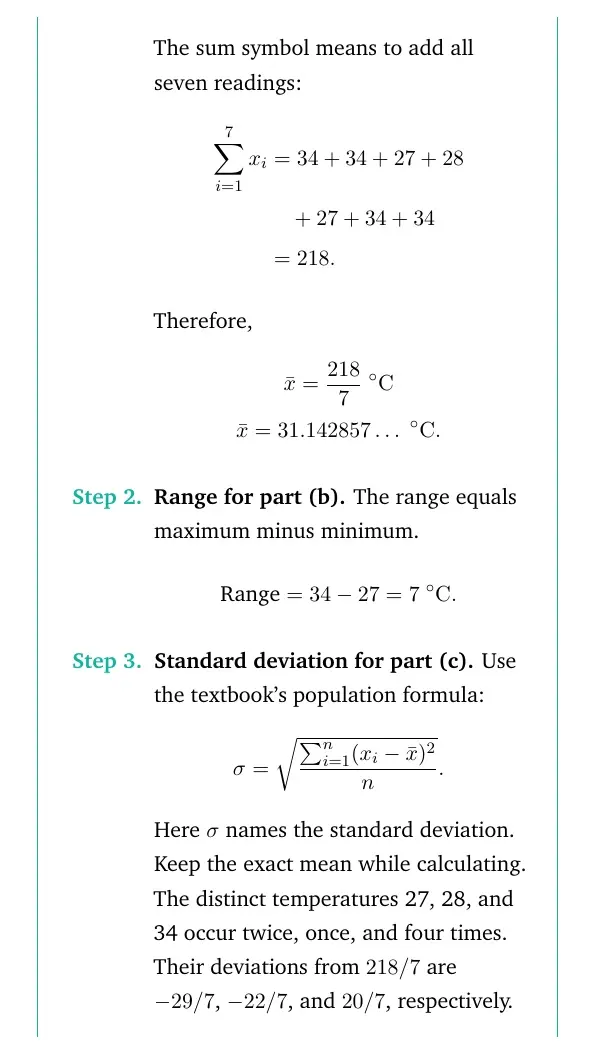
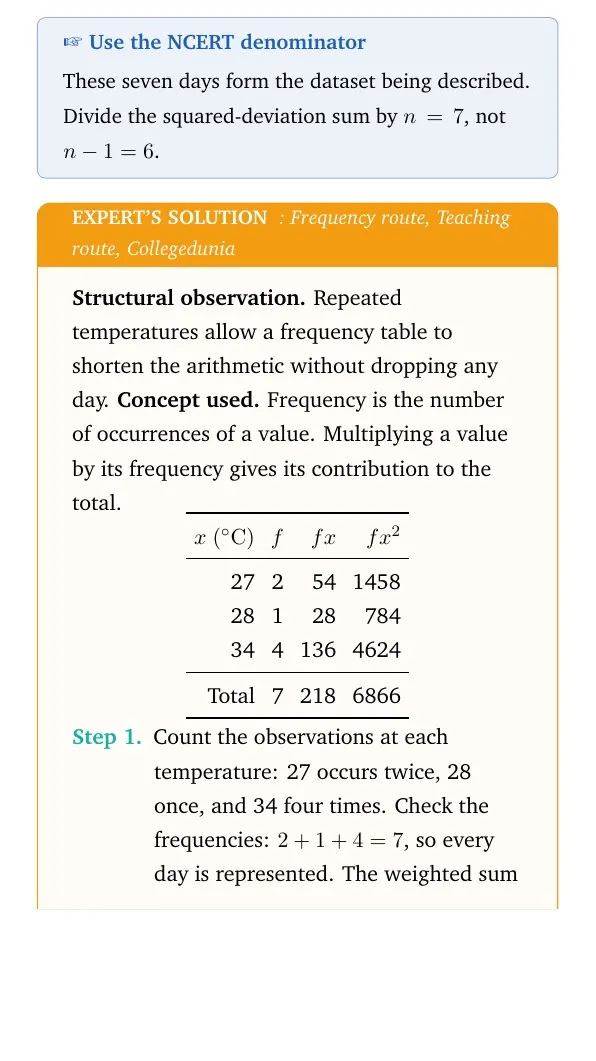
Question 5 gives 34, 34, 27, 28, 27, 34, 34°C. Their sum is 218 and their squared values total 6866. Keep the mean as a fraction until the last step.
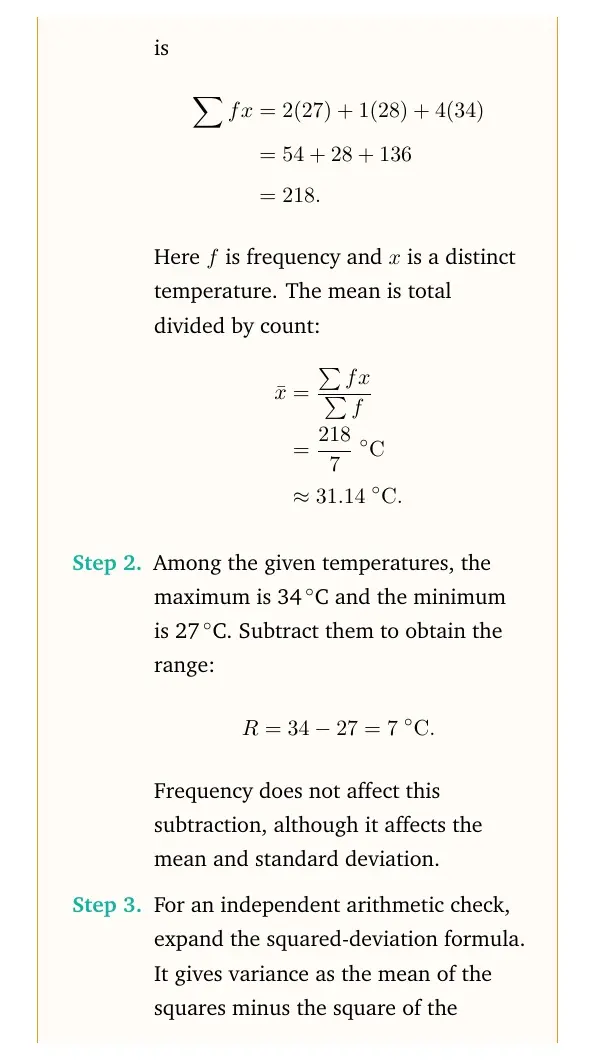
- Mean: 218 ÷ 7 = 31.14°C, rounded to two decimal places.
- Range: 34 − 27 = 7°C.
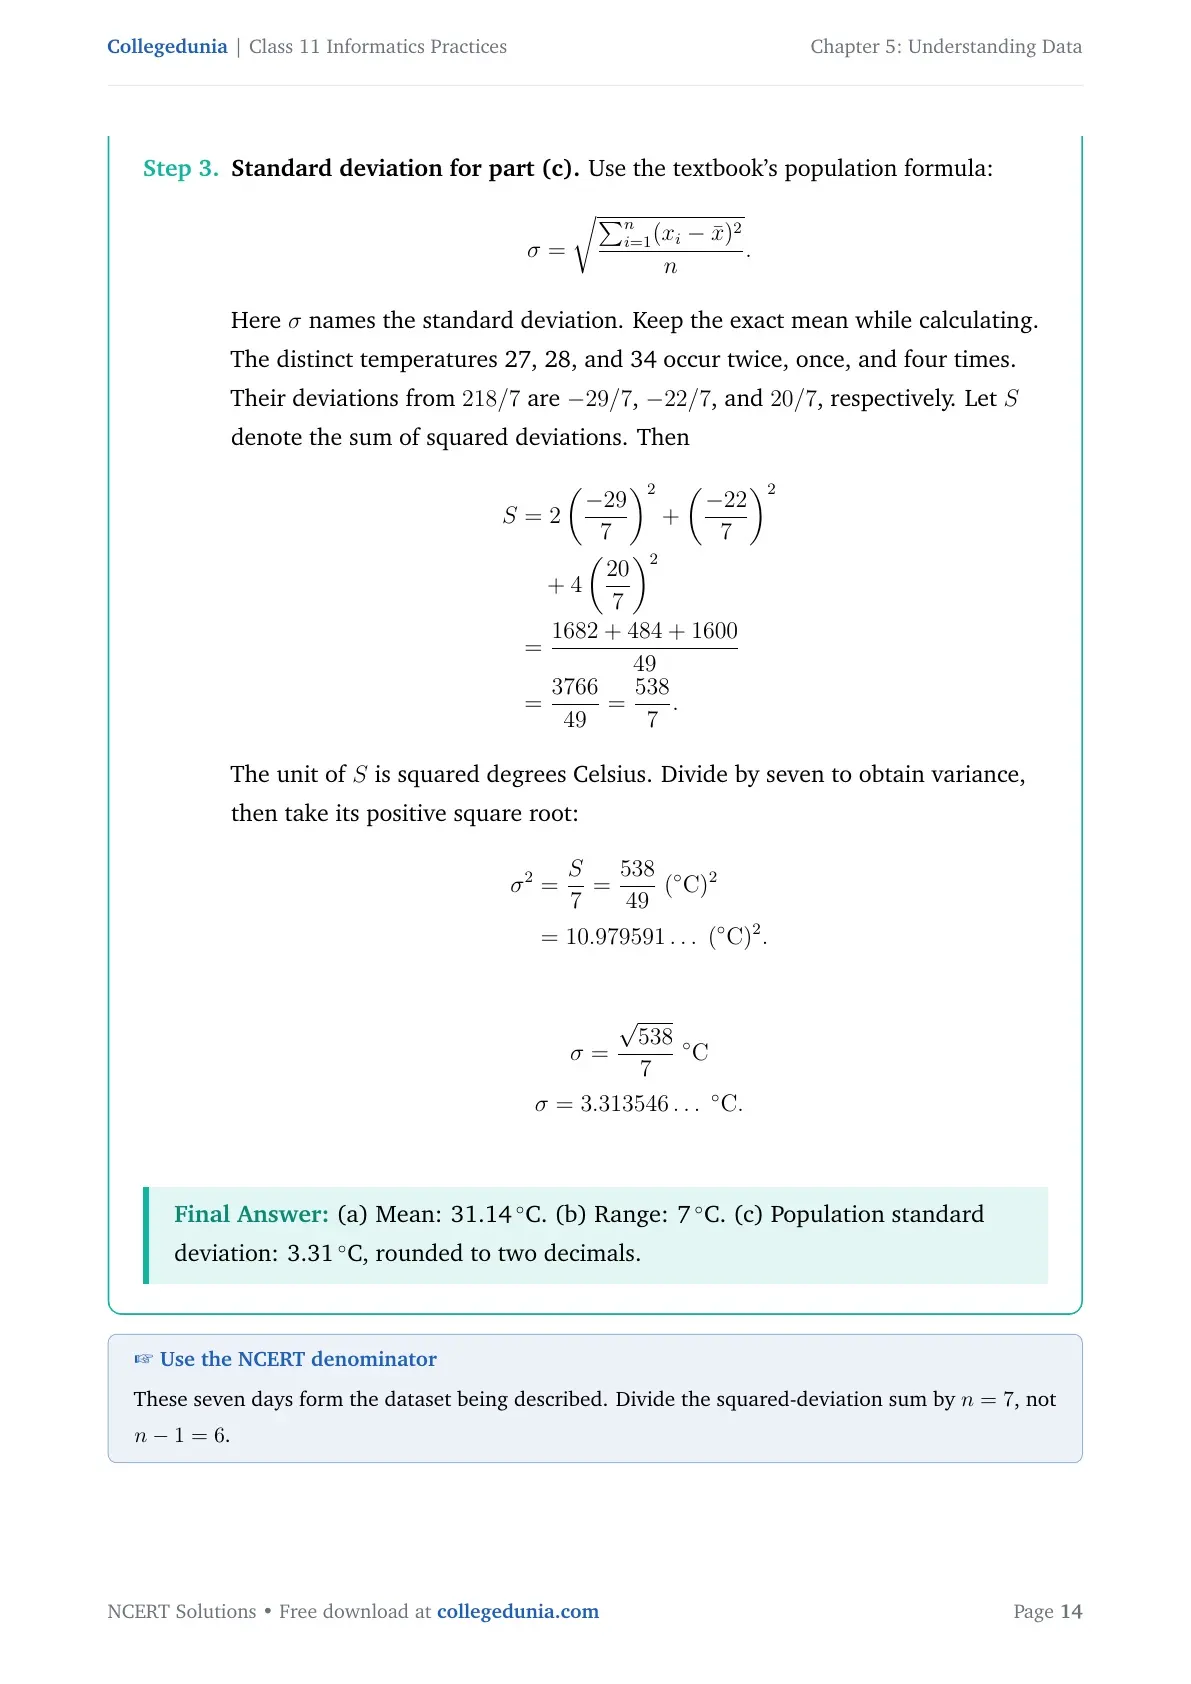
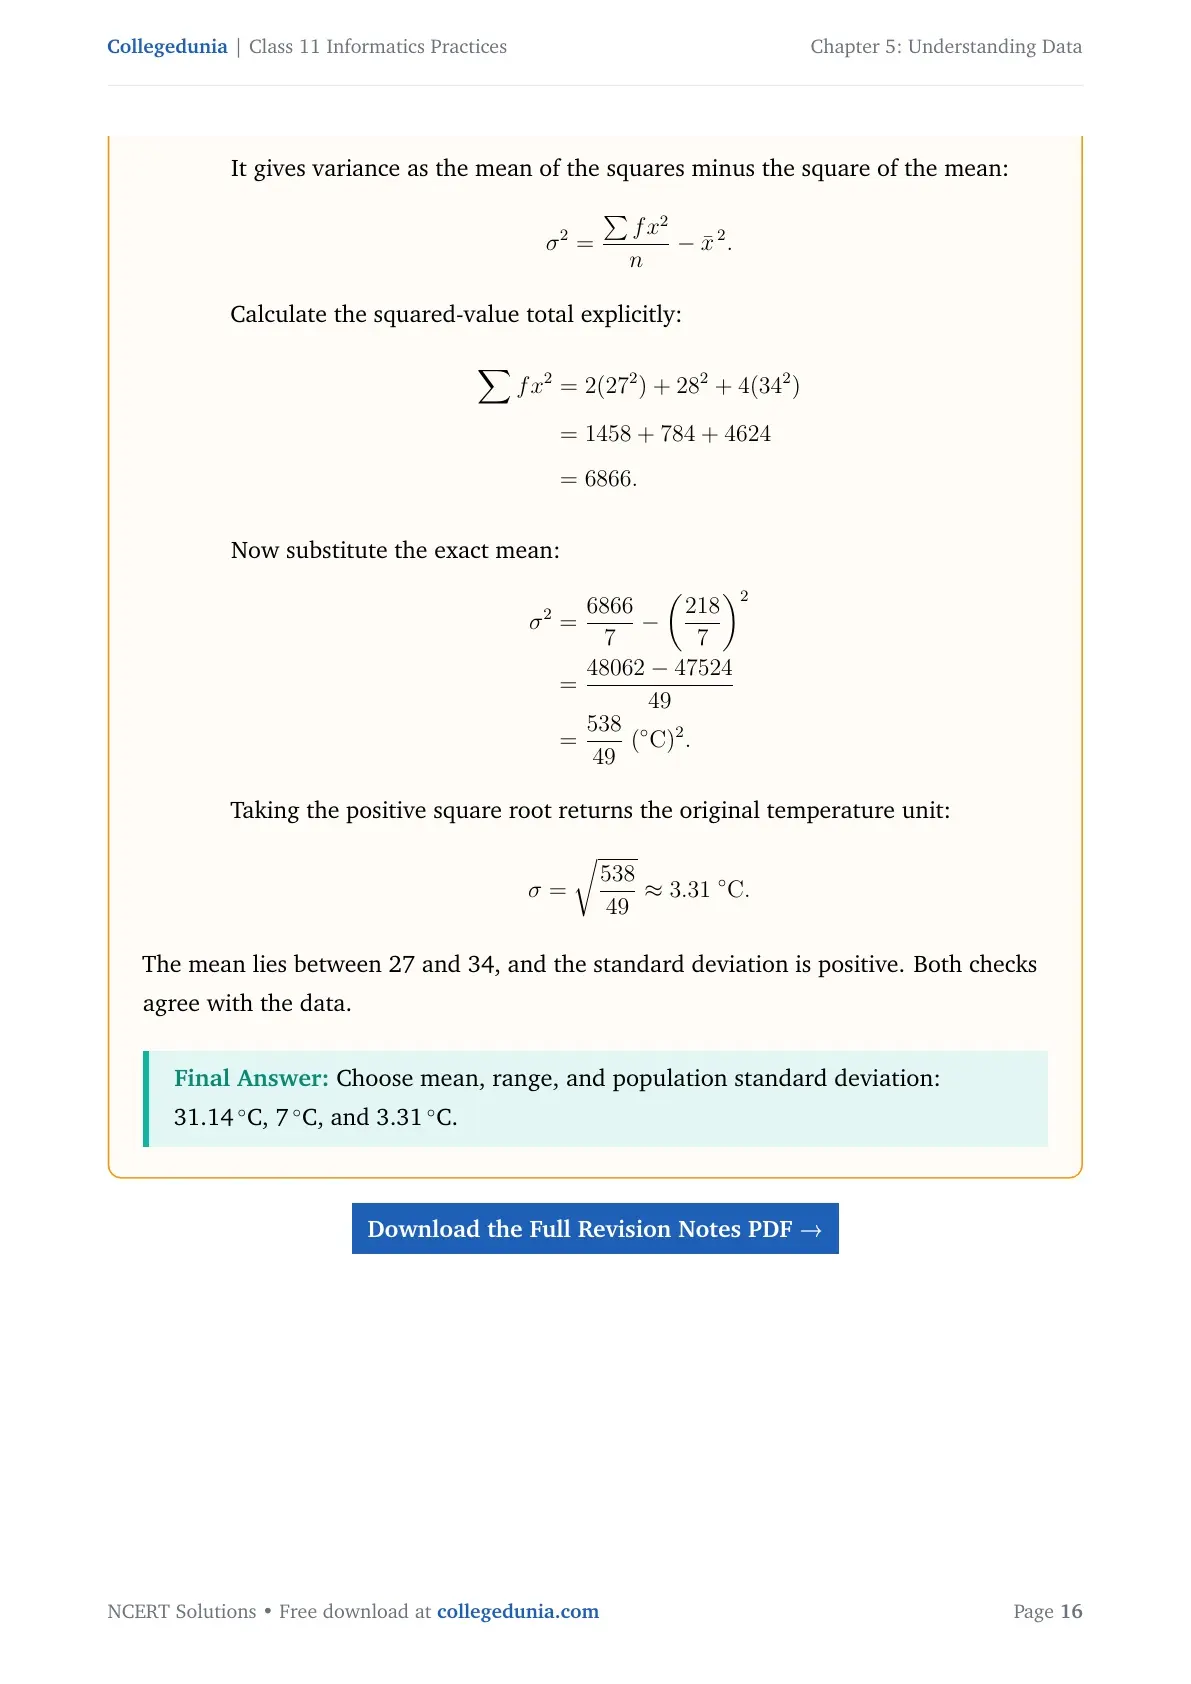
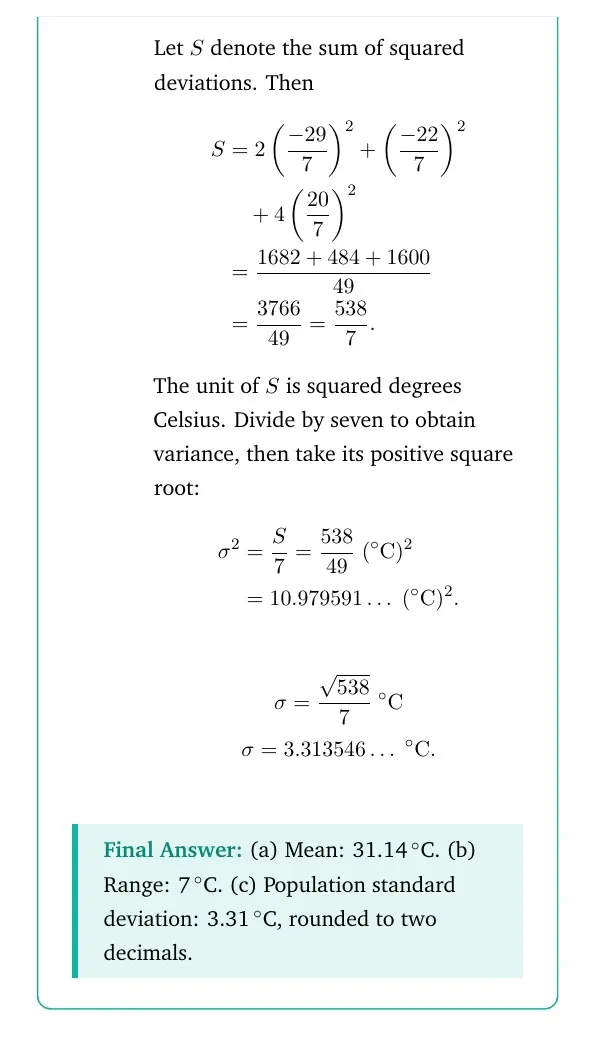
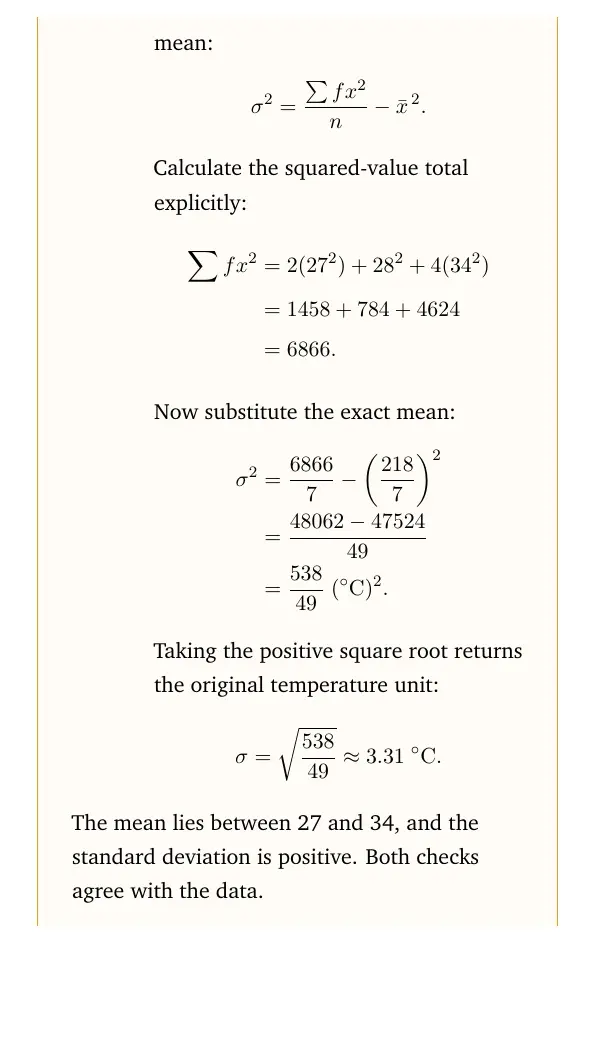
- Population variance: 6866 ÷ 7 − (218 ÷ 7)² = 538 ÷ 49.
- Standard deviation: √(538 ÷ 49) = 3.31°C, rounded to two decimal places.
Divide by 7 for this textbook calculation. The chapter defines standard deviation using the average squared deviation across all given values.
Understanding Data Scenario Answers: Fields, Checks and Results
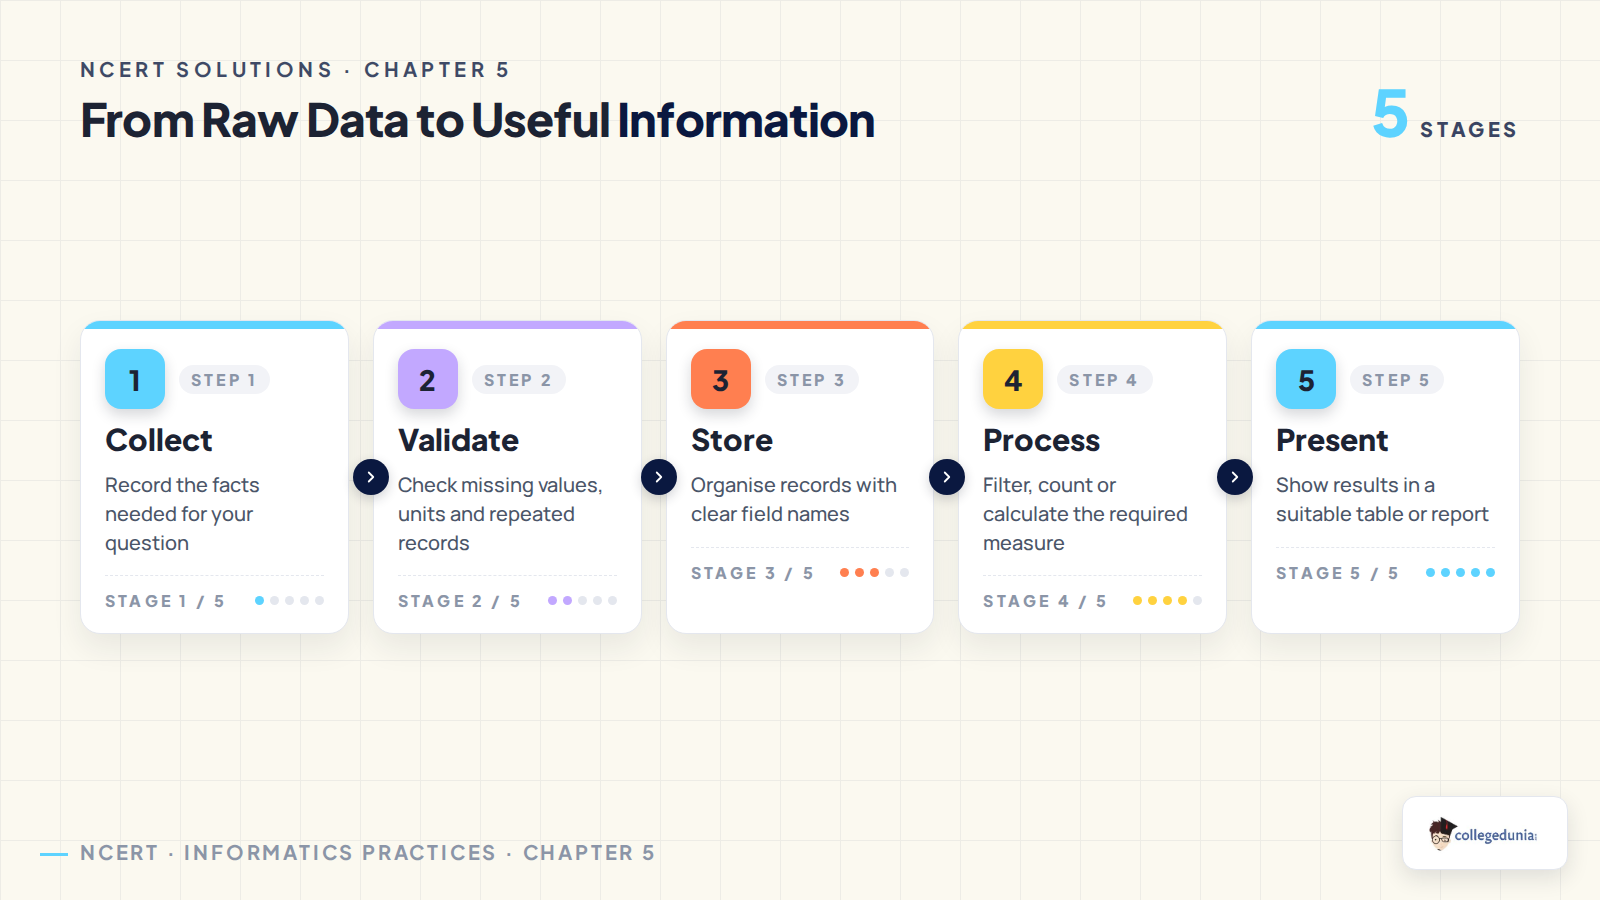
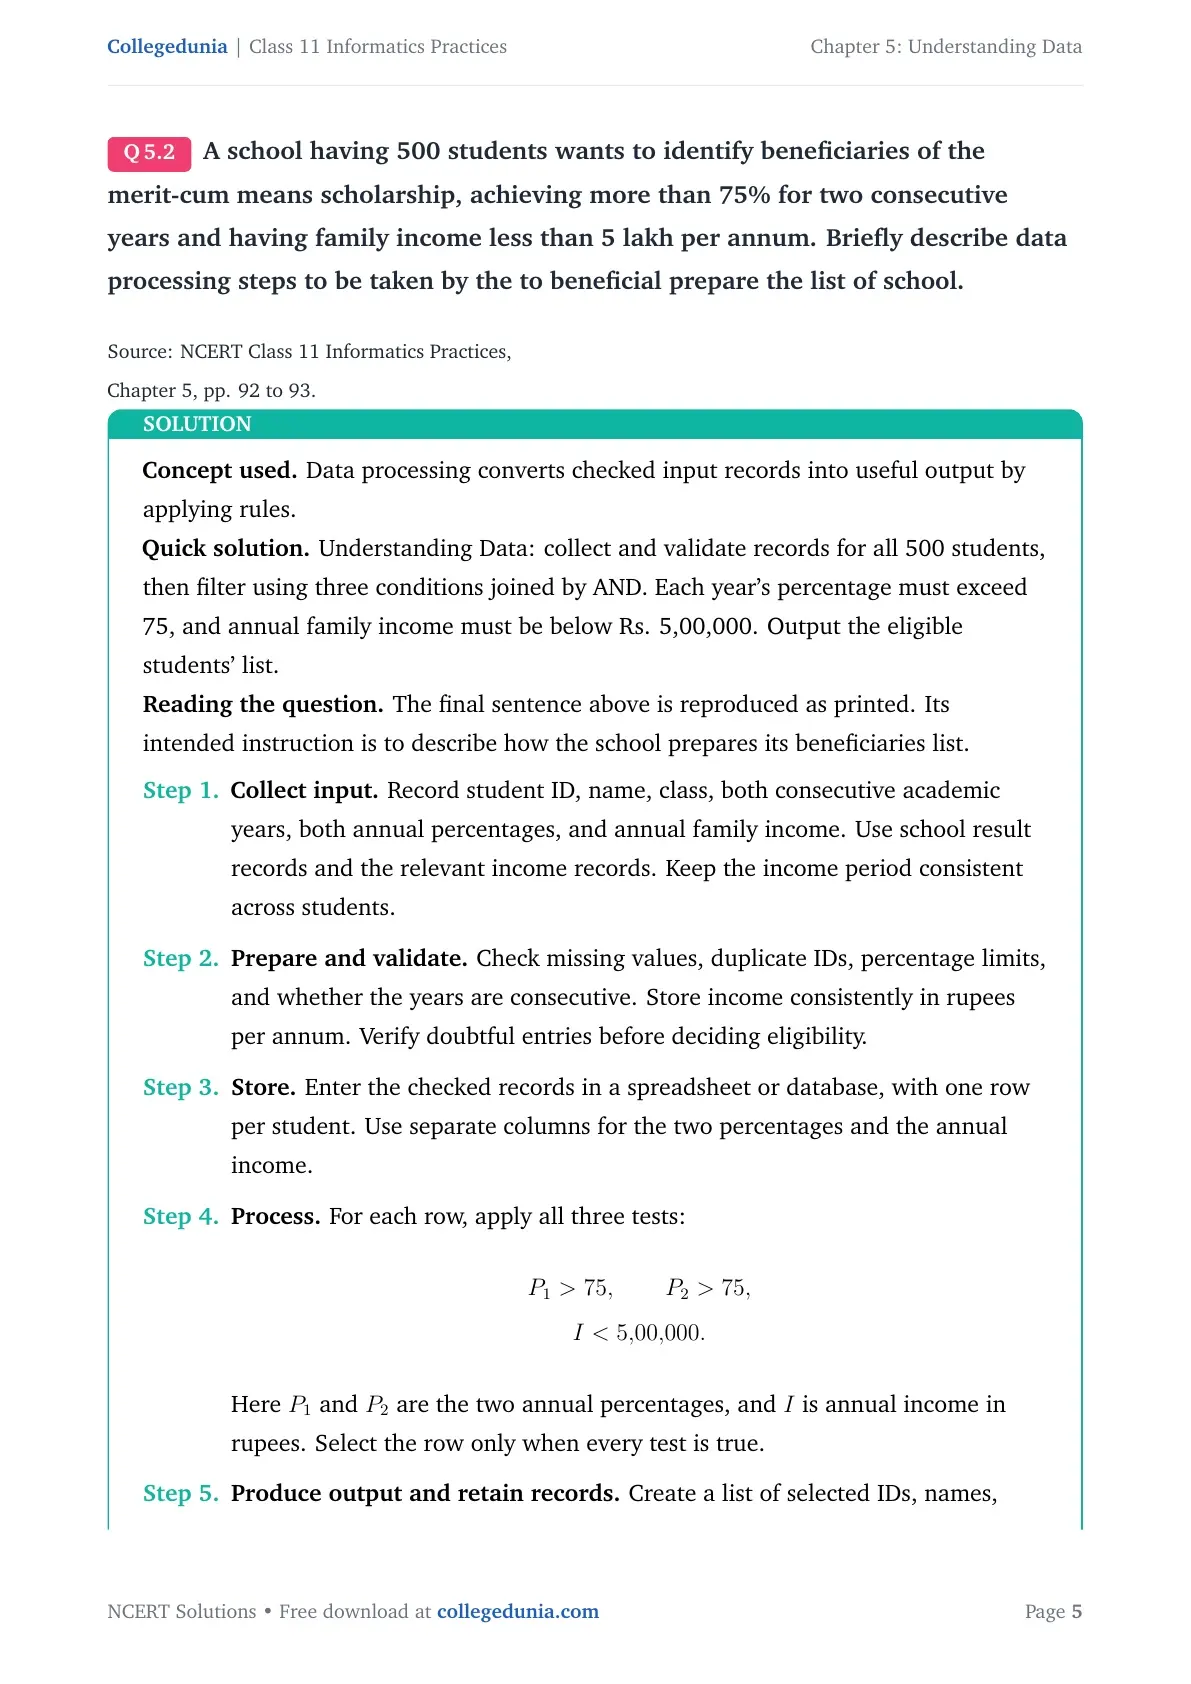
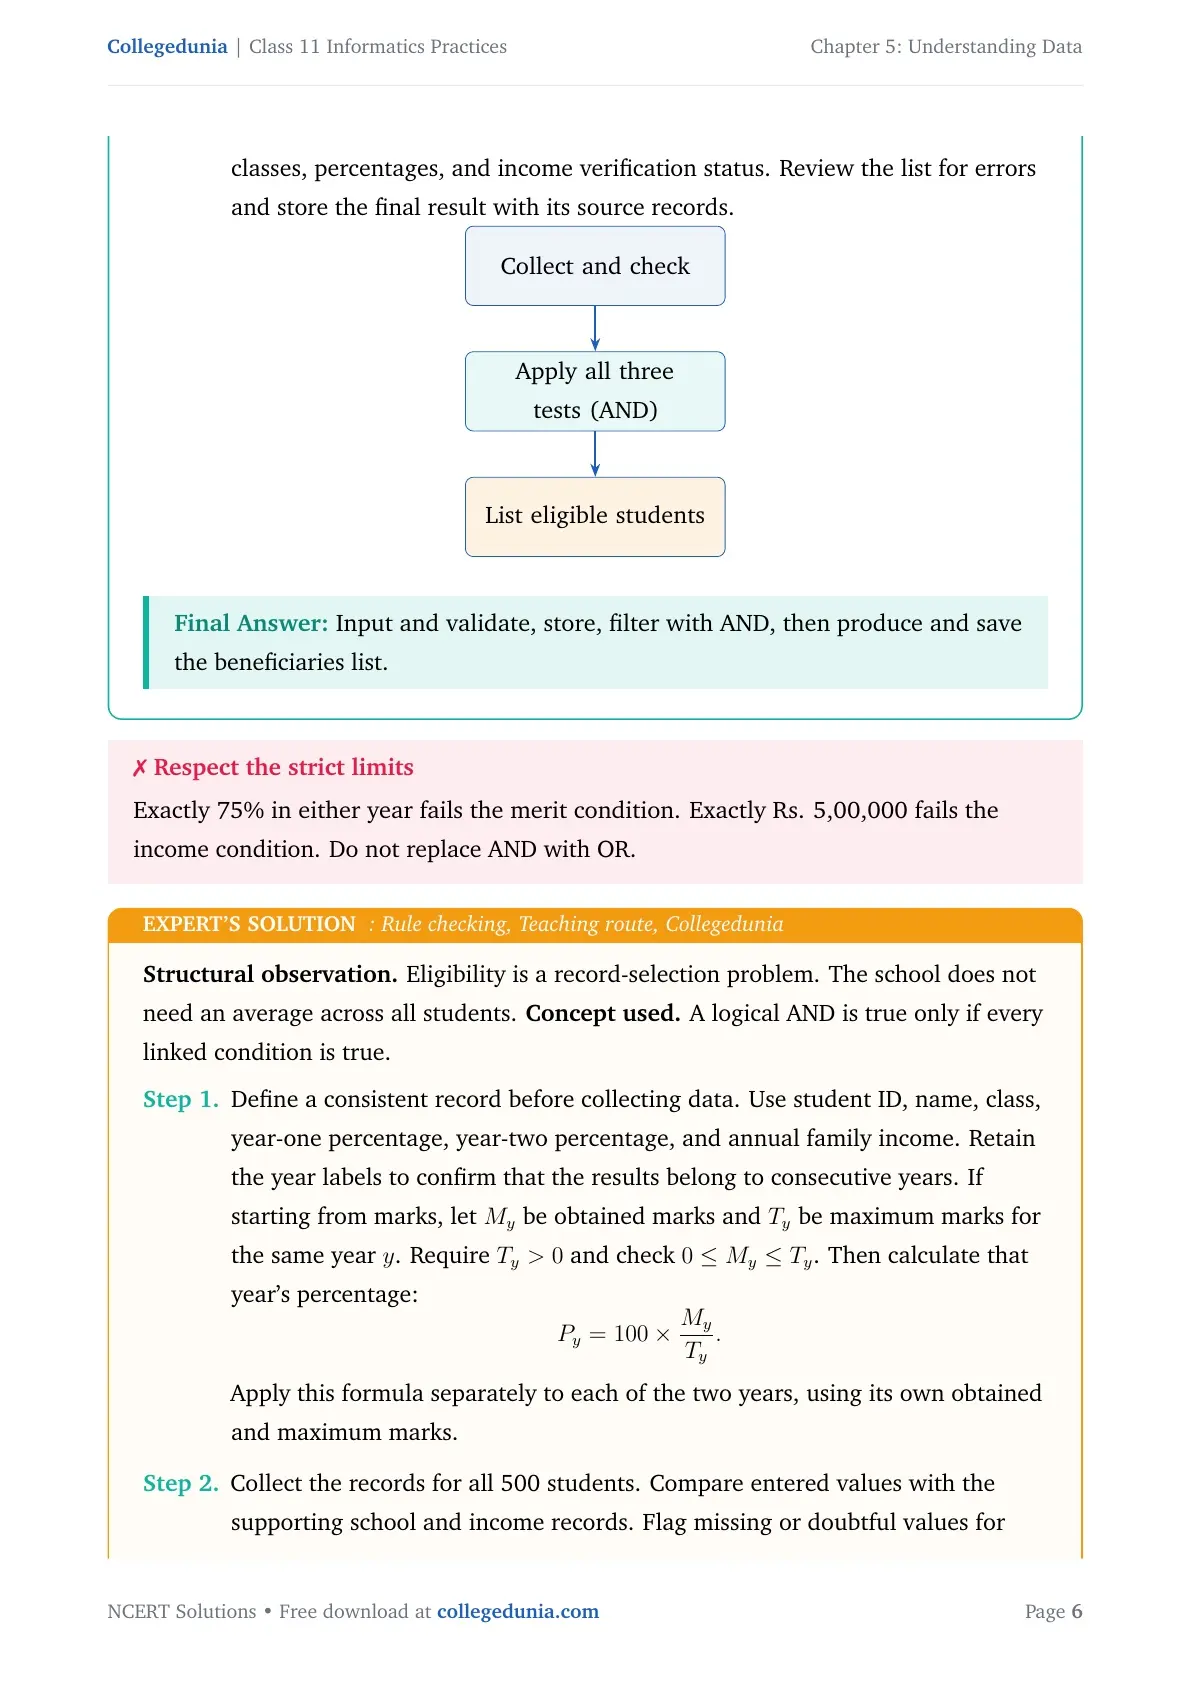
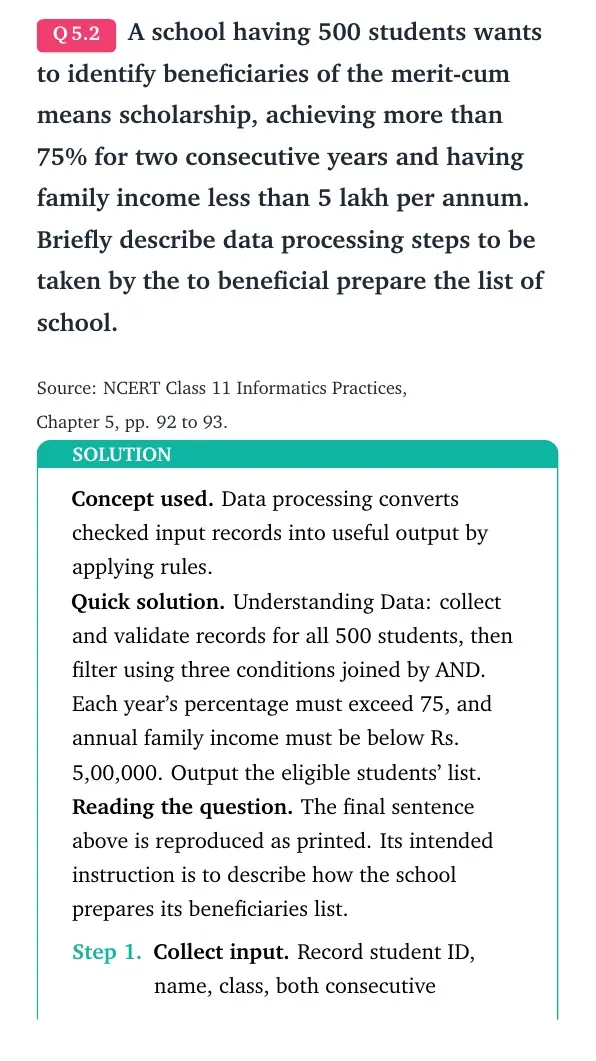
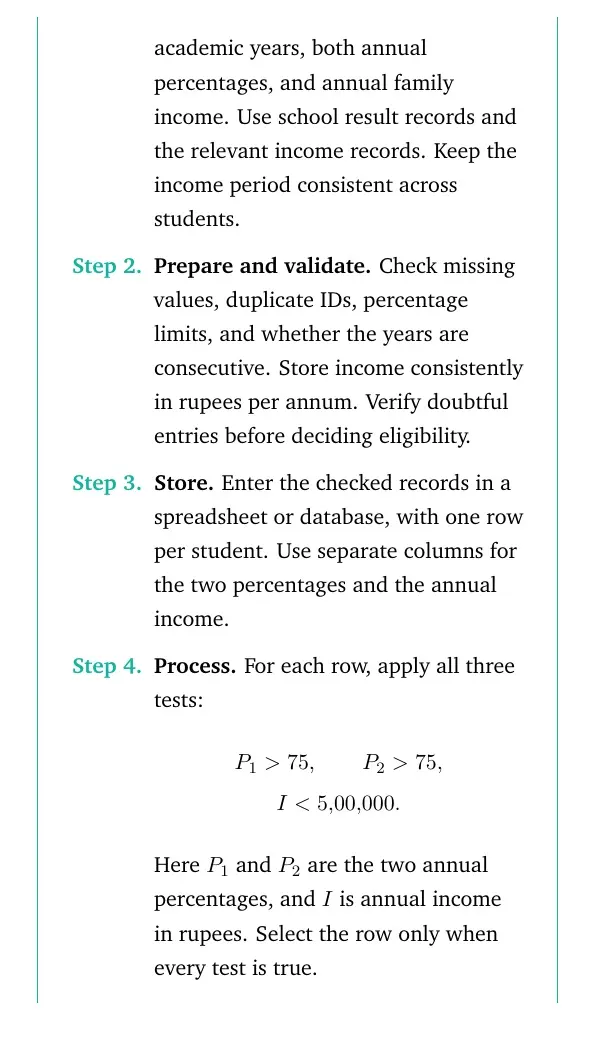
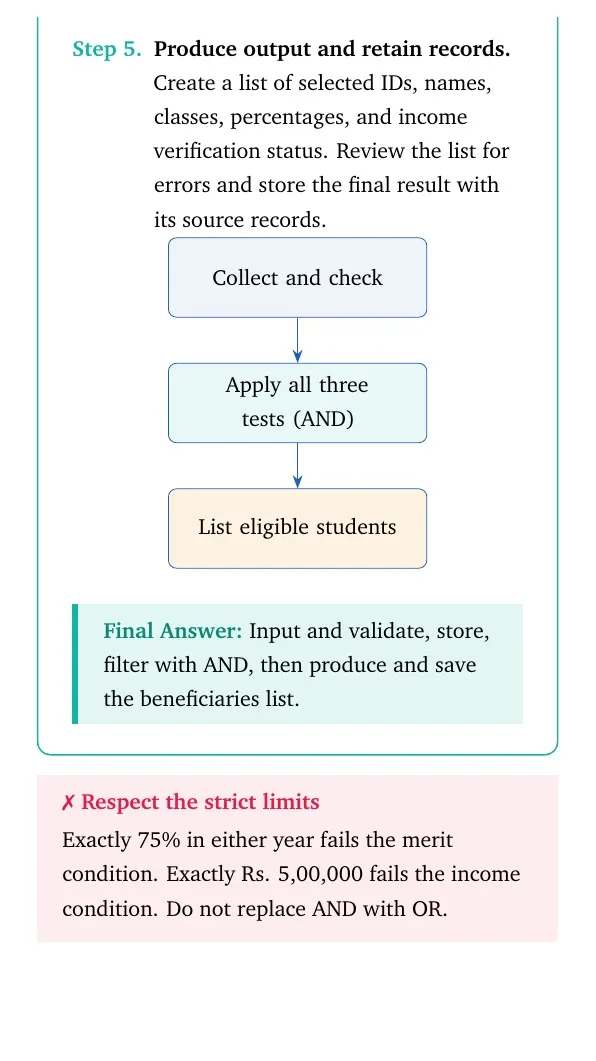
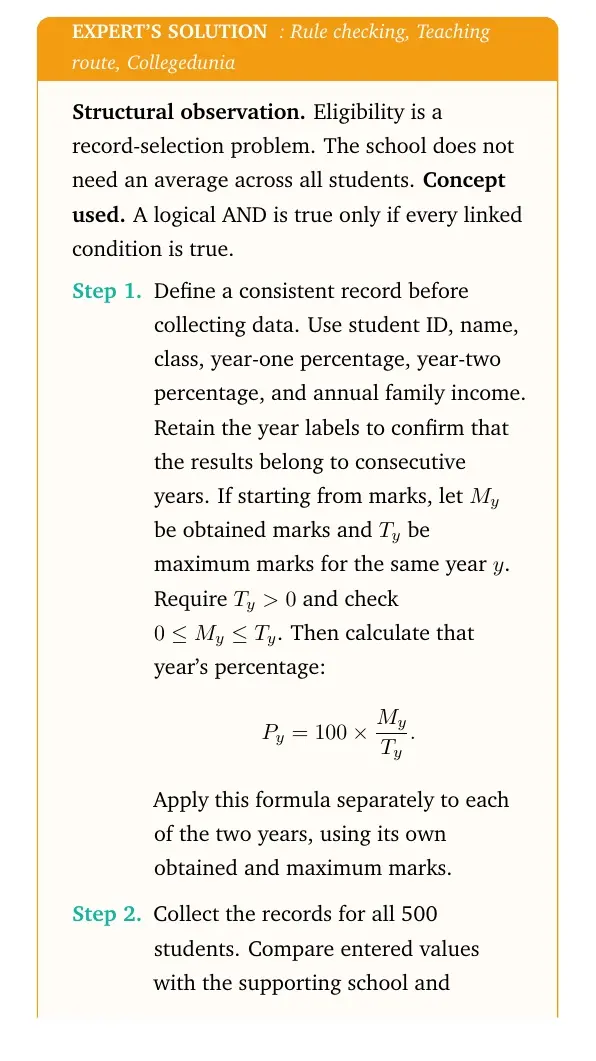
Build each scenario answer around its actual decision. For question 2, one row per student can hold an ID, two yearly percentages and annual family income.
- Collect: obtain the required marks and income records.
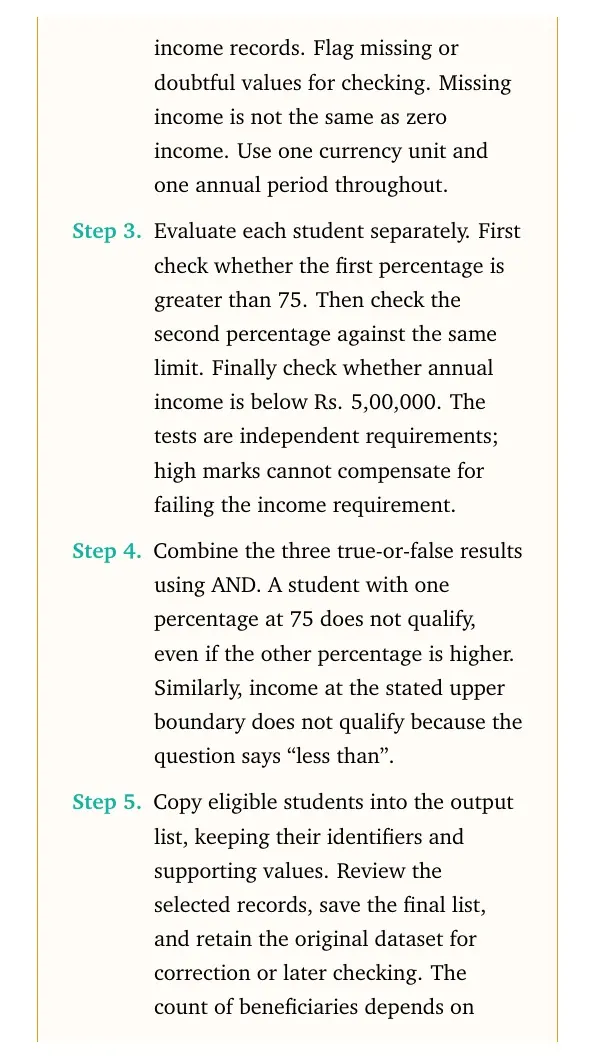
- Check and store: check missing values, duplicate IDs and consistent units before saving the table.
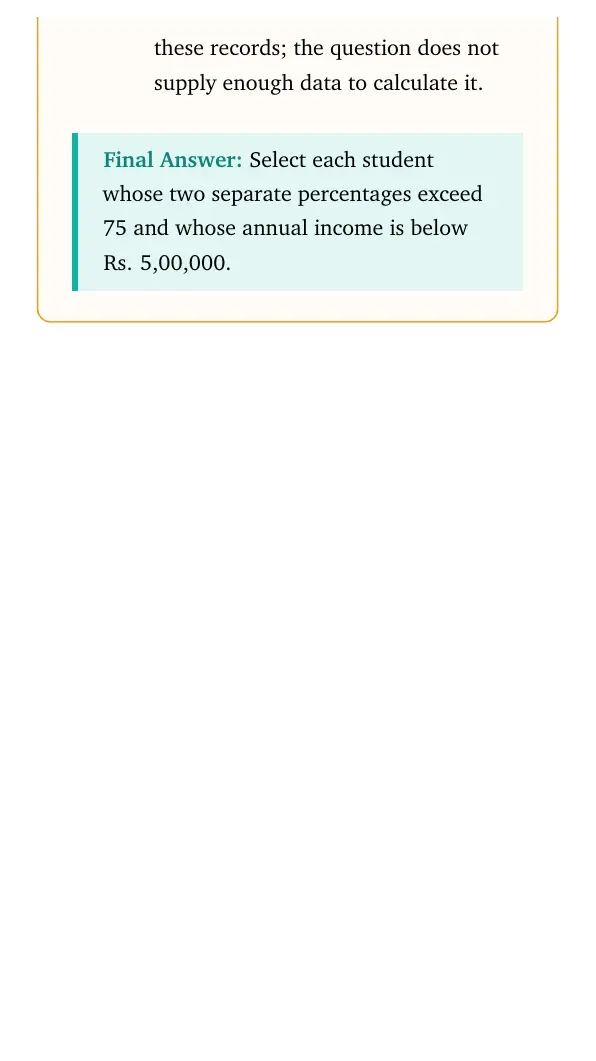
- Process: retain students above 75% in each of the two years and below ₹5 lakh annual family income.
- Output: prepare the eligible students' list with their IDs.
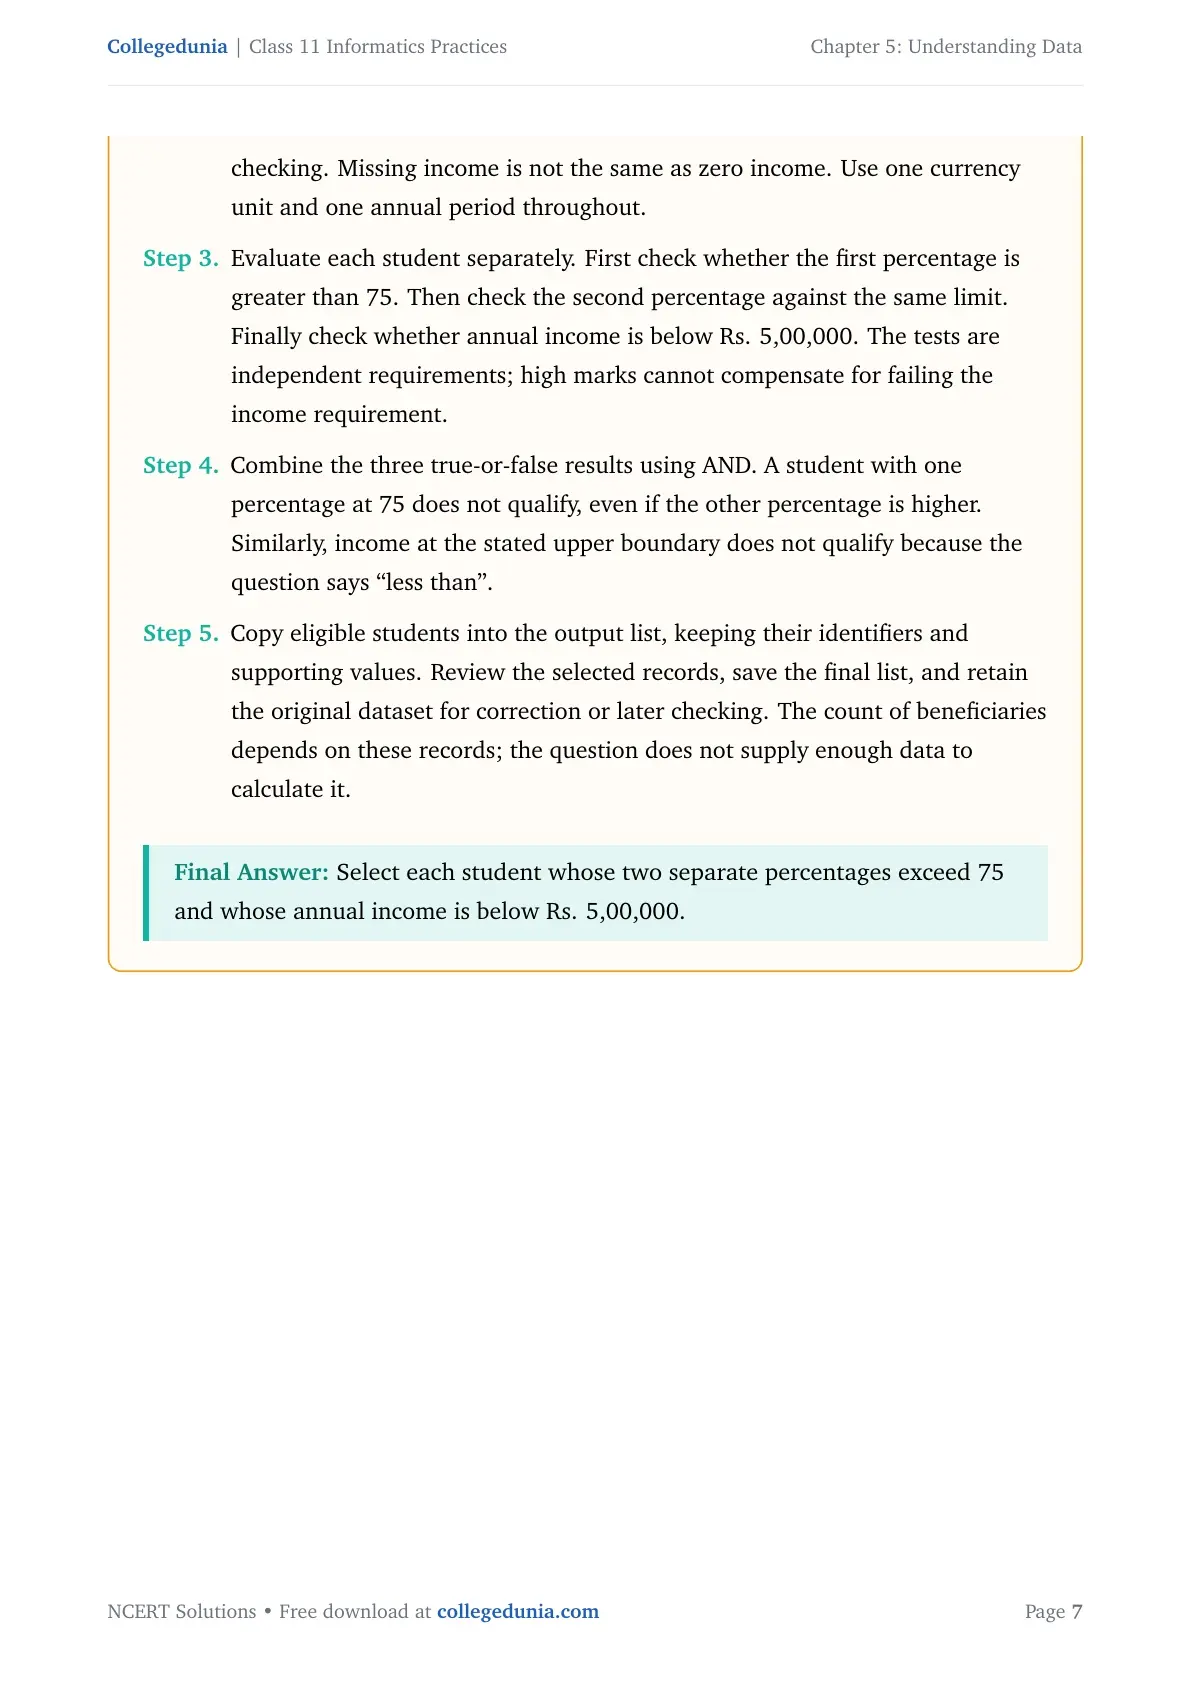
Both yearly mark conditions must hold. Averaging the two percentages can admit a student who fails one year's condition. A score of exactly 75% also fails the stated “more than 75%” test.
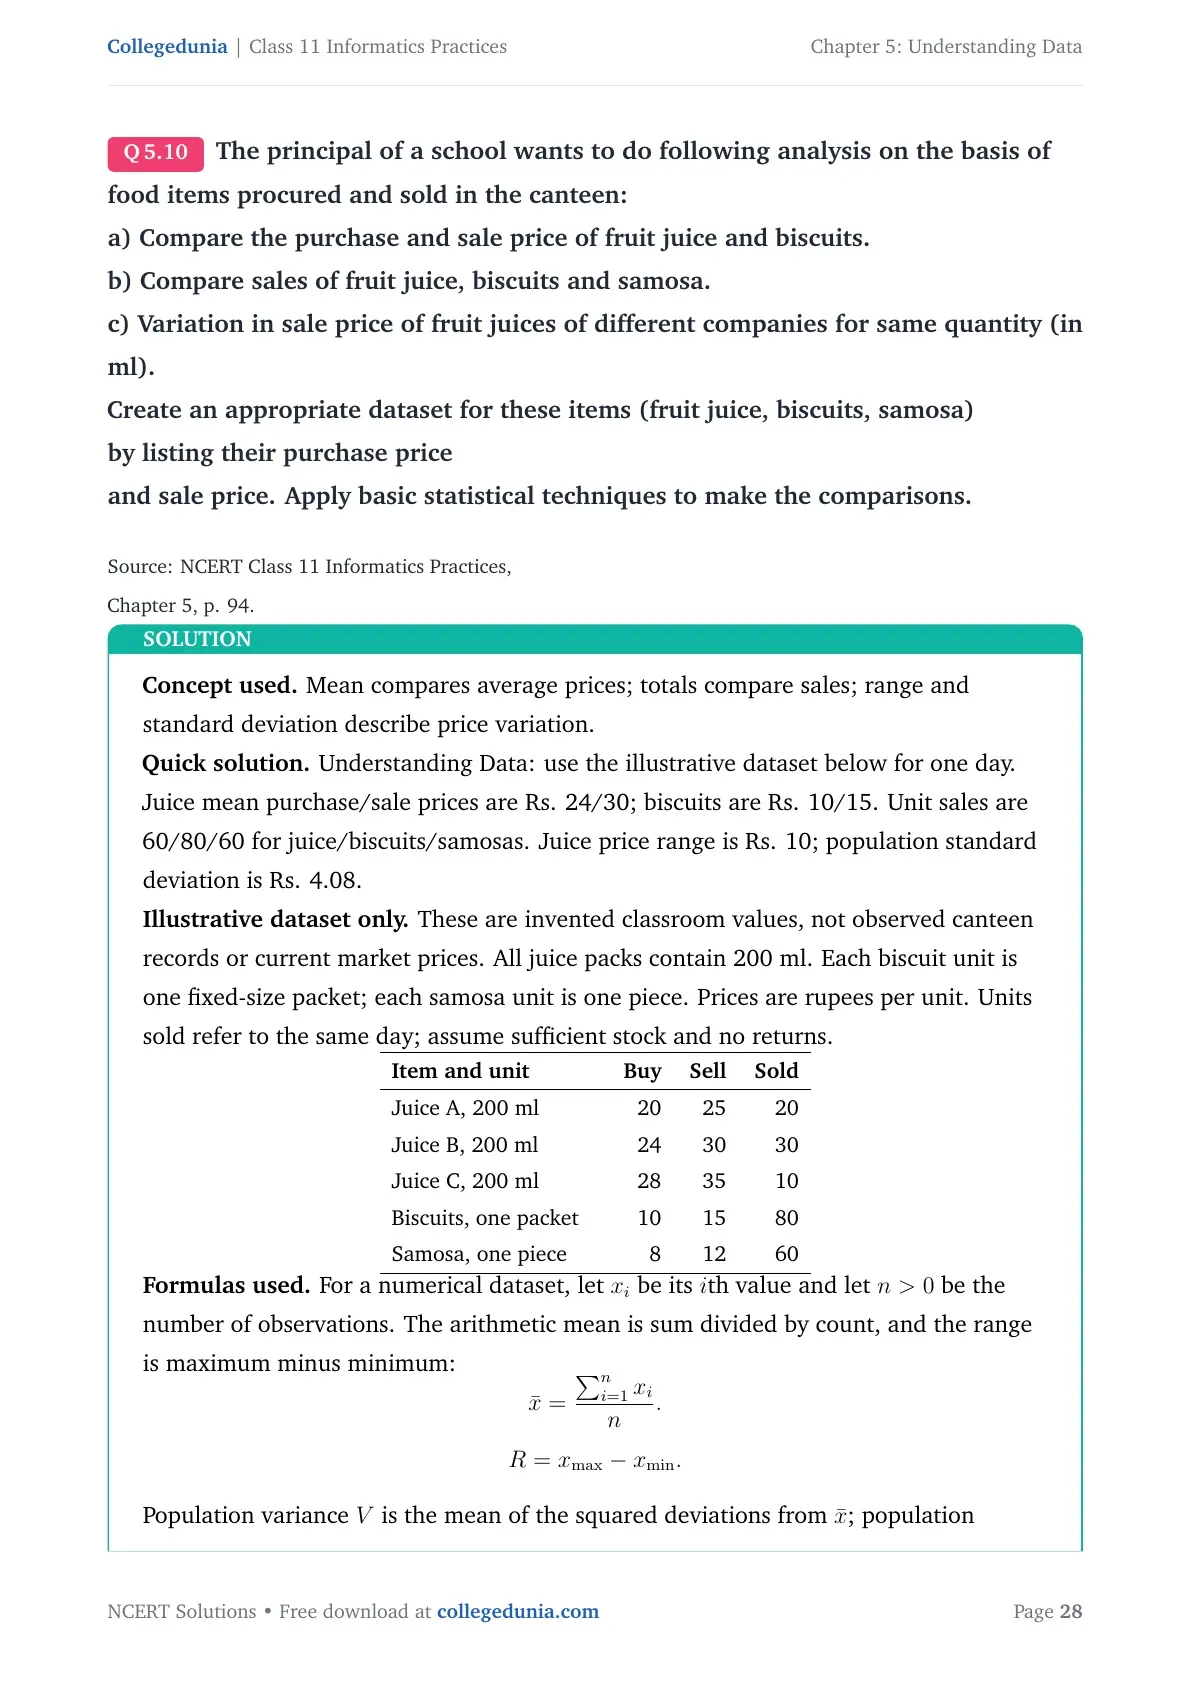
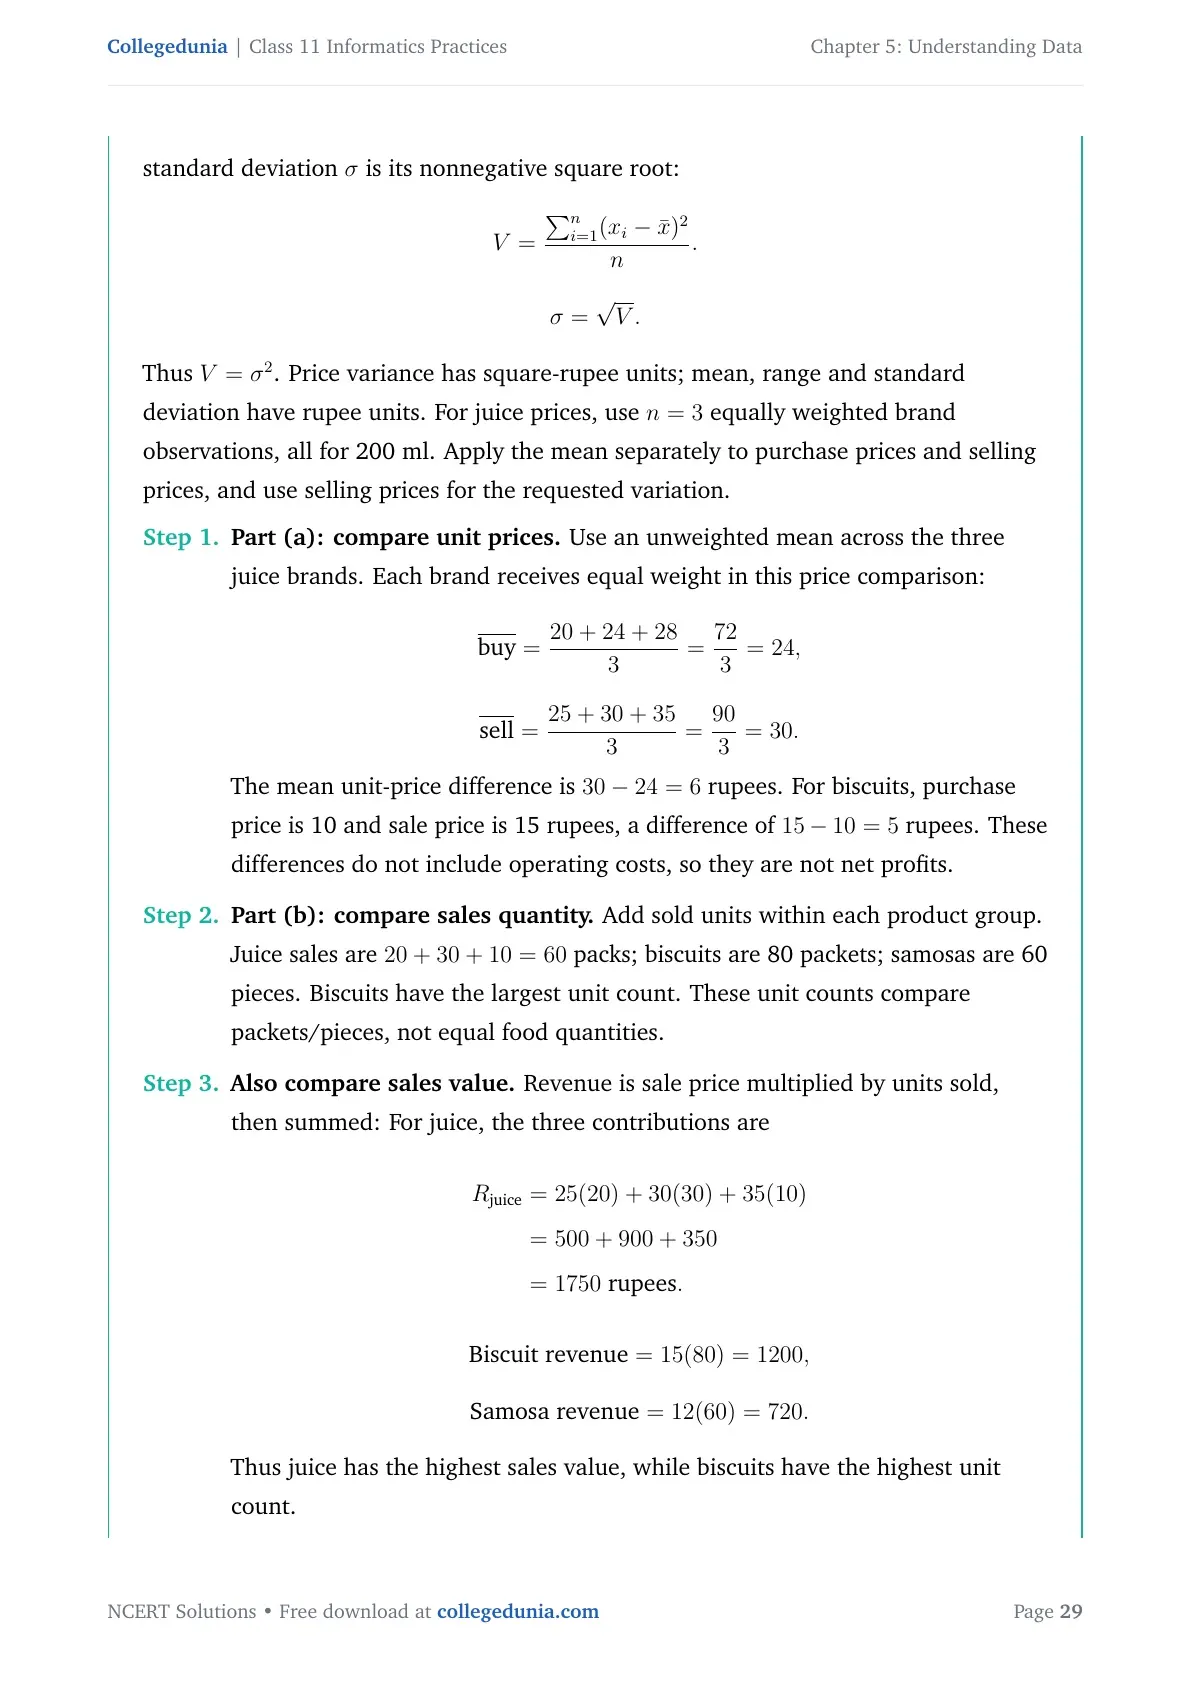
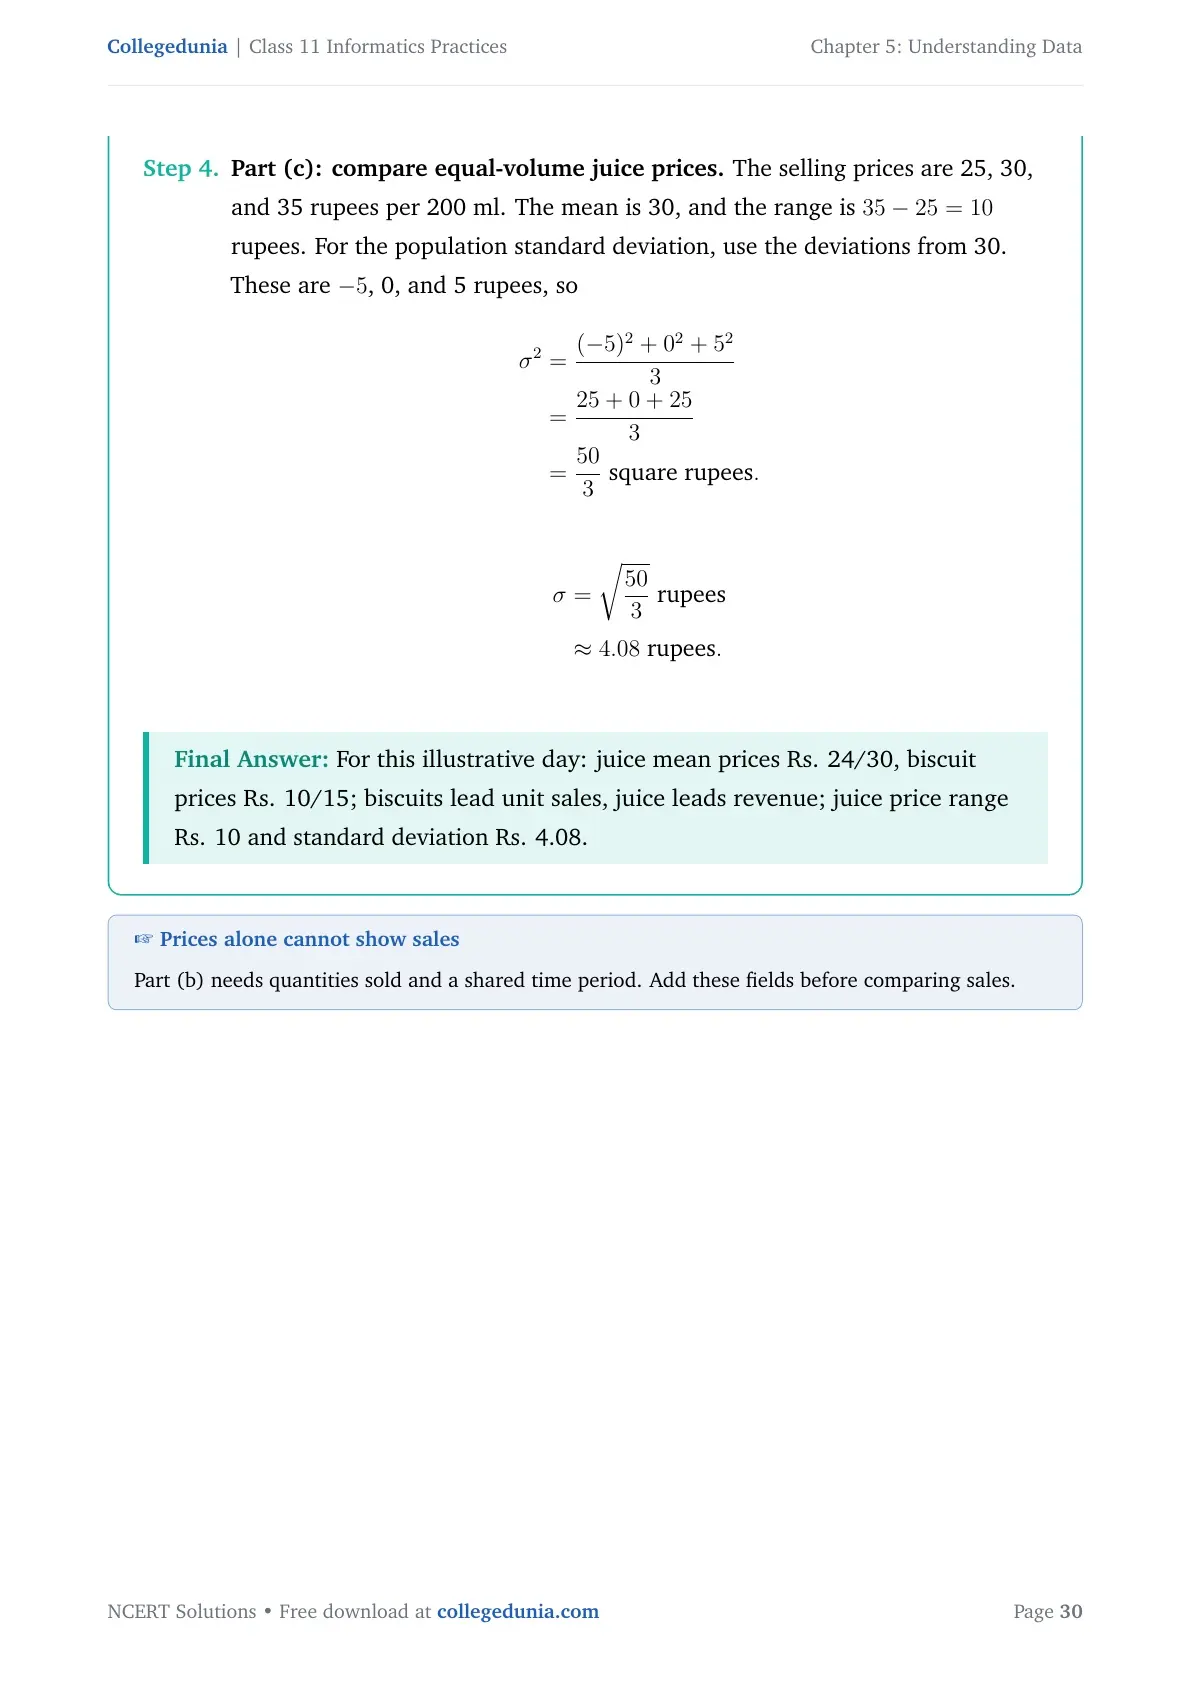
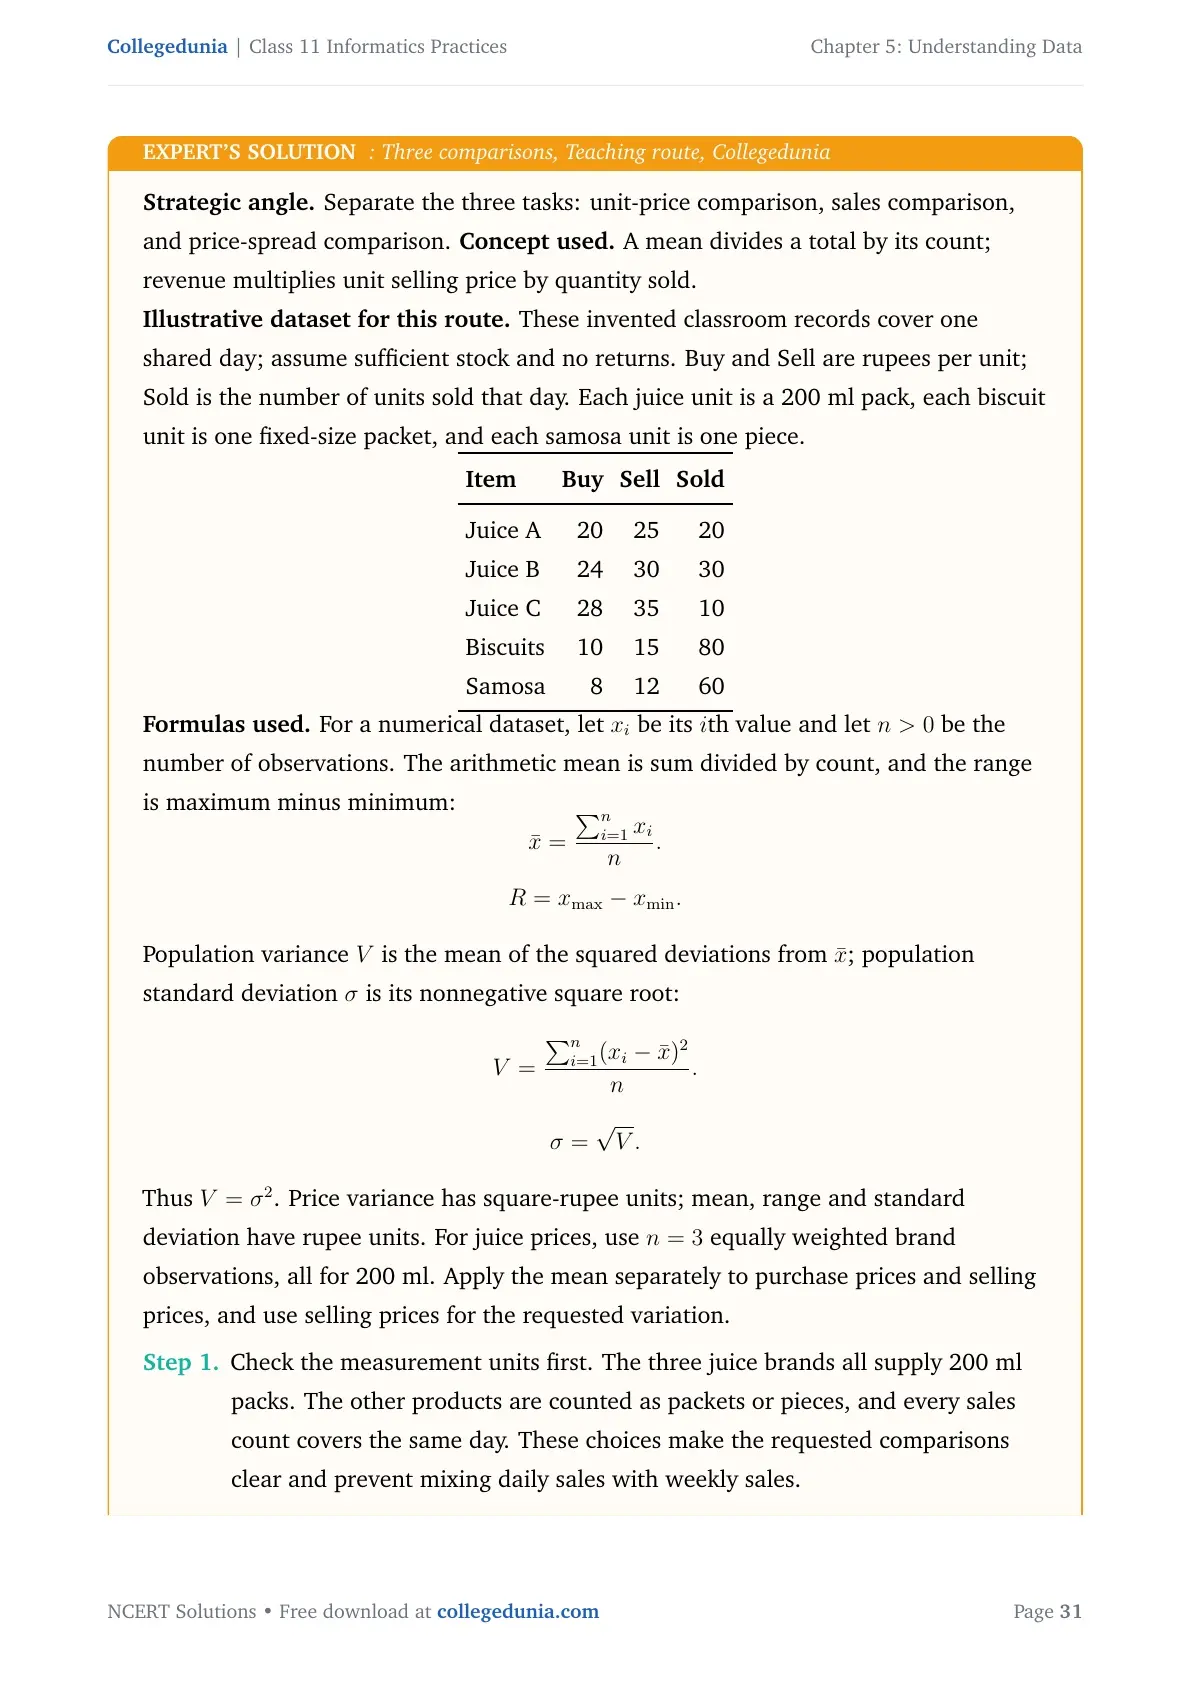
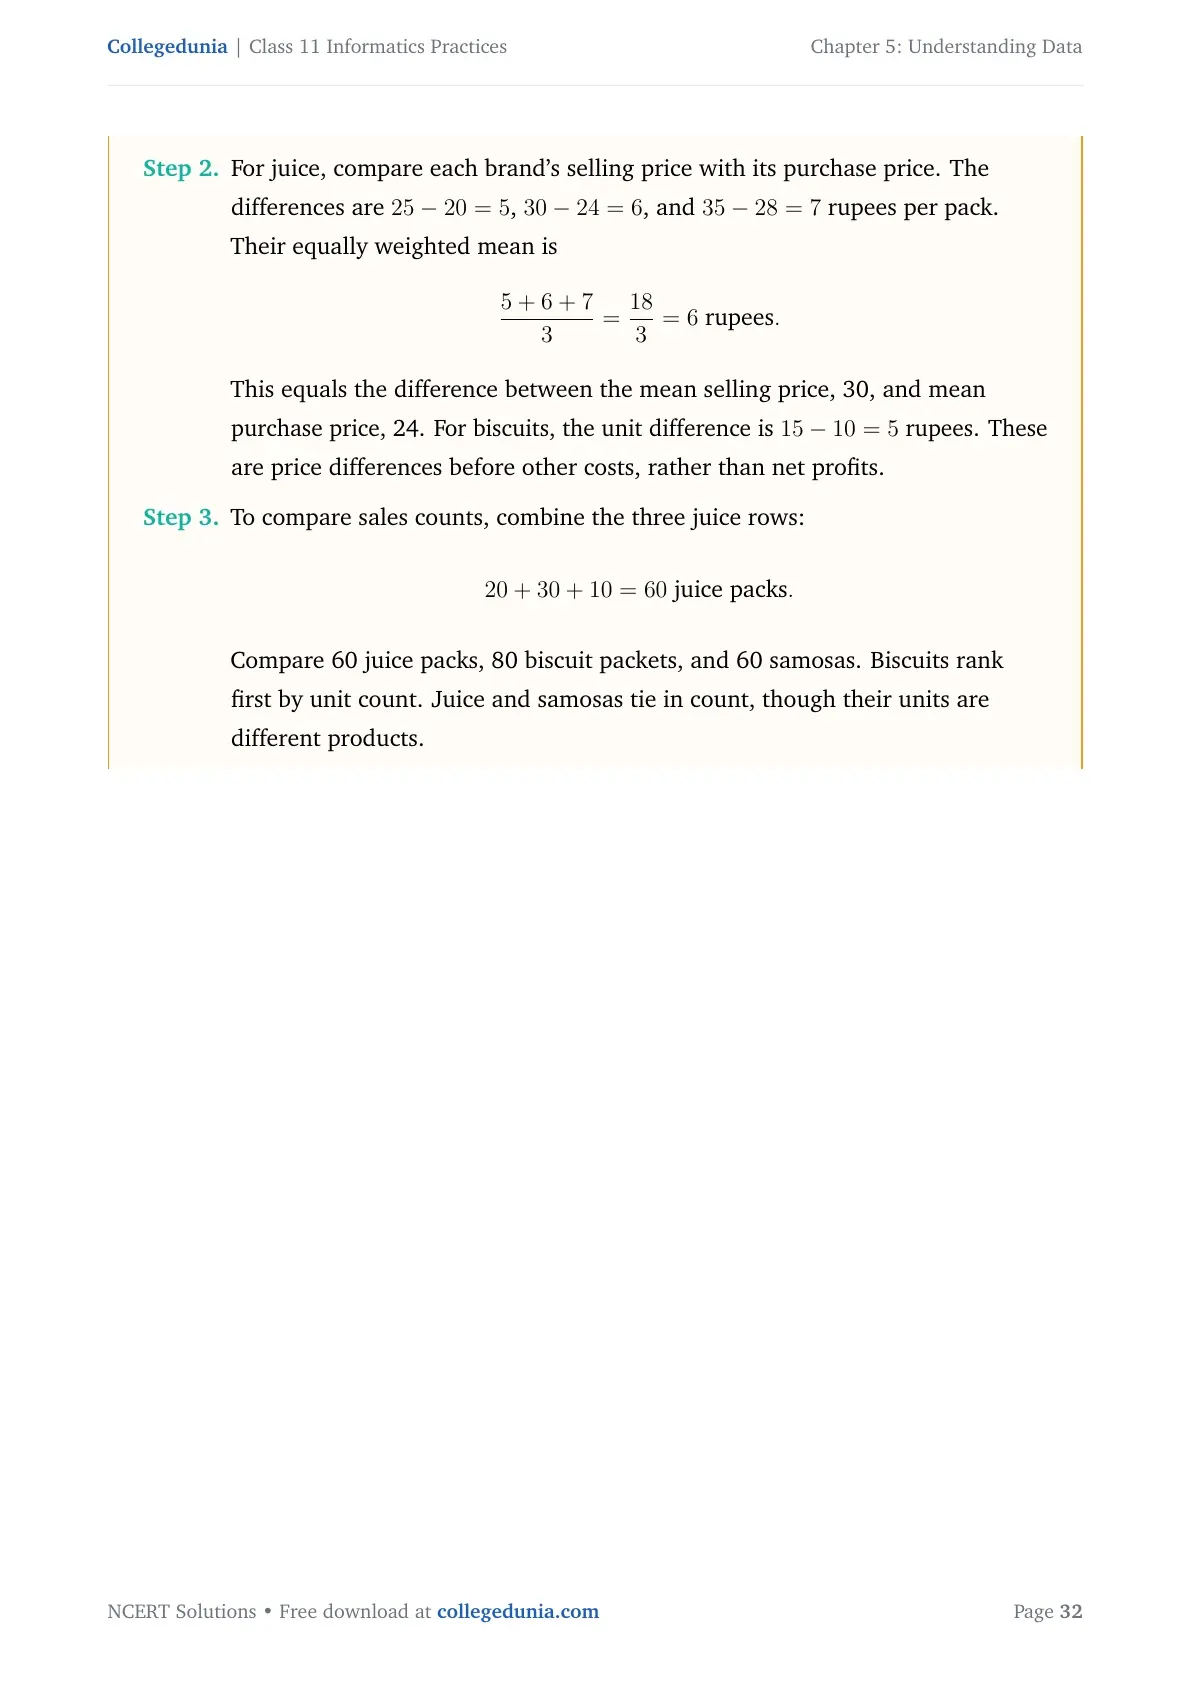
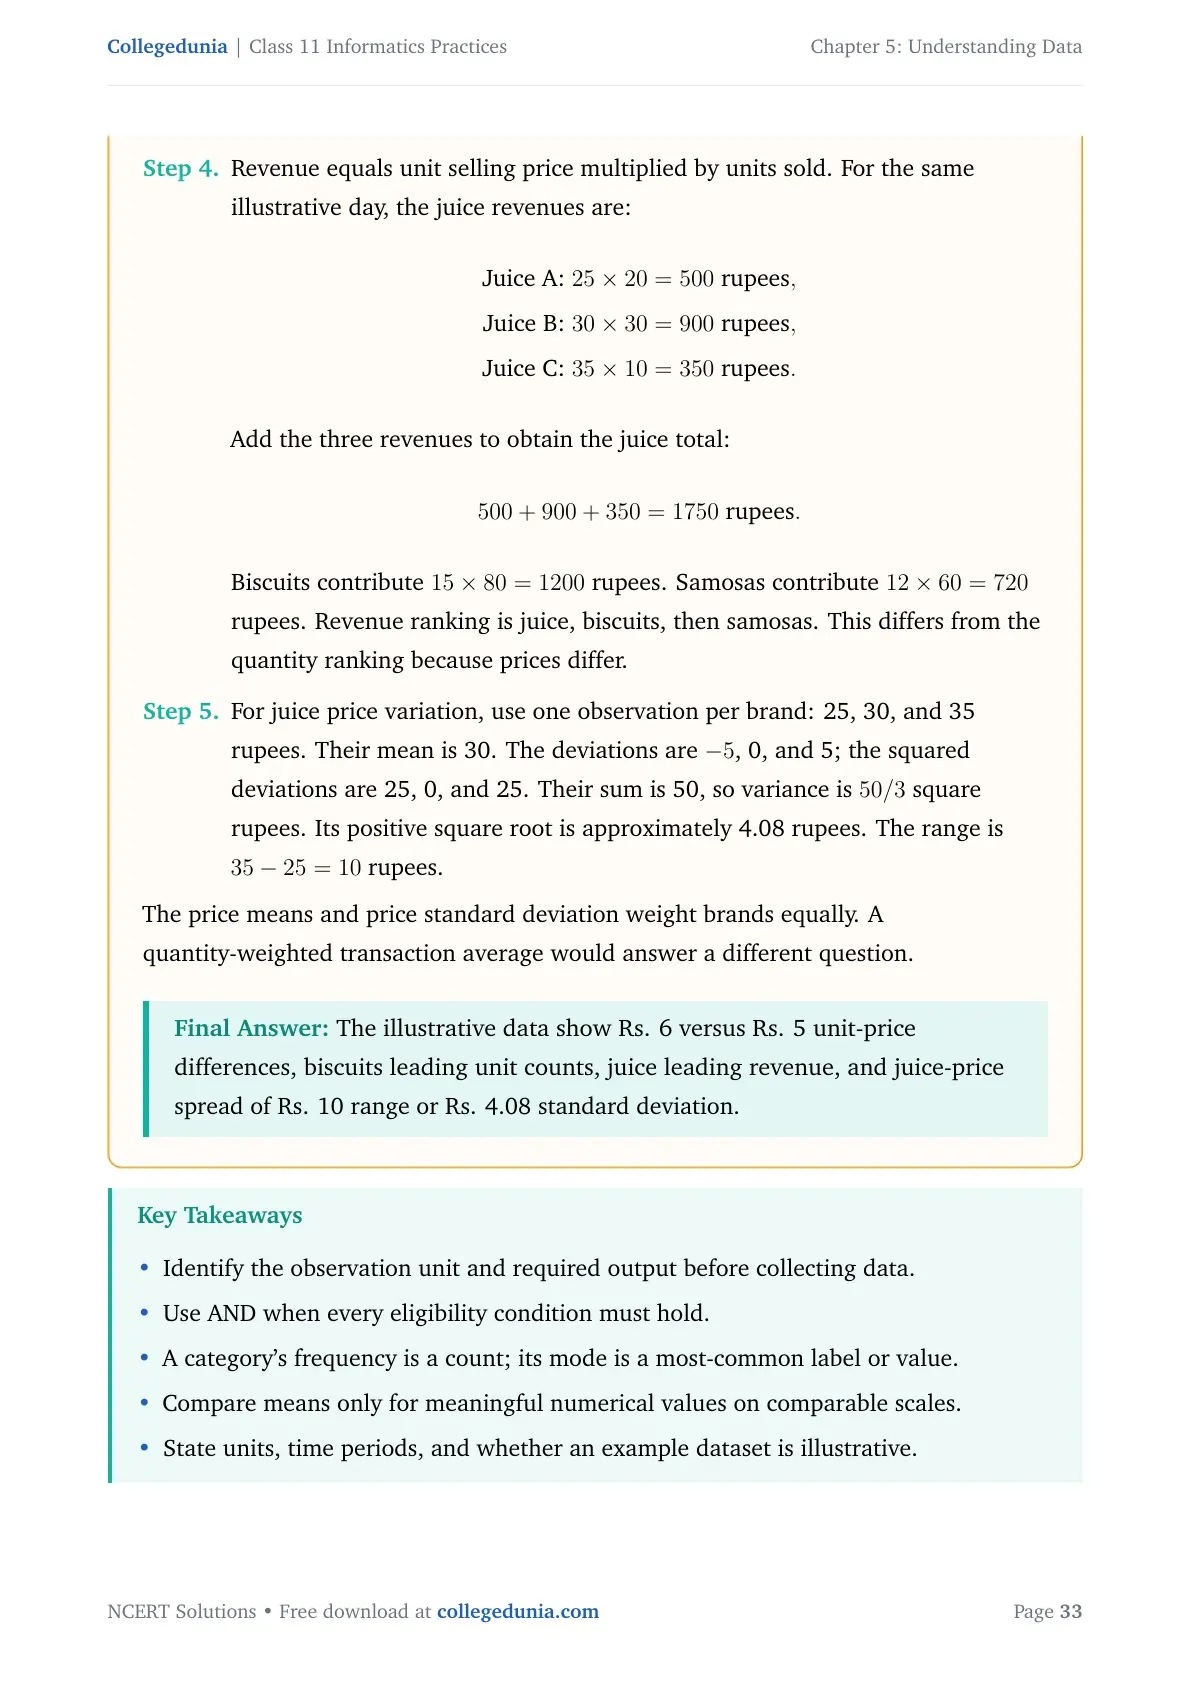
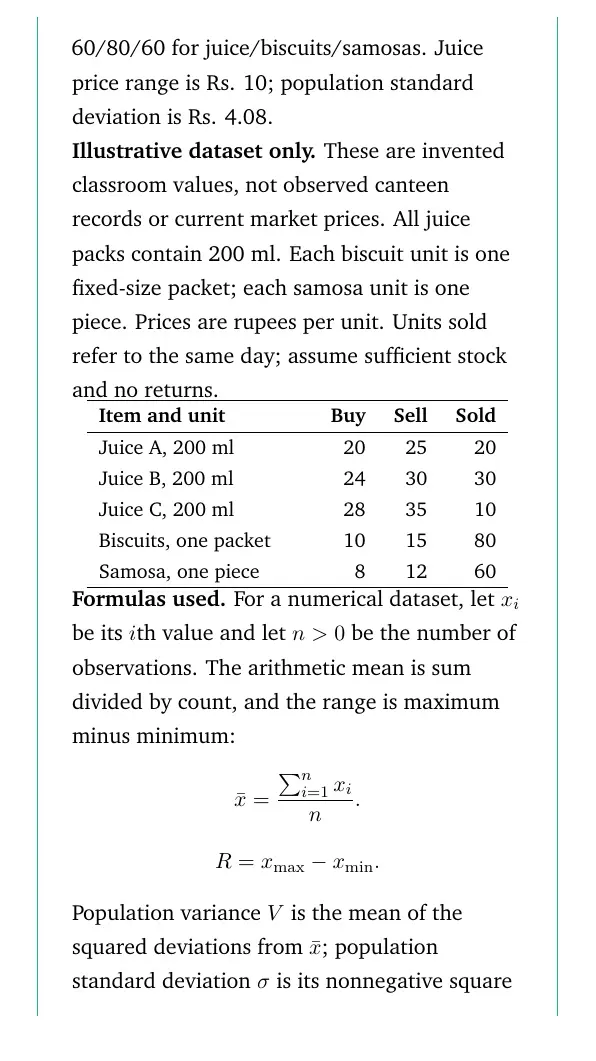
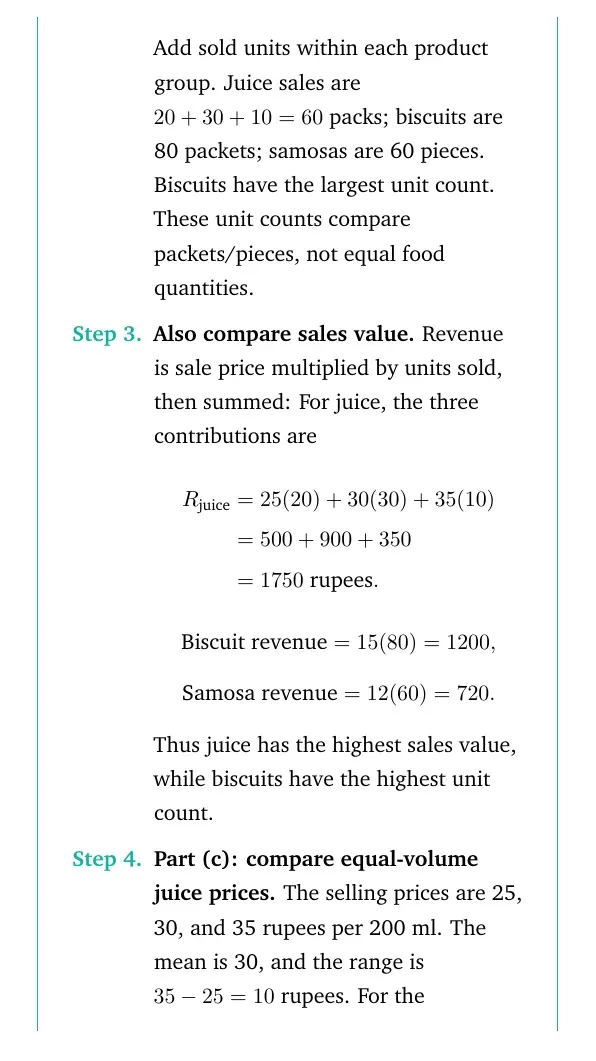
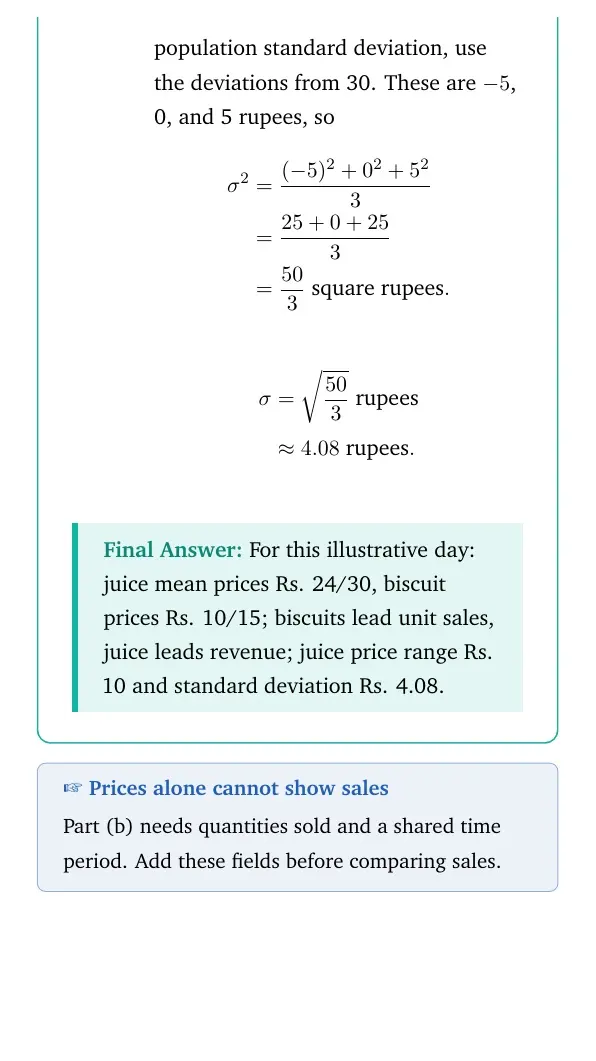
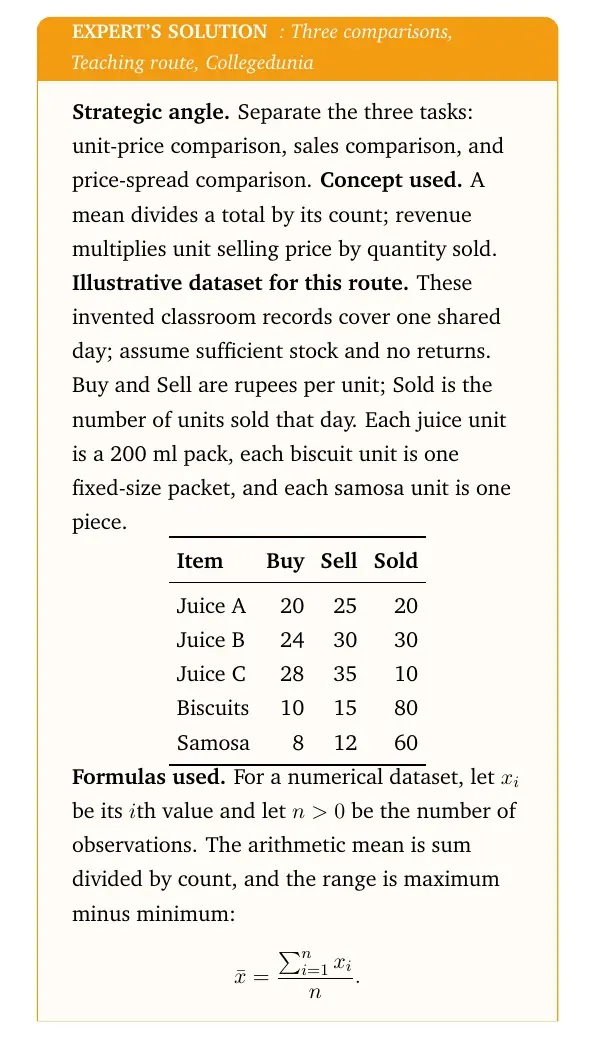
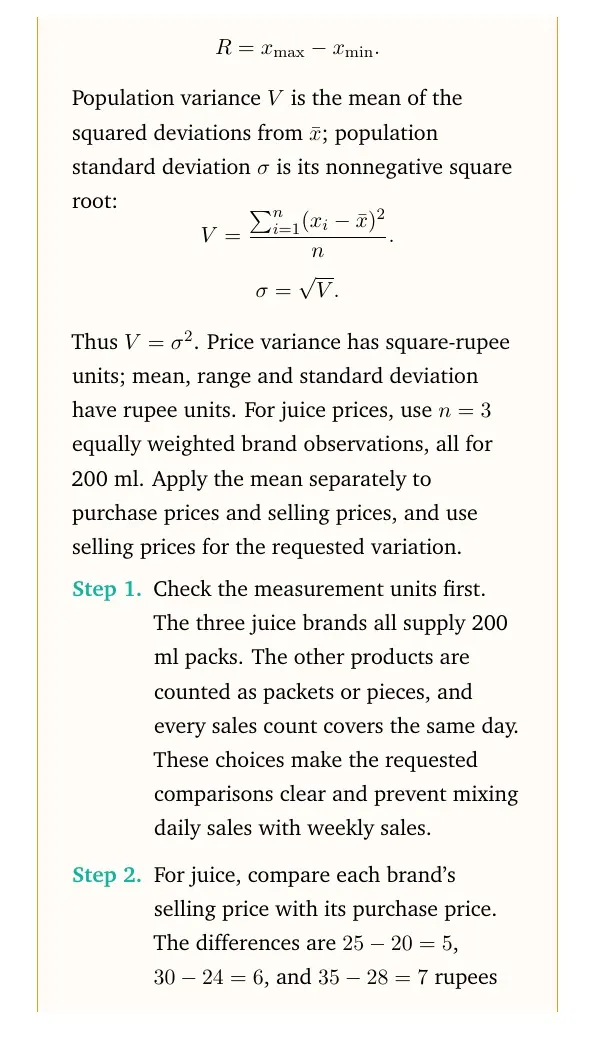
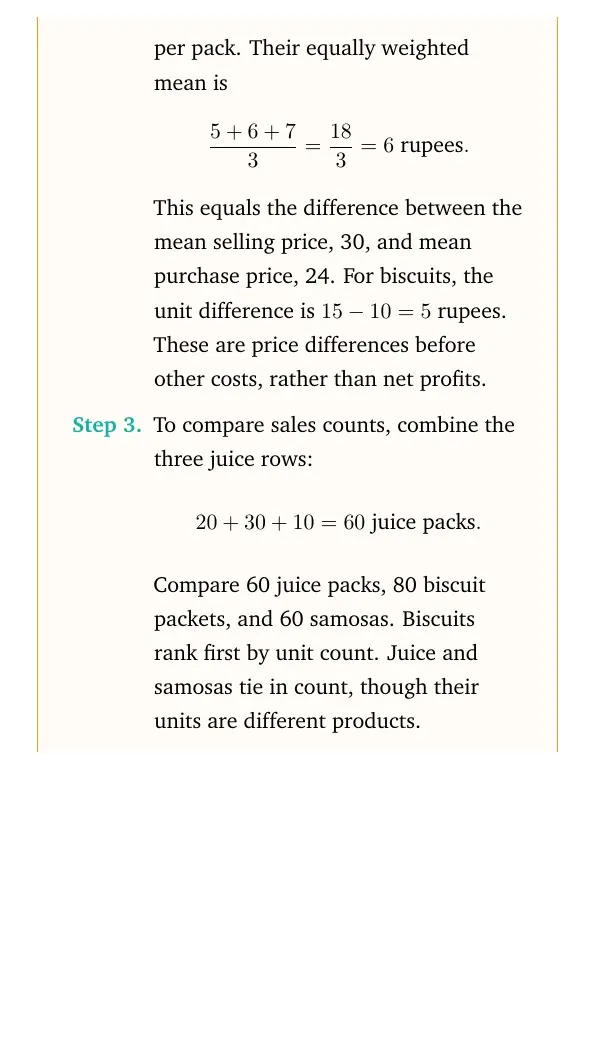
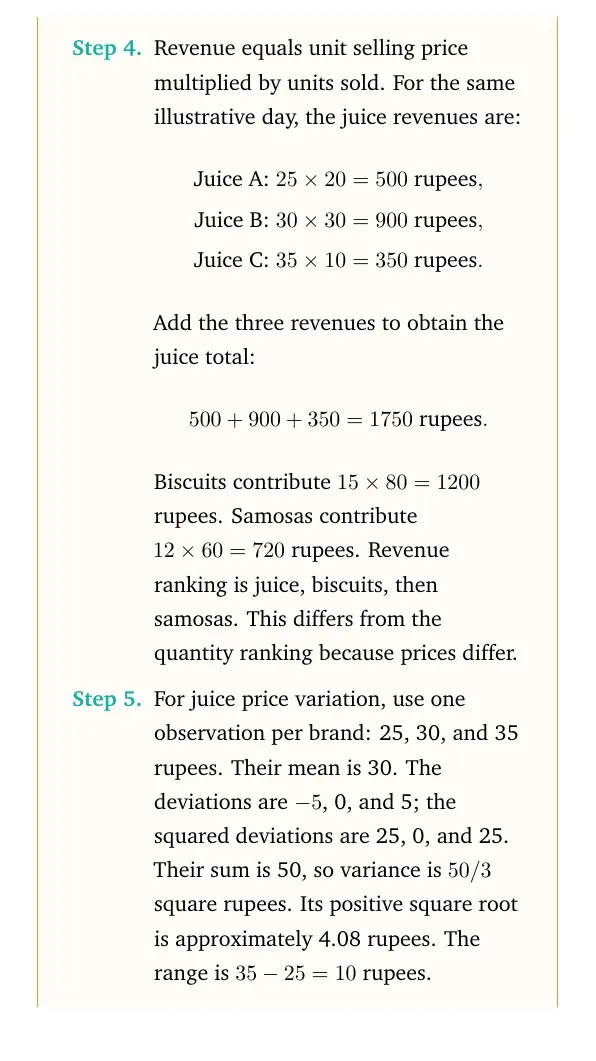
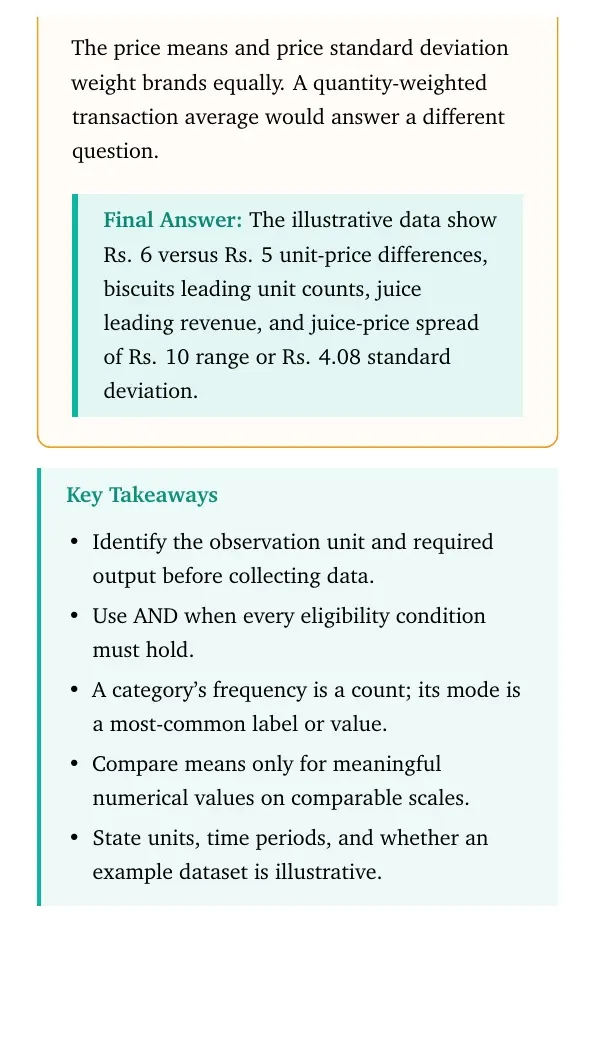
For question 10, label your canteen figures as an example dataset. Record product, quantity, purchase price, sale price and units sold. Compare equal juice volumes when comparing brands. Use units sold to compare quantities sold; use sale price multiplied by units sold to compare revenue.
Understanding Data Revision: Mistakes to Check Before Submission
Try the questions before opening the solutions. Collegedunia's exercise checklist can help you review one type of answer at a time.
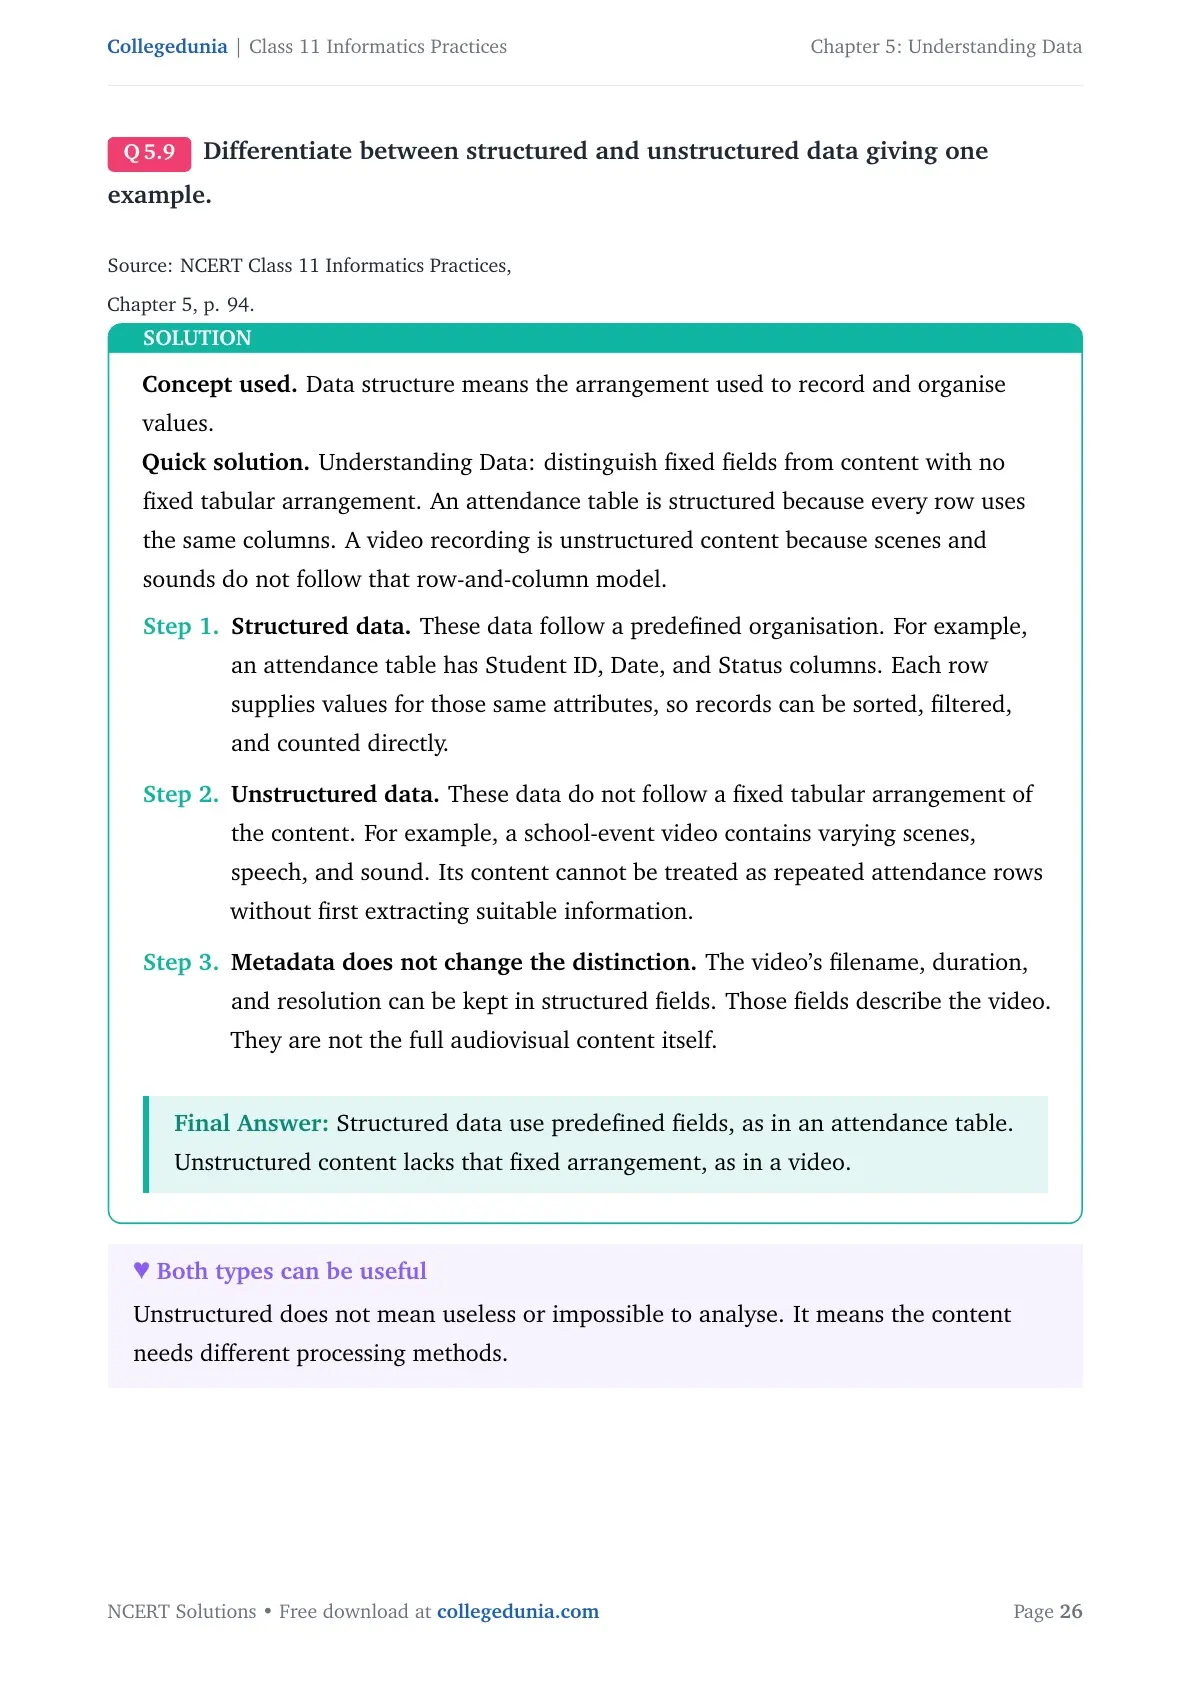
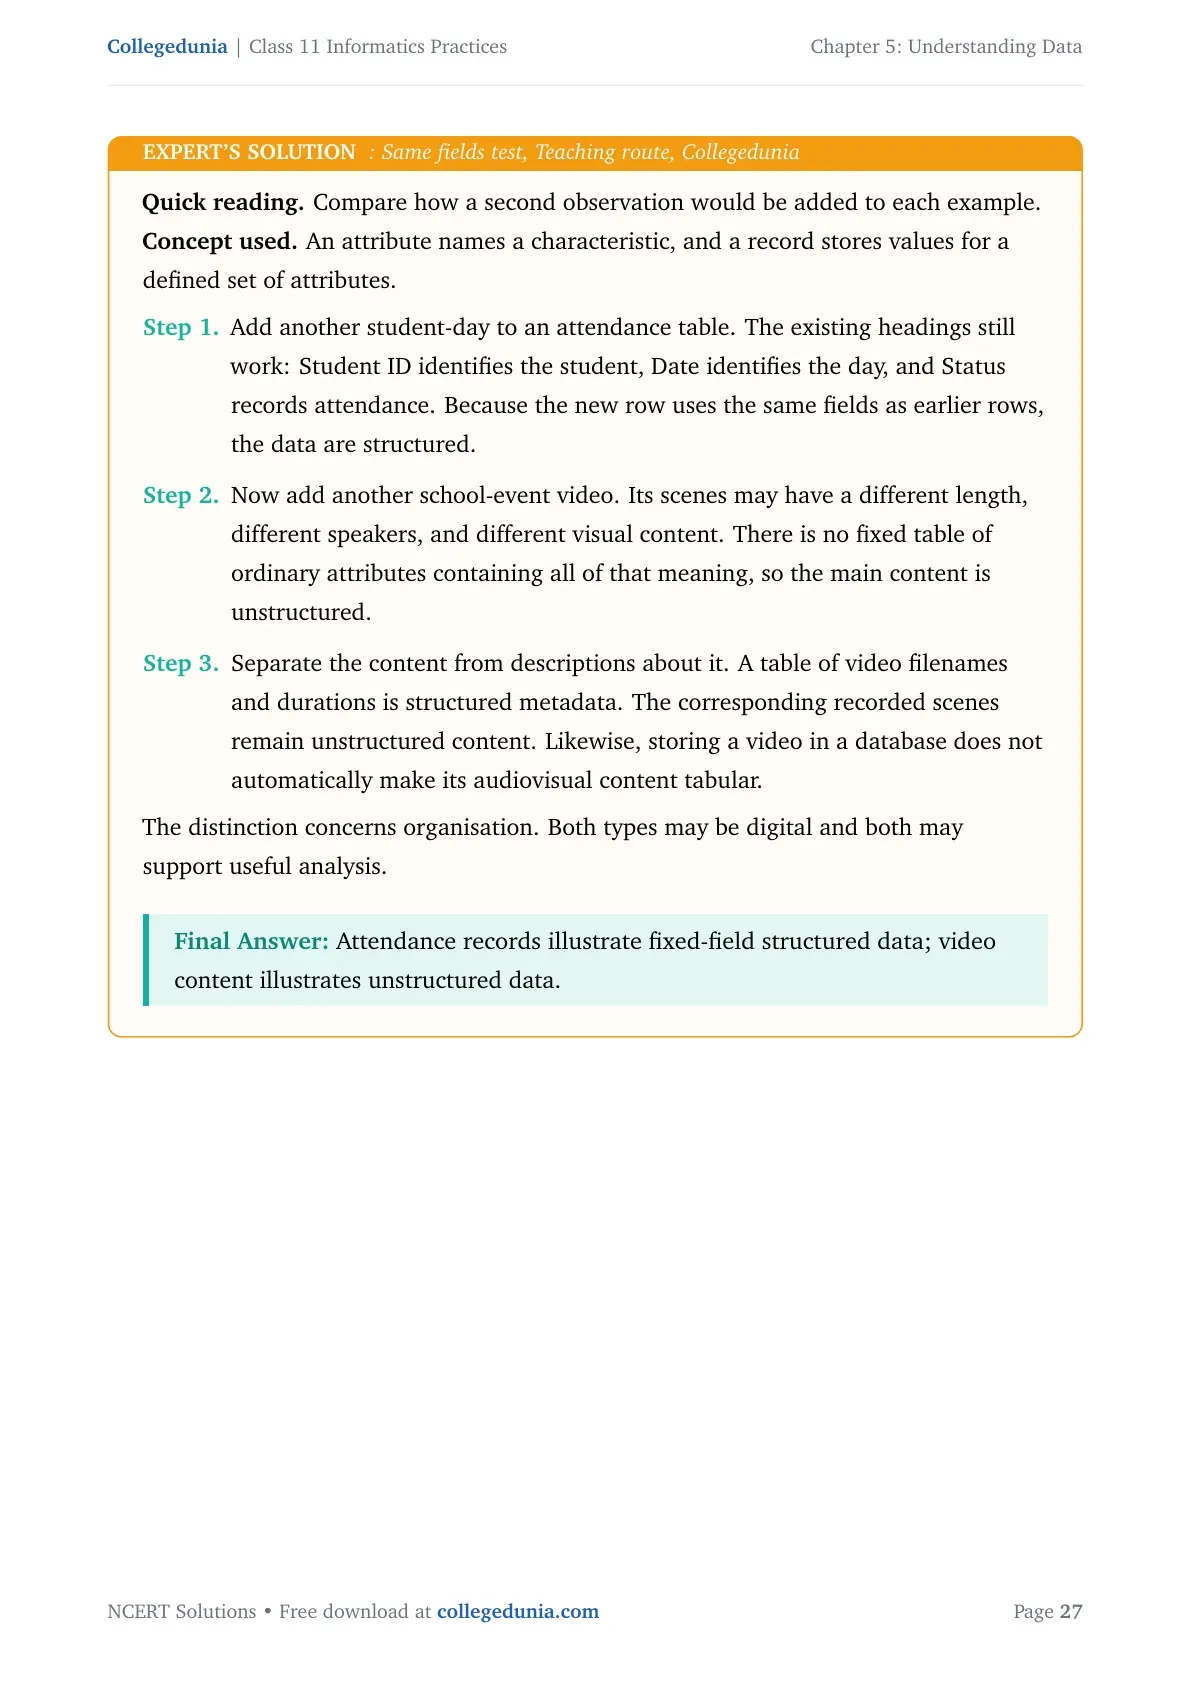
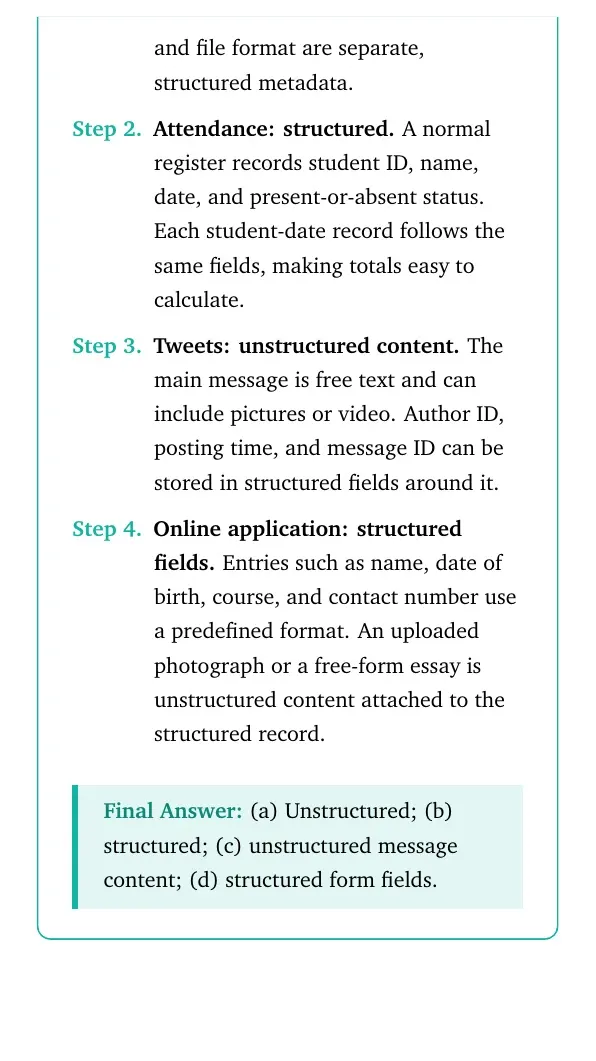
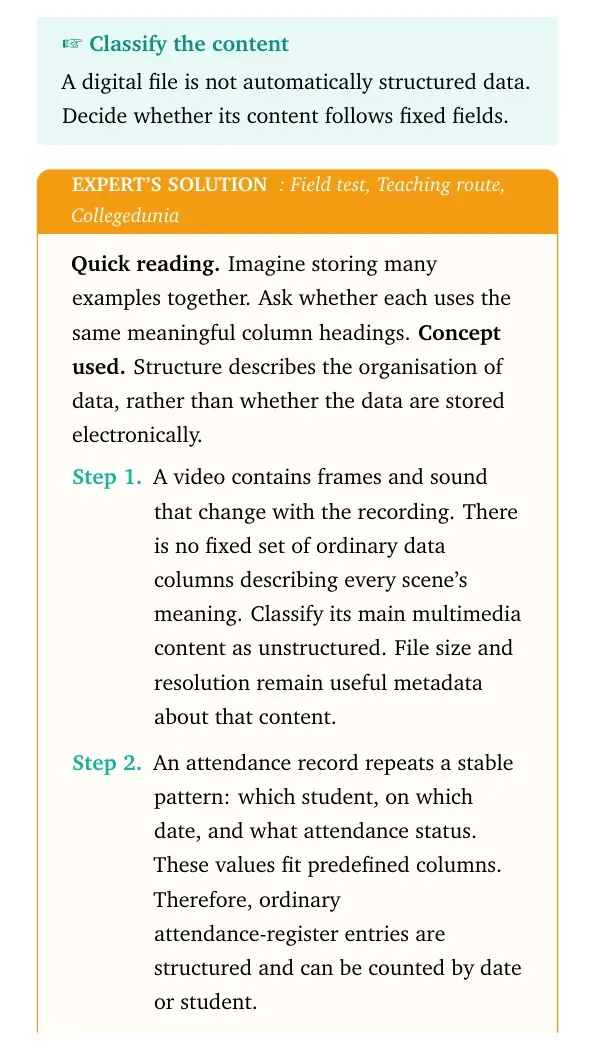
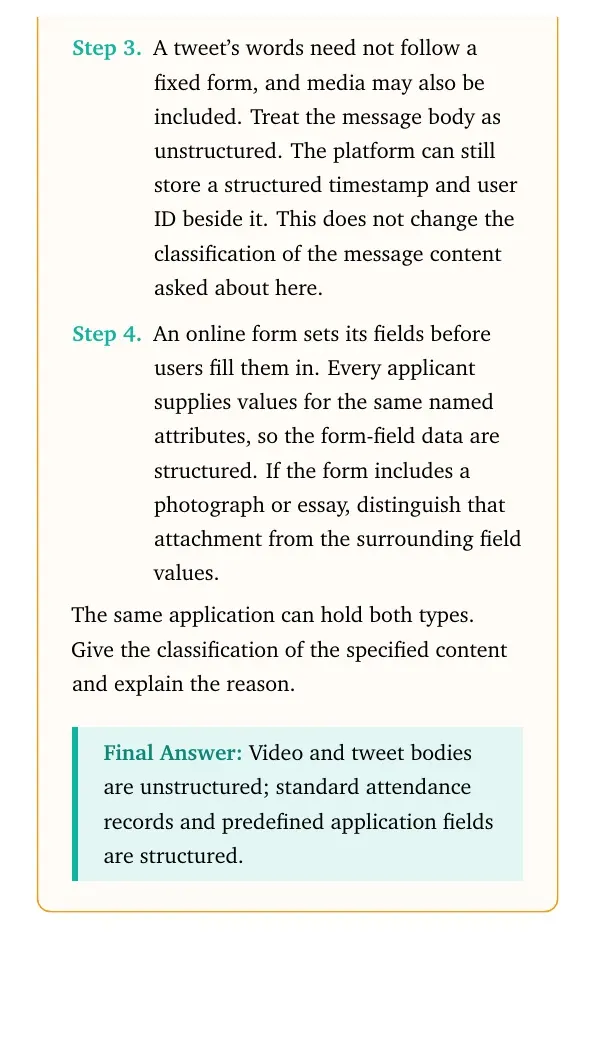
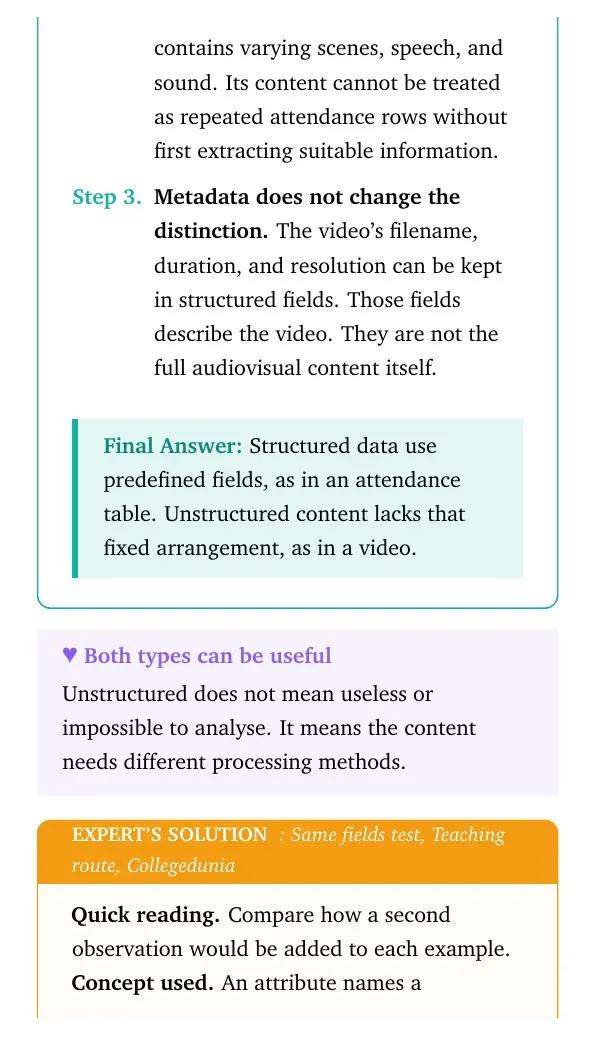
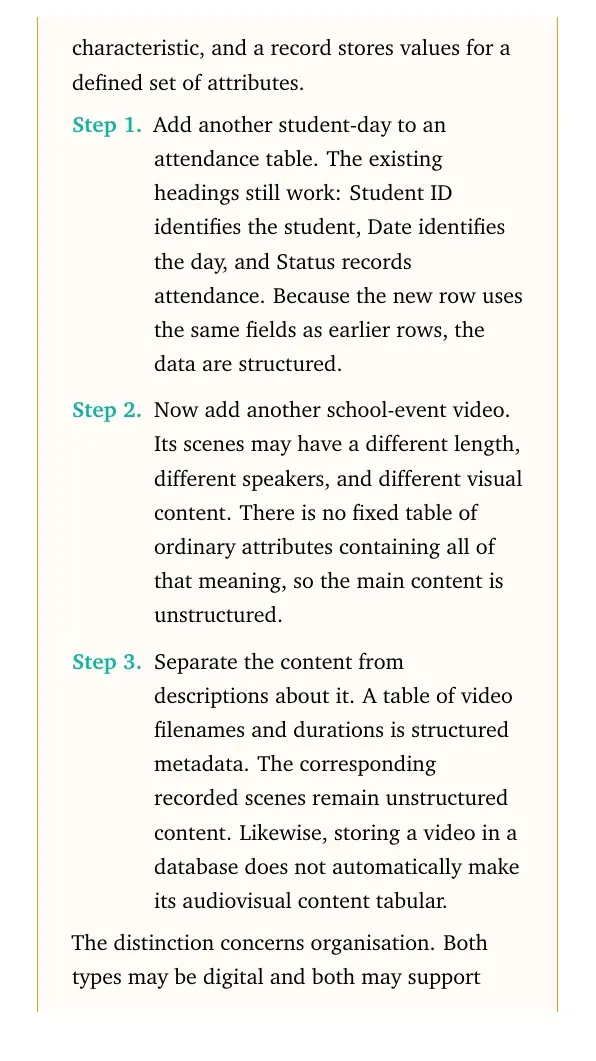
- State why attendance records fit rows and columns, while a video does not have that tabular format.
- Separate the raw observations from the result produced after processing them.
- Keep temperature units in the mean, range and standard deviation answers.
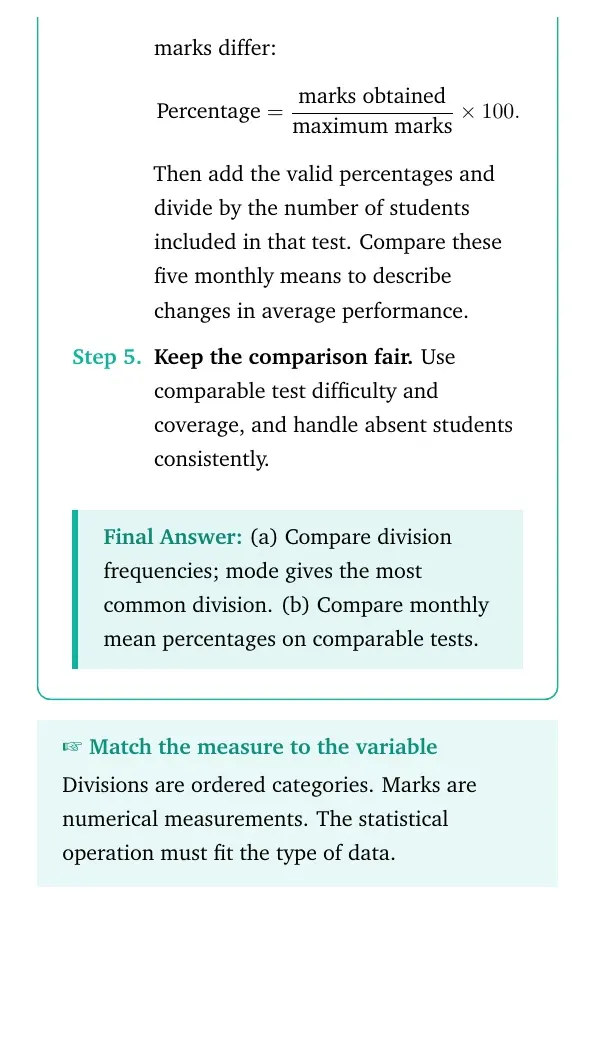
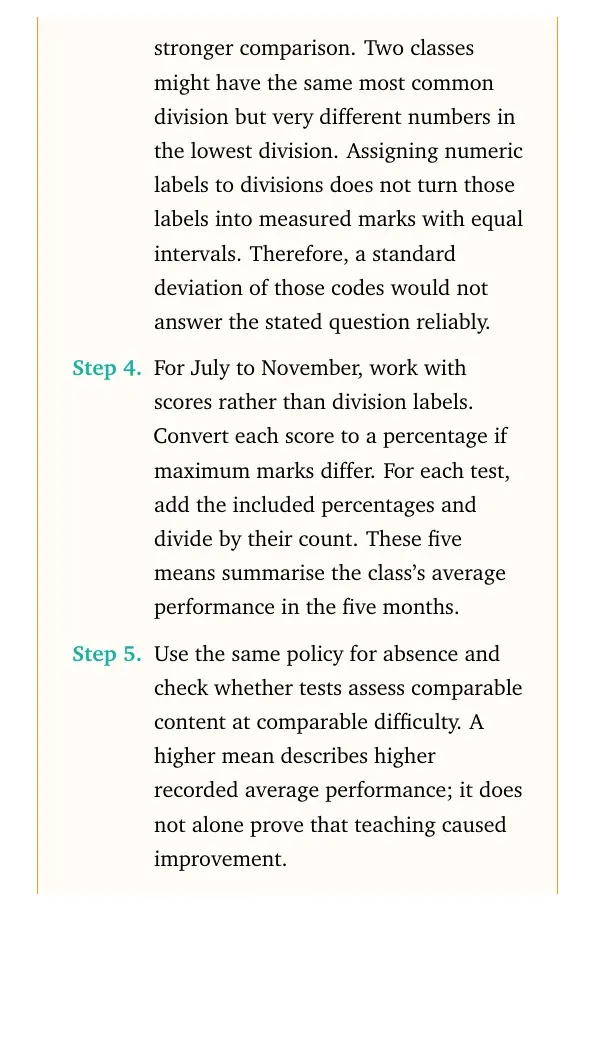
- Use comparable tests and marking scales before comparing monthly class averages.
- Apply the same skill scale to every student when recording anchor-selection observations.
A suggested revision session is 15 minutes for classifications, 20 minutes for the temperature calculation and 25 minutes for scenario answers. Add time wherever your reasoning needs work.
Understanding Data: All 10 Questions with Step-by-Step Solutions
Choose Check Solution for the main explanation or Expert Solution for another teaching route. Route labels describe approaches, not individual authors.
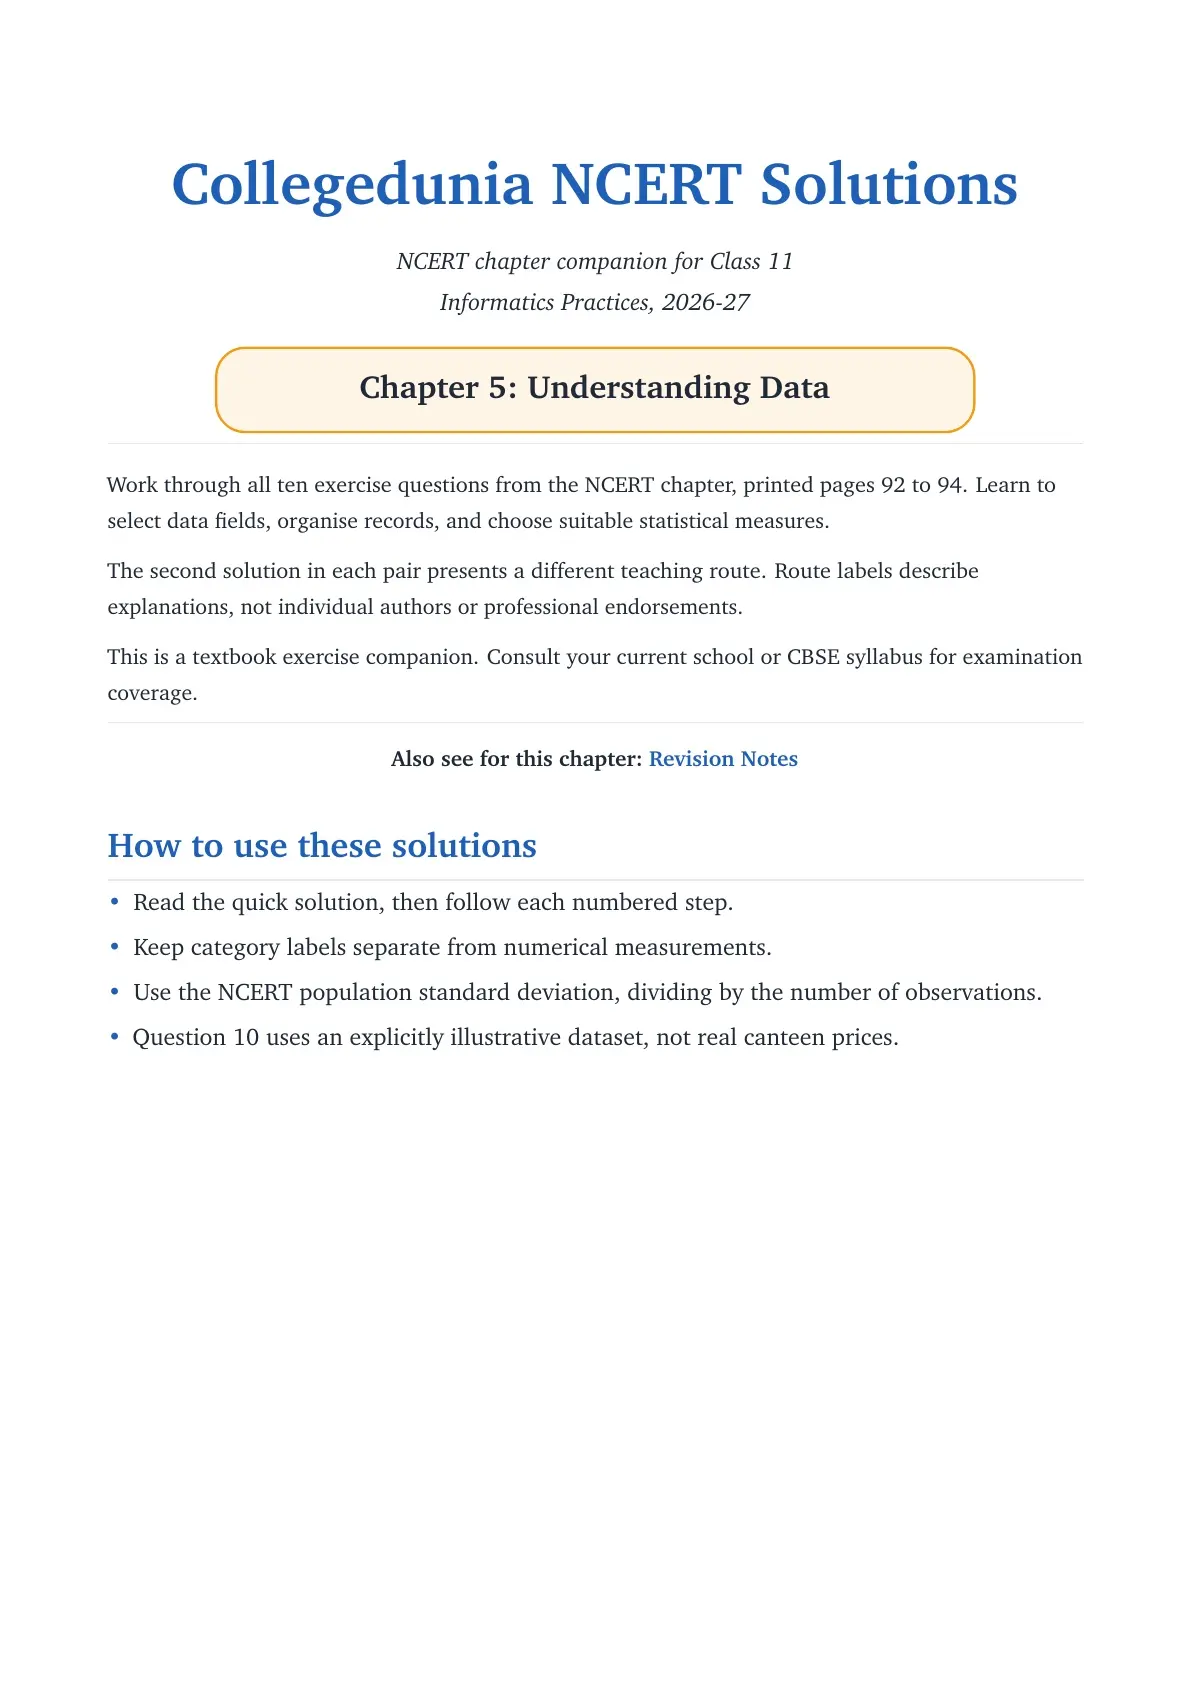
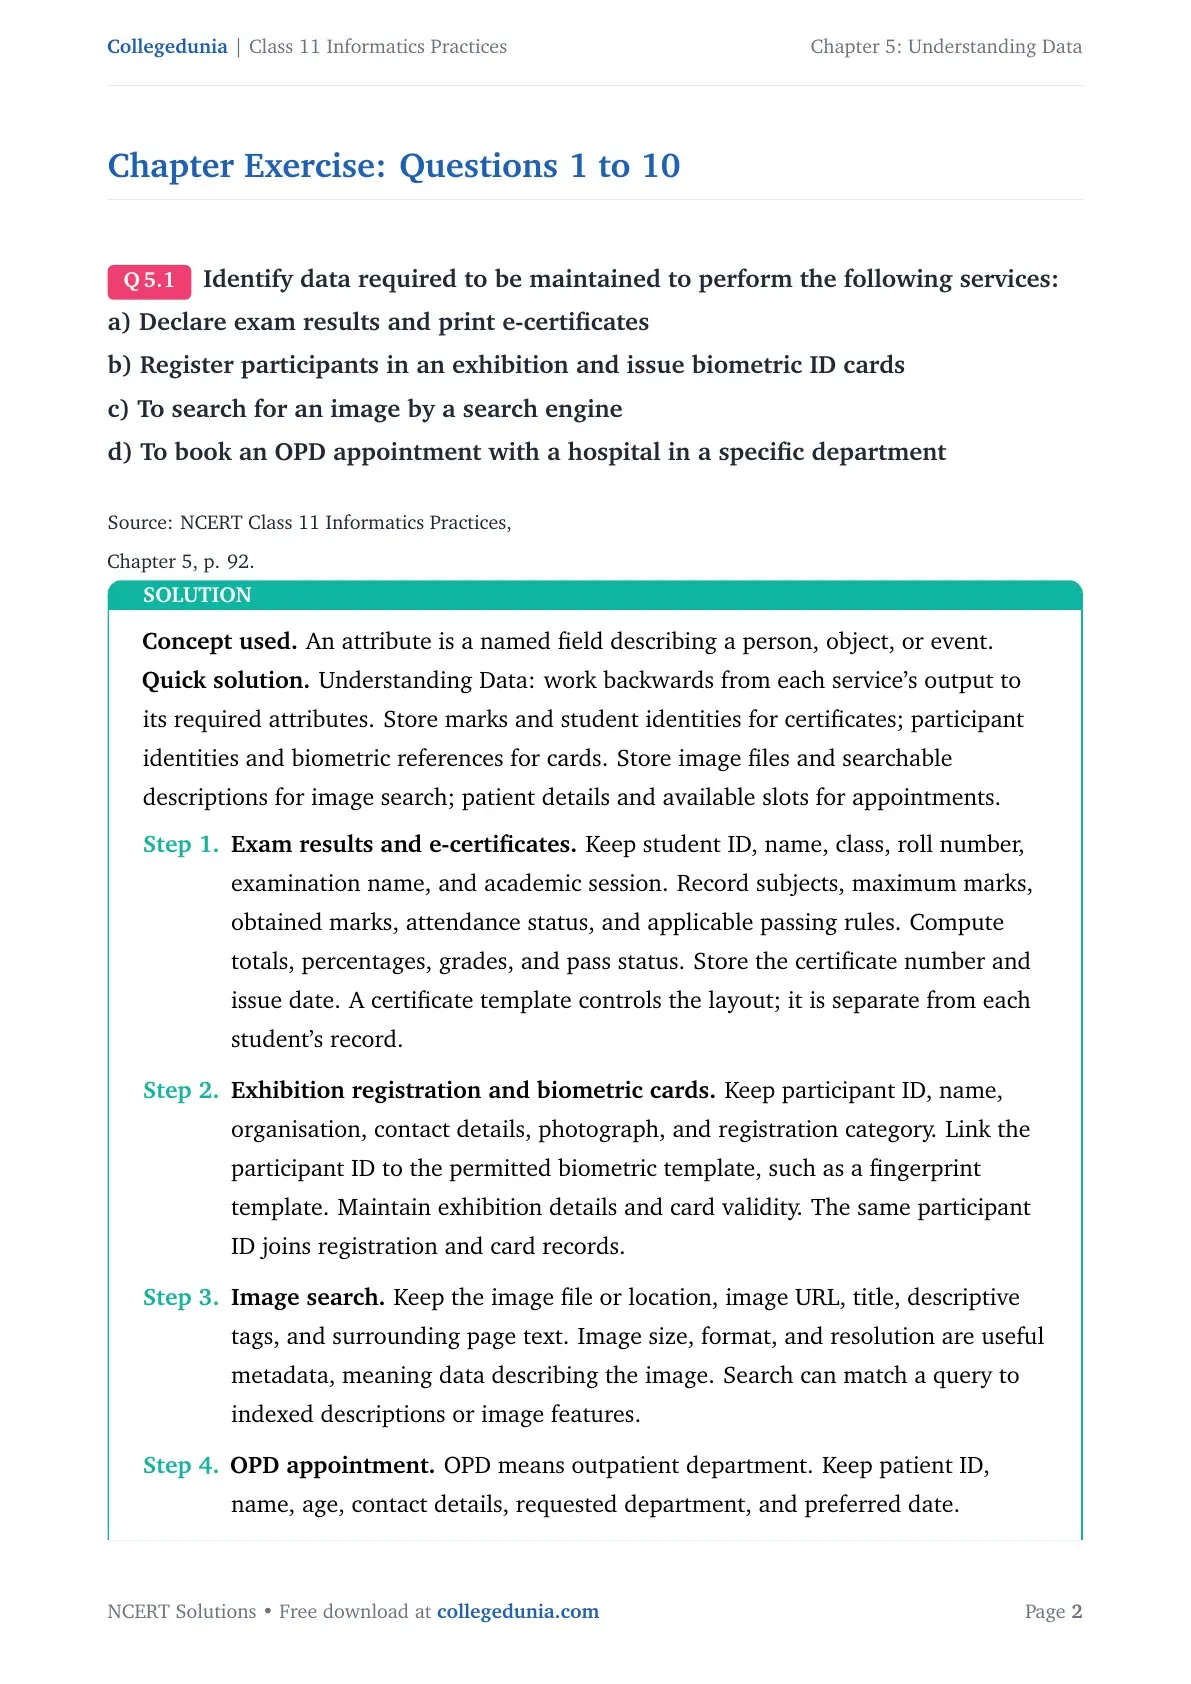
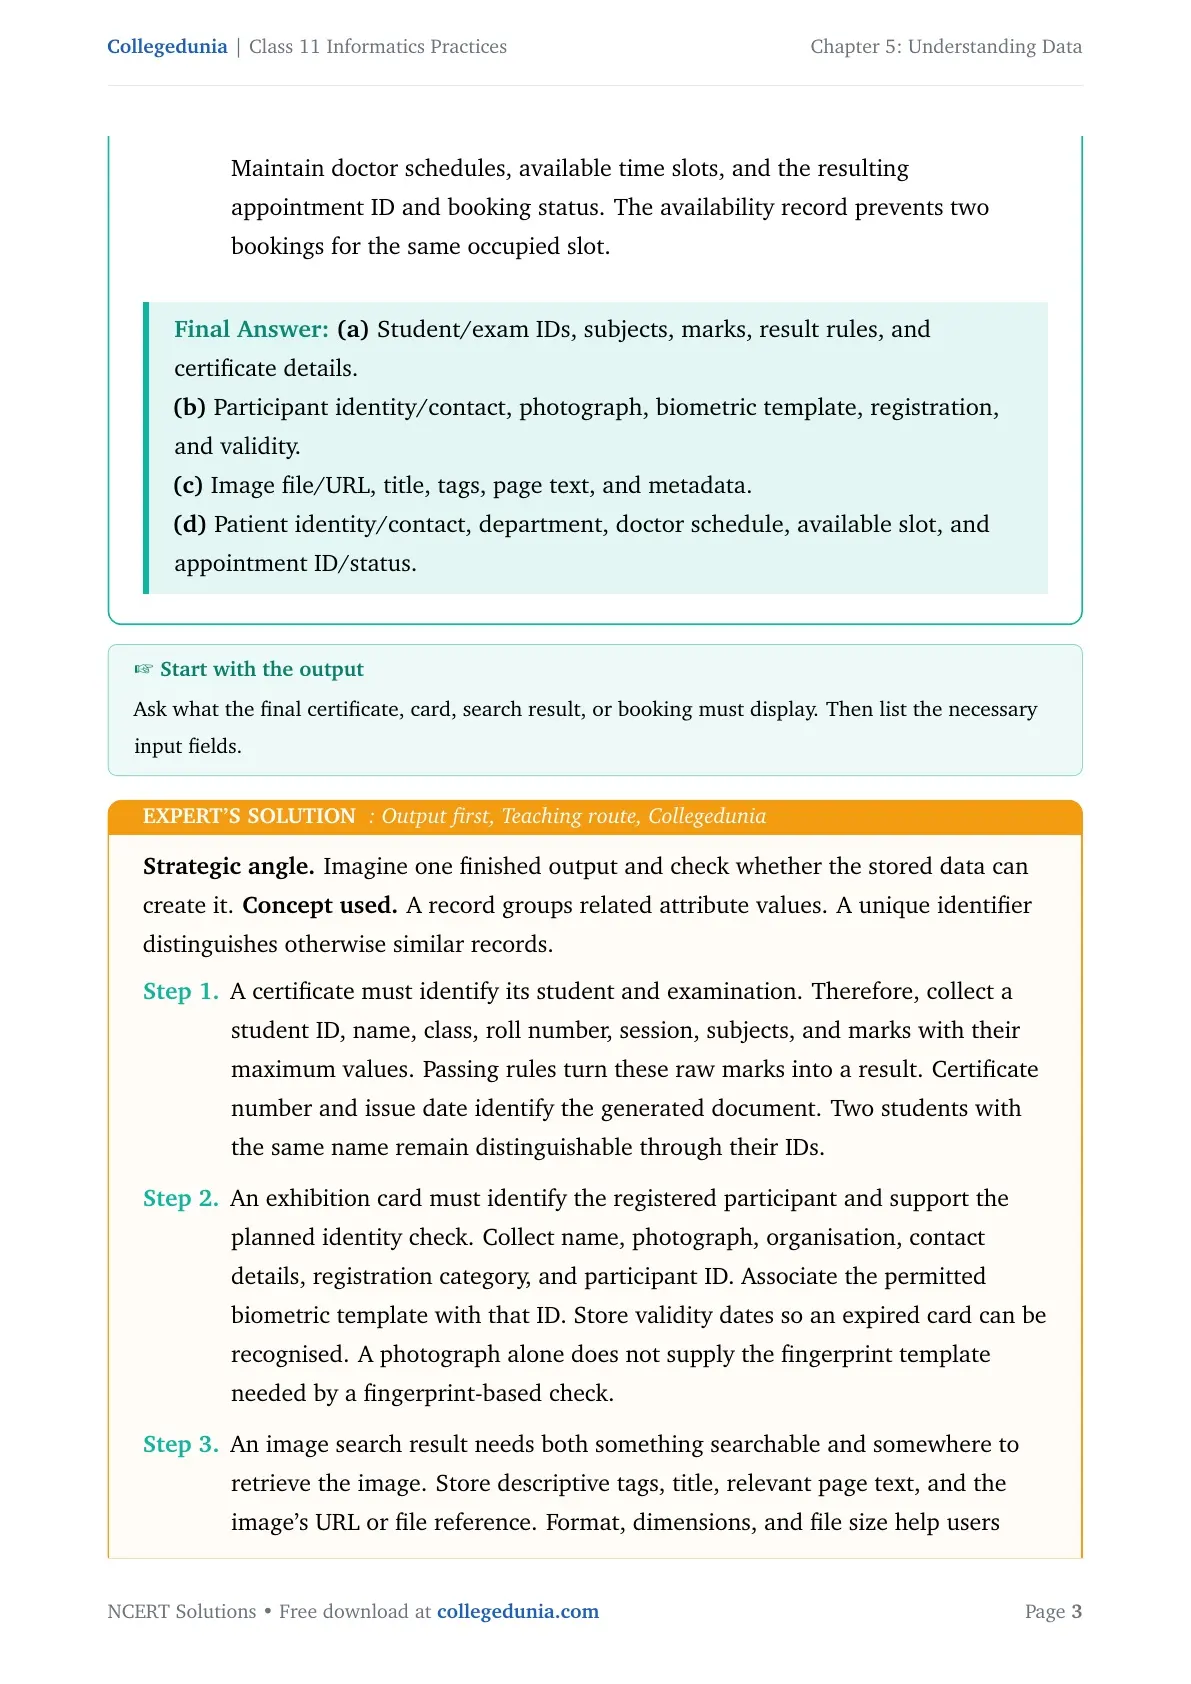
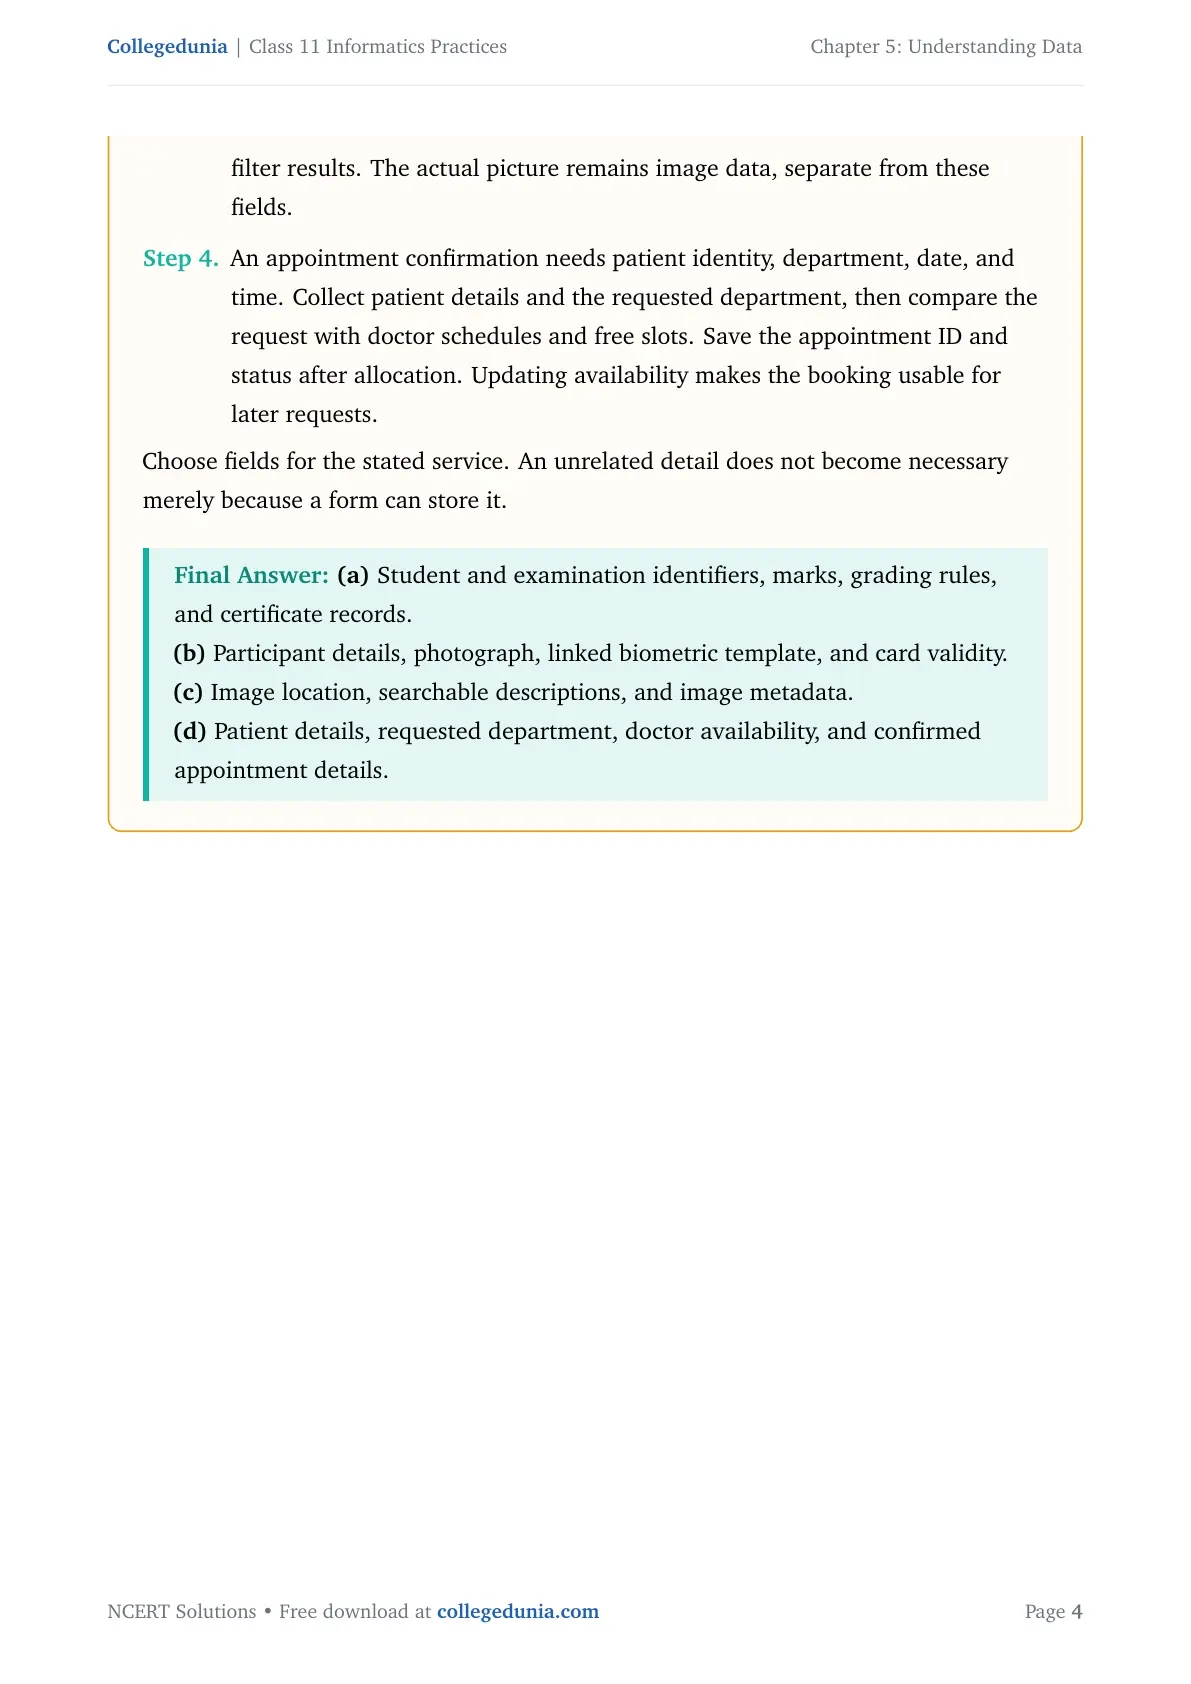
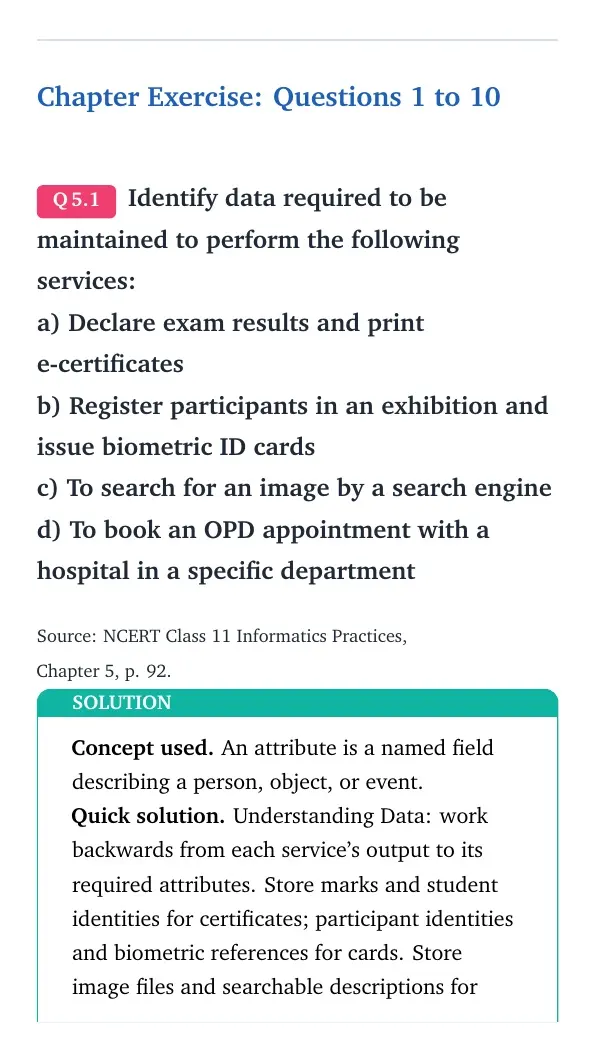
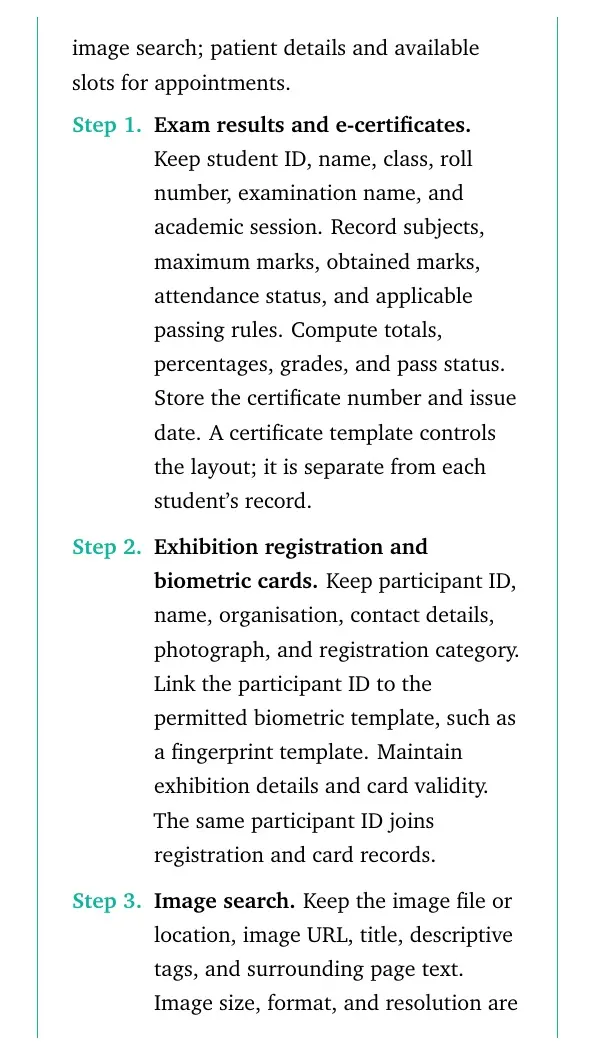
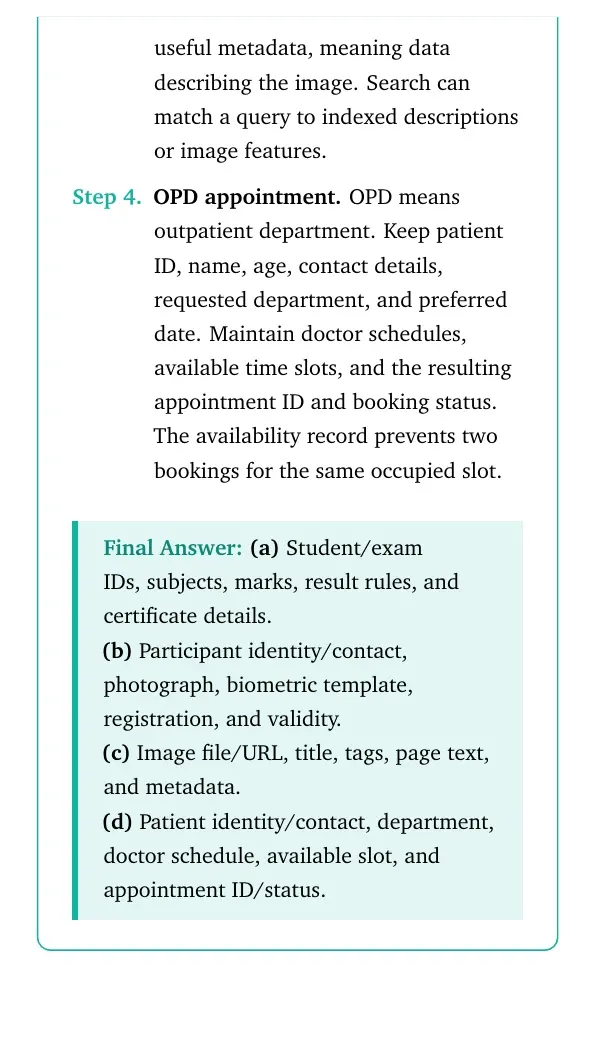
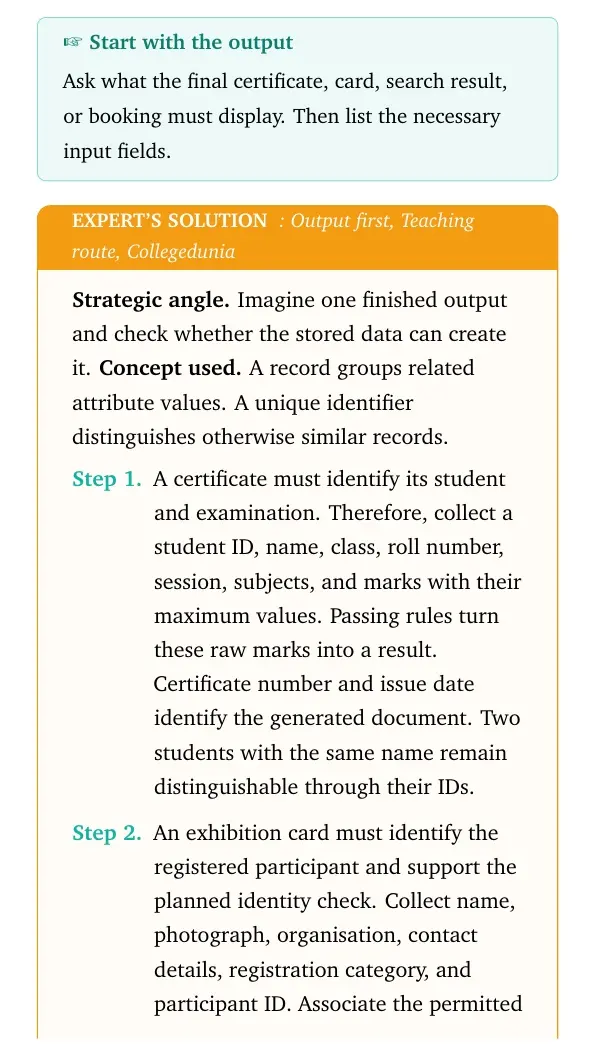
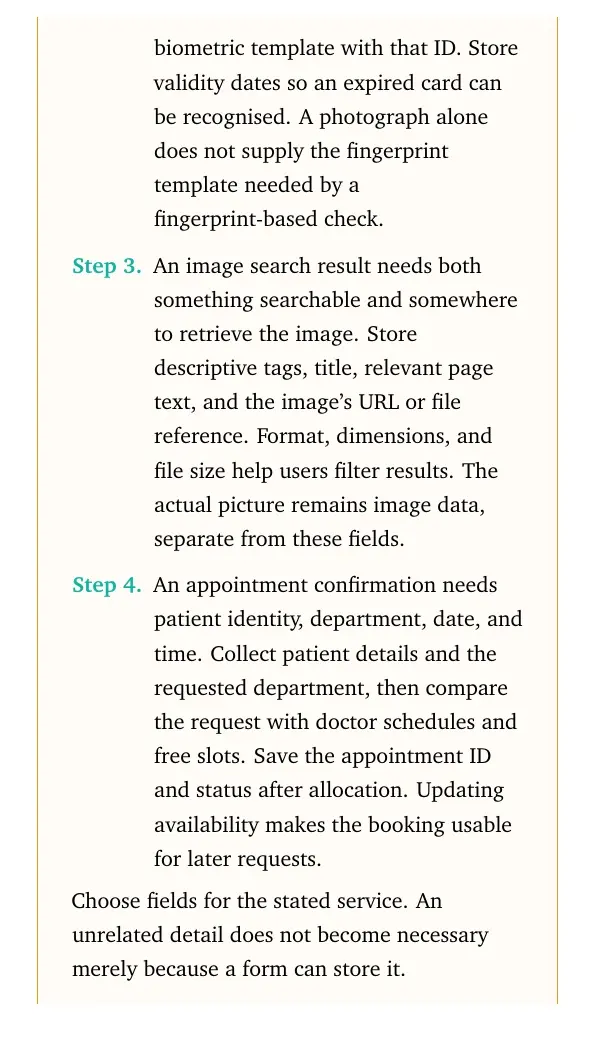
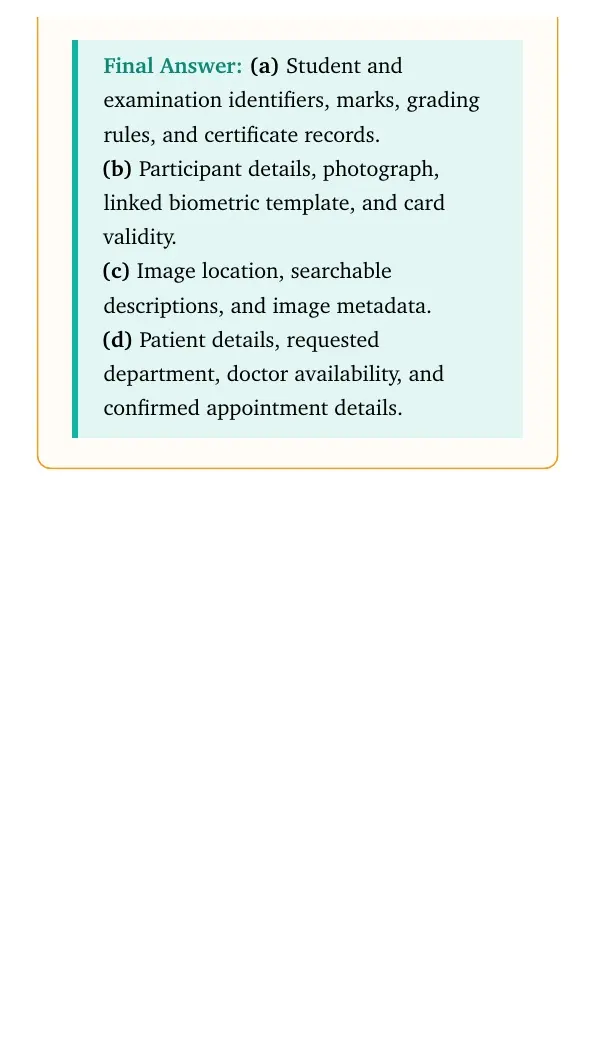
Identify data required to be maintained to perform the following services:
a) Declare exam results and print e-certificates
b) Register participants in an exhibition and issue biometric ID cards
c) To search for an image by a search engine
d) To book an OPD appointment with a hospital in a specific department
A school having 500 students wants to identify beneficiaries of the merit-cum means scholarship, achieving more than 75% for two consecutive years and having family income less than 5 lakh per annum. Briefly describe data processing steps to be taken by the to beneficial prepare the list of school.
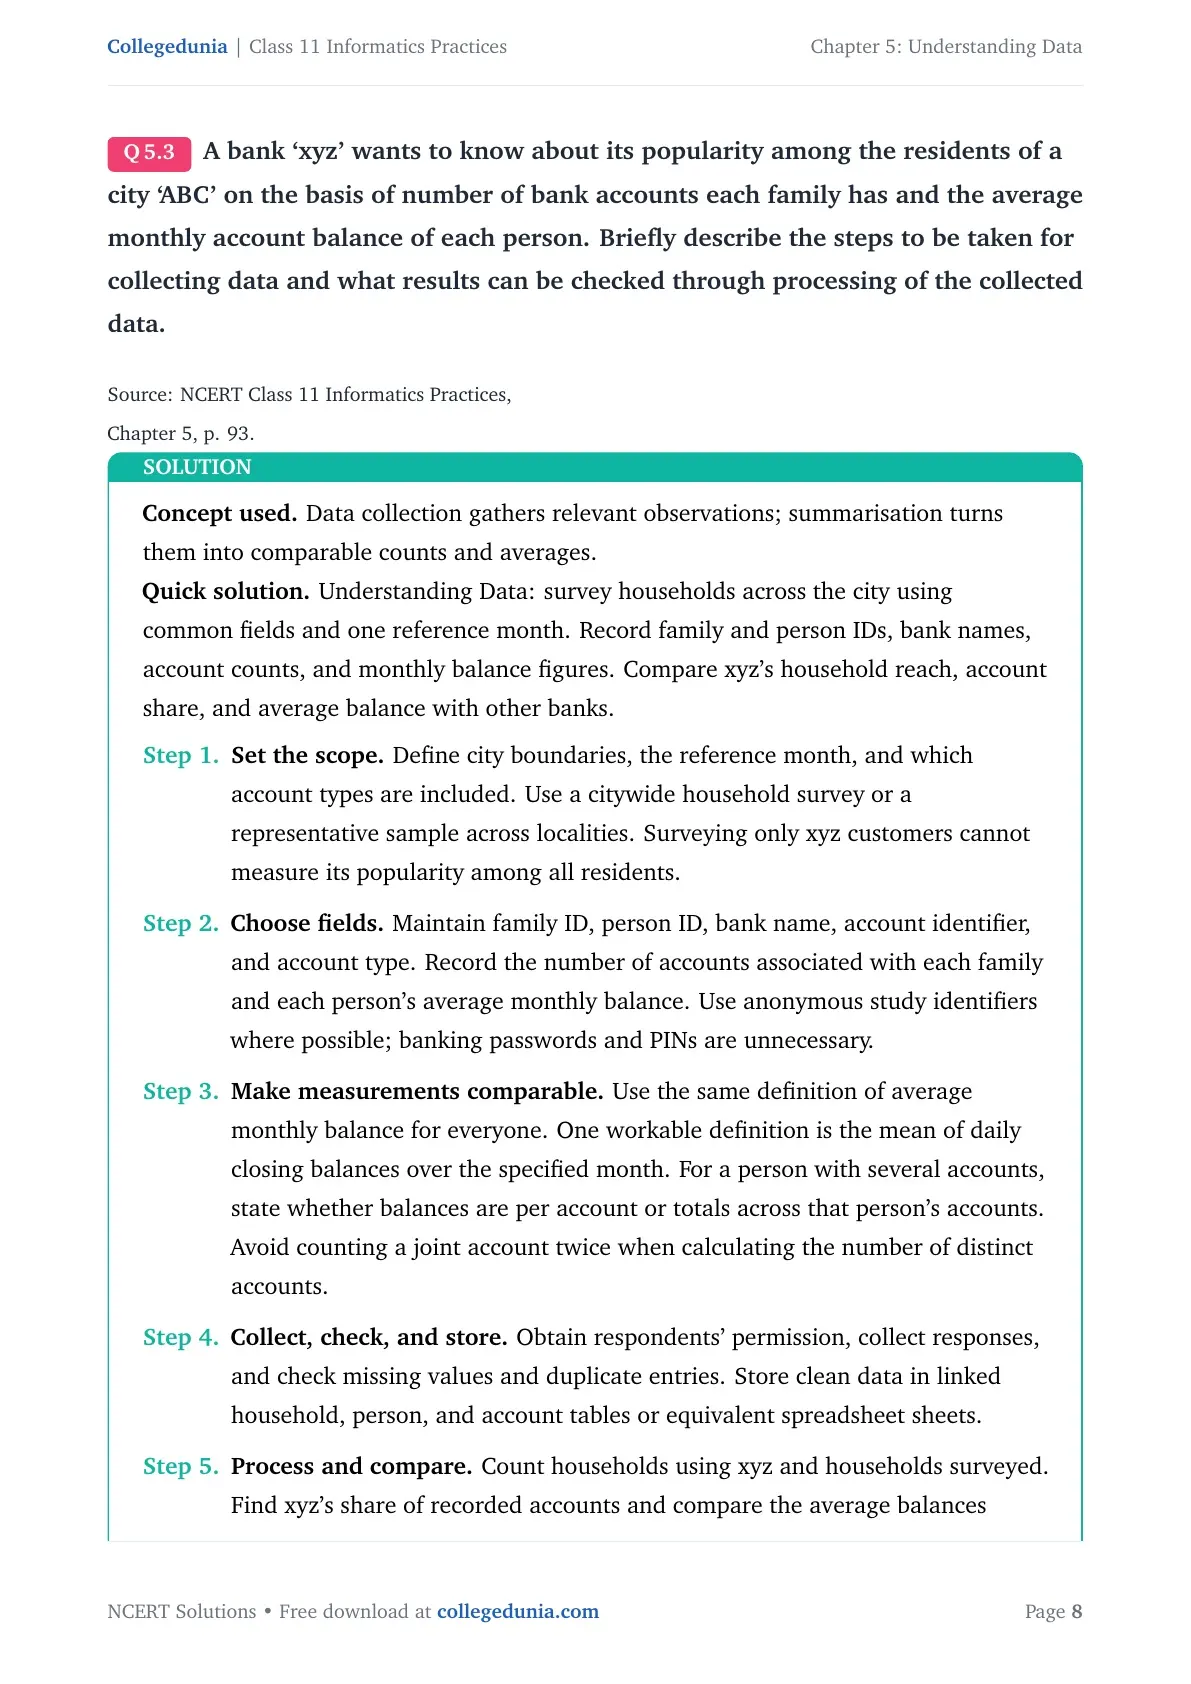
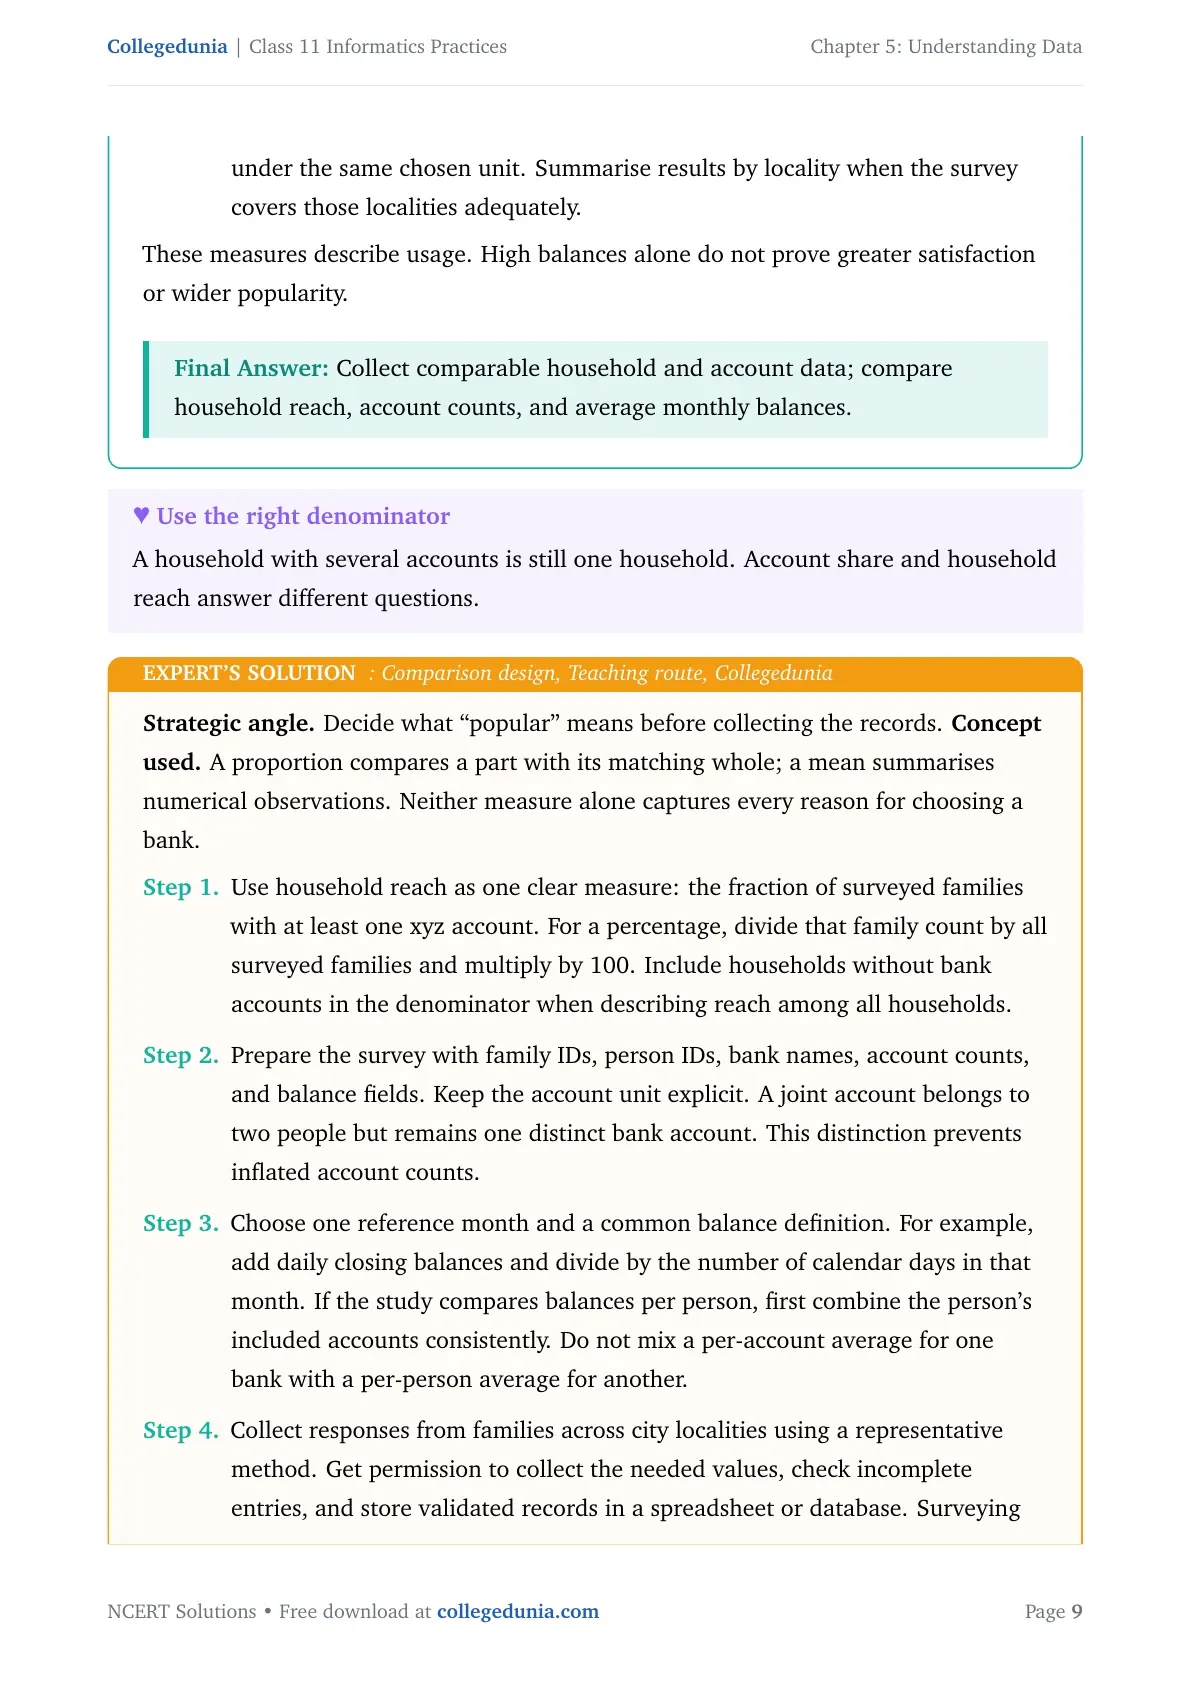
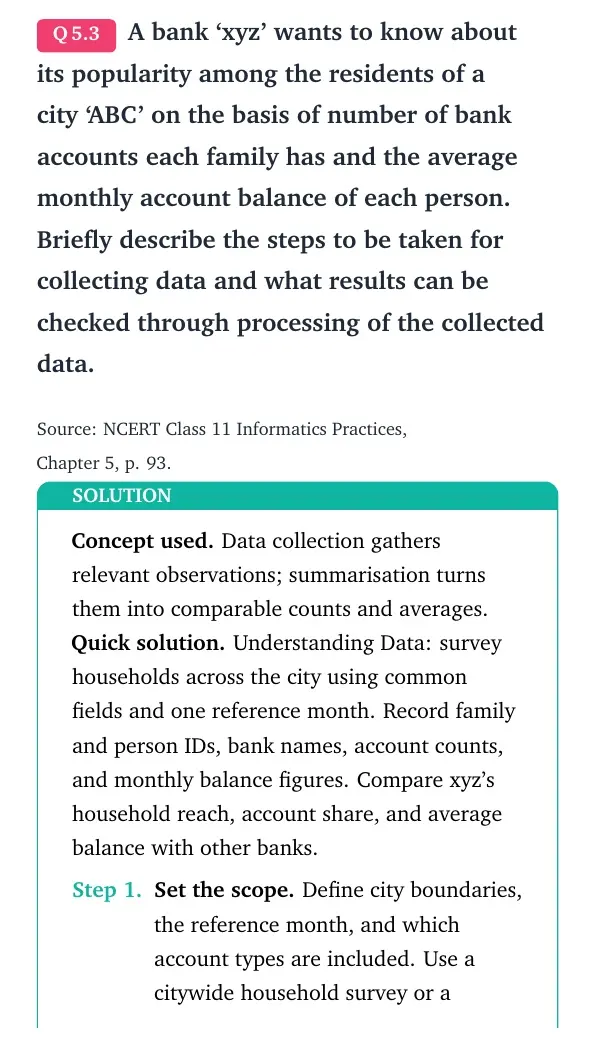
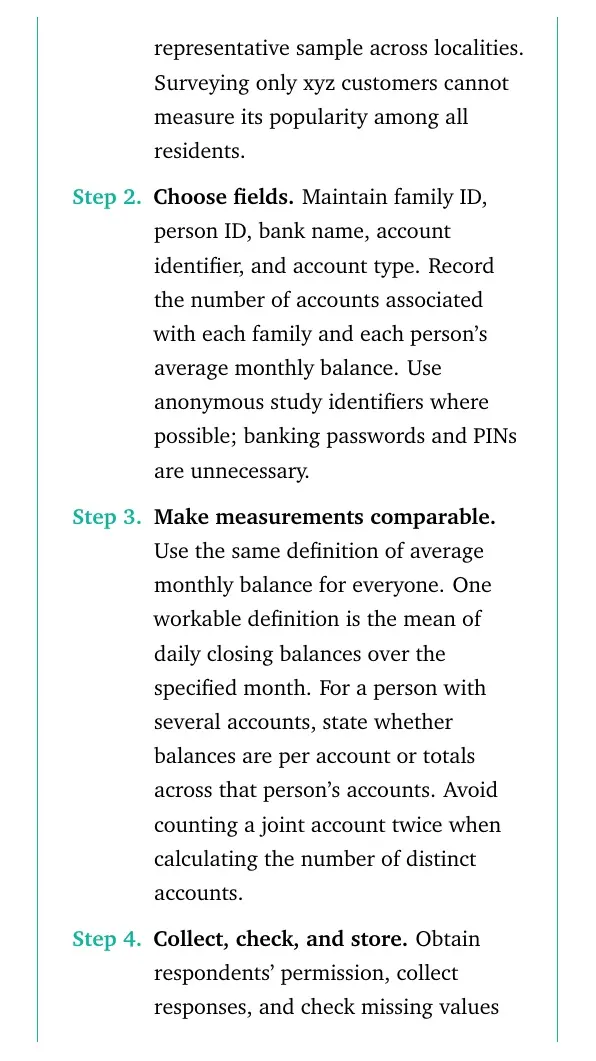
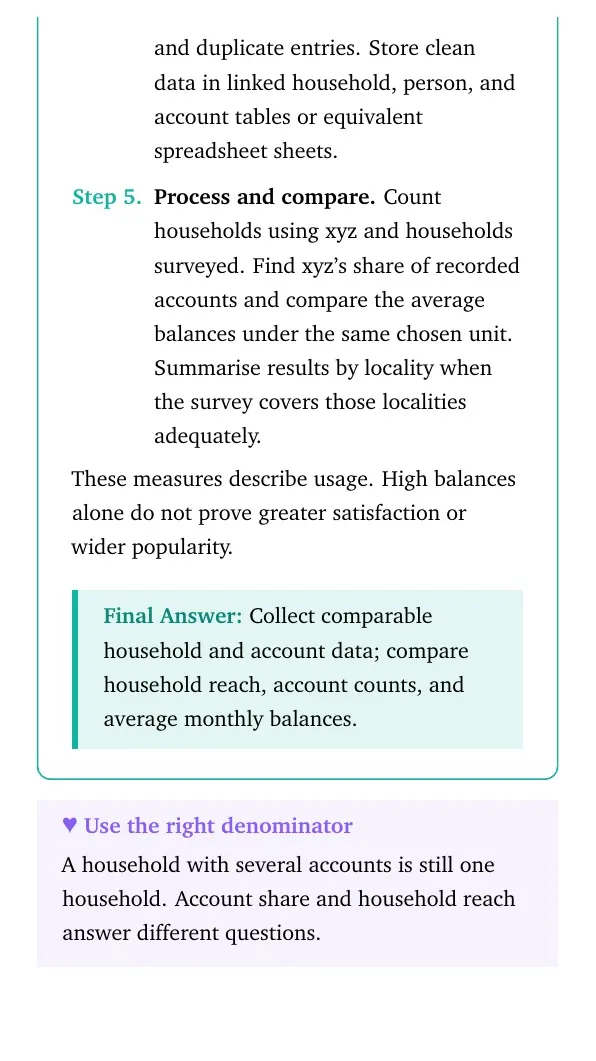
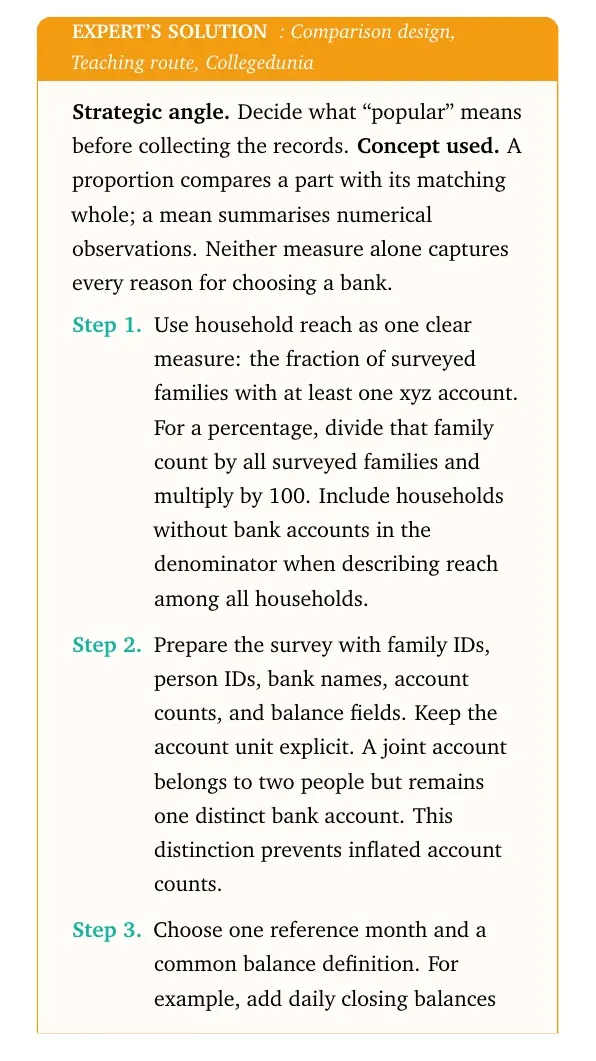
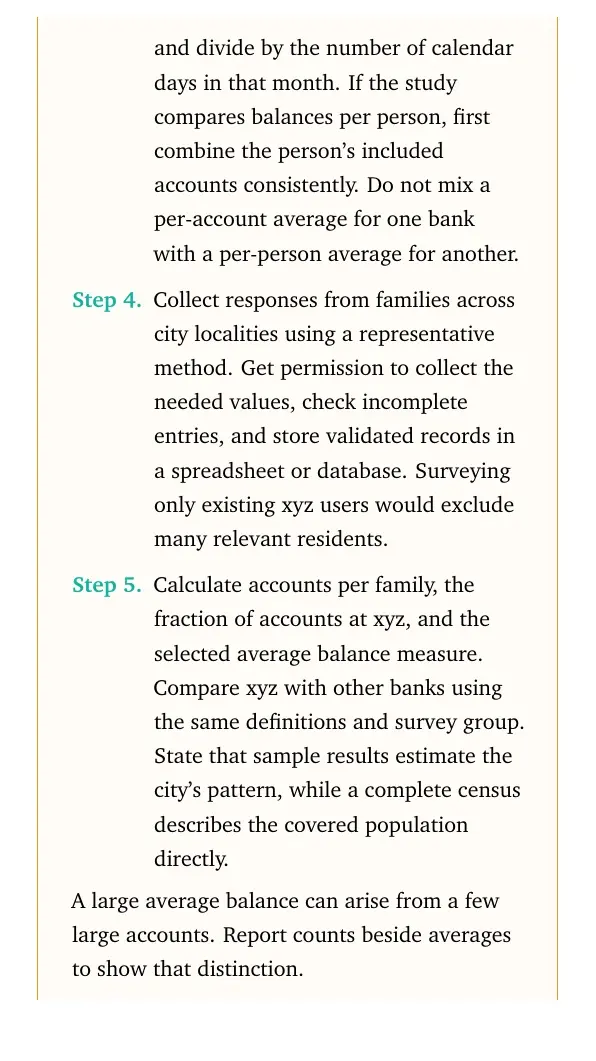
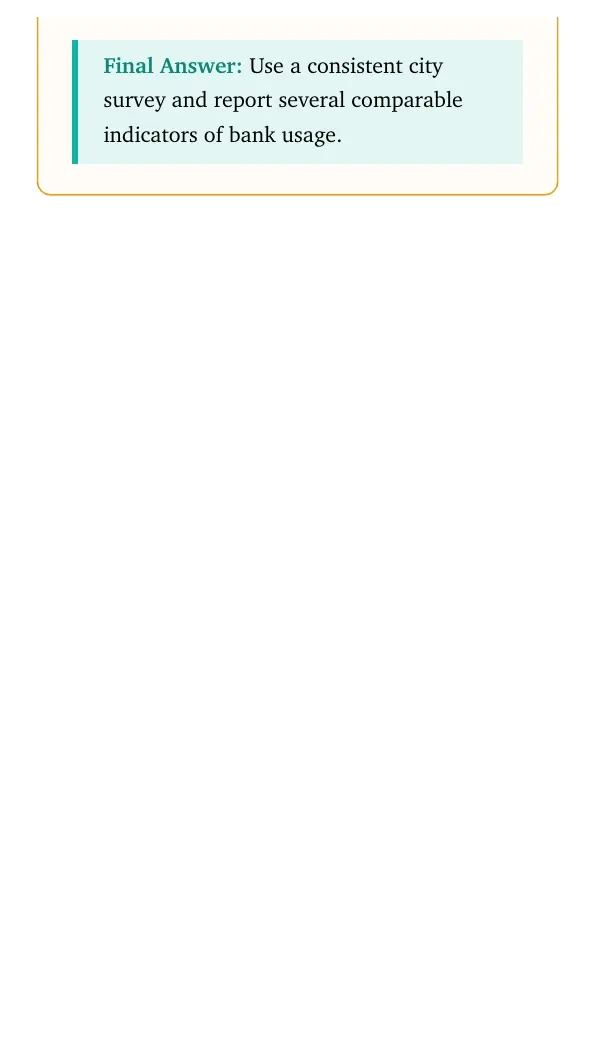
A bank `xyz' wants to know about its popularity among the residents of a city `ABC' on the basis of number of bank accounts each family has and the average monthly account balance of each person. Briefly describe the steps to be taken for collecting data and what results can be checked through processing of the collected data.
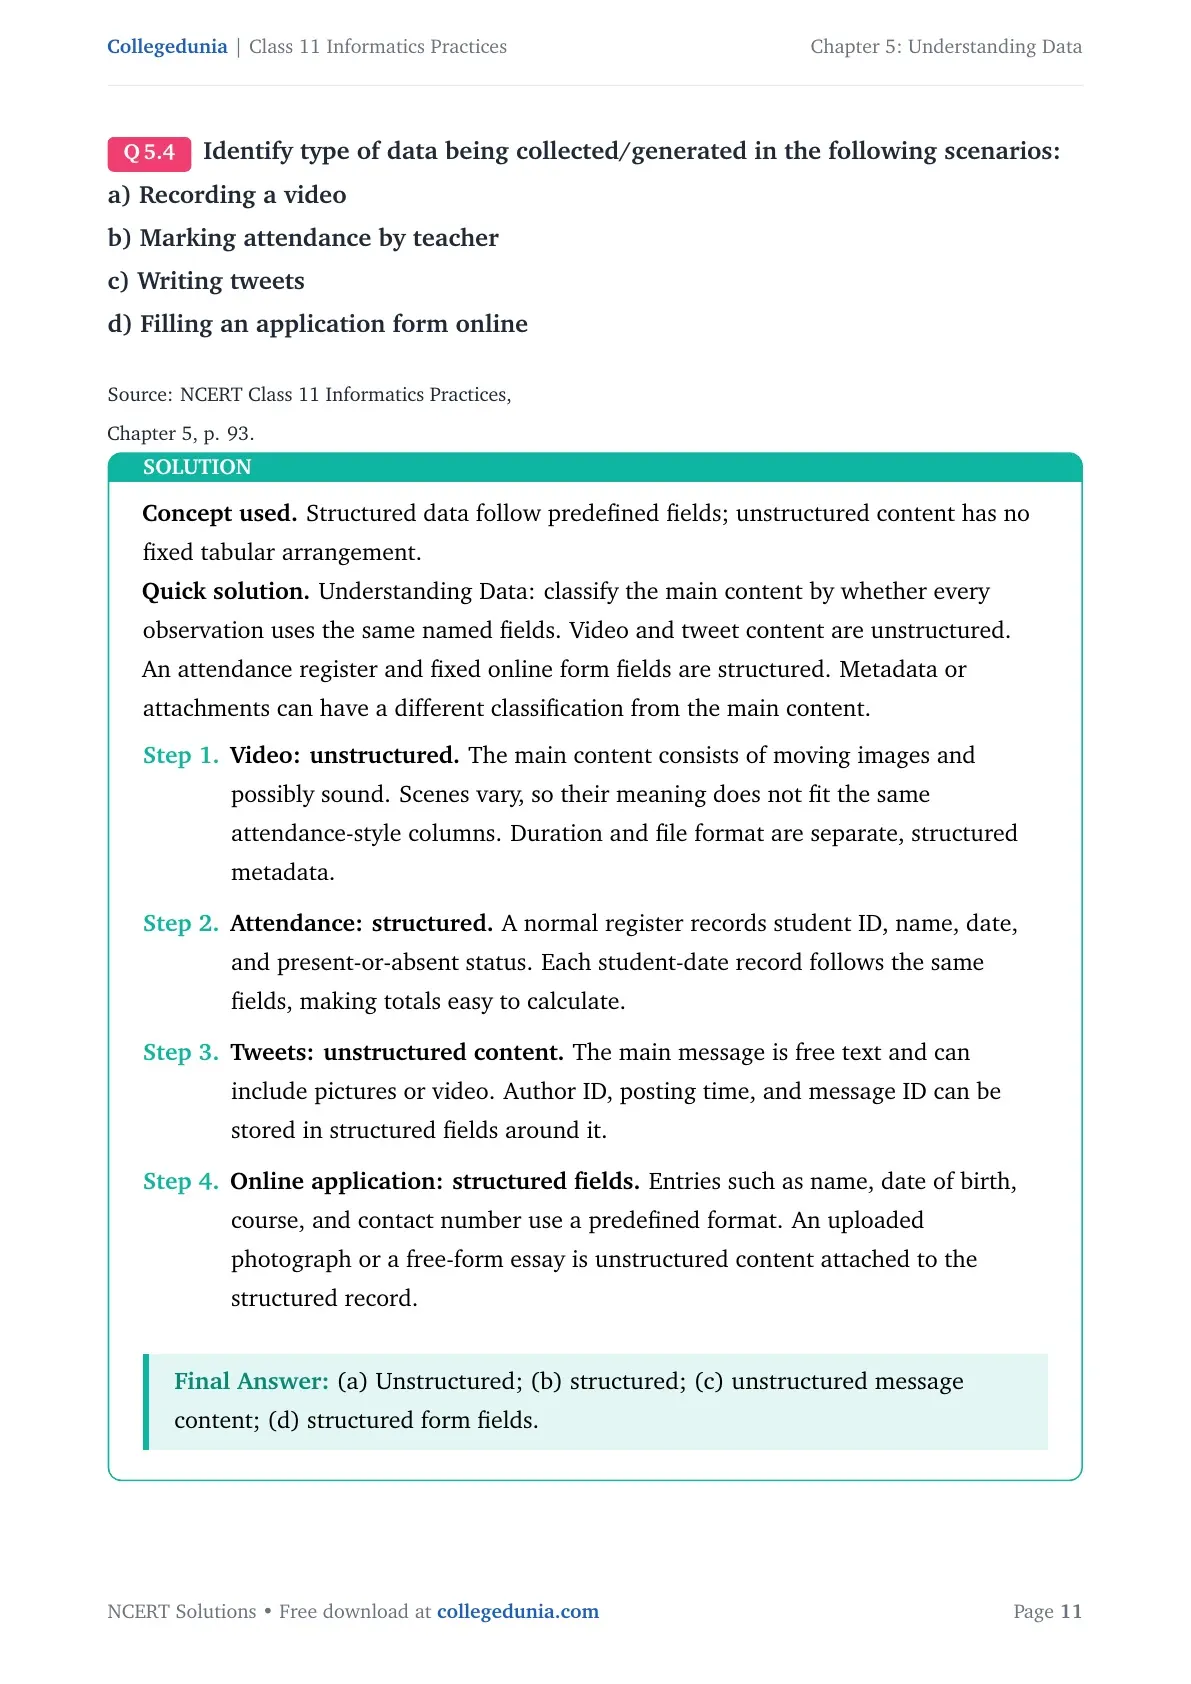
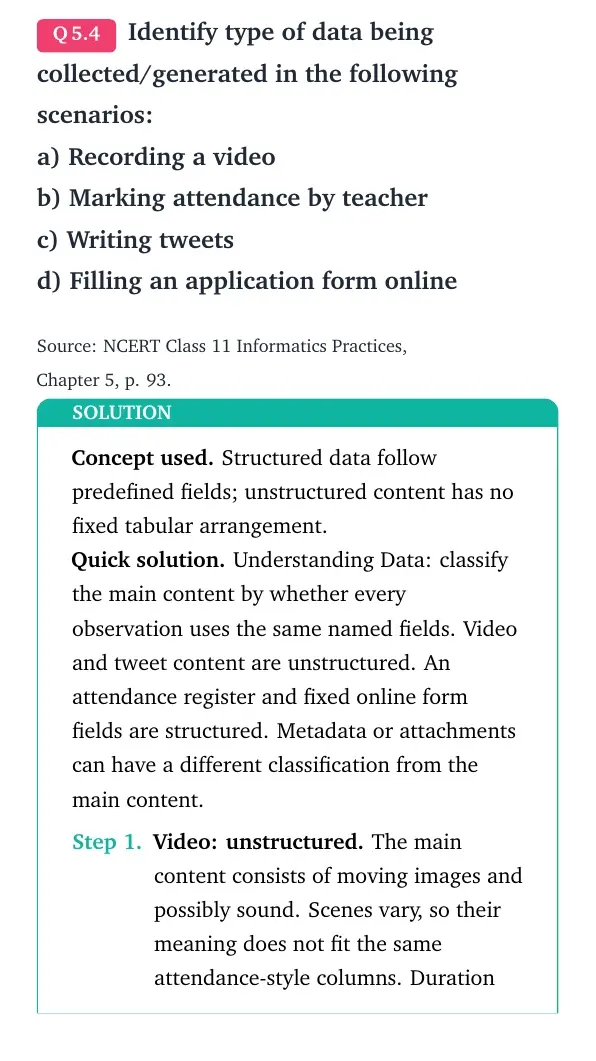
Identify type of data being collected/generated in the following scenarios:
a) Recording a video
b) Marking attendance by teacher
c) Writing tweets
d) Filling an application form online
Consider the temperature (in Celsius) of 7 days of a week as 34, 34, 27, 28, 27, 34, 34.
Identify the appropriate statistical technique to be used to calculate the following:
a) Find the average temperature.
b) Find the temperature Range of that week.
c) Find the standard deviation temperature.
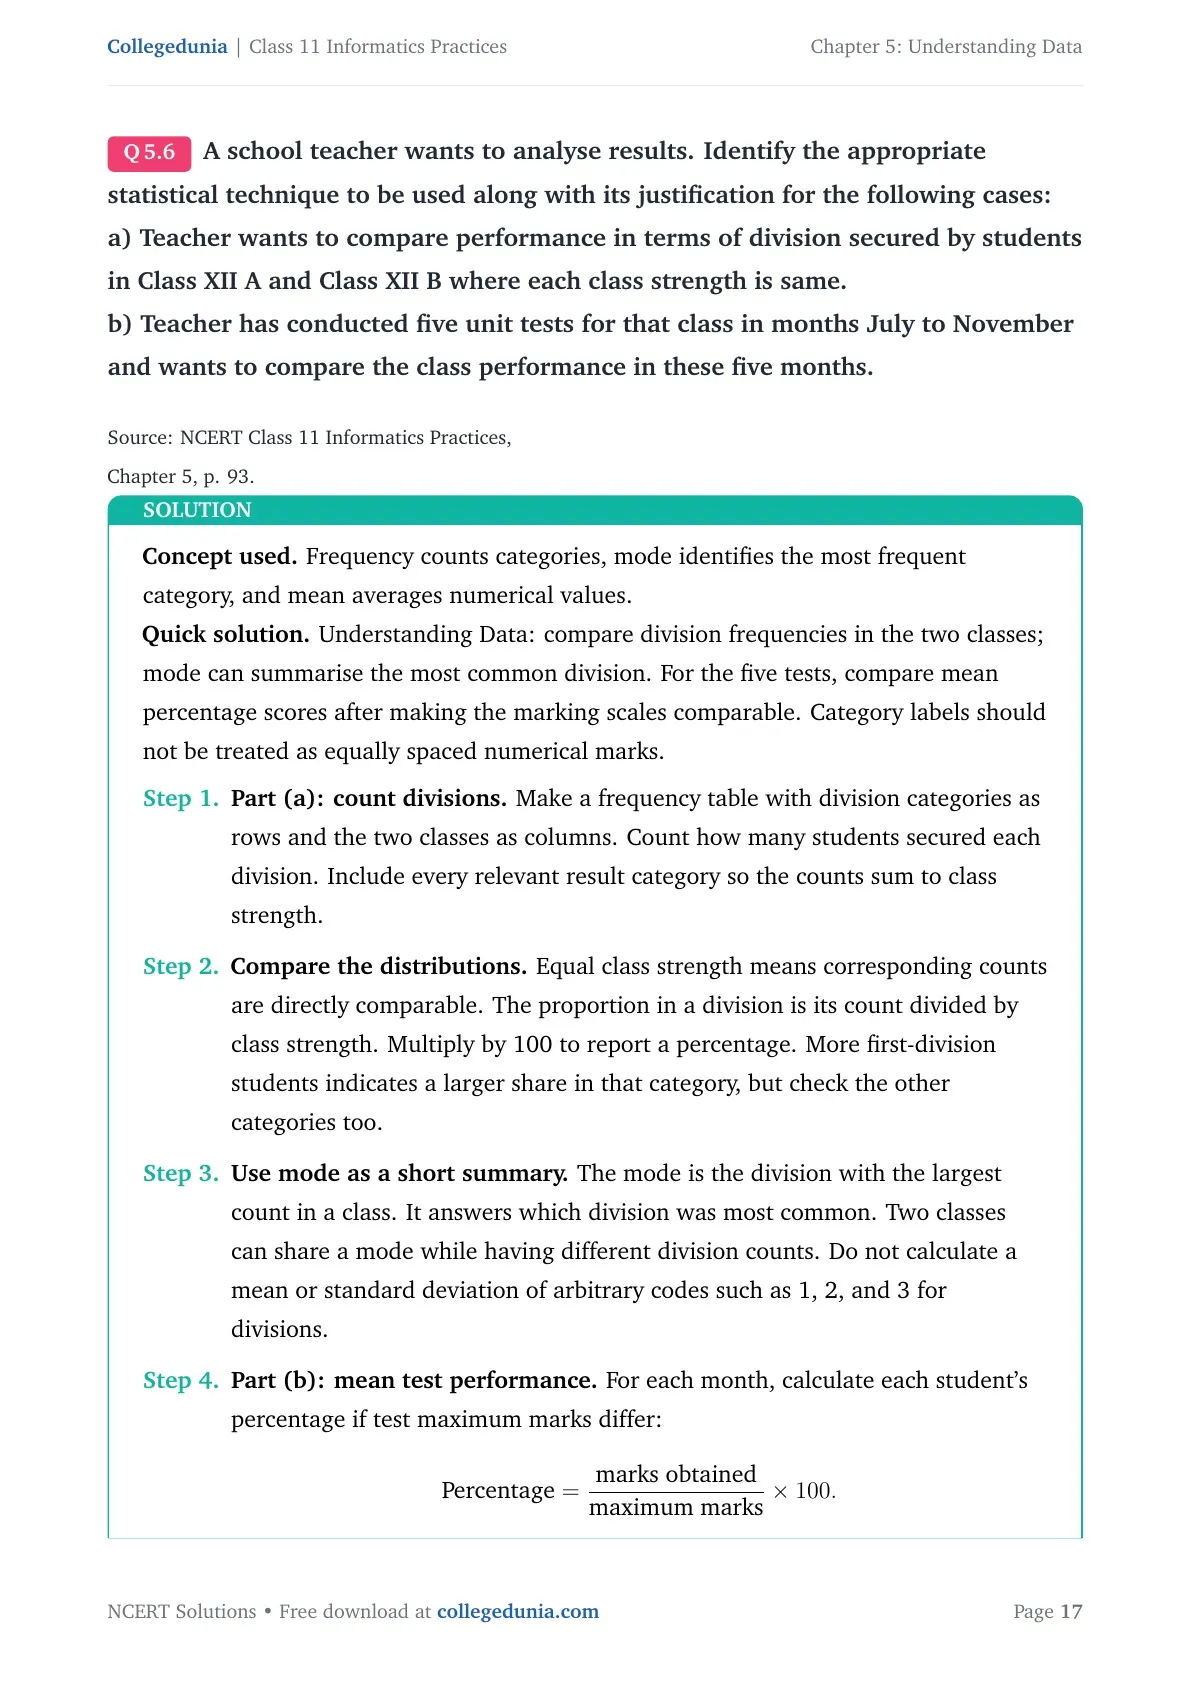
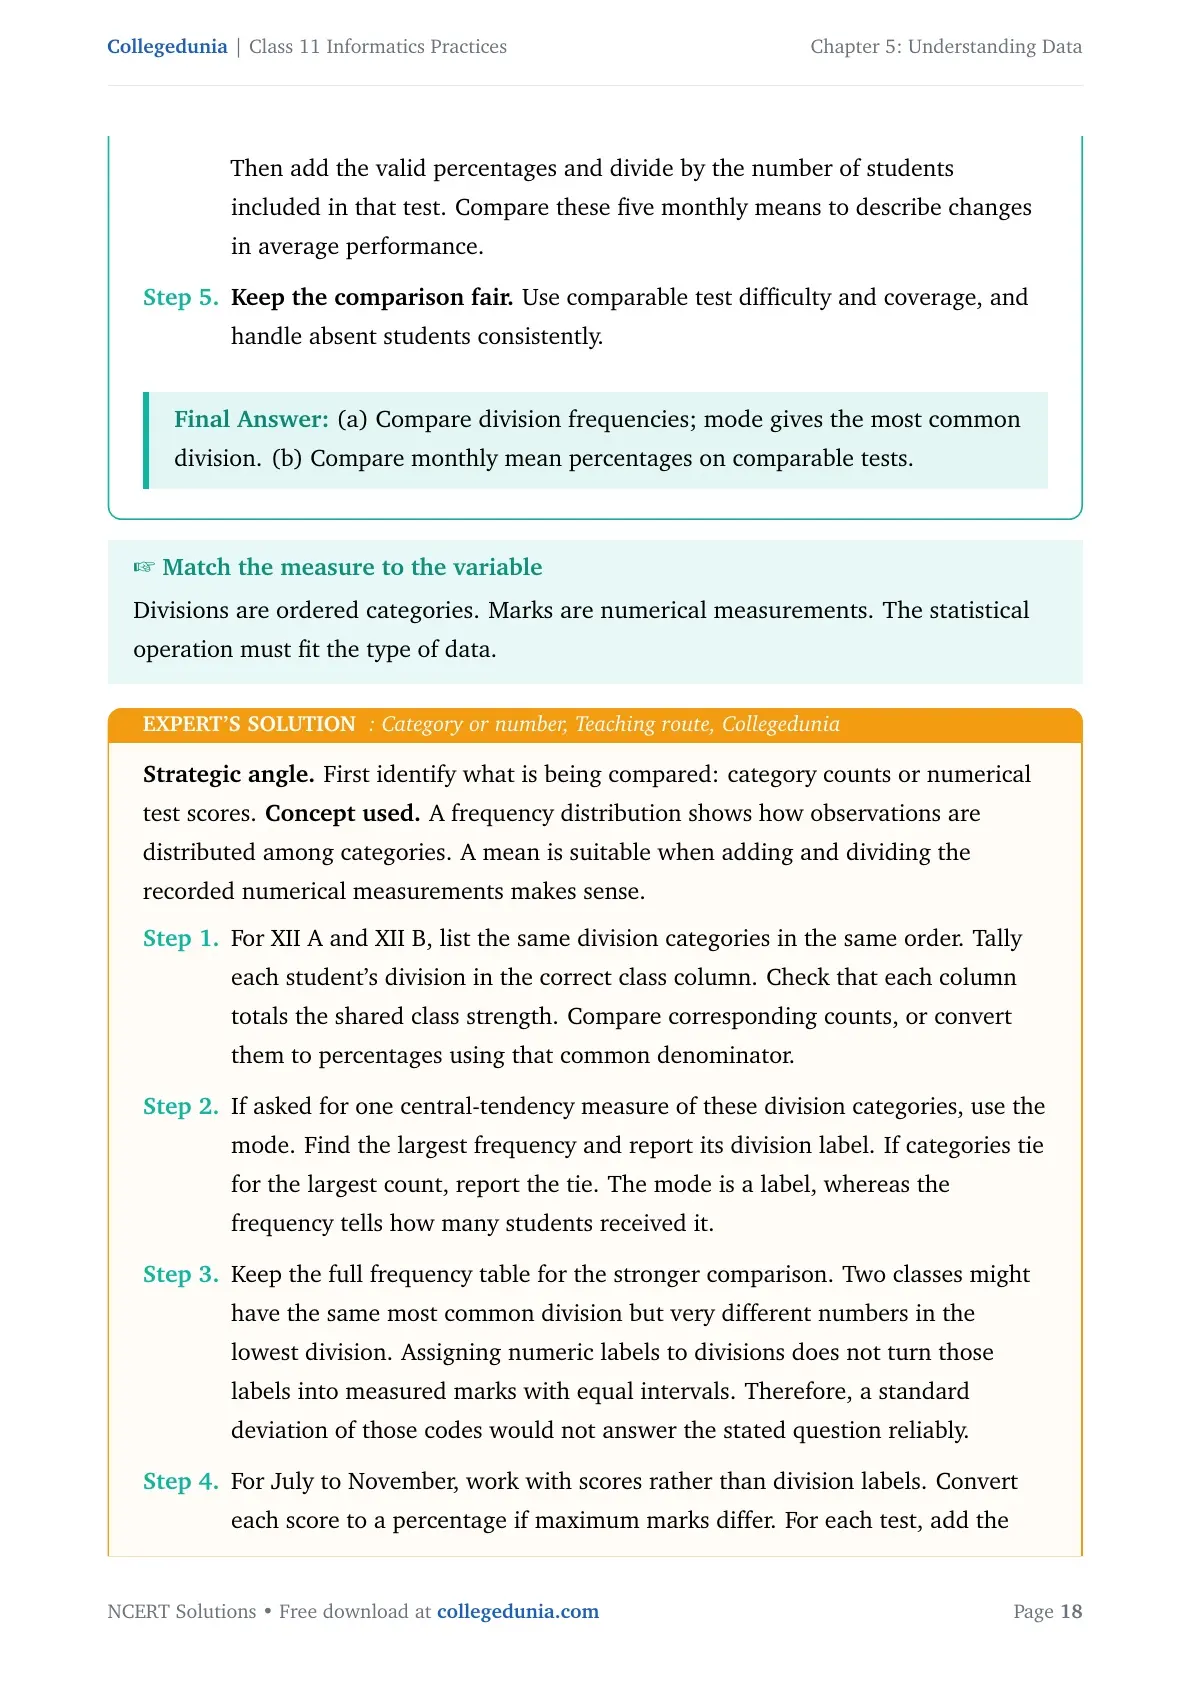
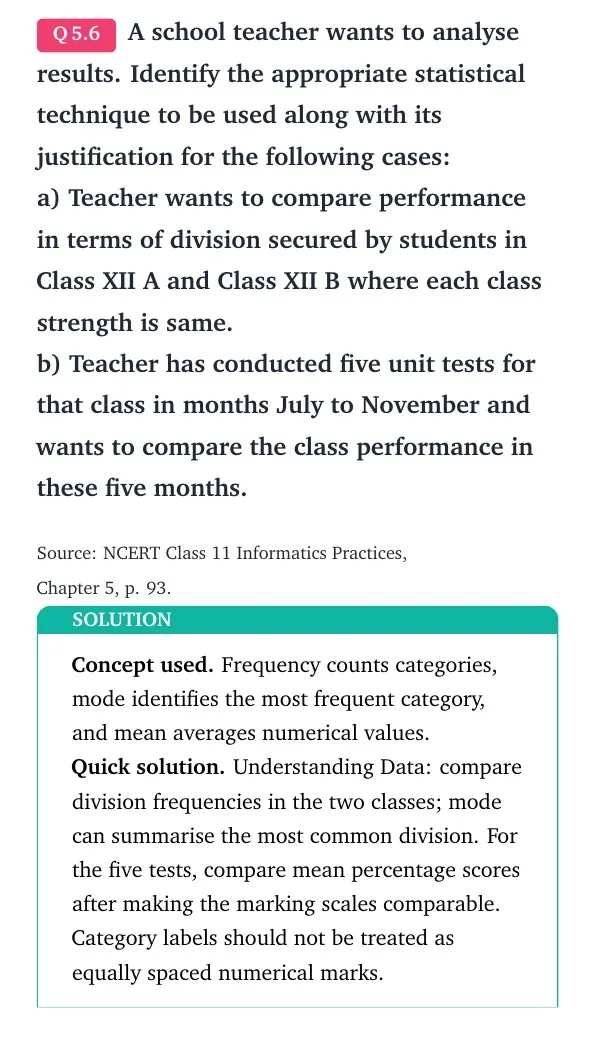
A school teacher wants to analyse results. Identify the appropriate statistical technique to be used along with its justification for the following cases:
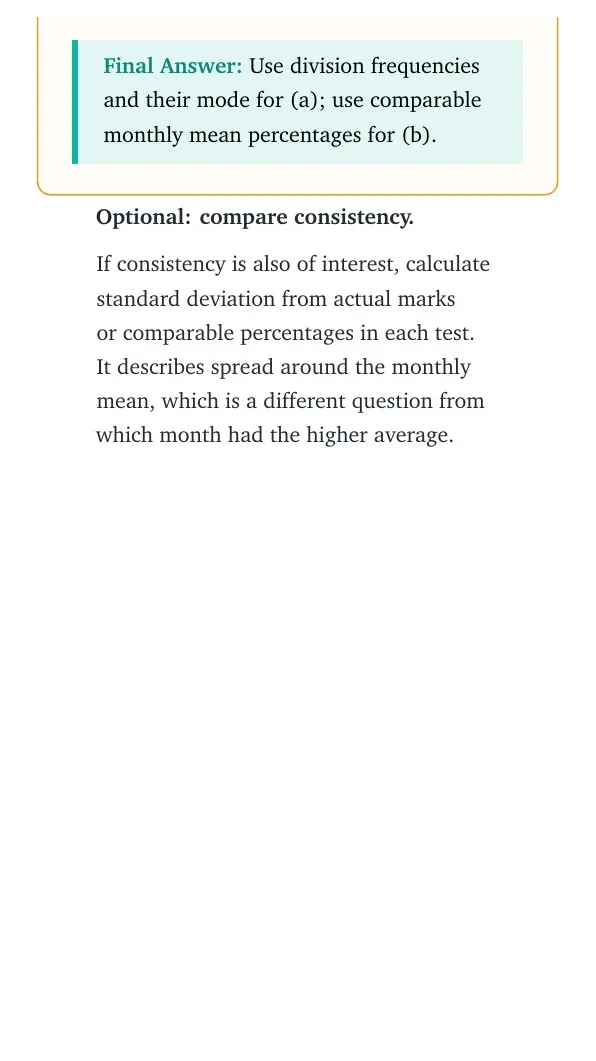
a) Teacher wants to compare performance in terms of division secured by students in Class XII A and Class XII B where each class strength is same.
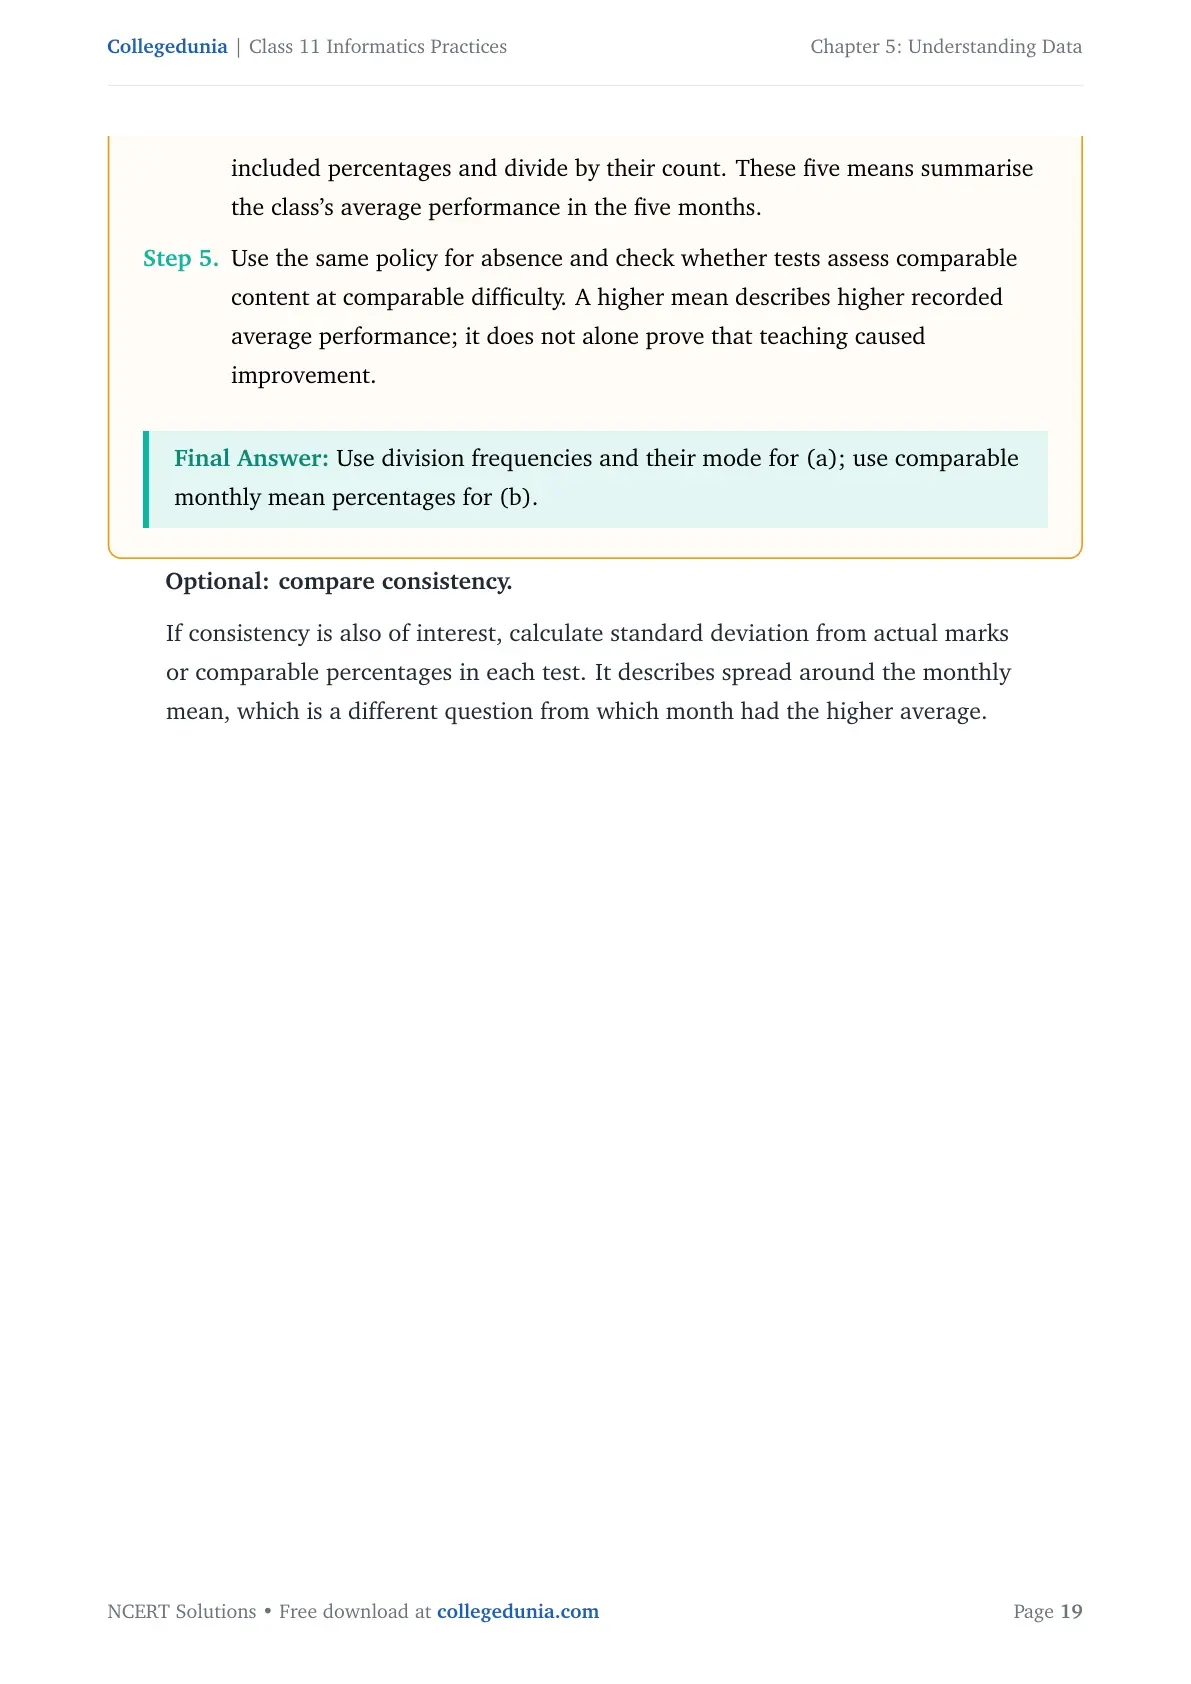
b) Teacher has conducted five unit tests for that class in months July to November and wants to compare the class performance in these five months.
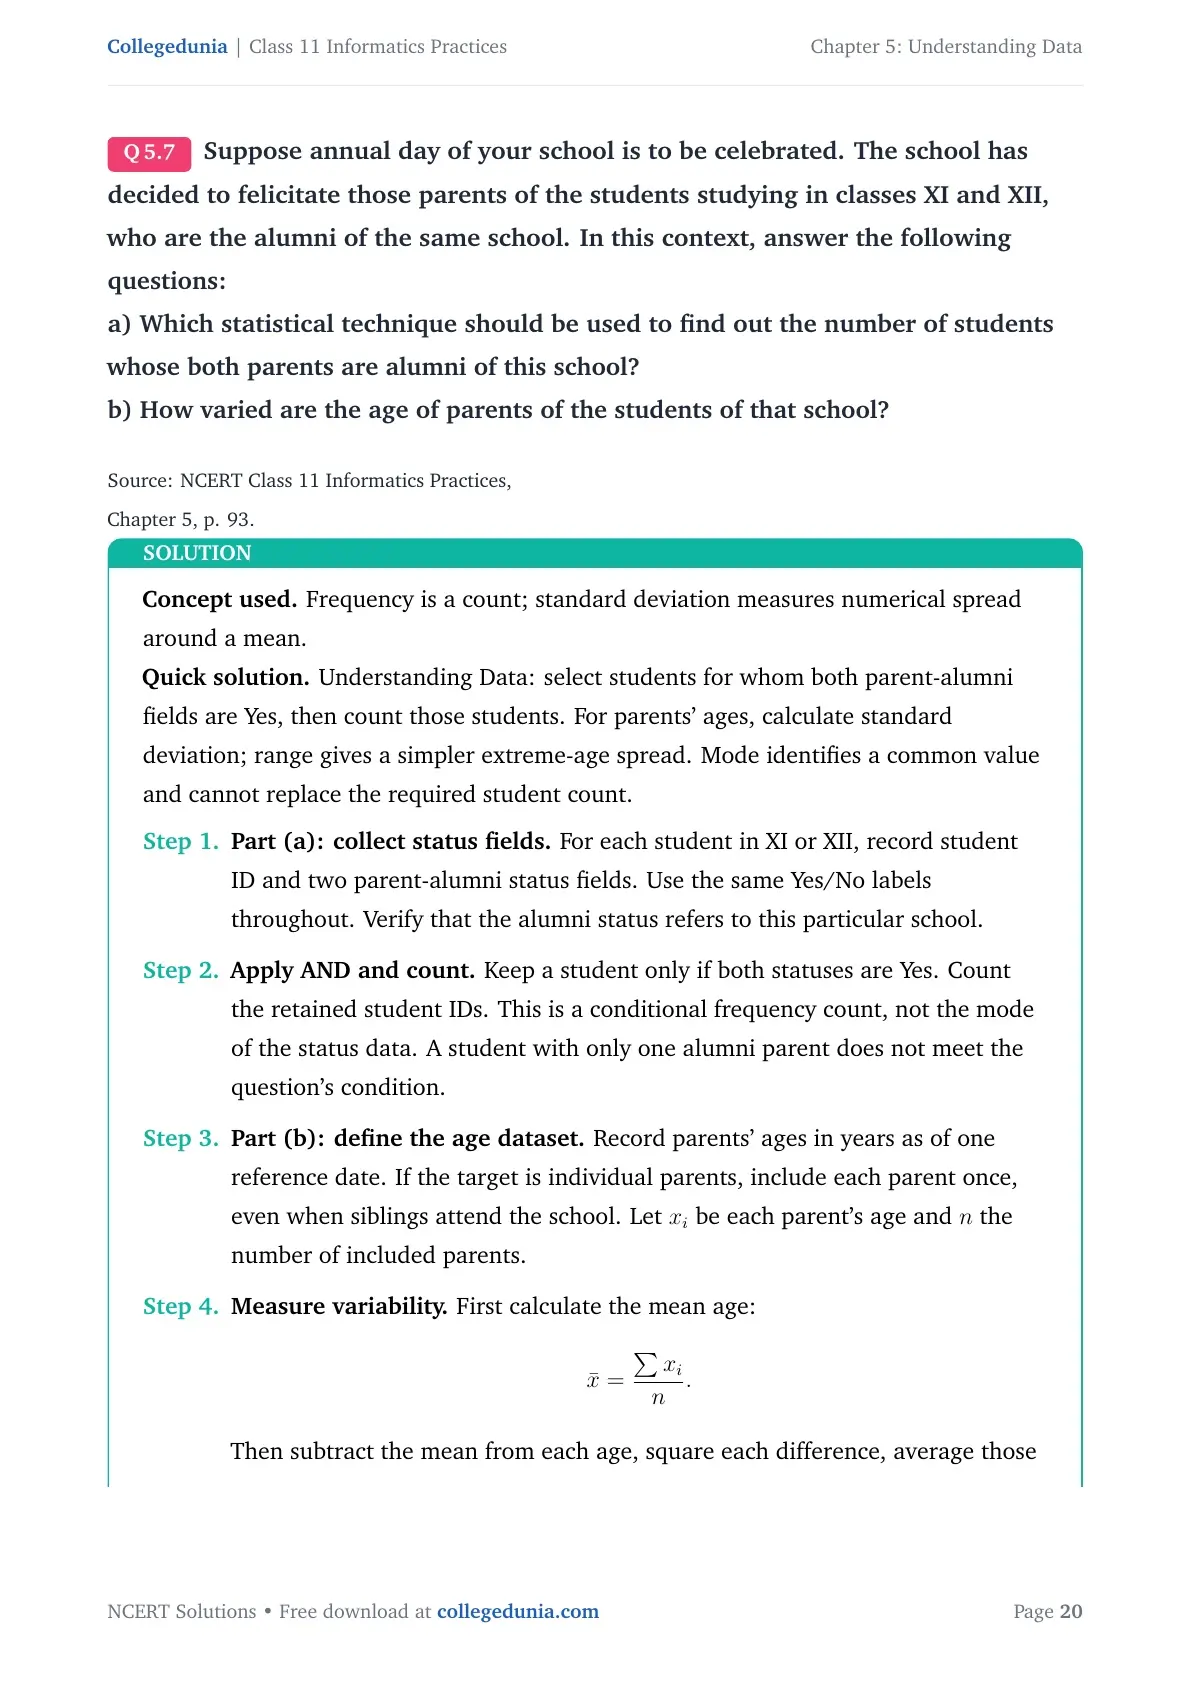
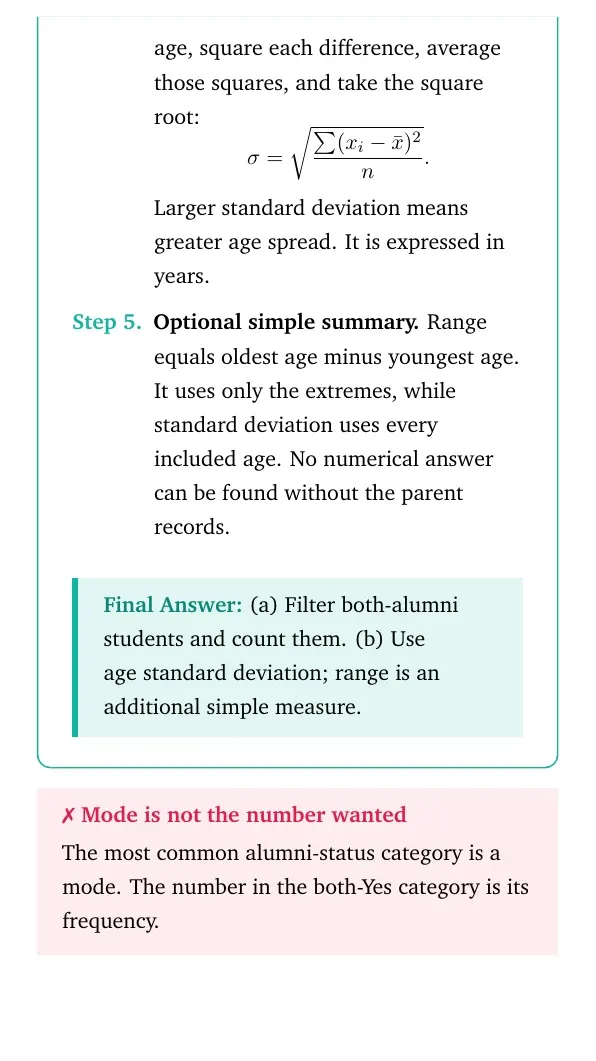
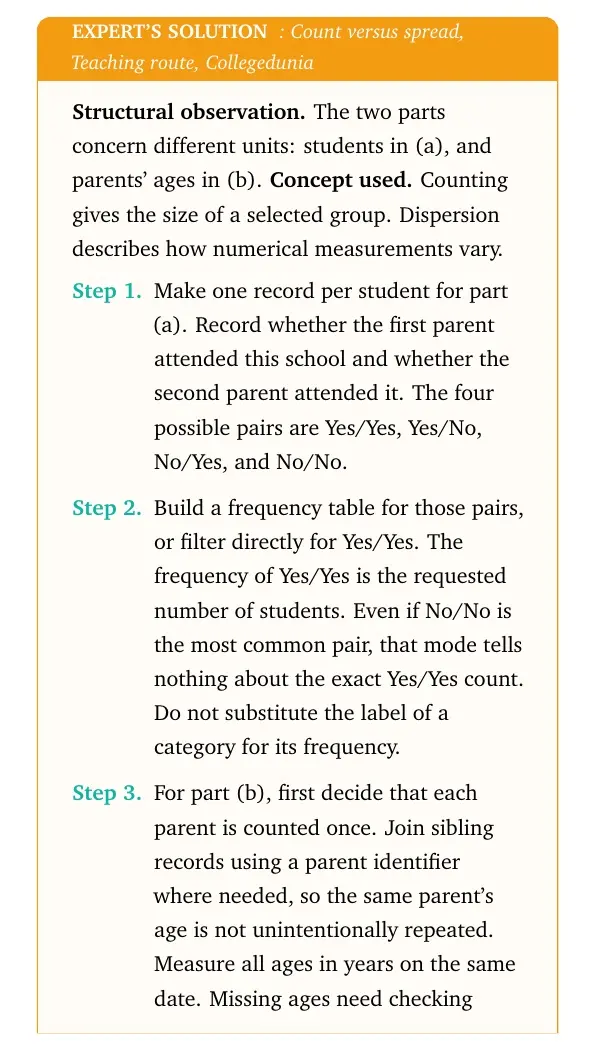
Suppose annual day of your school is to be celebrated. The school has decided to felicitate those parents of the students studying in classes XI and XII, who are the alumni of the same school. In this context, answer the following questions:
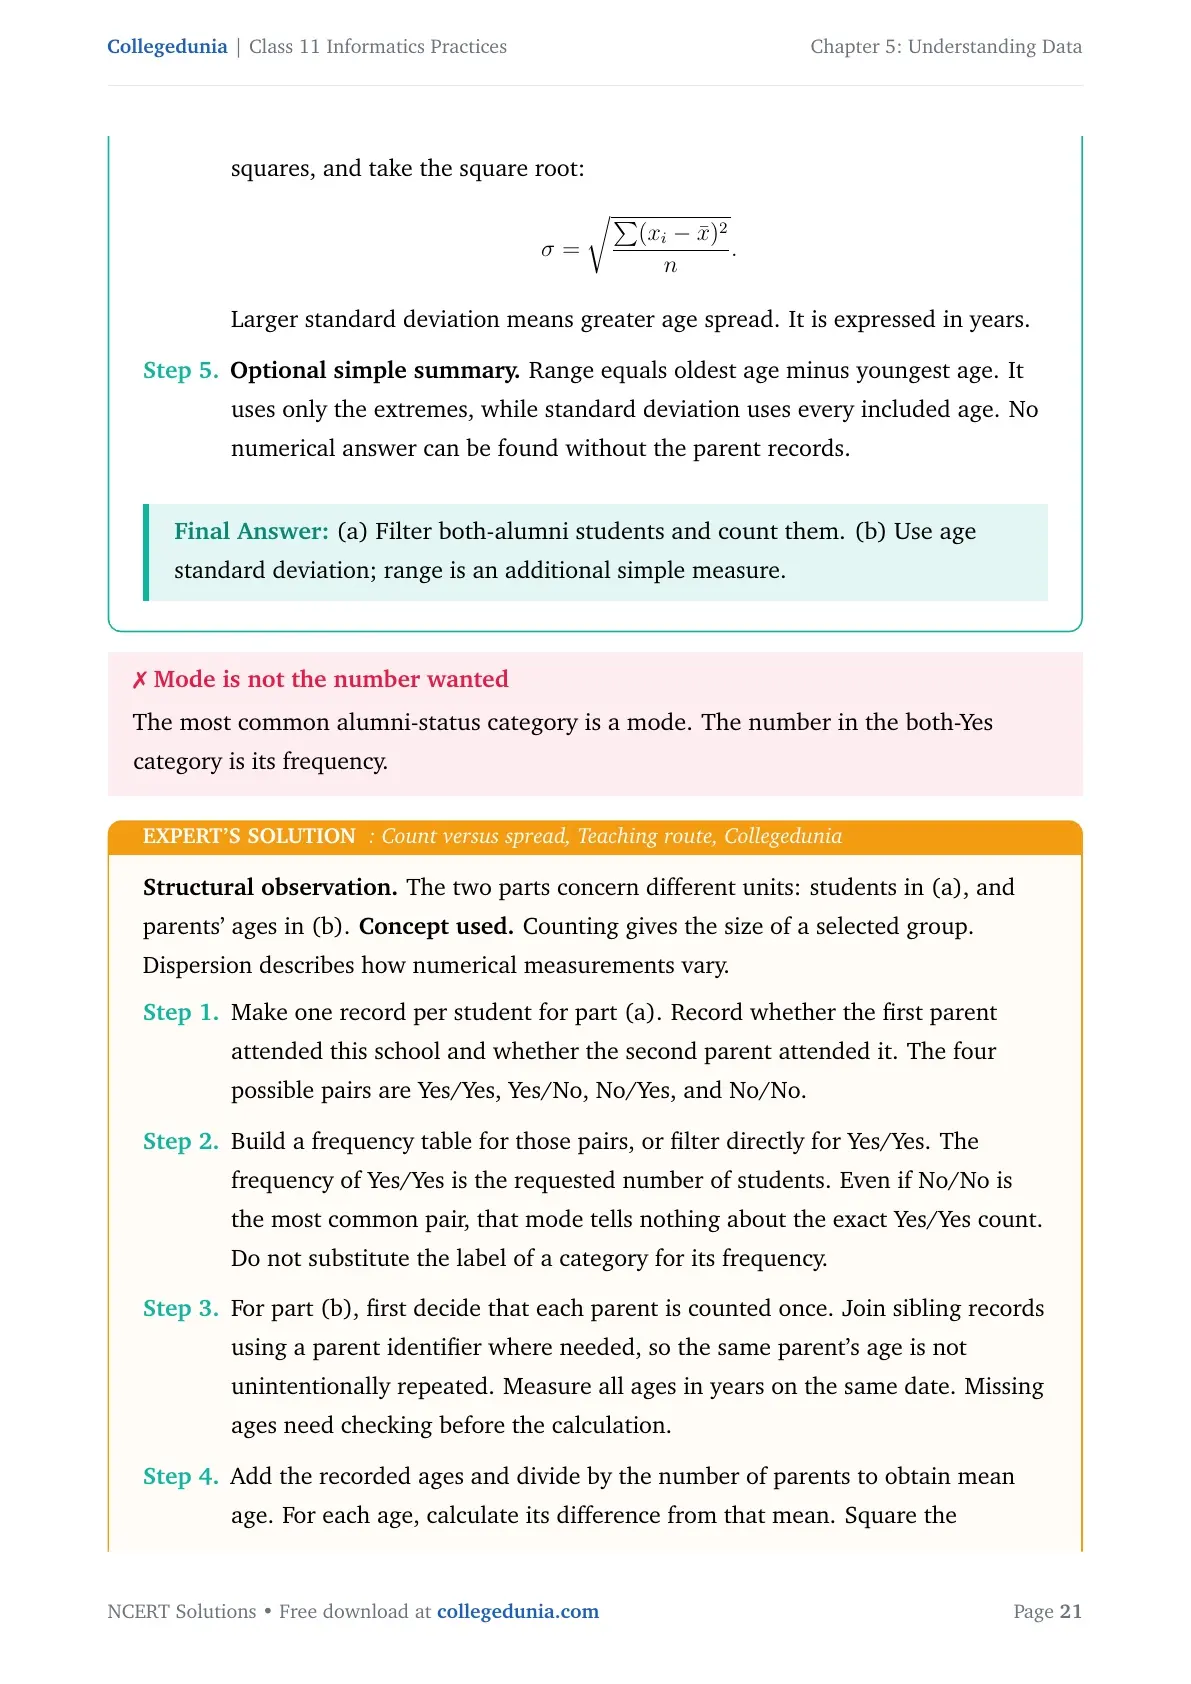
a) Which statistical technique should be used to find out the number of students whose both parents are alumni of this school?
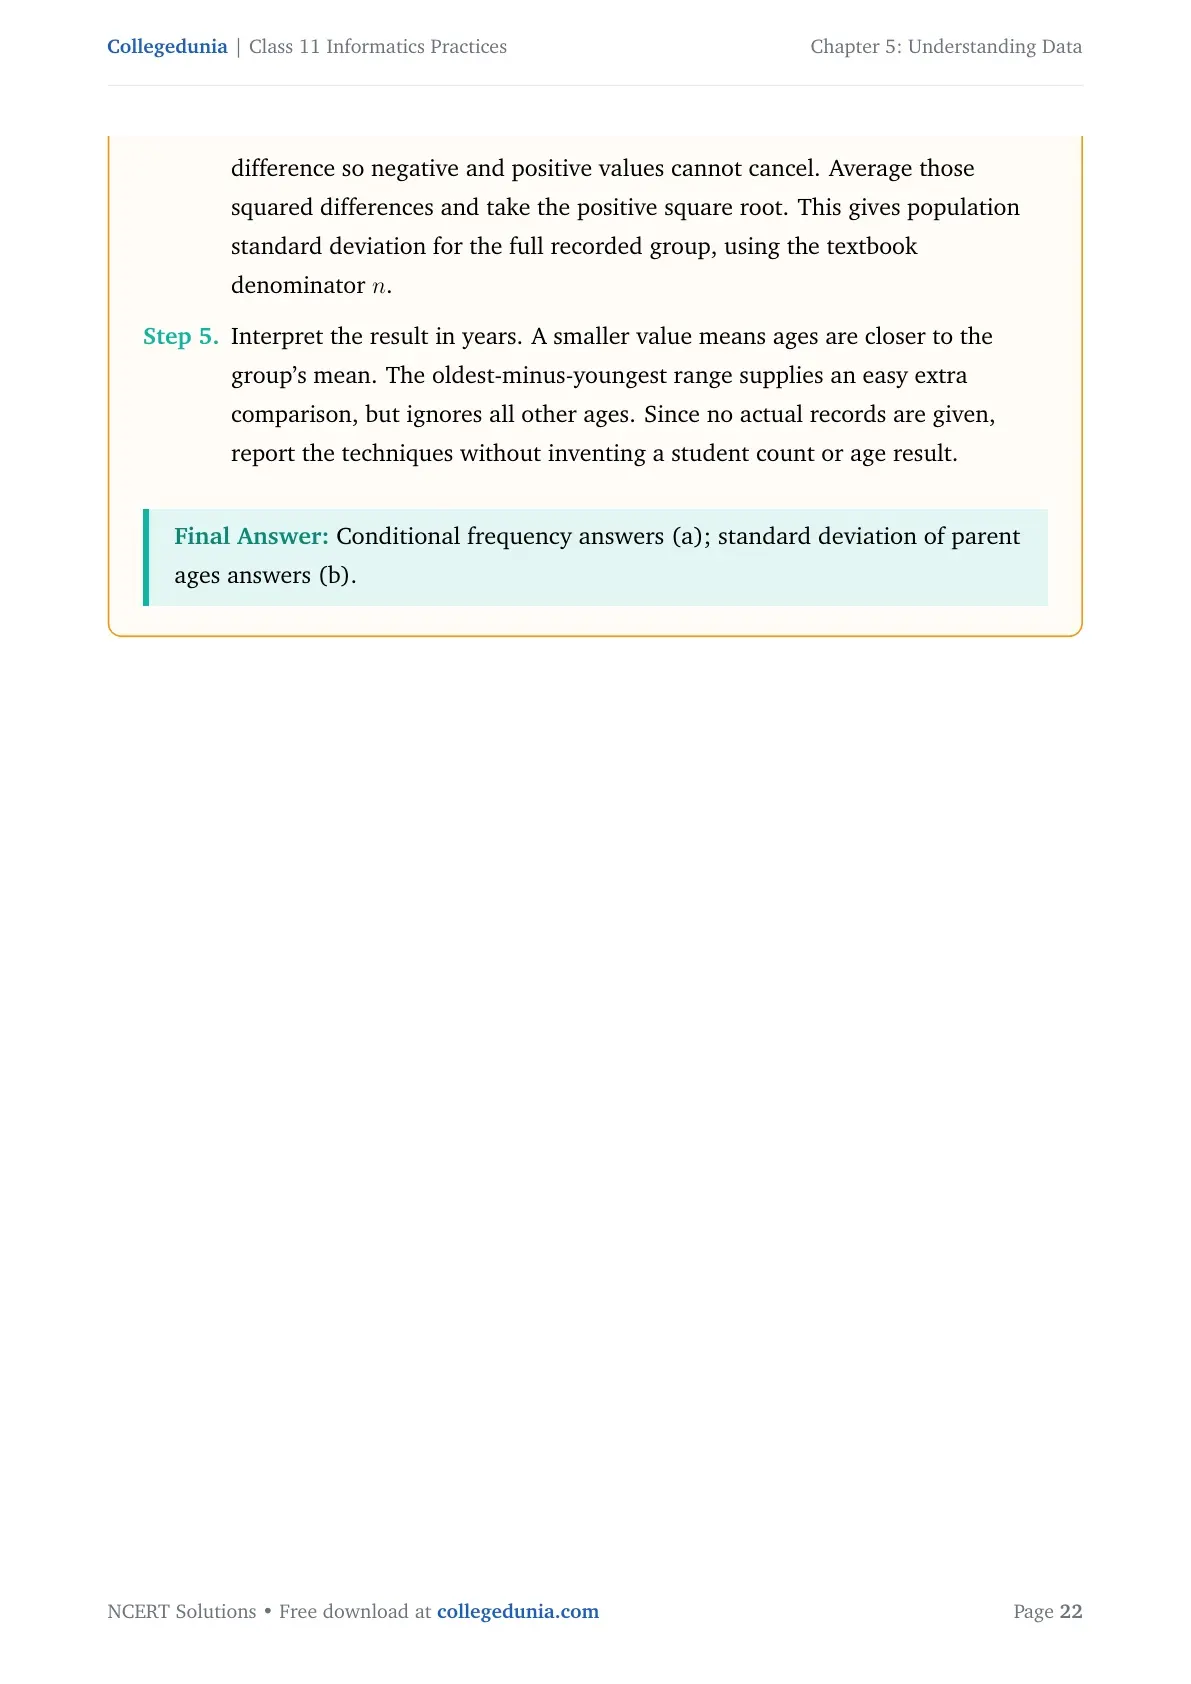
b) How varied are the age of parents of the students of that school?
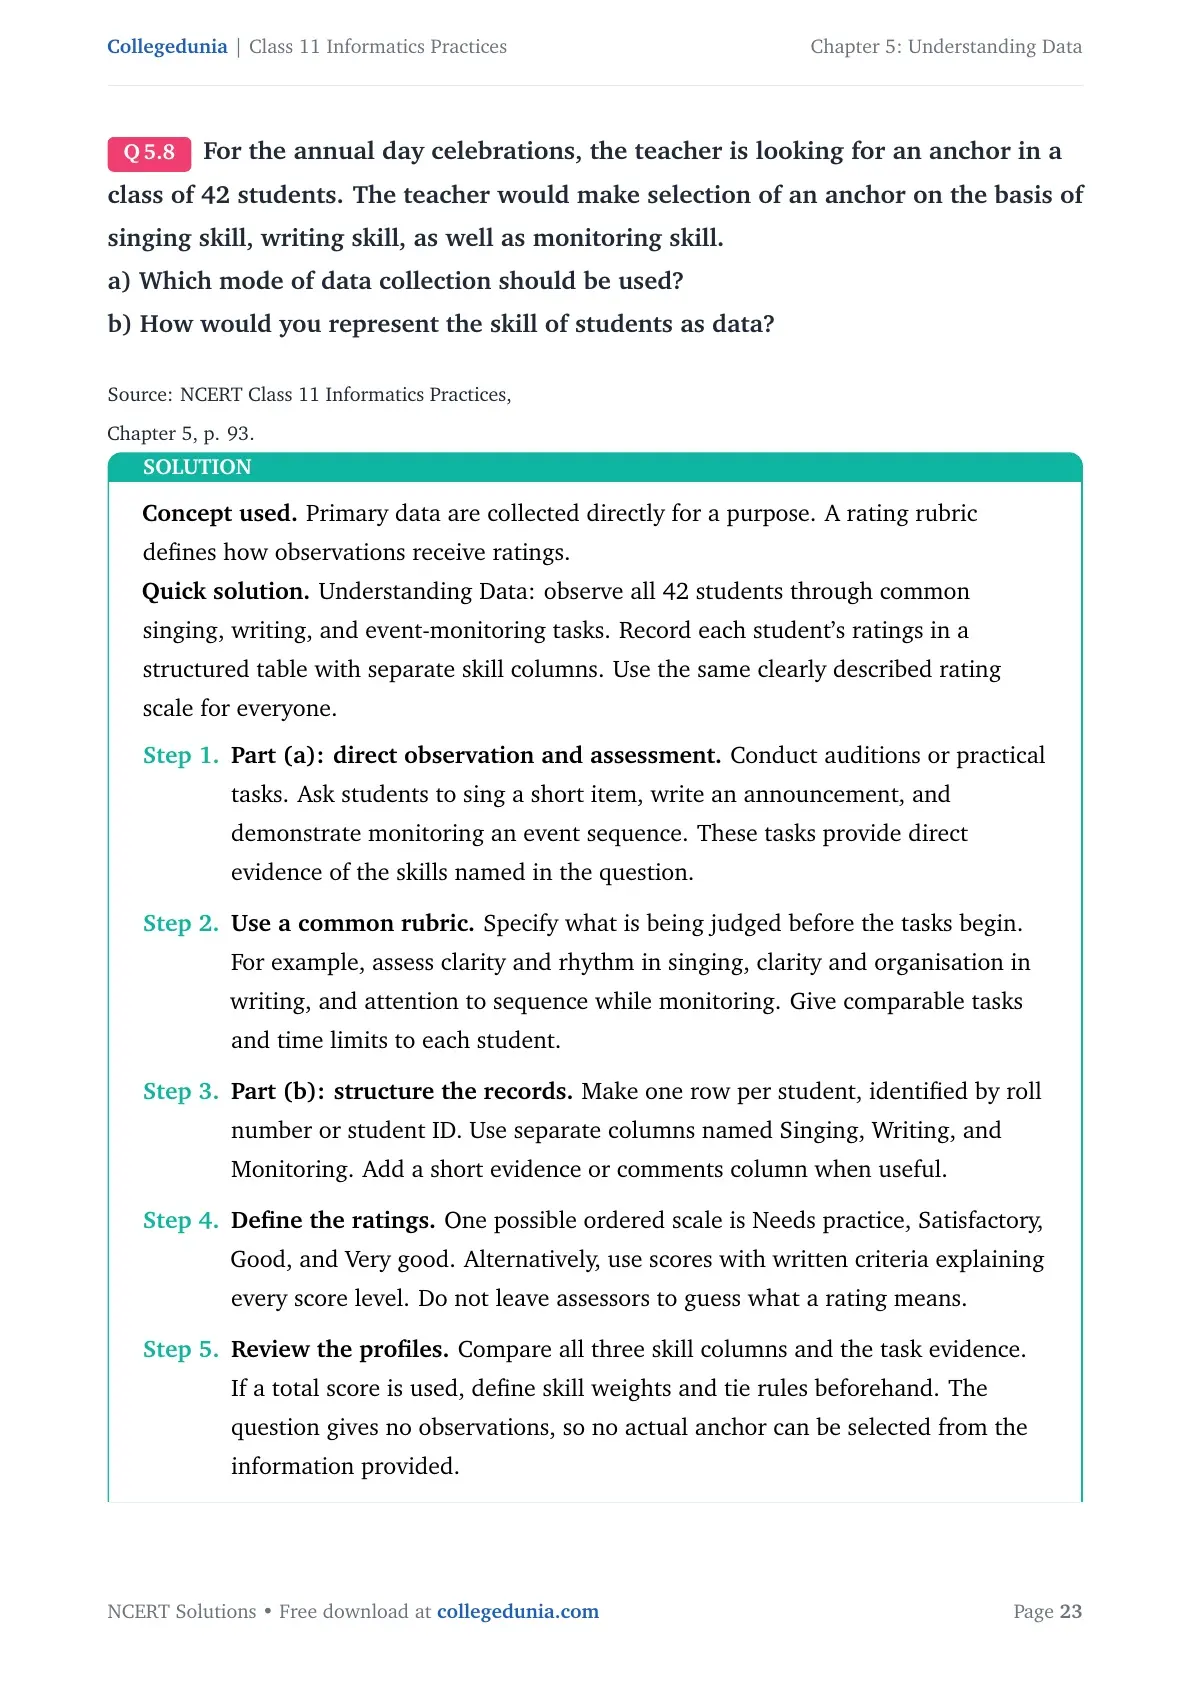
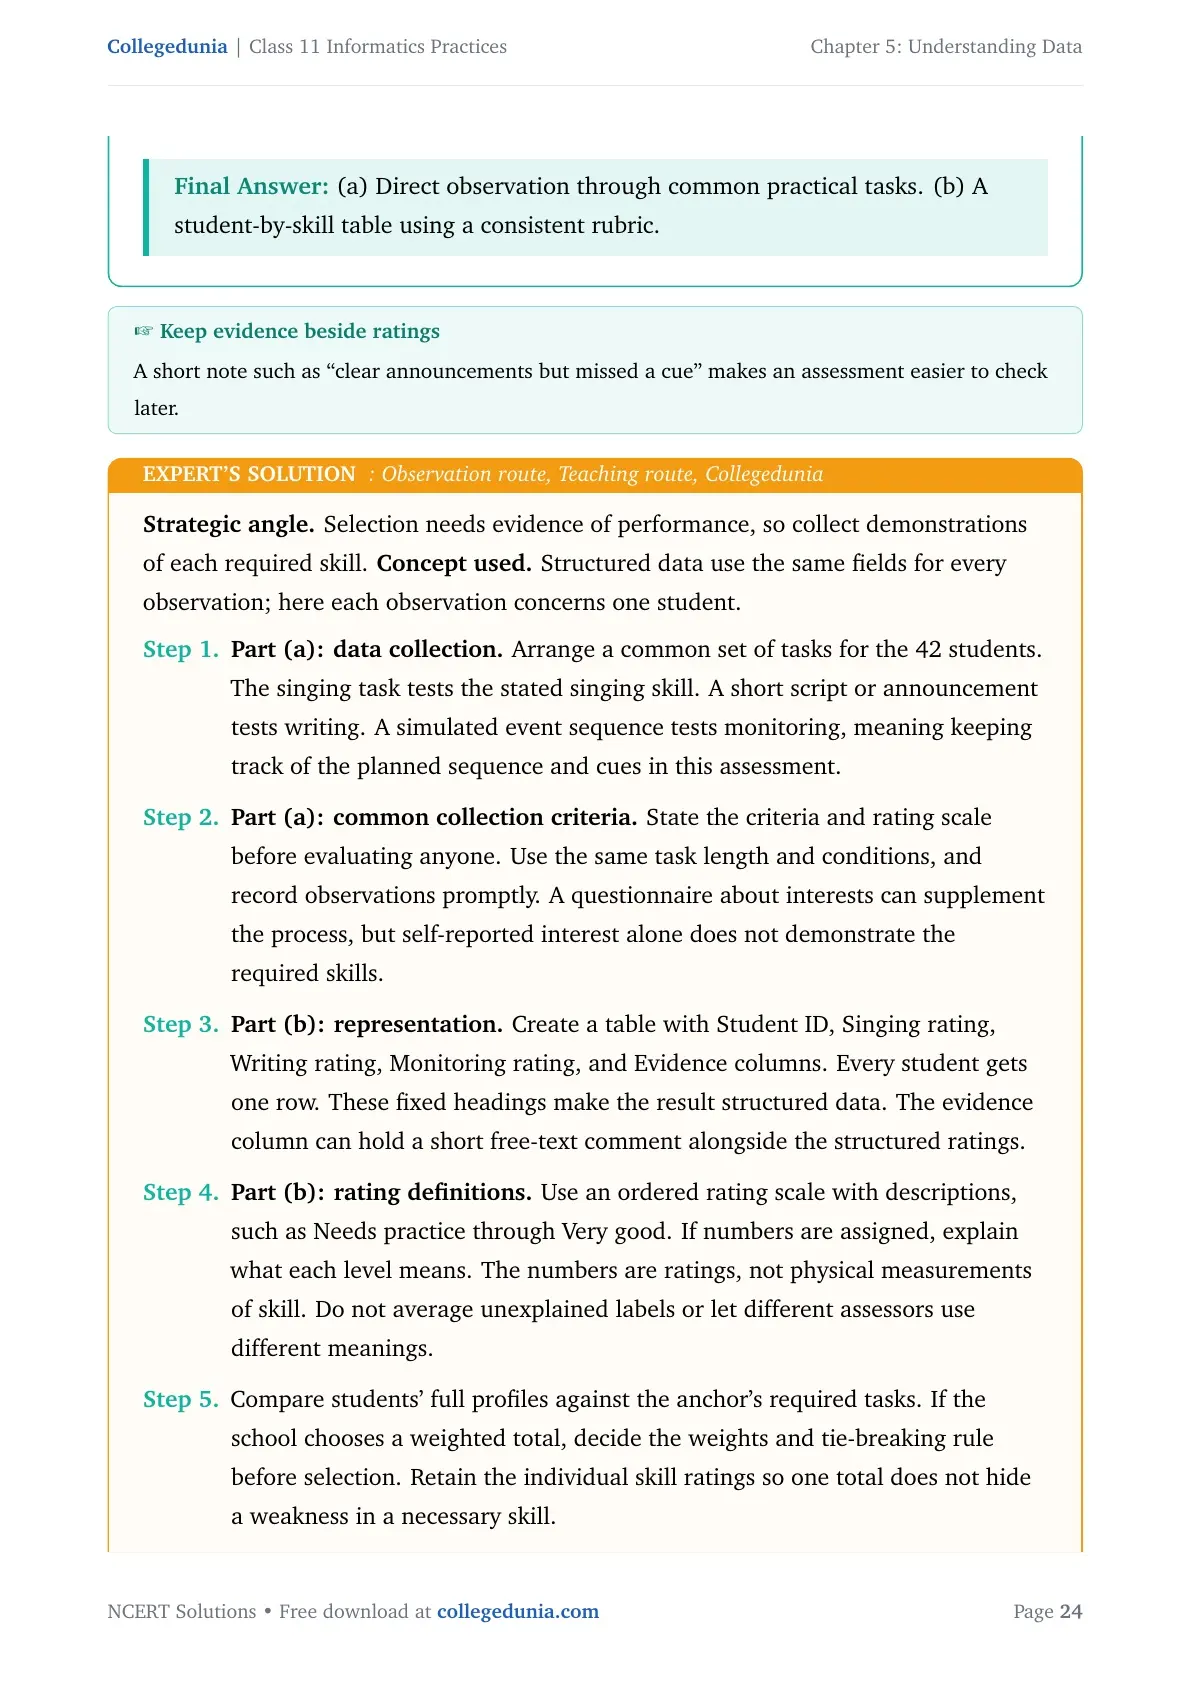
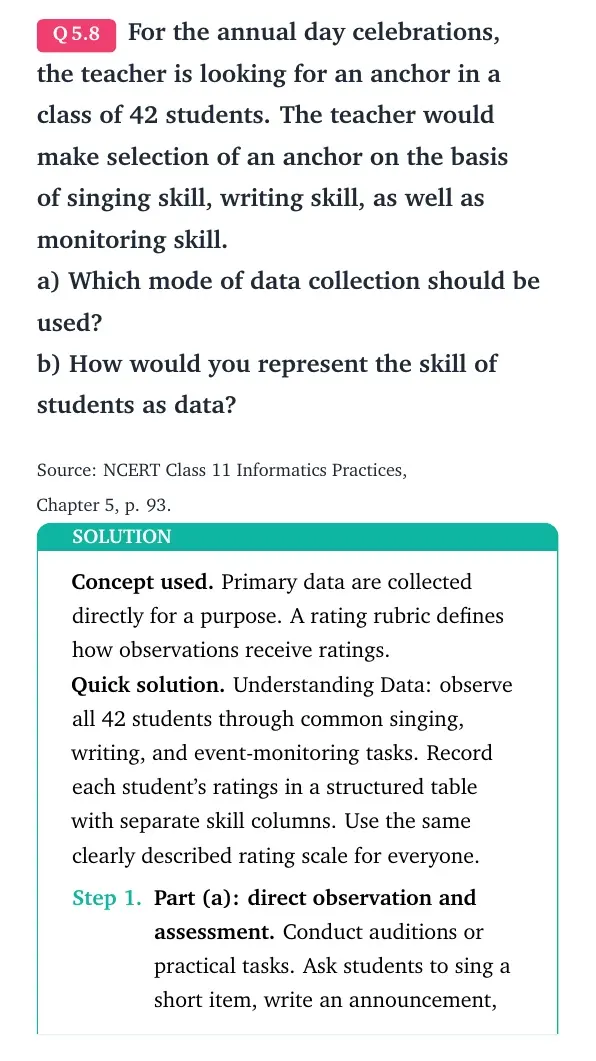
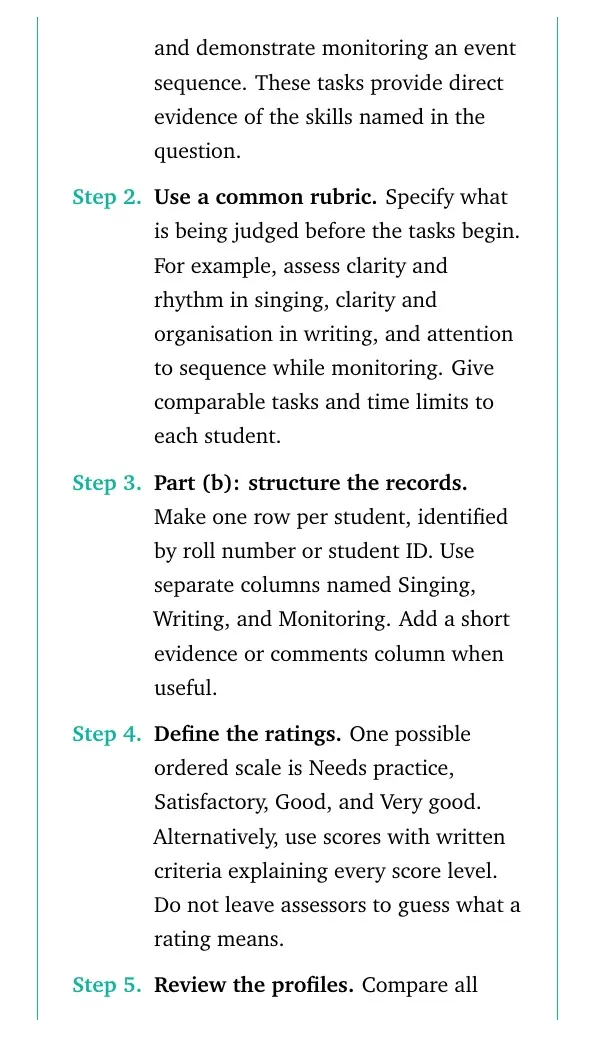
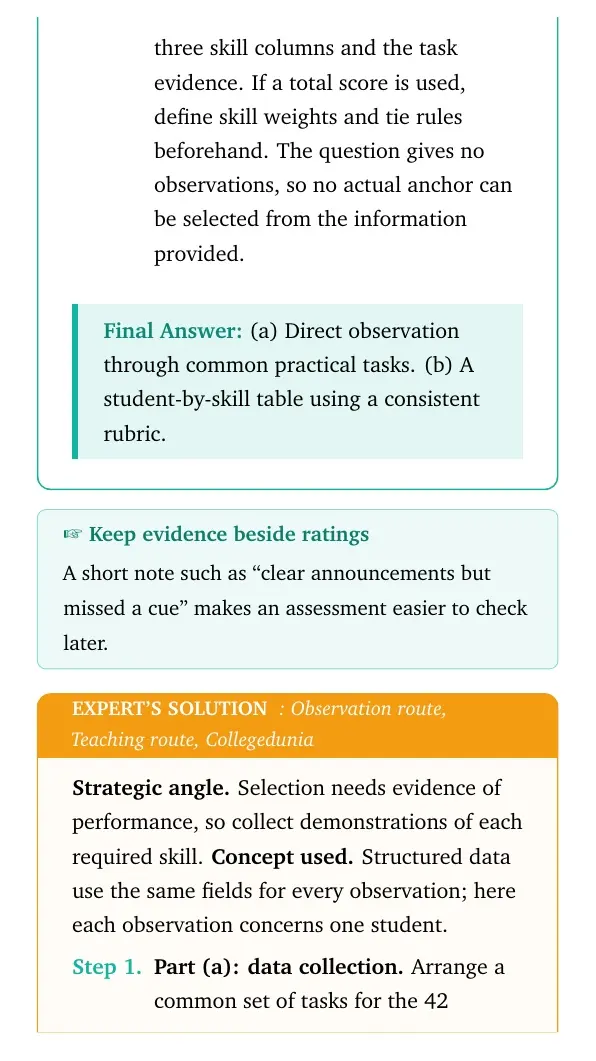
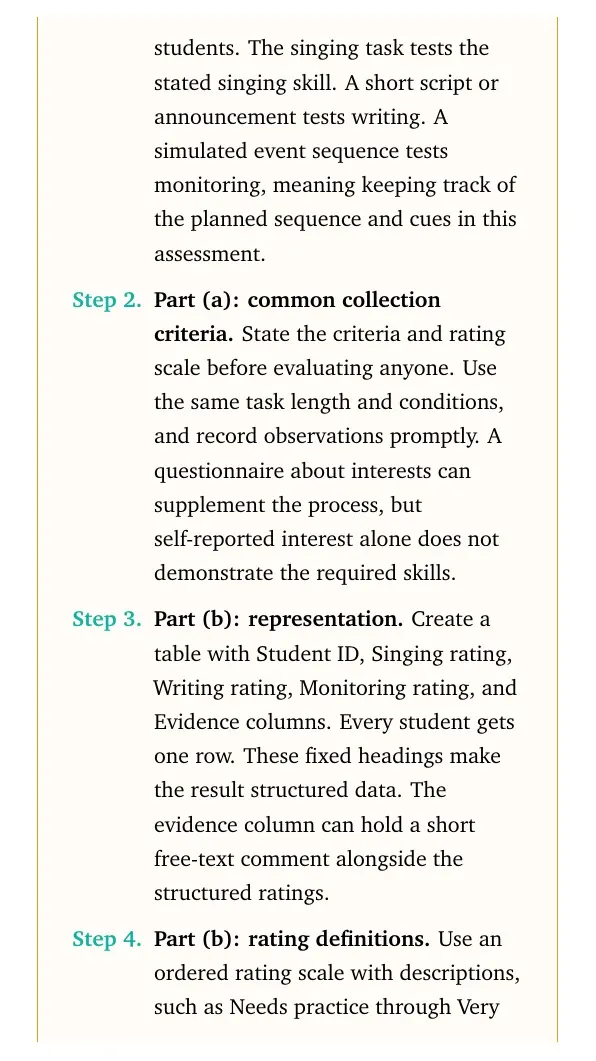
For the annual day celebrations, the teacher is looking for an anchor in a class of 42 students. The teacher would make selection of an anchor on the basis of singing skill, writing skill, as well as monitoring skill.
a) Which mode of data collection should be used?
b) How would you represent the skill of students as data?
Differentiate between structured and unstructured data giving one example.
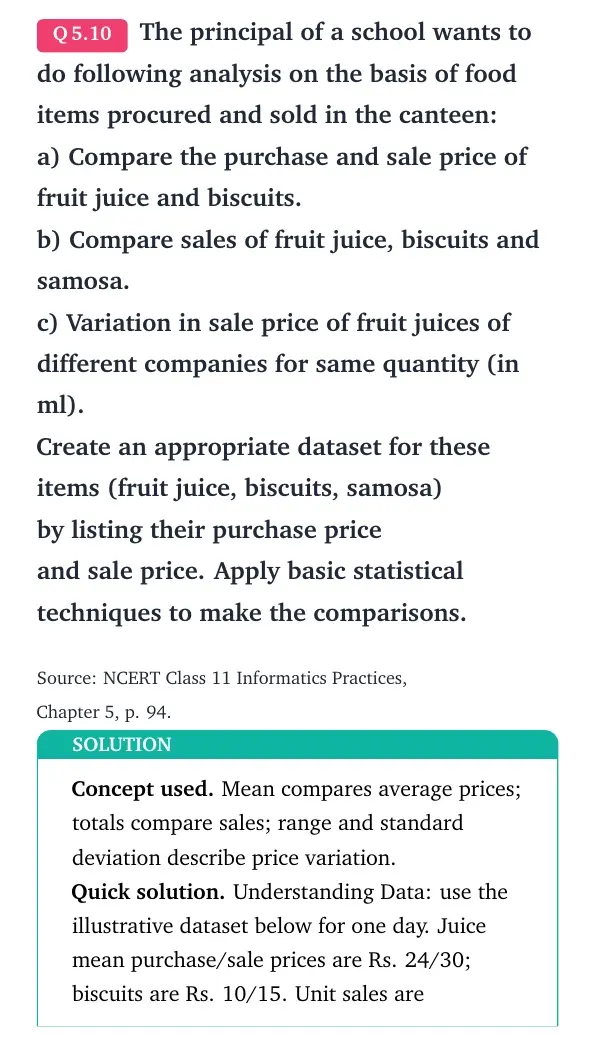
The principal of a school wants to do following analysis on the basis of food items procured and sold in the canteen:
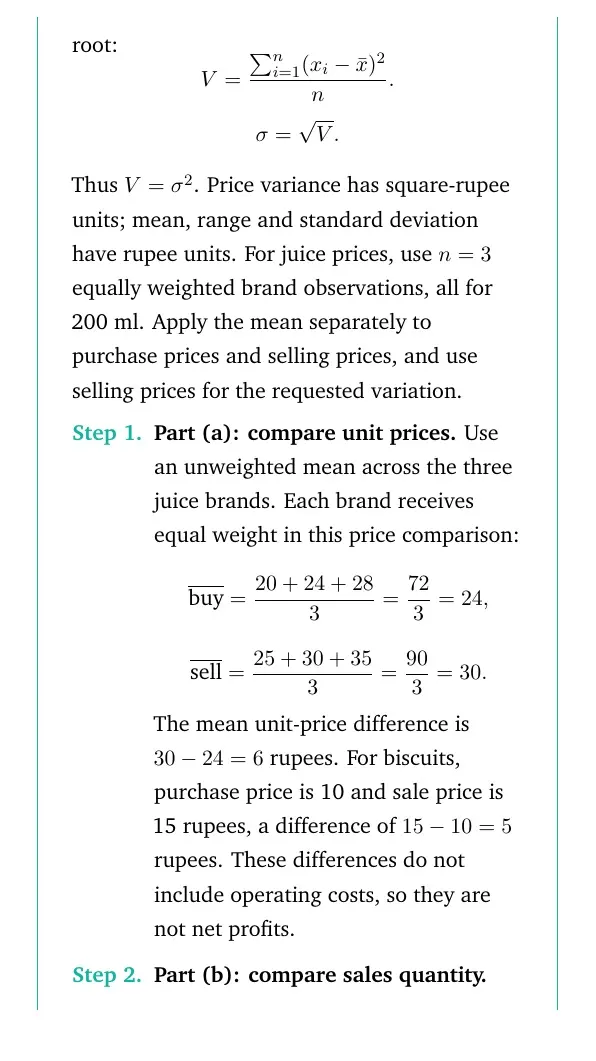
a) Compare the purchase and sale price of fruit juice and biscuits.
b) Compare sales of fruit juice, biscuits and samosa.
c) Variation in sale price of fruit juices of different companies for same quantity (in ml).
Create an appropriate dataset for these items (fruit juice, biscuits, samosa)
by listing their purchase price
and sale price. Apply basic statistical techniques to make the comparisons.
- Identify the observation unit and required output before collecting data.
- Use AND when every eligibility condition must hold.
- A category's frequency is a count; its mode is a most-common label or value.
- Compare means only for meaningful numerical values on comparable scales.
- State units, time periods, and whether an example dataset is illustrative.
Understanding Data Notes and NCERT Book for Further Study
Use the chapter text for its definitions and the notes to review the ideas behind these exercise answers.
| Resource | Use |
|---|---|
| Understanding Data Class 11 Notes | Review data types, collection, storage and statistical methods |
| Understanding Data Class 11 NCERT Book PDF | Read the source chapter and original exercises |
NCERT Solutions for Class 11 Informatics Practices: All Chapters
The NCERT textbook has eight chapters. Chapter links below follow the resource schedule. Solutions for chapters 6 to 8 are not listed here yet.
| Chapter | NCERT Solutions |
|---|---|
| Chapter 1 | Computer System NCERT Solutions |
| Chapter 2 | Emerging Trends NCERT Solutions |
| Chapter 3 | Brief Overview of Python NCERT Solutions |
| Chapter 4 | Working with Lists and Dictionaries NCERT Solutions |
| Chapter 5 | Understanding Data NCERT Solutions |
| Chapter 6 | Introduction to NumPy: solutions not yet listed |
| Chapter 7 | Database Concepts: solutions not yet listed |
| Chapter 8 | Introduction to Structured Query Language (SQL): solutions not yet listed |
Understanding Data Class 11 Informatics Practices NCERT Solutions FAQs
Ques. How many exercises are covered in Understanding Data?
Ans. The chapter has one end exercise containing ten numbered questions, several with subparts. The solutions cover all ten questions on textbook pages 92 to 94.
Ques. Which NCERT edition do these solutions follow?
Ans. They follow Chapter 5, Understanding Data, in the Class 11 Informatics Practices textbook marked Reprint 2026-27. Check your teacher's prescribed topics when planning your school assessment preparation.
Ques. Can I download the Understanding Data solutions PDF?
Ans. Use the PDF download option near the top of this page. Keep the original chapter alongside the solutions so you can try each question before checking the explanation.
Ques. Does question 5 use population or sample standard deviation?
Ans. It uses the textbook's population formula, which divides the sum of squared deviations by seven. The result for the given week is about 3.31°C.
Ques. Can question 10 have different correct answers?
Ans. Yes. It asks you to create a dataset, so your prices and sales figures may differ. Label them as example data, use consistent units and make calculations that match your stated figures.
Ques. What is structured data?
Ans. Structured data follows a defined arrangement, often rows and columns. An attendance table can store each student's ID, date and attendance status in fixed fields.
Ques. How is the median found?
Ans. Sort the numerical values. For an odd count, choose the middle value. For an even count, take the mean of the two middle values.
Ques. What are measures of dispersion?
Ans. These measures describe how spread out the values are. The chapter covers range, based on the extremes, and standard deviation, which uses every value.



Comments