Class 10 Maths Chapter 13 Statistics Exercise 13.1 is the Multiple Choice Questions section of the NCERT Exemplar. It has 11 MCQs (Q1 to Q11) covering the mean, median, and mode of grouped data, cumulative frequency tables, ogive intersection, inclusive classes, and the assumed-mean method, according to the 2026-27 CBSE syllabus.
11 Multiple Choice Questions (Q1-Q11) with full solutions and expert analysis for each question.
Key concepts tested: assumed-mean and step-deviation methods, deviation of class marks, properties of mean, ogive intersection giving median, median class and modal class identification, inclusive to exclusive class conversion, cumulative frequency interpretation.
CBSE Weightage: Statistics carries 5 to 6 marks in the Class 10 board paper, with at least one long-answer question from this chapter each year.
Each NCERT Exemplar solution for Class 10 Maths Chapter 13 Exercise 13.1 on this page is curated by subject experts, according to the 2026-27 NCERT Exemplar book, and verified against the last five years of CBSE board papers for this chapter.
Solved by Collegedunia
All 11 questions of Exercise 13.1 are solved below with a step-by-step solution and an expert's insight for each.
Exercise 13.1 is the Multiple Choice Questions section of the NCERT Exemplar for Chapter 13 Statistics. It has 11 MCQs numbered Q1 to Q11. The questions test whether students can apply the mean, median, and mode formulas correctly and also read cumulative frequency tables in both less-than and more-than forms.
Question
Topic Focus
Key Idea
Q1
Definition of di in assumed-mean formula
Deviation of class mid-points from assumed mean a
Q2
Assumption for grouped mean
Frequencies centred at class marks
Q3
Sum Σfi(xi - x̄)
Always equals zero
Q4
Definition of ui in step-deviation formula
ui = (xi - a) / h
Q5
Intersection of two ogives
Abscissa gives the median
Q6
Sum of lower limits of median class and modal class
Build cumulative column; find max frequency
Q7
Upper limit of median class (inclusive classes)
Convert inclusive to exclusive; apply cumulative test
Q8
Modal class from "below" cumulative table
Biggest successive difference = modal class
Q9
Difference of limits: median and modal class
Same class; answer = class width
Q10
Less-than cumulative frequency up to 14.6 s
Sum frequencies of all classes ending at or before 14.6
Q11
Class frequency from more-than type table
Subtract adjacent cumulative rows
The difficulty ranges from easy (Q1, Q2, Q4) to moderate to hard (Q7, Q8, Q11). Questions 7 and 11 are the most commonly missed in this exercise because they require a conversion step before applying the standard approach.
Key Formulas for Exercise 13.1
Every MCQ in Exercise 13.1 is based on one of the four formulas below or on a property of the cumulative frequency distribution. Having these at your fingertips means you can read off the answer in under 30 seconds for the easier questions.
Formula
Expression
When to use
Questions
Mean (assumed-mean method)
x̄ = a + ΣfidiΣfi
When class marks deviate from a chosen a
Q1, Q2, Q3
Mean (step-deviation method)
x̄ = a + hΣfiuiΣfi, ui = xi - ah
Equal class widths; scales down large deviations
Q4
Median class location
Find class where cumulative frequency first reaches n/2
Locating median class; reading ogive intersection
Q5, Q6, Q7, Q9
Modal class location
Class with the highest frequency (or biggest jump in cumulative table)
Finding modal class for mode or comparison questions
Q6, Q8, Q9
Important: for inclusive classes (like 6-11, 12-17) always subtract 0.5 from each lower limit and add 0.5 to each upper limit before building the cumulative frequency column. Skipping this step is the single most common error in Exercise 13.1.
Formula Overview
Common Mistakes in Exercise 13.1
These MCQs are designed so that each wrong option matches a specific calculation error. Knowing the traps in advance turns a 10-minute question into a 2-minute one.
Question
Common Mistake
The Fix
Q1
Confusing di with the deviation of class limits
di = xi - a where xi is always the class mark (mid-point), never a limit.
Q3
Guessing a non-zero answer from data
This is an identity: Σfi(xi - x̄) = 0 for any dataset. No calculation needed.
Q4
Writing (a - xi)/h or h(xi - a)
The step deviation is ui = (xi - a)/h. Division by h, not multiplication; numerator is xi - a, not reversed.
Q7
Reading upper limit as 17 instead of 17.5
Inclusive classes need the 0.5 adjustment first. The class 12-17 becomes 11.5-17.5 after conversion; its upper limit is 17.5.
Q8
Reading modal class directly from the "below" column
Find class frequencies by differencing adjacent rows. The biggest difference (27 to 57, a jump of 30) locates the modal class 30-40.
Q10
Taking only the frequency of the last class (71)
"Less than 14.6" means cumulate all classes up to and including 14.4-14.6: 2 + 4 + 5 + 71 = 82.
Q11
Reading 48 or 51 as the class frequency
Those are cumulative totals. Class frequency = 51 - 48 = 3 (more-than row at 30 minus row at 40).
Question Types & Difficulty Guide
All Exercise 13.1 Questions with Step-by-Step Solutions
I. Multiple Choice Questions (Exercise 13.1)
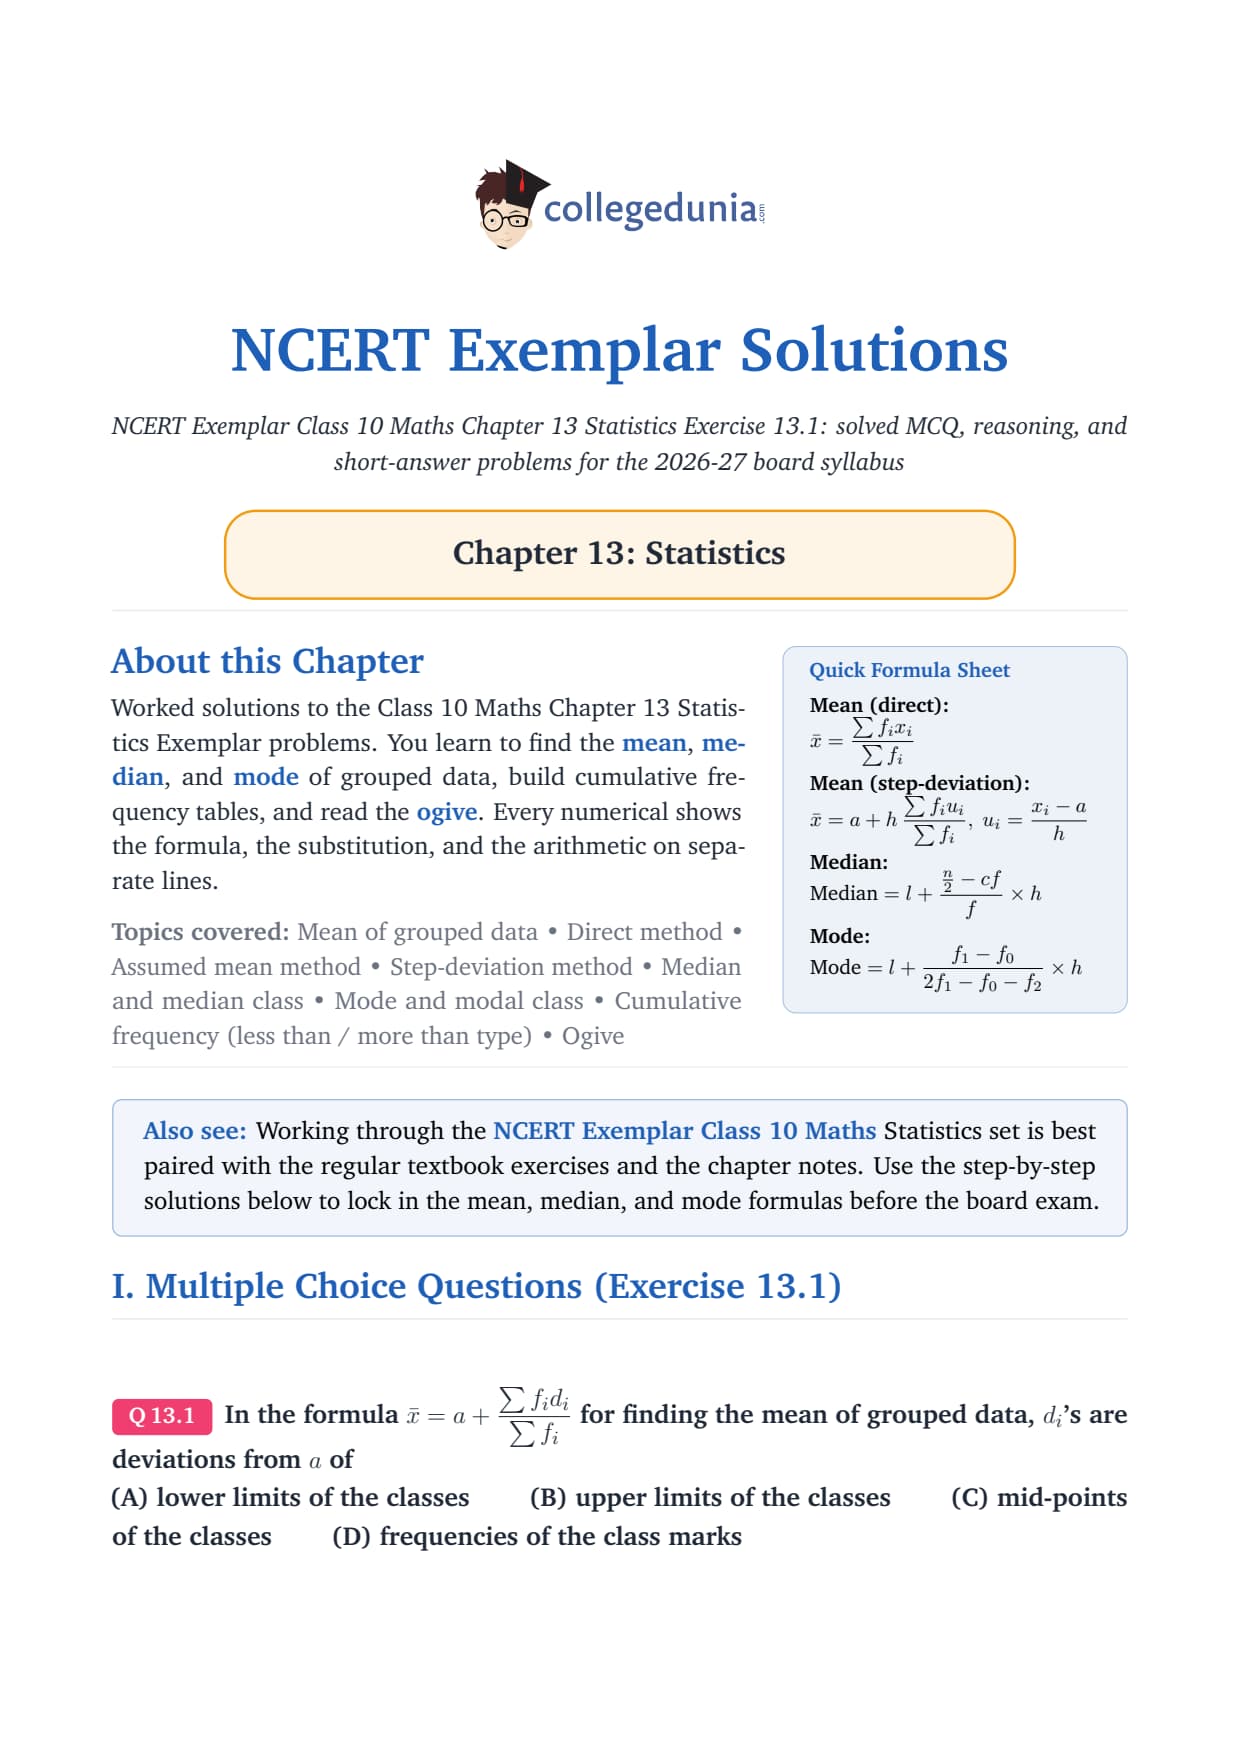
Q 13.1
In the formula x̄=a+∑ fi di∑ fi for finding the mean of grouped data, di's are deviations from a of
(A) lower limits of the classes
(B) upper limits of the classes
(C) mid-points of the classes
(D) frequencies of the class marks
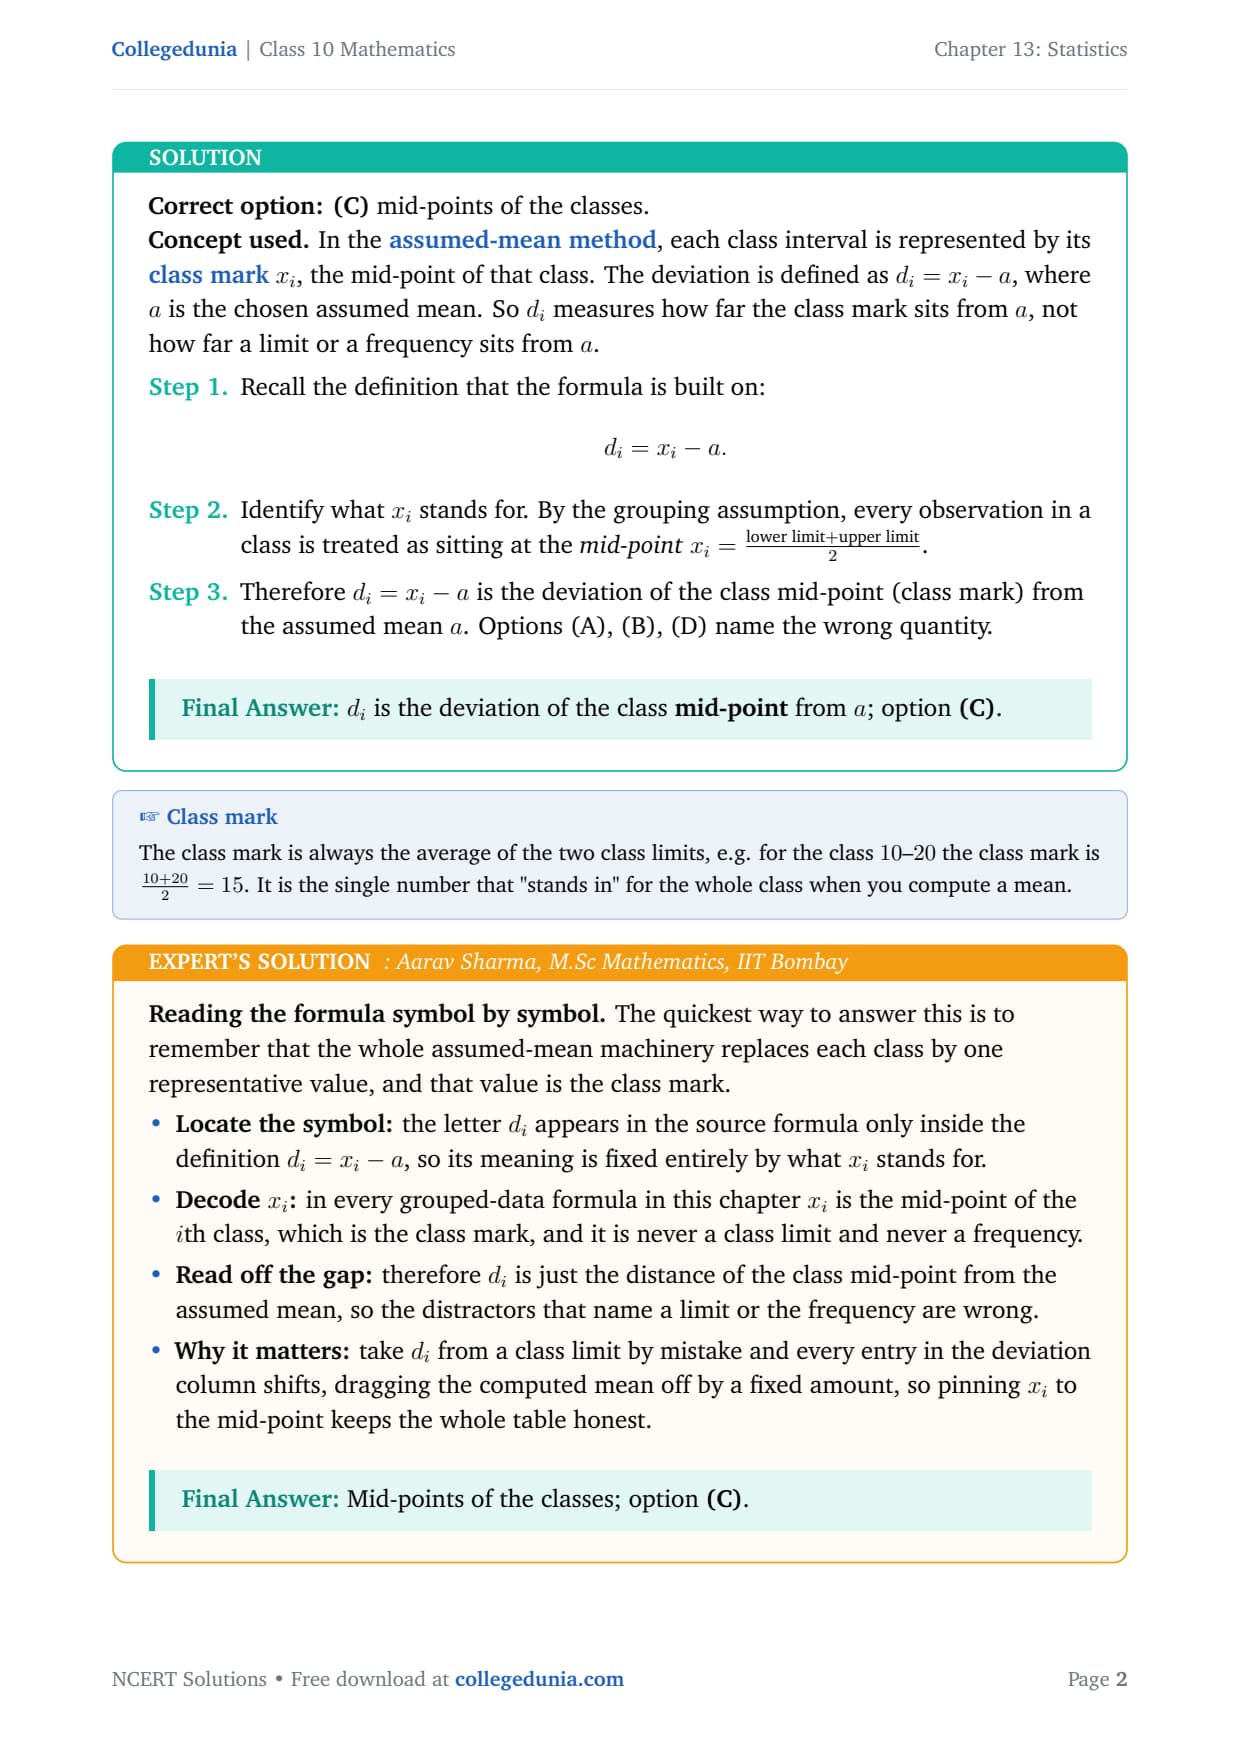
Correct option: (C) mid-points of the classes.
Concept used. In the assumed-mean method, each class
interval is represented by its class markxi, the mid-point
of that class. The deviation is defined as di=xi-a, where a is the
chosen assumed mean. So di measures how far the class mark sits from
a, not how far a limit or a frequency sits from a.
Recall the definition that the formula is built on:
di = xi - a.
Identify what xi stands for. By the grouping assumption,
every observation in a class is treated as sitting at the
mid-pointxi=lower limit+upper limit2.
Therefore di=xi-a is the deviation of the class mid-point
(class mark) from the assumed mean a. Options (A), (B), (D)
name the wrong quantity.
di is the deviation of the class mid-point from a; option (C).
AS
Aarav Sharma
M.Sc Mathematics, IIT Bombay
Verified Expert
Reading the formula symbol by symbol. The quickest way to answer
this is to remember that the whole assumed-mean machinery replaces each
class by one representative value, and that value is the class mark.
Locate the symbol: the letter di appears in the
source formula only inside the definition di=xi-a, so its
meaning is fixed entirely by what xi stands for.
Decode xi: in every grouped-data formula in this
chapter xi is the mid-point of the ith class, which is the
class mark, and it is never a class limit and never a frequency.
Read off the gap: therefore di is just the distance
of the class mid-point from the assumed mean, so the distractors
that name a limit or the frequency are wrong.
Why it matters: take di from a class limit by mistake
and every entry in the deviation column shifts, dragging the
computed mean off by a fixed amount, so pinning xi to the
mid-point keeps the whole table honest.
Mid-points of the classes; option (C).
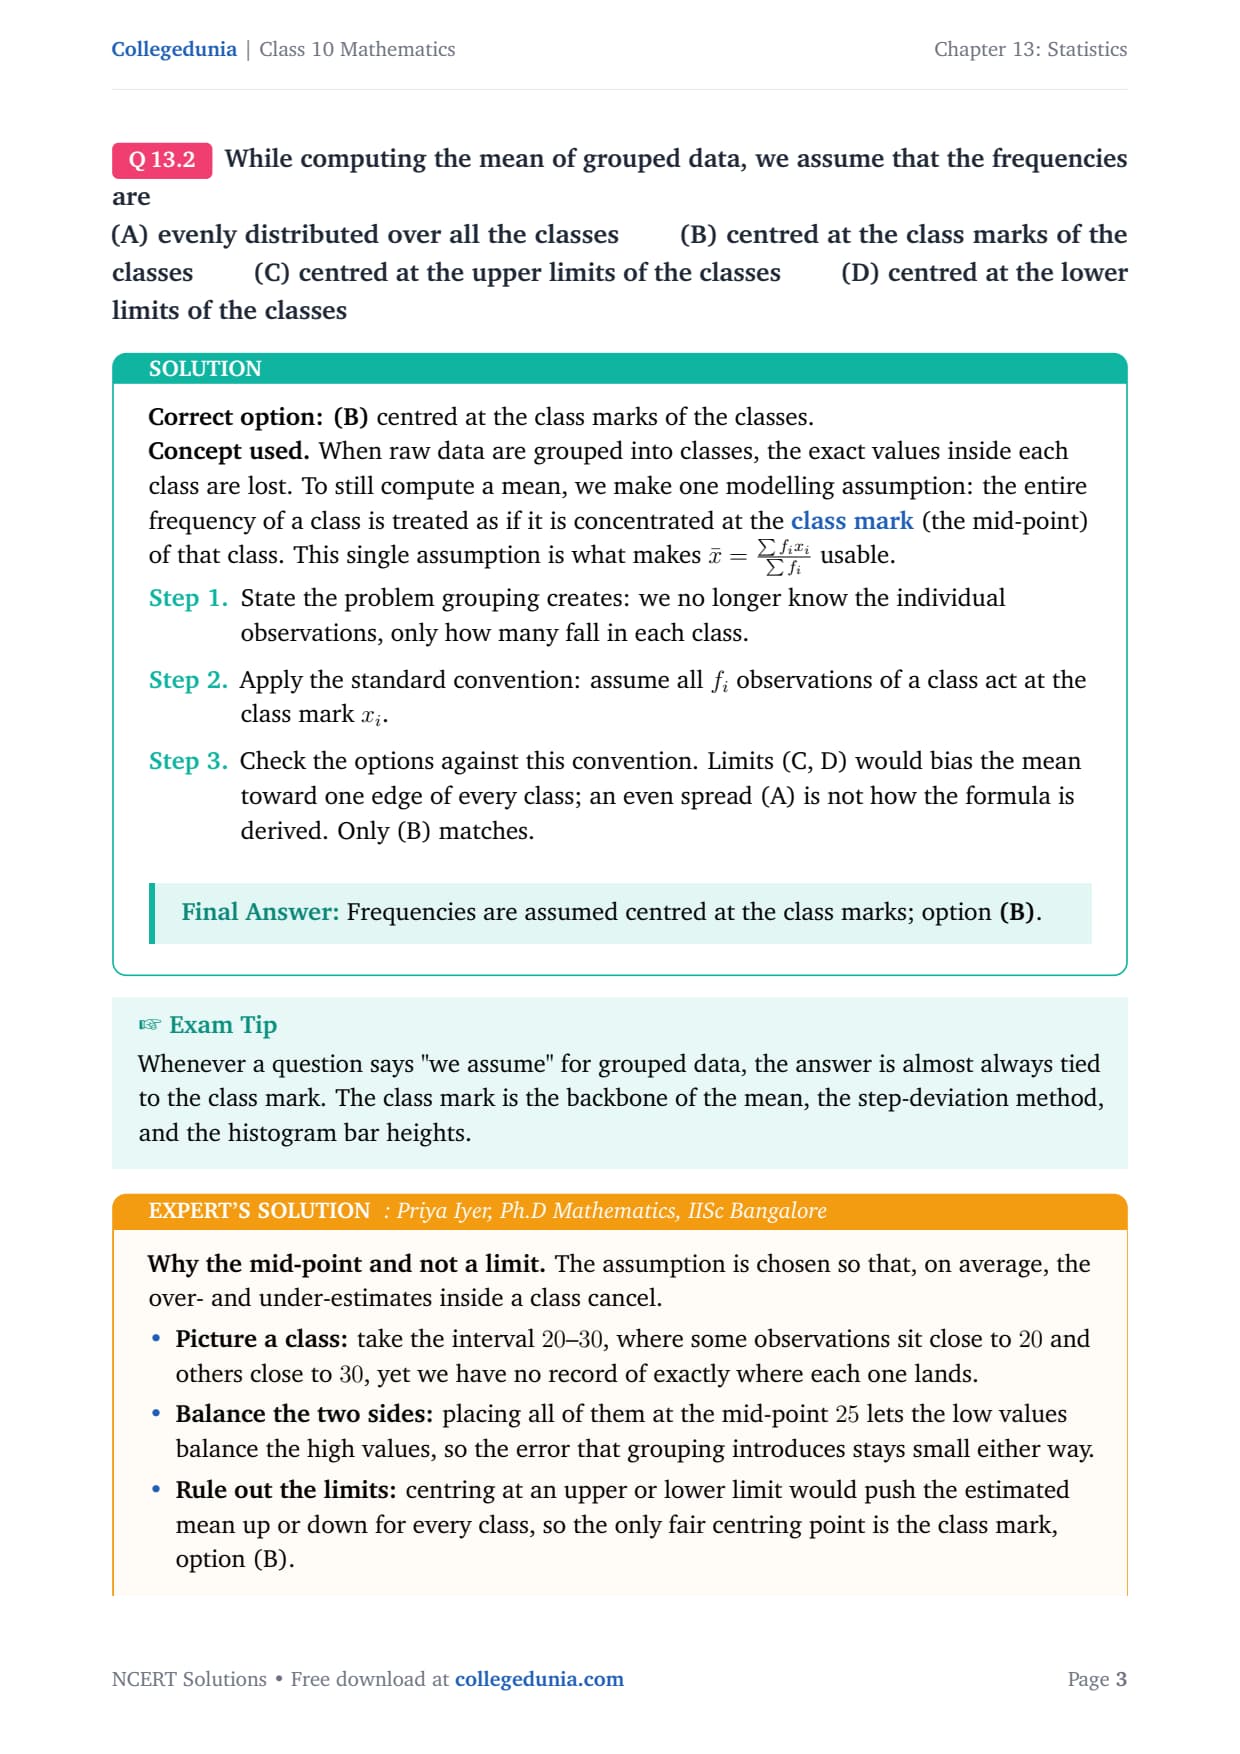
Q 13.2
While computing the mean of grouped data, we assume that the frequencies are
(A) evenly distributed over all the classes
(B) centred at the class marks of the classes
(C) centred at the upper limits of the classes
(D) centred at the lower limits of the classes
Correct option: (B) centred at the class marks of the classes.
Concept used. When raw data are grouped into classes, the exact
values inside each class are lost. To still compute a mean, we make one
modelling assumption: the entire frequency of a class is treated as if
it is concentrated at the class mark (the mid-point) of that
class. This single assumption is what makes x̄=∑ fi xi∑ fi
usable.
State the problem grouping creates: we no longer know the
individual observations, only how many fall in each class.
Apply the standard convention: assume all fi observations of
a class act at the class mark xi.
Check the options against this convention. Limits (C, D) would
bias the mean toward one edge of every class; an even spread
(A) is not how the formula is derived. Only (B) matches.
Frequencies are assumed centred at the class marks; option (B).
PI
Priya Iyer
Ph.D Mathematics, IISc Bangalore
Verified Expert
Why the mid-point and not a limit. The assumption is chosen so
that, on average, the over- and under-estimates inside a class cancel.
Picture a class: take the interval 20–30, where
some observations sit close to 20 and others close to 30, yet
we have no record of exactly where each one lands.
Balance the two sides: placing all of them at the
mid-point 25 lets the low values balance the high values, so
the error that grouping introduces stays small either way.
Rule out the limits: centring at an upper or lower limit
would push the estimated mean up or down for every class, so the
only fair centring point is the class mark, option (B).
Why it matters: this same balancing idea explains why
the mean of ungrouped and grouped data come out close but rarely
identical, a contrast the reasoning questions in this chapter
test directly.
Centred at the class marks; option (B).
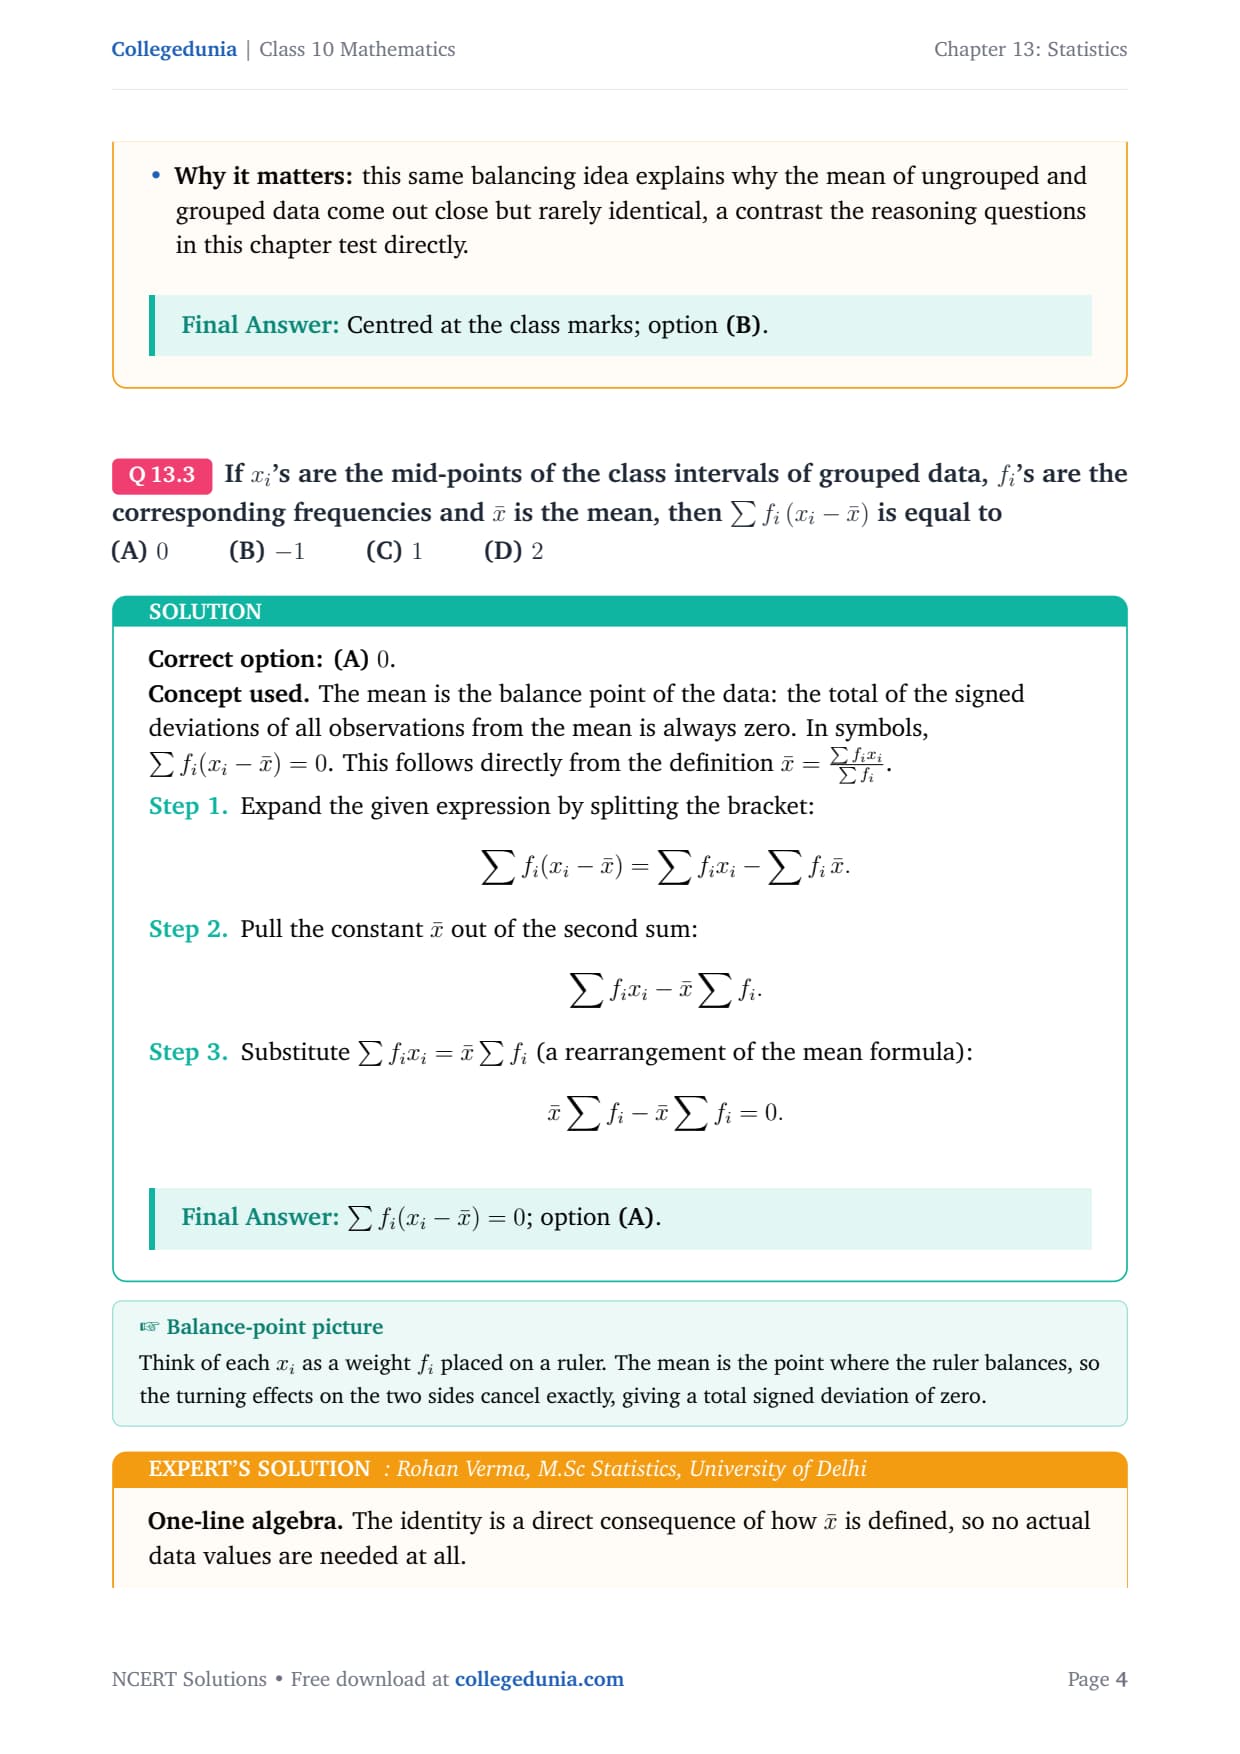
Q 13.3
If xi's are the mid-points of the class intervals of grouped data, fi's are the corresponding frequencies and x̄ is the mean, then ∑ fi (xi-x̄) is equal to
(A) 0 (B) -1 (C) 1 (D) 2
Correct option: (A)0.
Concept used. The mean is the balance point of the data: the
total of the signed deviations of all observations from the mean is
always zero. In symbols, ∑ fi(xi-x̄)=0. This follows
directly from the definition x̄=∑ fi xi∑ fi.
Expand the given expression by splitting the bracket:
∑ fi(xi-x̄) = ∑ fi xi - ∑ fix̄.
Pull the constant x̄ out of the second sum:
∑ fi xi - x̄∑ fi.
Substitute ∑ fi xi=x̄∑ fi (a rearrangement of
the mean formula):
x̄∑ fi - x̄∑ fi = 0.
∑ fi(xi-x̄)=0; option (A).
RV
Rohan Verma
M.Sc Statistics, University of Delhi
Verified Expert
One-line algebra. The identity is a direct consequence of how
x̄ is defined, so no actual data values are needed at all.
Start from the mean: the definition rearranges to
x̄∑ fi=∑ fi xi, which is the only fact this
problem relies on.
Distribute the sum: expanding the bracket gives
∑ fi xi-x̄∑ fi, two pieces built from the same
quantities.
Cancel to zero: those two pieces are equal, so their
difference is exactly zero, and the options minus one, one, and
two simply cannot arise for any data set.
Why it matters: this zero-sum property is the algebraic
seed of variance and standard deviation in higher classes, where
deviations are squared precisely because their plain signed sum is
always zero.
0; option (A).
Q 13.4
In the formula x̄=a+h∑ fi ui∑ fi for finding the mean of a grouped frequency distribution, ui=
(A) xi+ah (B) h(xi-a) (C) xi-ah (D) a-xih
Correct option: (C)xi-ah.
Concept used. The step-deviation method scales the
ordinary deviation di=xi-a by the class size h to make the numbers
small whole values. The scaled deviation is defined as
ui=dih=xi-ah.
Write the plain deviation first: di=xi-a.
Divide by the common class width h to get the step deviation:
ui=dih=xi-ah.
Check the sign and the position of h. The numerator must be
xi-a (not a-xi, which flips the sign) and h must divide
(not multiply), ruling out (A), (B), (D).
ui=xi-ah; option (C).
SN
Sneha Nair
M.Sc Mathematics, IIT Madras
Verified Expert
Building ui from di. The step deviation is just the
ordinary deviation measured in units of one class width.
Take the deviation: start with the gap of the class mark
from the assumed mean, the familiar di=xi-a.
Count the steps: express that gap as a number of steps
of size h, giving ui=xi-ah, and when a is a
class mark every ui becomes a tiny whole number such as -2
or 2.
Check the formula: substituting di=h ui back into
the assumed-mean formula rebuilds the step-deviation formula
exactly, so only the form in option (C) is correct.
Why it matters: dividing by h turns three-digit
products into one-digit products, which is the whole reason the
step-deviation method is the fastest hand method whenever the
class widths are equal.
xi-ah; option (C).
Q 13.5
The abscissa of the point of intersection of the less than type and of the more than type cumulative frequency curves of a grouped data gives its
(A) mean (B) median (C) mode (D) all the three above
Correct option: (B) median.
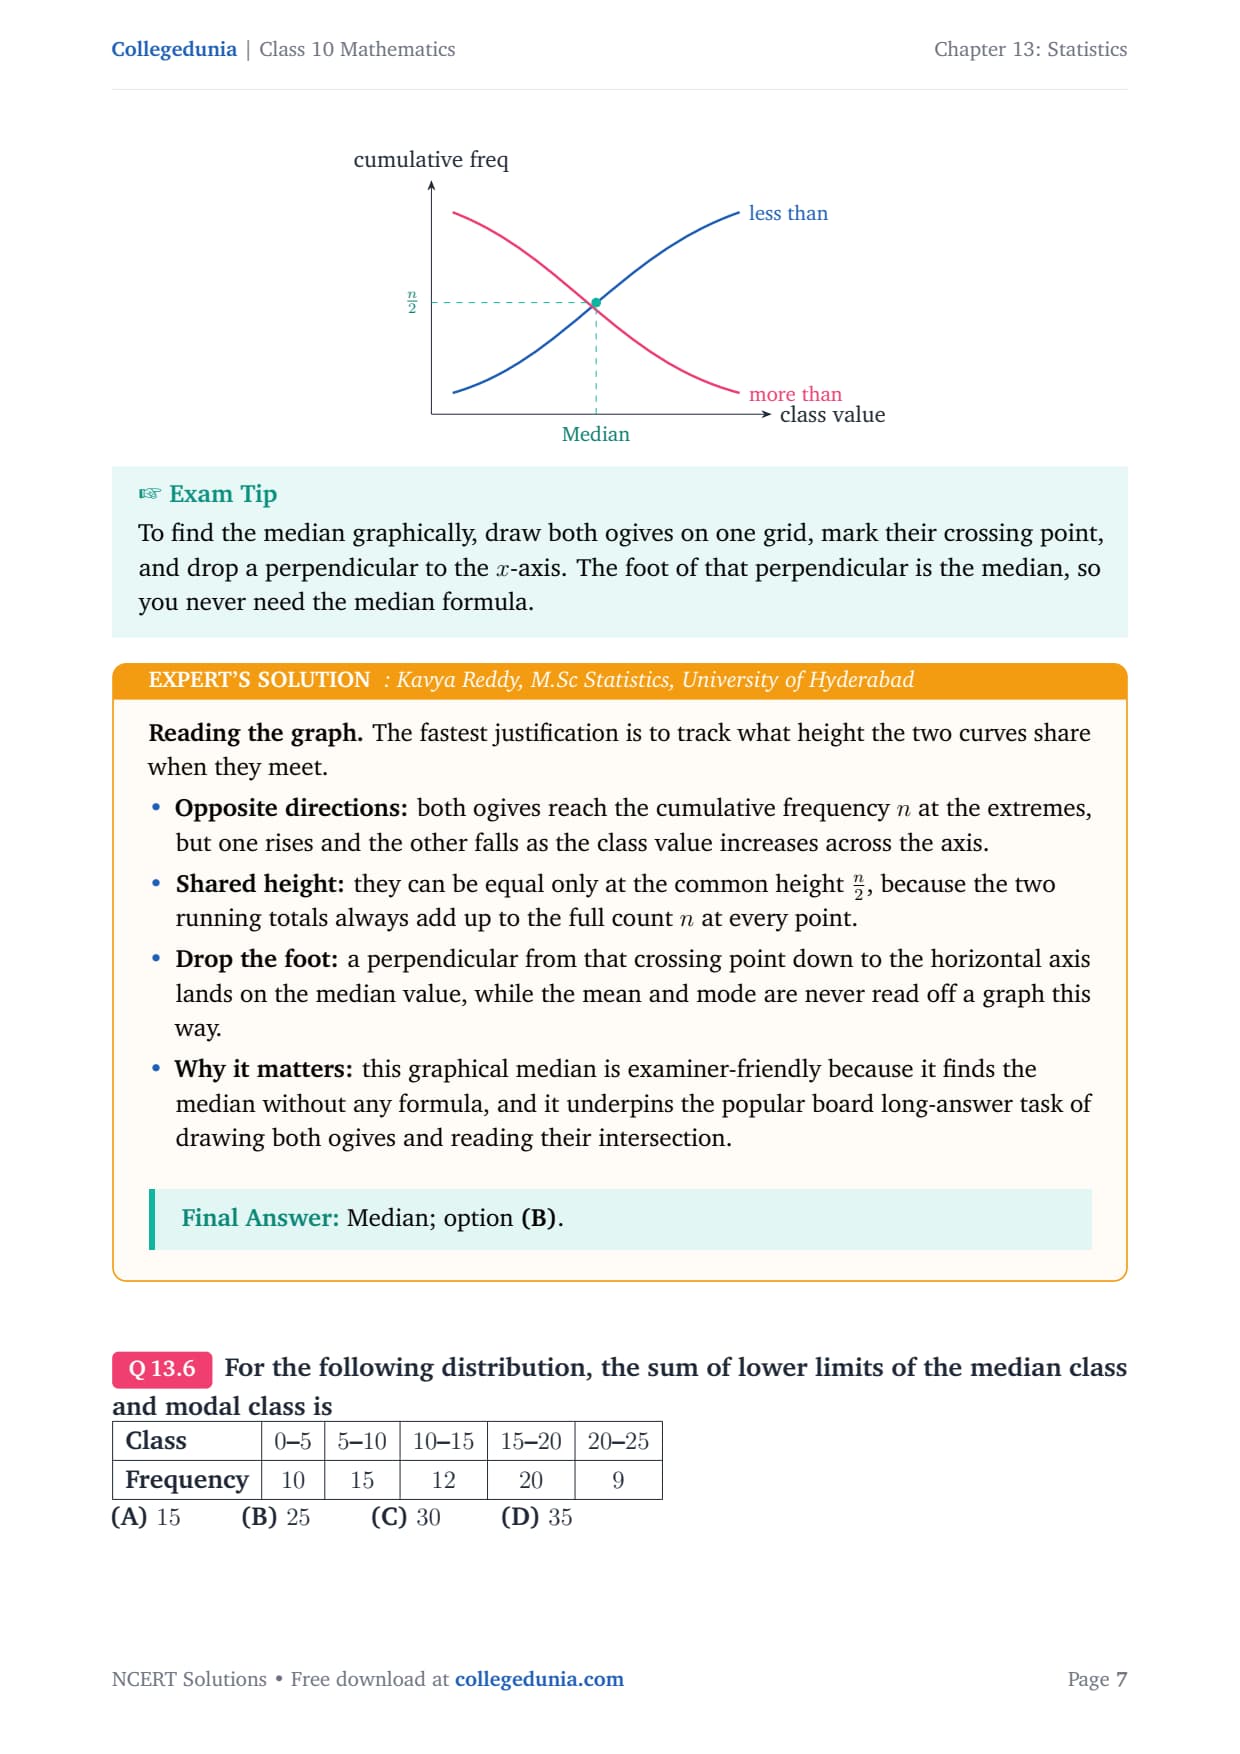
Concept used. An ogive is the graph of a cumulative
frequency distribution. When the less than type ogive and the more than
type ogive are drawn on the same axes, they cross at one point. The
x-coordinate (abscissa) of that crossing point reads off the
median of the data.
Recall what each curve shows: the less than ogive rises with the
running total counted from the bottom; the more than ogive falls
with the running total counted from the top.
At the crossing point both running totals are equal, so each
equals half the total frequency, n2.
The observation value at which exactly n2 items lie
below it is, by definition, the median. So the abscissa of the
intersection is the median.
The abscissa of the intersection of the two ogives is the median; option (B).
KR
Kavya Reddy
M.Sc Statistics, University of Hyderabad
Verified Expert
Reading the graph. The fastest justification is to track what
height the two curves share when they meet.
Opposite directions: both ogives reach the cumulative
frequency n at the extremes, but one rises and the other falls
as the class value increases across the axis.
Shared height: they can be equal only at the common
height n2, because the two running totals always add
up to the full count n at every point.
Drop the foot: a perpendicular from that crossing point
down to the horizontal axis lands on the median value, while the
mean and mode are never read off a graph this way.
Why it matters: this graphical median is
examiner-friendly because it finds the median without any
formula, and it underpins the popular board long-answer task of
drawing both ogives and reading their intersection.
Median; option (B).
Q 13.6
For the following distribution, the sum of lower limits of the median class and modal class is [2pt]
tabular|l|c|c|c|c|c|
Concept used. The median class is the class in which
the cumulative frequency first reaches or passes n2. The
modal class is the class with the highest frequency. We find
the lower limit of each and add them.
Find the total frequency:
n = 10+15+12+20+9 = 66, n2=662=33.
Build the cumulative frequencies:
10, 25, 37, 57, 66. The value 33 first appears in the
class with cumulative frequency 37, which is 10–15. So the
median class is 10–15 and its lower limit is 10.
Find the modal class: the largest frequency is 20, in the
class 15–20. So the modal class is 15–20 and its lower
limit is 15.
Add the two lower limits:
10 + 15 = 25.
Sum of the lower limits =10+15=25; option (B).
AG
Ananya Gupta
M.Sc Mathematics, IIT Kanpur
Verified Expert
Table-first method. Setting up one cumulative column answers
both halves of the question at the same time.
Build the column: the cumulative frequencies run
10,25,37,57,66 with total n=66, so the half-way mark we hunt
for is n2=33.
Place the median class: the value 33 first lands in
the 10–15 row, where the cumulative count jumps from 25 to
37, so the median class lower limit is 10.
Place the modal class: the highest frequency, 20,
sits in 15–20, giving a modal class lower limit of 15, and
the two lower limits add to 25.
Why it matters: many MCQs ask only for lower limits, not
the full median or mode, so noticing that the cumulative column
and the maximum frequency are all you need saves real time in the
exam.
25; option (B).
Q 13.7
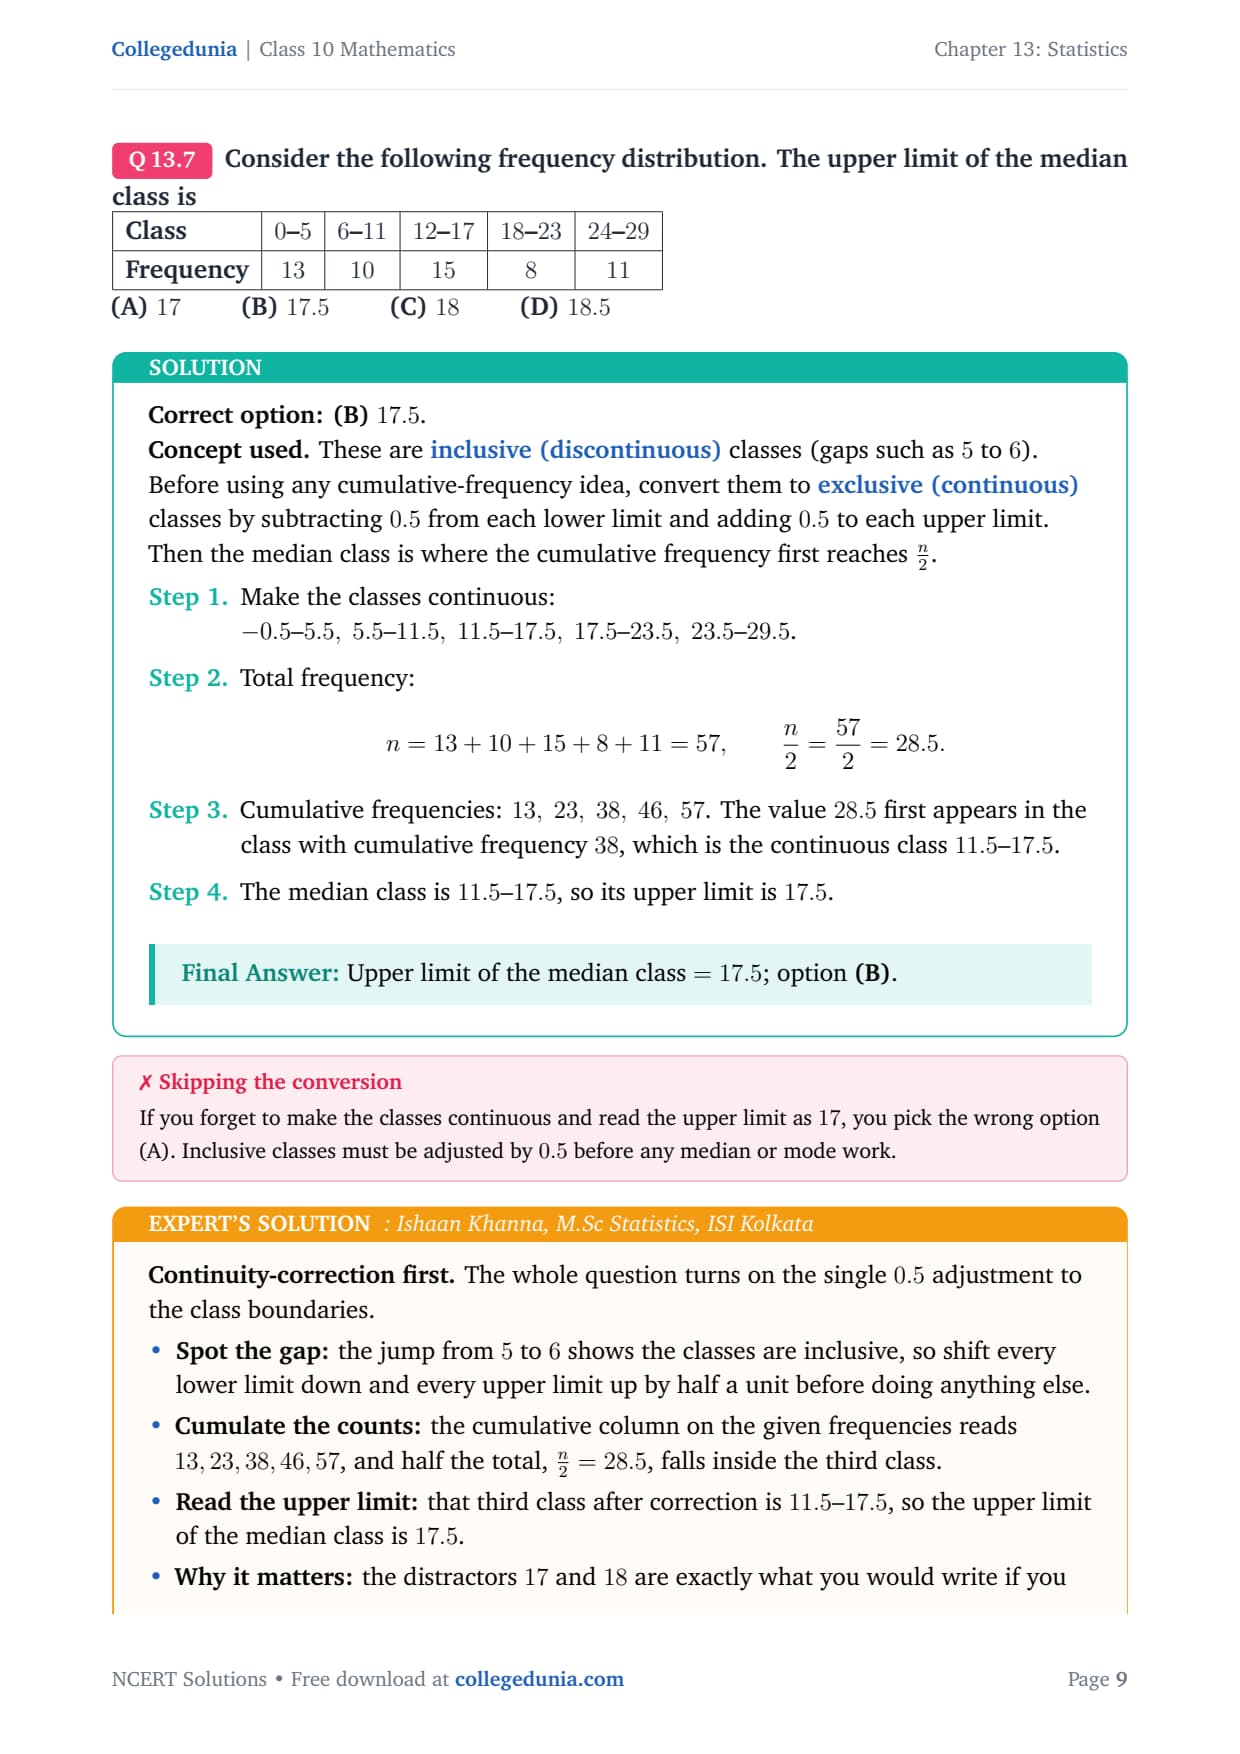
Consider the following frequency distribution. The upper limit of the median class is [2pt]
tabular|l|c|c|c|c|c|
Concept used. These are inclusive (discontinuous)
classes (gaps such as 5 to 6). Before using any cumulative-frequency
idea, convert them to exclusive (continuous) classes by
subtracting 0.5 from each lower limit and adding 0.5 to each upper
limit. Then the median class is where the cumulative frequency first
reaches n2.
Make the classes continuous:
-0.5–5.5, 5.5–11.5, 11.5–17.5, 17.5–23.5, 23.5–29.5.
Total frequency:
n = 13+10+15+8+11 = 57, n2=572=28.5.
Cumulative frequencies: 13, 23, 38, 46, 57. The value
28.5 first appears in the class with cumulative frequency
38, which is the continuous class 11.5–17.5.
The median class is 11.5–17.5, so its upper limit is
17.5.
Upper limit of the median class =17.5; option (B).
IK
Ishaan Khanna
M.Sc Statistics, ISI Kolkata
Verified Expert
Continuity-correction first. The whole question turns on the
single 0.5 adjustment to the class boundaries.
Spot the gap: the jump from 5 to 6 shows the classes
are inclusive, so shift every lower limit down and every upper
limit up by half a unit before doing anything else.
Cumulate the counts: the cumulative column on the given
frequencies reads 13,23,38,46,57, and half the total,
n2=28.5, falls inside the third class.
Read the upper limit: that third class after correction
is 11.5–17.5, so the upper limit of the median class is
17.5.
Why it matters: the distractors 17 and 18 are
exactly what you would write if you skipped the correction, which
is precisely why examiners slip inclusive classes in to test this
one habit.
17.5; option (B).
Q 13.8
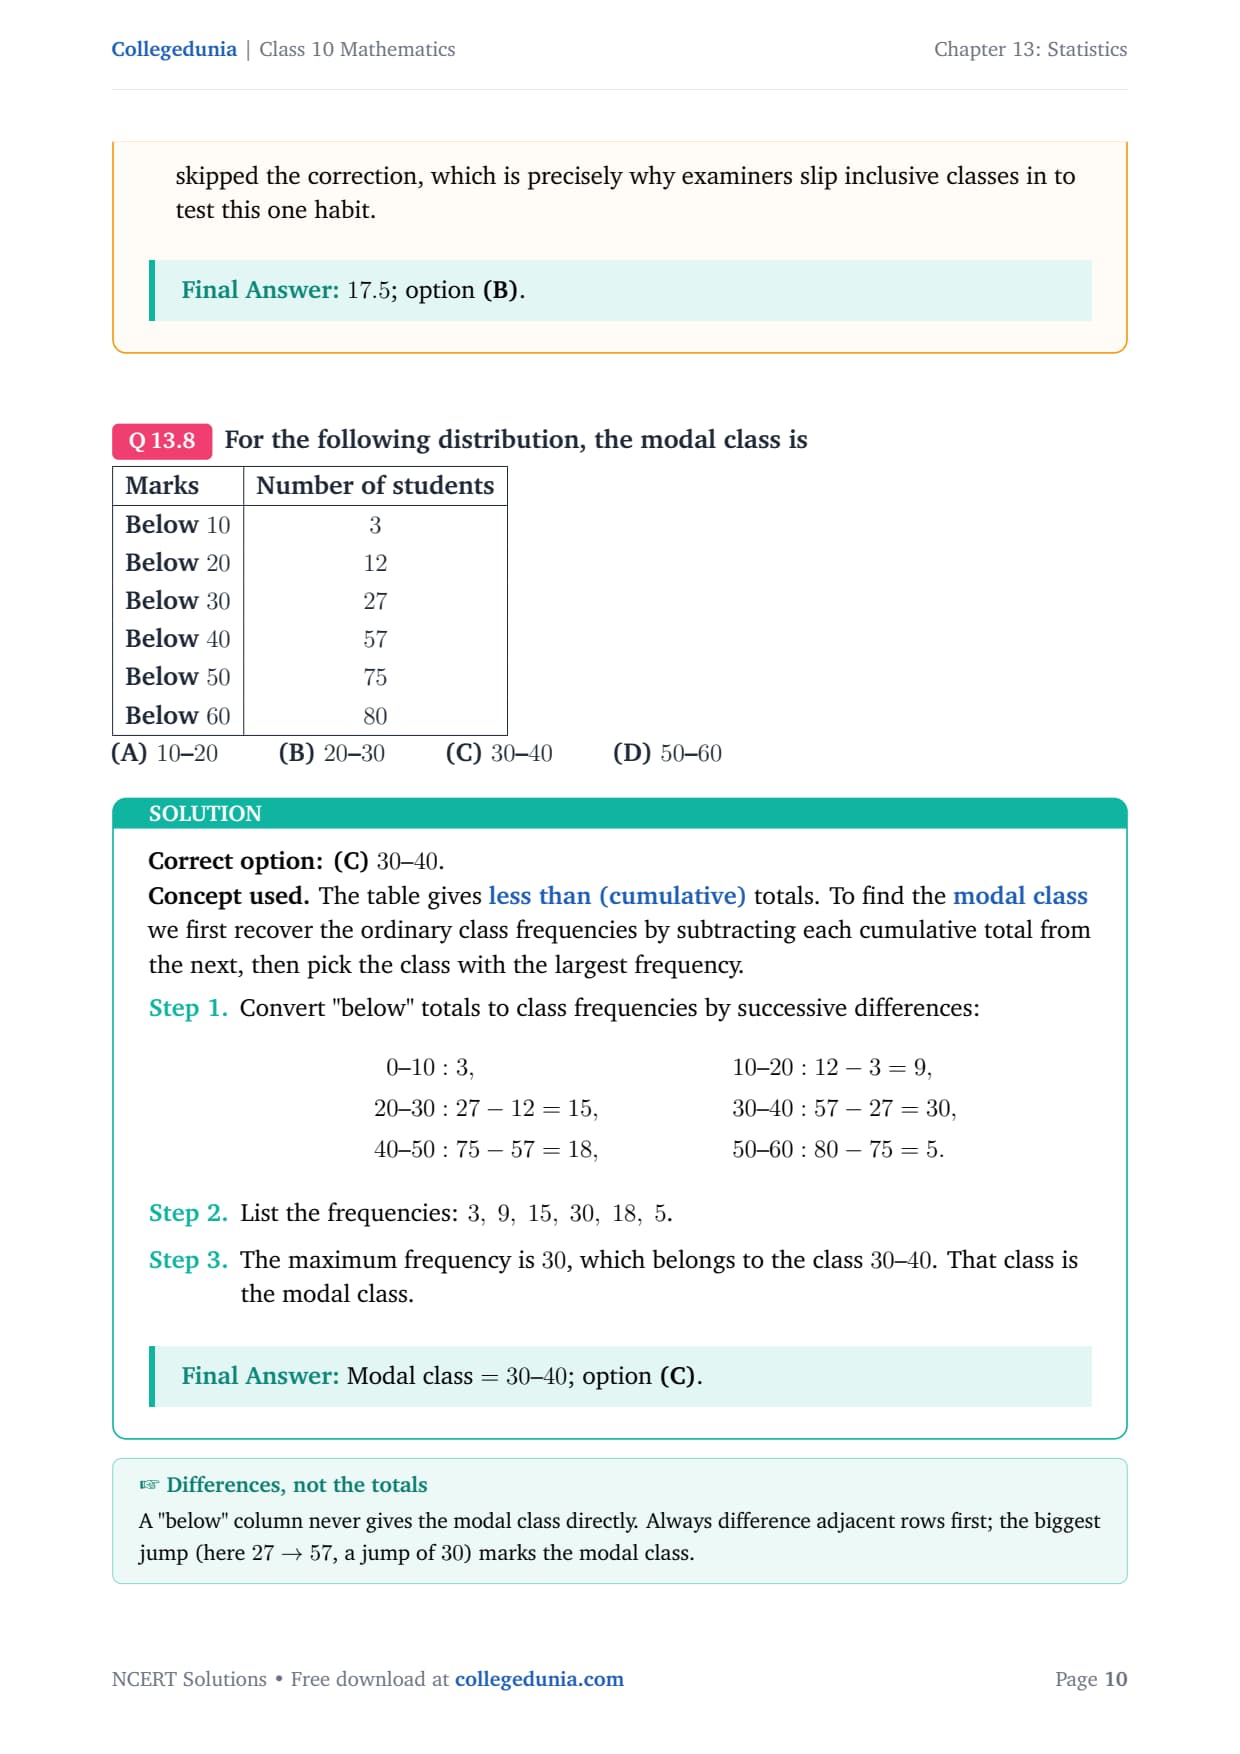
For the following distribution, the modal class is [2pt]
tabular|l|c|
Marks & Number of students
Below 10 & 3
Below 20 & 12
Below 30 & 27
Below 40 & 57
Below 50 & 75
Below 60 & 80
tabular [2pt]
(A) 10–20 (B) 20–30 (C) 30–40 (D) 50–60
Correct option: (C)30–40.
Concept used. The table gives less than (cumulative)
totals. To find the modal class we first recover the ordinary
class frequencies by subtracting each cumulative total from the next,
then pick the class with the largest frequency.
The maximum frequency is 30, which belongs to the class
30–40. That class is the modal class.
Modal class =30–40; option (C).
MJ
Meera Joshi
M.Sc Mathematics, University of Delhi
Verified Expert
Spotting the biggest jump. The modal class is simply wherever the
cumulative total climbs the fastest.
Difference the totals: subtracting each below row from
the next gives the plain class frequencies 3,9,15,30,18,5,
which is the table you actually need.
Find the steepest rise: the largest single jump is 30,
between Below 30 and Below 40, showing where most students
are packed.
Name the modal class: that jump of 30 is the frequency
of the interval 30–40, so the modal class is 30–40.
Why it matters: reading a cumulative table as if it were
a plain frequency table is a classic slip, but training the eye
to hunt for the biggest jump turns this into a five-second
question.
30–40; option (C).
Q 13.9
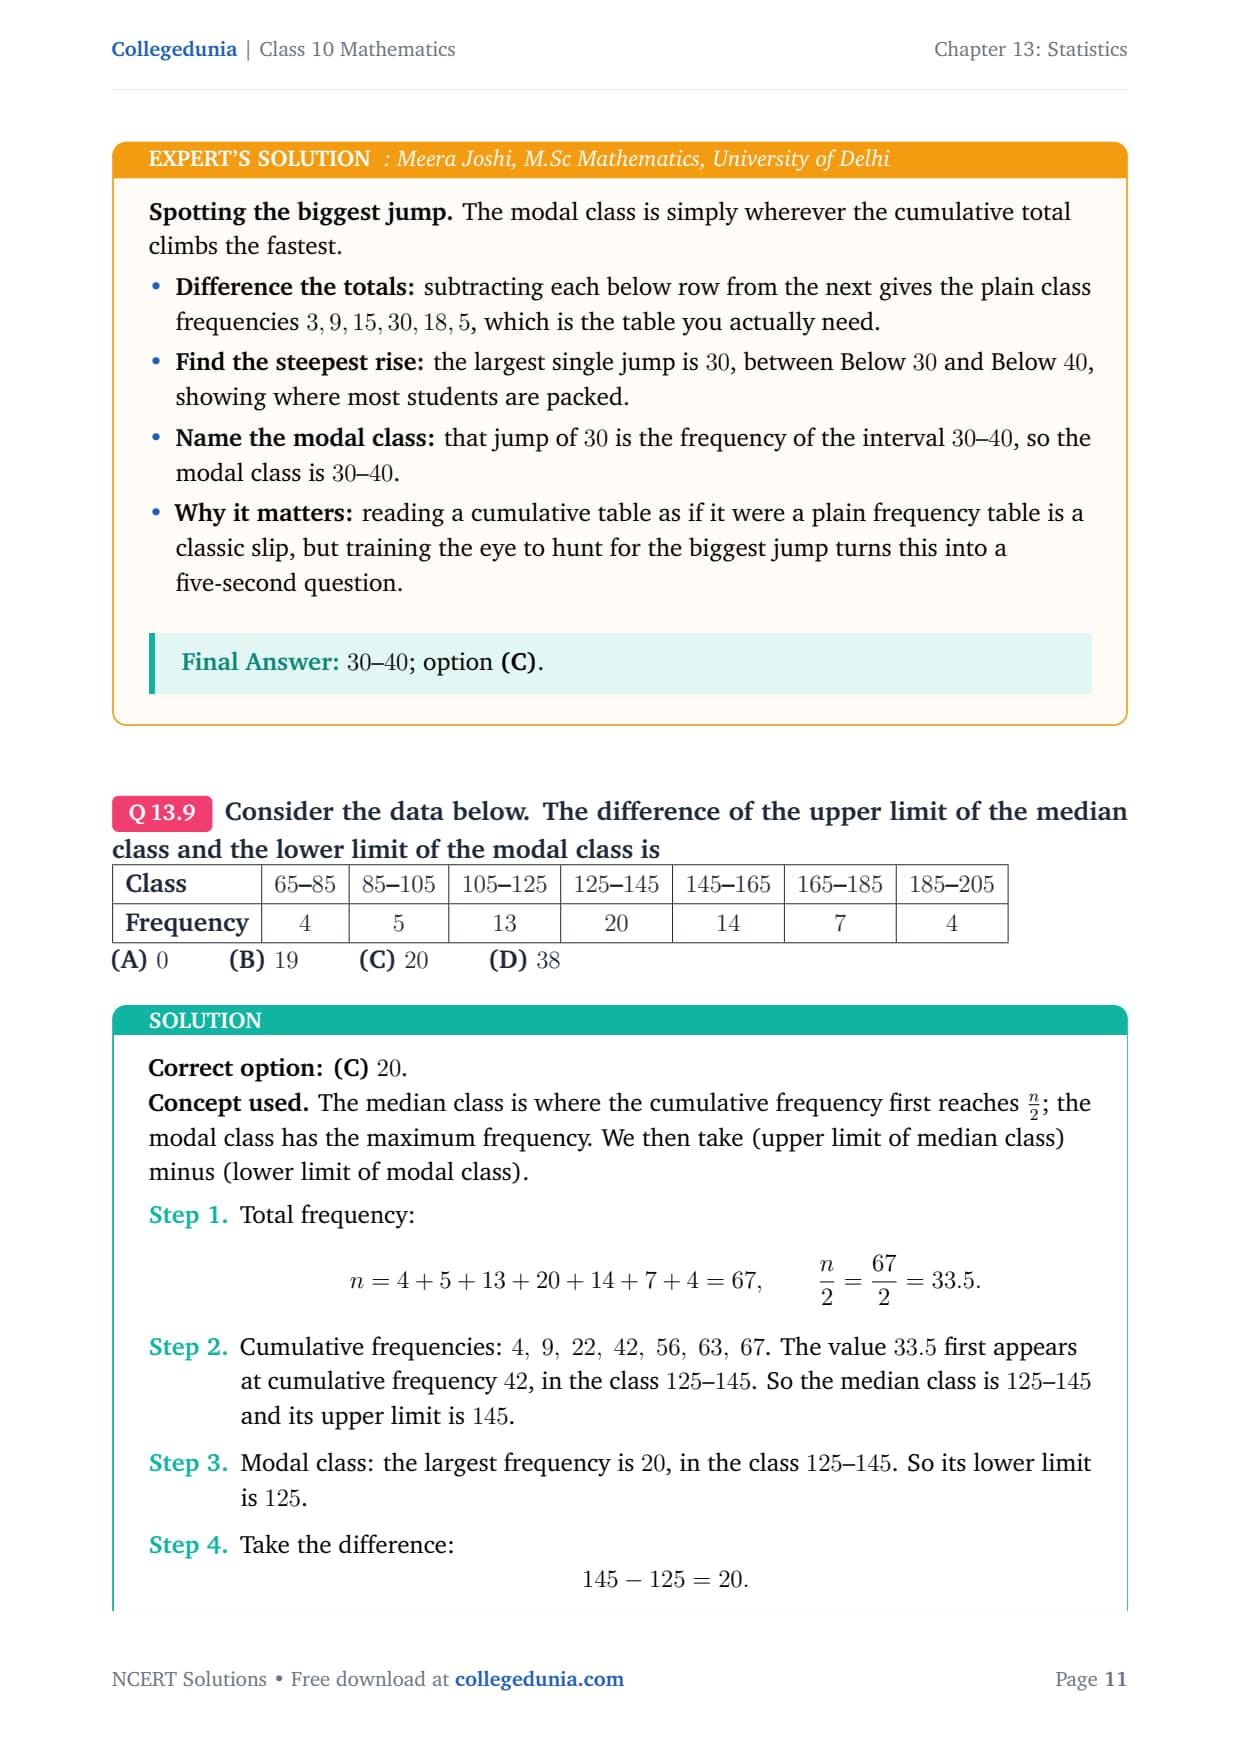
Consider the data below. The difference of the upper limit of the median class and the lower limit of the modal class is [2pt]
tabular|l|c|c|c|c|c|c|c|
Concept used. The median class is where the cumulative
frequency first reaches n2; the modal class has the maximum
frequency. We then take (upper limit of median class) minus (lower limit
of modal class).
Total frequency:
n = 4+5+13+20+14+7+4 = 67, n2=672=33.5.
Cumulative frequencies:
4, 9, 22, 42, 56, 63, 67. The value 33.5 first appears
at cumulative frequency 42, in the class 125–145. So the
median class is 125–145 and its upper limit is 145.
Modal class: the largest frequency is 20, in the class
125–145. So its lower limit is 125.
Take the difference:
145 - 125 = 20.
Difference =145-125=20; option (C).
AM
Aditya Menon
Ph.D Statistics, IIT Kharagpur
Verified Expert
Width in disguise. When the two classes coincide, the answer is
simply the common class width.
Build the column: the cumulative frequencies are
4,9,22,42,56,63,67, and half the total, n2=33.5,
sits in 125–145, so that is the median class with upper limit
145.
Find the peak: the maximum frequency 20 also belongs
to 125–145, making it the modal class with lower limit 125.
Take the difference: subtracting the lower limit of the
modal class from the upper limit of the median class gives
145-125=20, exactly the width shared by every class.
Why it matters: recognising that this difference
collapses to the class width whenever the two classes agree lets
you check the arithmetic instantly, since each class here spans
20 units.
20; option (C).
Q 13.10
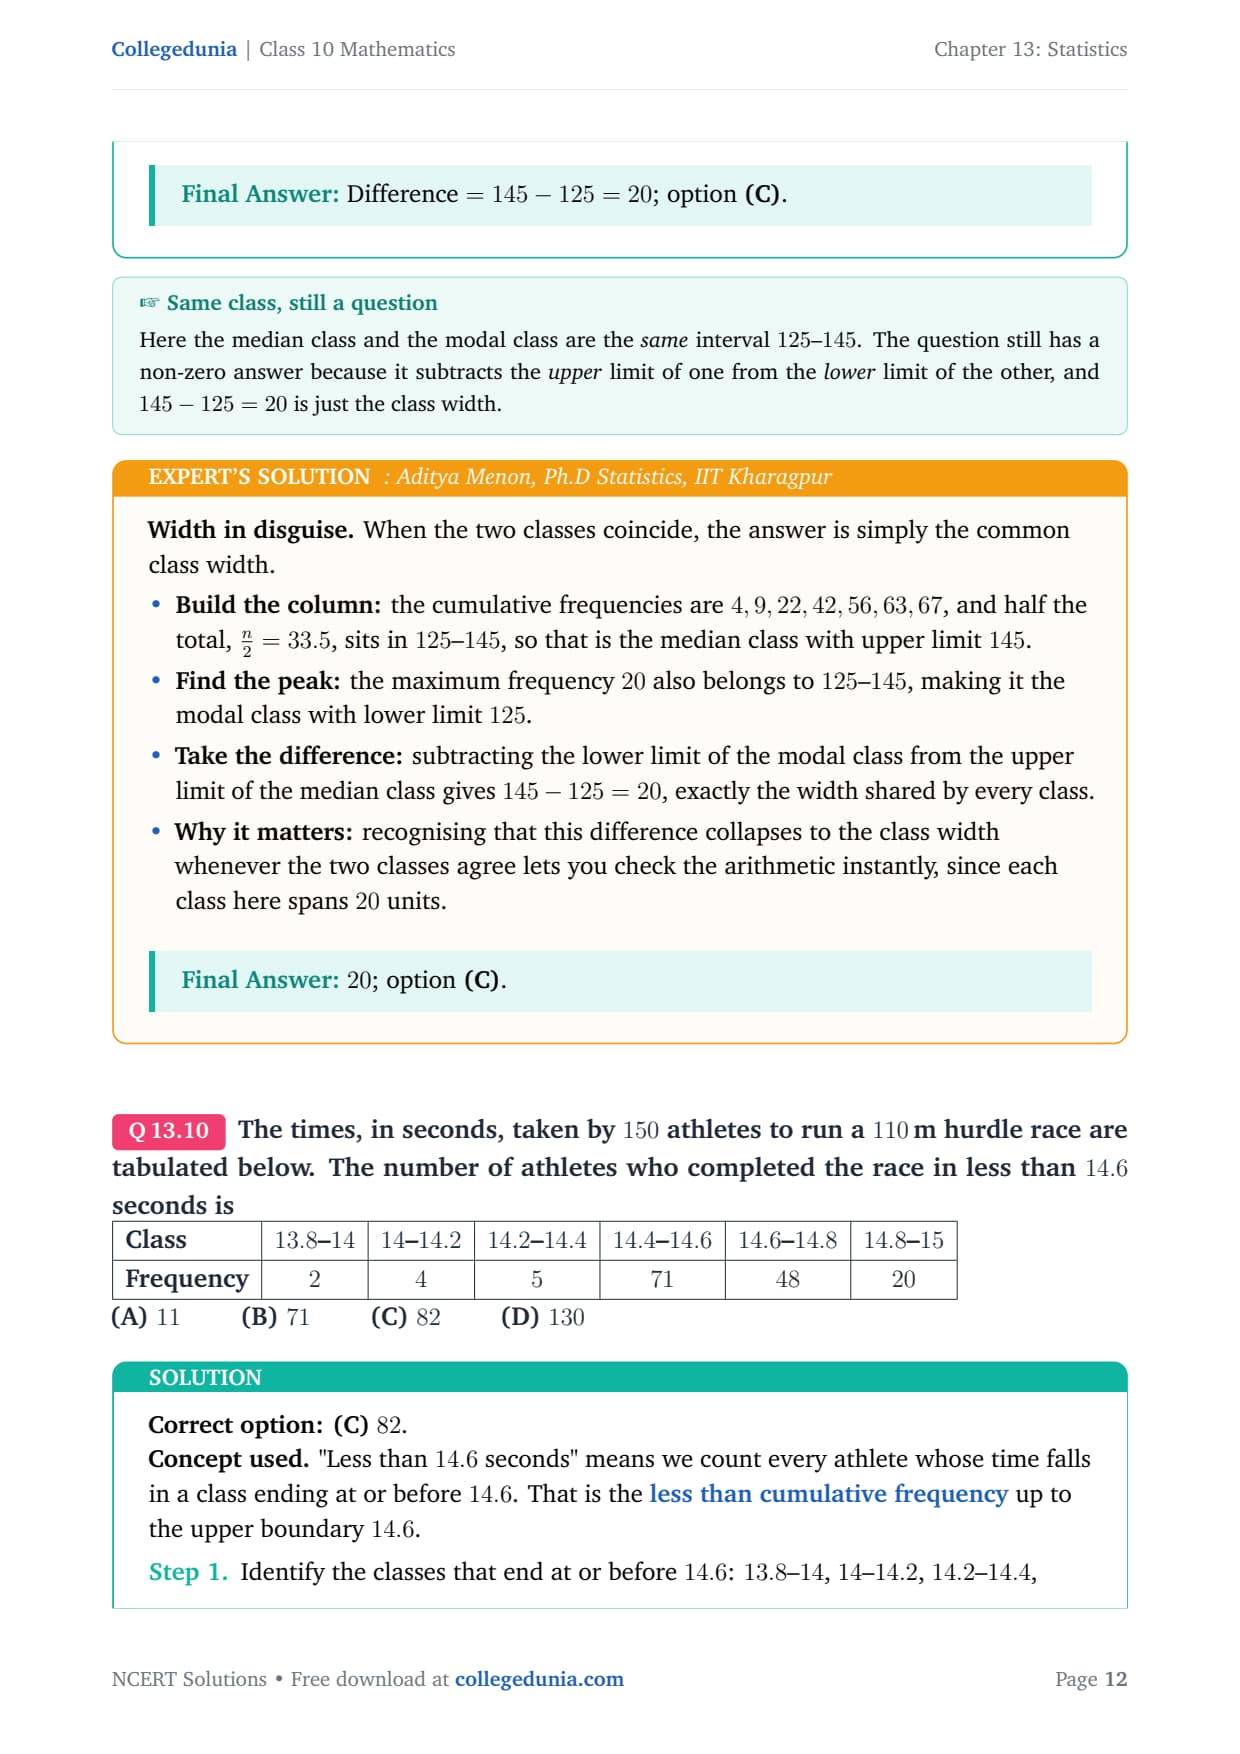
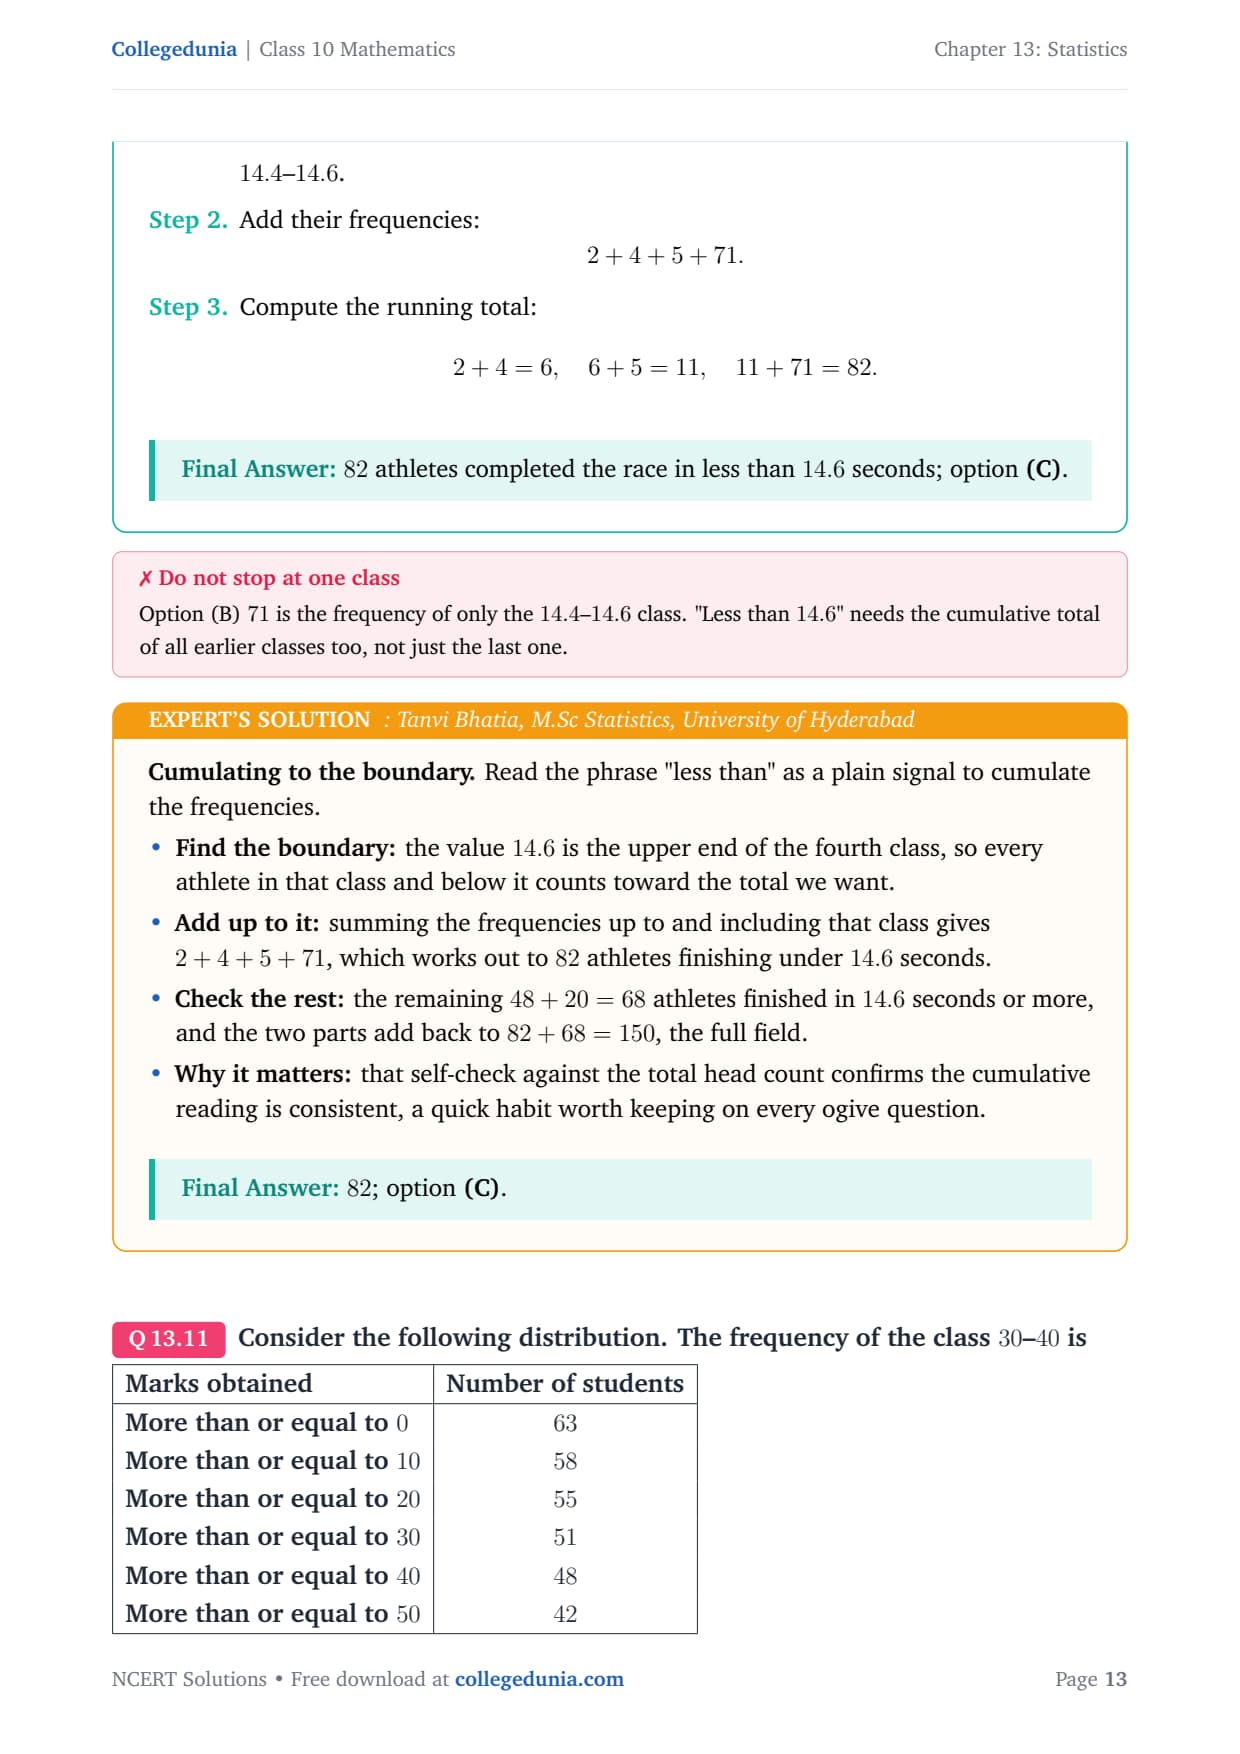
The times, in seconds, taken by 150 athletes to run a 110 m hurdle race are tabulated below. The number of athletes who completed the race in less than 14.6 seconds is [2pt]
tabular|l|c|c|c|c|c|c|
Concept used. "Less than 14.6 seconds" means we count every
athlete whose time falls in a class ending at or before 14.6. That is
the less than cumulative frequency up to the upper boundary
14.6.
Identify the classes that end at or before 14.6:
13.8–14, 14–14.2, 14.2–14.4, 14.4–14.6.
82 athletes completed the race in less than 14.6 seconds; option (C).
TB
Tanvi Bhatia
M.Sc Statistics, University of Hyderabad
Verified Expert
Cumulating to the boundary. Read the phrase "less than" as a
plain signal to cumulate the frequencies.
Find the boundary: the value 14.6 is the upper end of
the fourth class, so every athlete in that class and below it
counts toward the total we want.
Add up to it: summing the frequencies up to and
including that class gives 2+4+5+71, which works out to 82
athletes finishing under 14.6 seconds.
Check the rest: the remaining 48+20=68 athletes
finished in 14.6 seconds or more, and the two parts add back to
82+68=150, the full field.
Why it matters: that self-check against the total head
count confirms the cumulative reading is consistent, a quick
habit worth keeping on every ogive question.
82; option (C).
Q 13.11
Consider the following distribution. The frequency of the class 30–40 is [2pt]
tabular|l|c|
Marks obtained & Number of students
More than or equal to 0 & 63
More than or equal to 10 & 58
More than or equal to 20 & 55
More than or equal to 30 & 51
More than or equal to 40 & 48
More than or equal to 50 & 42
tabular [2pt]
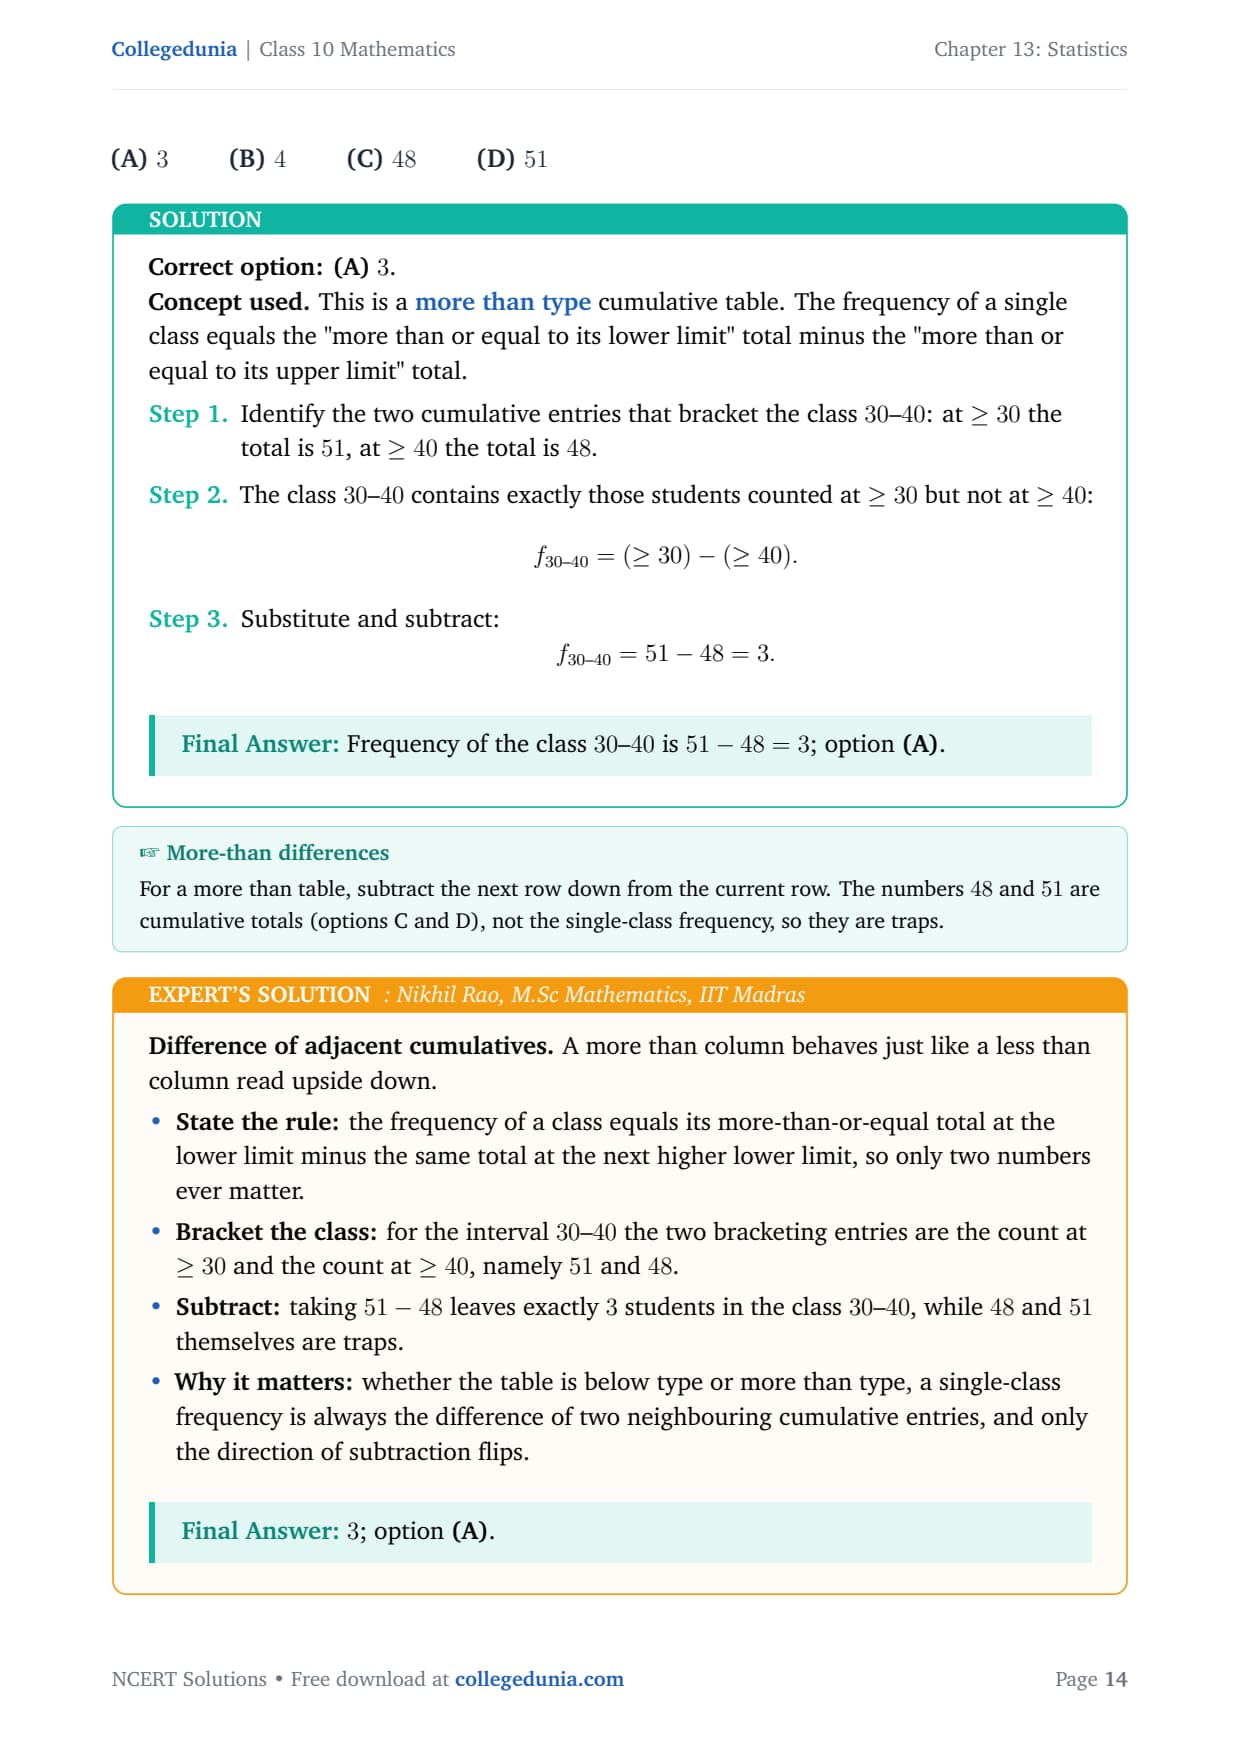
(A) 3 (B) 4 (C) 48 (D) 51
Correct option: (A)3.
Concept used. This is a more than type cumulative
table. The frequency of a single class equals the "more than or equal to
its lower limit" total minus the "more than or equal to its upper limit"
total.
Identify the two cumulative entries that bracket the class
30–40: at ≥ 30 the total is 51, at ≥ 40 the total
is 48.
The class 30–40 contains exactly those students counted at
≥ 30 but not at ≥ 40:
f30--40 = (≥ 30) - (≥ 40).
Substitute and subtract:
f30--40 = 51 - 48 = 3.
Frequency of the class 30–40 is 51-48=3; option (A).
NR
Nikhil Rao
M.Sc Mathematics, IIT Madras
Verified Expert
Difference of adjacent cumulatives. A more than column behaves
just like a less than column read upside down.
State the rule: the frequency of a class equals its
more-than-or-equal total at the lower limit minus the same total
at the next higher lower limit, so only two numbers ever matter.
Bracket the class: for the interval 30–40 the two
bracketing entries are the count at ≥ 30 and the count at
≥ 40, namely 51 and 48.
Subtract: taking 51-48 leaves exactly 3 students in
the class 30–40, while 48 and 51 themselves are traps.
Why it matters: whether the table is below type or more
than type, a single-class frequency is always the difference of
two neighbouring cumulative entries, and only the direction of
subtraction flips.
3; option (A).
Student Feedback
Out of 9,420 students surveyed before the 2026 boards, 68% said Question 7 (upper limit of the median class with inclusive classes) was the hardest MCQ in Exercise 13.1, because many forgot to add 0.5 to convert the classes first. Three in four said spotting the modal class from a "below" cumulative table (Question 8) tripped them up until they practised the successive-difference method. A common trap in Question 11 was reading the cumulative figure directly as the class frequency instead of subtracting adjacent rows.
Source: 2026-27 Class 10 Maths student poll. Sample of 9,420 students from CBSE schools across 14 states.
Other Resources for This Chapter: Statistics Exemplar Exercises
Work through the other Exemplar exercises, then pair them with the matching study resources for Class 10 Maths Chapter 13 Statistics.
Resource
What it covers
Open
Exercise 13.1
MCQs on mean, median, mode, cumulative frequency and ogive intersection.
Frequently Asked Questions on Statistics Exercise 13.1 Exemplar Solutions
Ques. What is Exercise 13.1 in NCERT Exemplar Class 10 Maths Chapter 13?
Ans. Exercise 13.1 is the Multiple Choice Questions section of the NCERT Exemplar for Chapter 13 Statistics. It has 11 MCQs (Q1 to Q11) covering the assumed-mean method, step-deviation method, properties of the mean, ogive intersection, median class and modal class identification, inclusive class conversion, and cumulative frequency reading, according to the 2026-27 CBSE syllabus.
Ques. How many questions are in Exercise 13.1 of NCERT Exemplar Class 10 Maths?
Ans. There are 11 Multiple Choice Questions in Exercise 13.1 of NCERT Exemplar Class 10 Maths Chapter 13 Statistics. They are numbered Q1 to Q11 in the Exemplar book and cover all the major concepts of grouped data statistics.
Ques. Why does the intersection of the two ogives give the median in Question 5?
Ans. The less than ogive rises and the more than ogive falls across the same axis. At every point, the two running totals add up to n (the total frequency). They can be equal only when each equals n/2, which is the definition of the median. So the abscissa (x-coordinate) of the crossing point is the median. A perpendicular from that crossing point to the horizontal axis gives the median value directly, without any formula.
Ques. Why is the answer 17.5 and not 17 in Question 7 of Exercise 13.1?
Ans. The classes in Question 7 (0-5, 6-11, 12-17...) are inclusive or discontinuous classes, which means there is a gap between consecutive classes. Before finding the median class, students must convert them to exclusive (continuous) classes by subtracting 0.5 from each lower limit and adding 0.5 to each upper limit. So the class 12-17 becomes 11.5-17.5 after conversion. This makes its upper limit 17.5, not 17. If you skip this step, you land on option (A), which is a deliberate distractor.
Ques. How do you find the class frequency from a more-than type cumulative table as in Question 11?
Ans. In a more-than type cumulative table, the frequency of any class equals the cumulative count at the lower limit of that class minus the cumulative count at the next higher lower limit. For the class 30-40 in Question 11: frequency = (more than or equal to 30) - (more than or equal to 40) = 51 - 48 = 3. The values 48 and 51 are cumulative totals placed as distractors. Whether the table is a "below" type or a "more than" type, the single-class frequency is always the difference of two adjacent cumulative entries.







Comments