



The Russell Group of Universities is a group of 24 universities recognized for their academic excellence, research, innovation, education, employment, and learning. They are known for generating high-quality doctors and dentists in the UK. The acceptance rate for the Russell Group of Universities varies widely. The University of Oxford has the lowest acceptance rate of 21% whereas Exeter and Newcastle have the highest acceptance rate, ranging from 80-85%. The factors influencing acceptance rate depend on criteria such as global demands, number of seats, reputation, as well as academic standards, and the following sections will explore how.
What is the Acceptance Rate?
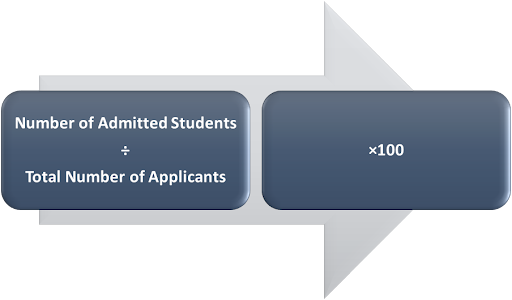
Acceptance Rate is the percentage of applicants who are admitted to the institution in a given application cycle.
Russell Group of Universities Acceptance Rate 2024
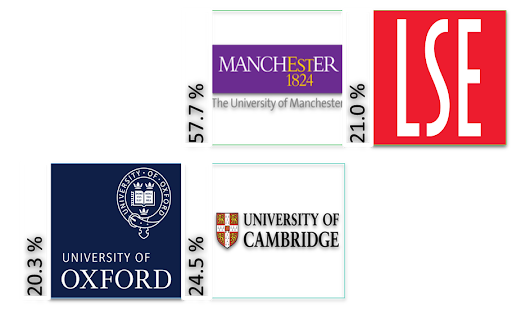
According to the data published in the Tab, the University of Oxford is the hardest among the Russell Group of Universities to get into, with an acceptance rate of 20.3%. It is followed by the London School of Economics and the University of Cambridge at 21% and 24.5% respectively.
On the other hand, the University of Exeter is the easiest university when it comes to selection, with an acceptance rate of 85%.
The table elaborates the acceptance rate as per the UCAS 2024 data for the Russell Group of Universities.
| University | Estimated Acceptance Rate | QS World University Ranking (2026) |
|---|---|---|
| University of Oxford | 20.3 % | 4 |
| London School of Economics Political Science (LSE) | 21.0 % | 56 |
| University of Cambridge | 24.5 % | 6 |
| Imperial College London | 32.8 % | 2 |
| University College London (UCL) | 35.2 % | 9 |
| University of Edinburgh | 43.6 % | 34 |
| King’s College London (KCL) | 44.3 % | 31 |
| University of Manchester | 57.7 % | 35 |
| University of Leeds | 59.9 % | 86 |
| Queen Mary University of London | 64.5 % | 110 |
| University of Glasgow | 66.5 % | 79 |
| University of Bristol | 67.6 % | 51 |
| Durham University | 67.6 % | 94 |
| University of Birmingham | 69.6 % | 76 |
| University of Nottingham | 70.1 % | 97 |
| University of Warwick | 70.8 % | 74 |
| University of Liverpool | 73.2 % | 147 |
| Cardiff University | 73.4 % | 181 |
| Queen’s University Belfast | 73.5 % | 199 |
| University of Southampton | 76.5 % | 87 |
| University of Sheffield | 77.7 % | 92 |
| University of York | 79.3 % | 169 |
| Newcastle University | 80.2 % | 137 |
| University of Exeter | 85.1 % | 155 |
Russell Group of Universities Acceptance Rate Trends
As per the data listed in the table, most of the Russell Group of Universities have an acceptance rate ranging from 10-20% with the London School of Economics being the most difficult to gain entrance to.
| University | Applications | Acceptance rate | Year |
|---|---|---|---|
| Oxford | 23211 | 13.9% | 2023 |
| LSE | 28239 | 6.5% | 2025 |
| Cambridge | 21445 | 16.6% | 2023 |
| UCL | 79082 | 8.9% | 2024 |
| Imperial | 30739 | 10.2% | 2023 |
| KCL | 70252 | 11.0% | 2023 |
| Edinburgh | 66293 | 11.0% | 2024 |
| Leeds | 49947 | 11.2% | 2023 |
| Manchester | 71063 | - | 2019 |
| Bristol | 61030 | 12.0% | 2022 |
| Glasgow | 42901 | 14.8% | 2022 |
| Warwick | 48026 | 12.6% | 2024 |
| Newcastle | 36131 | 19.8% | 2023 |
| Durham | 32995 | - | 2023 |
| Nottingham | 51897 | - | 2020 |
| Sheffield | 33027 | 19.5% | 2022 |
Also, read - Reasons to Study in the UK
University of Oxford
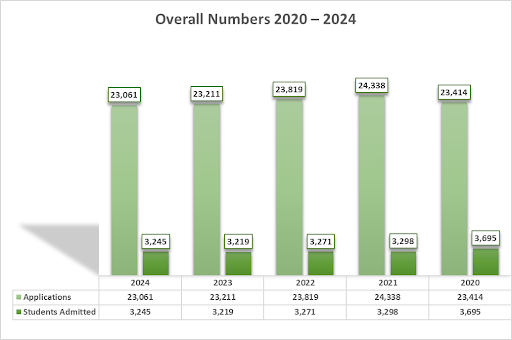
The number of students admitted to the University of Oxford in 2024 was 3,245 out of the total number of 23,061 applications. This number increased from last year’s number, where only 3,219 students were admitted. The chart shows the overall number of applications and students admitted to the University of Oxford.
Further, the number of students admitted from multiple regions has been categorized in the table below.
| Country | Applications | Number of Students Admitted |
|---|---|---|
| UK | 43,899 | 7,768 |
| China | 6,372 | 566 |
| United States of America | 2,629 | 172 |
| India | 1,757 | 74 |
| Singapore | 1,754 | 257 |
| Hong Kong | 1,257 | 148 |
| Canada | 848 | 36 |
| Germany | 762 | 48 |
| Malaysia | 679 | - |
| France | 591 | 51 |
| Spain | 517 | - |
Also, read - The Student’s Guide to Study in the UK
University of Edinburgh
The University of Edinburgh received the highest number of applications in 2022, followed by a decline in 2024 at 66,293 applications, as shown in the table below.
| Cycle | Applications | Offers | Acceptances |
|---|---|---|---|
| 2020 | 62,224 | 31,510 | 7,344 |
| 2021 | 68,960 | 32,434 | 8,083 |
| 2022 | 75,444 | 25,212 | 6,111 |
| 2023 | 69,377 | 27,608 | 6,409 |
| 2024 | 66,293 | 31,132 | 7,302 |
London School of Economics
The London School of Economics reported some of the highest numbers of Indian applicants from undergraduate programs in accounting and finance, with more than 200 total applications. The table categorizes total applicants and Indian applicants, along with the registrations for a few programs at LSE.
| Program | Total Applications | Total Registrations | Indian Applications | Indian Registrations |
|---|---|---|---|---|
| Erasmus Reciprocal Programme of Study | 31 | <10 | <10 | <10 |
| General Course | 338 | <10 | 15 | <10 |
| BA in Anthropology and Law | 260 | 28 | <10 | <10 |
| BA in Geography | 338 | 44 | <10 | <10 |
| BA in History | 441 | 52 | <10 | <10 |
| BA in Social Anthropology | 195 | 28 | <10 | <10 |
| BSc in Accounting and Finance | 1788 | 146 | 120 | <10 |
| BSc in Actuarial Science | 443 | 78 | 24 | <10 |
| BSc in Econometrics and Mathematical Economics | 271 | <10 | 57 | <10 |
| BSc in Economic History | 243 | 39 | <10 | <10 |
| BSc in Economic History and Geography | 53 | 12 | <10 | <10 |
| BSc in Economic History with Economics | 77 | <10 | <10 | <10 |
| BSc in Economics | 3315 | 265 | 379 | <10 |
| MSc in International Strategy and Diplomacy | 109 | 35 | <10 | <10 |
| MSc in Economics and Management | 412 | 28 | 50 | <10 |
| MSc in Gender, Policy and Inequalities | 90 | 16 | <10 | <10 |
| MPhil/PhD in Health Policy and Health Economics | 92 | 10 | <10 | <10 |
While there are differences in the acceptance rates for the Russell Group of Universities, it is not a determinant of university excellence. The best university in the Russell Group is ultimately decided by the preferences and satisfaction of the applicants.
FAQ
Ques. Can I deduce that a lower acceptance rate represents a better Russell Group University?
Ans. A high acceptance rate does not mean that the university has low standards. Similarly, the university with a low acceptance rate does not define its quality rather how competitive it is to enter universities. For example, Newcastle University and the University of Edinburgh belong to the Russell Group of Universities. Both are prestigious universities known for their excellence. However, the University of Edinburgh has an acceptance rate of 43.6% in contrast to the high acceptance rate at Newcastle University, with 80%. The acceptance rate is influenced by a number of factors, some of which are mentioned below.
Ques. Which Russell Group of Universities is easiest to get into?
Ans. Liverpool, Queen Mary University of London, Nottingham, Sheffield, York, Newcastle, and Cardiff are some easiest Russell Group of Universities with higher acceptance rates.
Ques. What factors influence the acceptance rate for Russell Group Universities?
Ans. Acceptance rate at Russell Group of Universities is dependent on multiple factors, such as the ones mentioned below.
- Number of Applicants - Acceptance rate is indirectly proportional to the number of applicants. The higher the number of applicants, the lower the acceptance rate.
- Number of seats available - It is often noted that acceptance rates are lower when the availability of seats is lower at any university. This occurs when the university is offering any specialization with high competitiveness.
- Accolades, achievements, ranking - Those universities that have high achievements or have been ranked on a global scale tend to attract more applicants. Thus, lowering the acceptance rate.
- Admission Requirements - The university with a high standardized admission process reduces the chances of entry for a large number of applicants.
- Financial Aids - Scholarships and funding provided by universities attract a larger number of applicants, thus influencing the acceptance rate.
Ques. Do lower acceptance rates guarantee higher rankings for Russell Group Universities?
Ans. Rankings for universities are decided by many factors such as teaching quality, faculty, student outcomes, and reputation around the world. Acceptance rates can be one of the criteria to determine ranking, but not the sole criterion. Acceptance rates only signify the selection level based on the number of applicants admitted out of the total applications received.
Ques. Which Russell Group of Universities is hardest to get into?
Ans. Oxford, Cambridge, LSE, Imperial College London, and UCL are among the hardest Russell Group of Universities with lower acceptance rates and higher entrance standards.

1718112873.jpg?tr=w-305,h-145,c-force?h=40&w=40&mode=stretch)



Comments