


The SAT score chart helps you understand the SAT scoring process. The SAT comprises 2 sections: Reading & Writing, and Math. Each section is first scored with a raw score. Here is the SAT scoring chart that comprises the SAT sections and corresponding maximum raw points. These points are calculated based on the total number of questions in each section. The raw score is later converted into a scaled score.
| Sections | Maximum Raw Points |
|---|---|
| Reading | 52 |
| Writing and Language | 44 |
| Math | 58 |
SAT Math Score Conversion Chart
Check the SAT score chart for raw score conversion for the SAT Math section:
| Math Raw Score | Math Scaled Score |
|---|---|
| 58 | 800 |
| 57 | 790 |
| 56 | 780 |
| 55 | 760 |
| 54 | 750 |
| 53 | 740 |
| 52 | 730 |
| 51 | 710 |
| 50 | 700 |
| 49 | 690 |
| 48 | 680 |
| 47 | 670 |
| 46 | 670 |
| 45 | 660 |
| 44 | 650 |
| 43 | 640 |
| 42 | 630 |
| 41 | 620 |
| 40 | 610 |
| 39 | 600 |
| 38 | 600 |
| 37 | 590 |
| 36 | 580 |
| 35 | 570 |
| 34 | 560 |
| 33 | 560 |
| 32 | 550 |
| 31 | 540 |
| 30 | 530 |
| 29 | 520 |
| 28 | 520 |
| 27 | 510 |
| 26 | 500 |
| 25 | 490 |
| 24 | 480 |
| 23 | 480 |
| 22 | 470 |
| 21 | 460 |
| 20 | 450 |
| 19 | 440 |
| 18 | 430 |
| 17 | 420 |
| 16 | 410 |
| 15 | 390 |
| 14 | 380 |
| 13 | 370 |
| 12 | 360 |
| 11 | 340 |
| 10 | 330 |
| 9 | 320 |
| 8 | 310 |
| 7 | 290 |
| 6 | 280 |
| 5 | 260 |
| 4 | 240 |
| 3 | 230 |
| 2 | 210 |
| 1 | 200 |
| 0 | 200 |
This is the new SAT raw score conversion chart made as per the update made by the College Board. In the old SAT, Reading and Writing were separate sections. But according to the new SAT pattern, these 2 sections are combined under the Evidence-based Reading and Writing (EBRW) section.
SAT Reading and Writing Score Conversion Chart
The raw score obtained in the Reading and Writing section is converted into 2 scaled scores, each on a range of 10-40. The scaled scores of these 2 sections are added together and multiplied by 10 to obtain the combined scaled score of the section. Check the SAT scaled score chart for the SAT Reading and Writing section.
| Raw Score | Reading Scaled Score | Writing and Language Scaled Score |
|---|---|---|
| 52 | 40 | - |
| 51 | 40 | - |
| 50 | 39 | - |
| 49 | 38 | - |
| 48 | 38 | - |
| 47 | 37 | - |
| 46 | 37 | - |
| 45 | 36 | - |
| 44 | 35 | 40 |
| 43 | 35 | 39 |
| 42 | 34 | 38 |
| 41 | 33 | 37 |
| 40 | 33 | 36 |
| 39 | 32 | 35 |
| 38 | 32 | 34 |
| 37 | 31 | 34 |
| 36 | 31 | 33 |
| 35 | 30 | 32 |
| 34 | 30 | 32 |
| 33 | 29 | 31 |
| 32 | 29 | 30 |
| 31 | 28 | 30 |
| 30 | 28 | 29 |
| 29 | 27 | 28 |
| 28 | 26 | 28 |
| 27 | 26 | 27 |
| 26 | 25 | 26 |
| 25 | 25 | 26 |
| 24 | 24 | 25 |
| 23 | 24 | 25 |
| 22 | 23 | 24 |
| 21 | 23 | 23 |
| 20 | 22 | 23 |
| 19 | 22 | 22 |
| 18 | 21 | 21 |
| 17 | 21 | 21 |
| 16 | 20 | 20 |
| 15 | 20 | 19 |
| 14 | 19 | 19 |
| 13 | 19 | 18 |
| 12 | 19 | 17 |
| 11 | 17 | 16 |
| 10 | 17 | 16 |
| 9 | 16 | 15 |
| 8 | 15 | 14 |
| 7 | 15 | 13 |
| 6 | 14 | 13 |
| 5 | 13 | 12 |
| 4 | 12 | 11 |
| 3 | 11 | 10 |
| 2 | 10 | 10 |
| 1 | 10 | 10 |
| 0 | 10 | 10 |
The SAT Reading score chart is based on the highest possible raw point, which is 52 and the Writing and Language score chart is based on the highest possible raw points which is 44.
Understanding SAT Raw and Scaled Scores
To understand the SAT raw score, you need to understand 2 concepts about SAT scoring:
- A raw score is calculated with the number of right answers you got.
- A scaled score helps make a comprehensive grading score out of 1600. The score chart is released by the College Board on its official website.
SAT Raw Score
The SAT raw score is a factor that determines correct answers out of total answers attempted which is later multiplied by 10 to get the scaled score. The SAT raw score for different sections of the exam are given below.
- SAT Reading: It consists of 52 questions, which mark the total raw score as 52.
- SAT Writing and Language: It consists of 44 questions, which mark the total raw score as 44.
- SAT Math: It consists of 58 questions, which mark the total raw score as 58.
SAT Scaled Score
Once done with calculating the SAT raw score, the next step is to refer to the SAT score chart. This chart is available on the official College Board website, and it helps get the scaled score for a particular section. The EBRW and Maths carry a maximum scaled score of 800 each.
SAT Score Range Chart
The SAT score conversion chart may vary in terms of SAT dates as the questions and difficulty level in the exam. You need to calculate your raw scores by referring to the official SAT score chart on the College Board website.
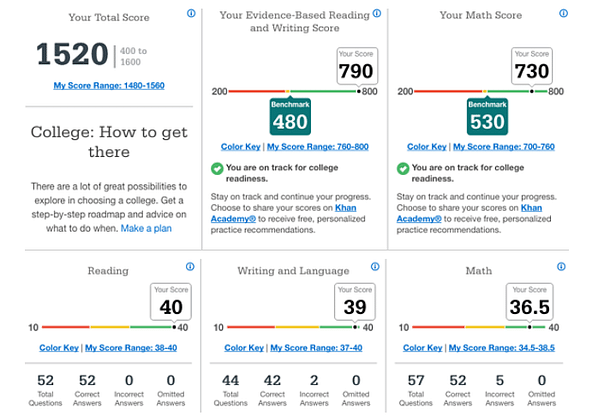
The College Board provides a breakdown for the incorrect, correct, and omitted answers attempted by the candidate. The SAT score report contains final scaled scores.
SAT Score Percentile
In addition to the aggregate SAT score, which ranges from 400 to 1600, you will also receive a percentile, which ranges from 1 to 99. The Evidence-Based Reading and Writing (EBRW) and Math sections assign you a percentile based on the total composite score.
The SAT percentile chart compares your scores to those of the other test-takers. For example, someone who had a percentile of 76 would have outperformed 76% of students on the test. An individual who scored 47 percentile on the Math test outperformed 47% of other pupils. Given below is the SAT percentile chart for a better understanding of SAT scores:

SAT and ACT Score Conversion Chart
Both SAT and ACT are conducted to examine your academic reasoning skills, which consist of reading, writing, mathematics, etc. Both exams determine whether candidates can get selected into colleges abroad or not. As ACT and SAT scores are equally accepted for college admission, candidates can choose any test to appear. The SAT-ACT score comparison chart will help determine the target score.
The SAT Score Range is 400-1600, while the ACT score range from 1-36. Here is the clear comparison between ACT vs SAT for your help:
| ACT Score | SAT Score | SAT Score Range | ACT Percentile |
|---|---|---|---|
| 36 | 1590 | 1570-1600 | 100 |
| 35 | 1540 | 1530-1560 | 99 |
| 34 | 1500 | 1490-1520 | 99 |
| 33 | 1460 | 1450-1480 | 98 |
| 32 | 1430 | 1420-1440 | 97 |
| 31 | 1400 | 1390-1410 | 95 |
| 30 | 1370 | 1360-1380 | 93 |
| 29 | 1340 | 1330-1350 | 91 |
| 28 | 1310 | 1300-1320 | 89 |
| 27 | 1280 | 1260-1290 | 86 |
| 26 | 1240 | 1230-1250 | 82 |
| 25 | 1210 | 1200-1220 | 78 |
| 24 | 1180 | 1160-1190 | 74 |
| 23 | 1140 | 1130-1150 | 69 |
| 22 | 1110 | 1100-1120 | 63 |
| 21 | 1080 | 1060-1090 | 58 |
| 20 | 1040 | 1030-1050 | 51 |
| 19 | 1010 | 990-1020 | 45 |
| 18 | 970 | 960-980 | 39 |
| 17 | 930 | 920-950 | 32 |
| 16 | 890 | 880-910 | 26 |
| 15 | 850 | 830-870 | 20 |
| 14 | 800 | 780-820 | 14 |
| 13 | 760 | 730-770 | 8 |
| 12 | 710 | 690-720 | 4 |
| 11 | 670 | 650-680 | 1 |
| 10 | 630 | 620-640 | 1 |
| 9 | 590 | 590-610 | 1 |
New vs Old SAT Score Conversion Chart
Here is the old vs new SAT conversion chart:
| 1600 Score | Equivalent Scores in the 600-2400 range | 1600 Percentiles |
|---|---|---|
| 1600 | 2400 | 99 |
| 1590 | 2390 | 99 |
| 1580 | 2390 | 99 |
| 1570 | 2380 | 99 |
| 1560 | 2360 or 2370 | 99 |
| 1550 | 2350 | 99 |
| 1540 | 2330 or 2340 | 99 |
| 1530 | 2320 | 99 |
| 1520 | 2300 or 2310 | 99 |
| 1510 | 2290 | 99 |
| 1500 | 2270 or 2280 | 99 |
| 1490 | 2250 or 2260 | 99 |
| 1480 | 2240 | 99 |
| 1470 | 2220 or 2230 | 98-99 |
| 1460 | 2210 | 98 |
| 1450 | 2190 or 2200 | 98 |
| 1440 | 2180 | 98 |
| 1430 | 2160 or 2170 | 98 |
| 1420 | 2150 | 97 |
| 1410 | 2130 or 2140 | 97 |
| 1400 | 2120 | 97 |
| 1390 | 2100 or 2110 | 96 |
| 1380 | 2090 | 96 |
| 1370 | 2070 or 2080 | 95-96 |
| 1360 | 2060 | 95 |
| 1350 | 2040 or 2050 | 94-95 |
| 1340 | 2030 | 94 |
| 1330 | 2010 or 2020 | 93 |
| 1320 | 2000 | 92 |
| 1310 | 1980 or 1990 | 92 |
| 1300 | 1970 | 92 |
| 1290 | 1950 or 1960 | 91 |
| 1280 | 1940 | 90 |
| 1270 | 1920 or 1930 | 89-90 |
| 1260 | 1910 | 89 |
| 1250 | 1890 or 1900 | 87-88 |
| 1240 | 1880 | 87 |
| 1230 | 1860 or 1870 | 86 |
| 1220 | 1850 | 85 |
| 1210 | 1830 or 1840 | 84 |
| 1200 | 1820 | 83 |
| 1190 | 1800 or 1810 | 81-82 |
| 1180 | 1790 | 81 |
| 1170 | 1780 or 1770 | 79-80 |
| 1160 | 1750 or 1760 | 77-78 |
| 1150 | 1740 | 77 |
| 1140 | 1720 or 1730 | 75-76 |
| 1130 | 1710 | 74 |
| 1120 | 1690 or 1700 | 72-73 |
| 1110 | 1680 | 71 |
| 1100 | 1660 or 1670 | 69-70 |
| 1090 | 1650 | 68 |
| 1080 | 1630 or 1640 | 66-67 |
| 1070 | 1620 | 65 |
| 1060 | 1600 or 1610 | 63-64 |
| 1050 | 1590 | 62 |
| 1040 | 1570 or 1580 | 60-61 |
| 1030 | 1560 | 59 |
| 1020 | 1540 or 1530 | 56-57 |
| 1010 | 1530 | 55 |
| 1000 | 1510 or 1520 | 53-54 |
| 990 | 1500 | 52 |
| 980 | 1480 or 1490 | 49-50 |
| 970 | 1470 | 48 |
| 960 | 1460 or 1450 | 46-47 |
| 950 | 1440 | 44 |
| 940 | 1420 or 1430 | 42-43 |
| 930 | 1410 | 41 |
| 920 | 1390 or 1400 | 38-40 |
| 910 | 1380 | 37 |
| 900 | 1360 or 1370 | 35-36 |
| 890 | 1350 | 34 |
| 880 | 1330 or 1340 | 31-32 |
| 870 | 1320 | 30 |
| 860 | 1300 or 1310 | 28-29 |
| 850 | 1290 | 27 |
| 840 | 1270 or 1280 | 25-26 |
| 830 | 1250 or 1260 | 23-24 |
| 820 | 1240 | 22 |
| 810 | 1220 or 1230 | 20-21 |
| 800 | 1210 | 19 |
| 790 | 1190 or 1200 | 17-18 |
| 780 | 1180 | 16 |
| 770 | 1160 or 1170 | 14-15 |
| 760 | 1150 | 14 |
| 750 | 1130 or 1140 | 12-13 |
| 740 | 1120 | 11 |
| 730 | 1100 or 1110 | 10-11 |
| 720 | 1090 | 10 |
| 710 | 1070 or 1080 | 8-9 |
| 700 | 1060 | 8 |
| 690 | 1040 or 1050 | 7 |
| 680 | 1030 | 6 |
| 670 | 1010 or 1020 | 6 |
| 660 | 1000 | 5 |
| 650 | 980 or 990 | 5 |
| 640 | 970 | 4 |
| 630 | 950 or 960 | 4 |
| 620 | 940 | 3 |
| 610 | 920 or 930 | 3 |
| 600 | 910 | 3 |
| 590 | 890 or 900 | 2 |
| 580 | 880 | 2 |
| 570 | 860 or 870 | 2 |
| 560 | 850 | 2 |
| 550 | 830 or 840 | 1 |
| 540 | 820 | 1 |
| 530 | 800 or 810 | 1 |
| 520 | 790 | 1 |
| 510 | 770 or 780 | 1 |
| 500 | 750 or 760 | 1 |
| 490 | 740 | 1 |
| 480 | 720 or 730 | 1 |
| 470 | 710 | 1 |
| 460 | 690 or 700 | 1 |
| 450 | 680 | 1 |
| 440 | 660 or 670 | 1 |
| 430 | 650 | 1 |
| 420 | 630 or 640 | 1 |
| 410 | 620 | 1 |
| 400 | 600 or 610 | 1 |
GPA vs SAT Score Chart
GPA is a scale that indicates how sufficient the scores of a candidate’s academics are. In the score chart below SAT score table are compared with GPA.
| GPA score | SAT score |
|---|---|
| 3-4 | 1600-921 |
| 2-3 | 920-768 |
| 1-2 | 674-767 |
| 0-1 | 400-673 |
This is how the SAT Score charts look like and there are different ways to convert the raw score into scaled score. Online converters are serving the candidates effectively in this matter.
FAQs
Ques. What is a Good SAT Score?
Ans. 75th percentile SAT score seems to be a good SAT score – 75th percentile score signifies a SAT score of 1200-1210. This is the minimum SAT score requirement for renowned universities around the world.
Ques. What is the Minimum SAT Score for Harvard?
Ans. A SAT score of 1580 is needed for admission in Harvard – the score breakup for Reading and Writing is 720-780 and for Math, it is 740-800.
Ques. What is the Average SAT Score?
Ans. As per the report of 2018, the average SAT score obtained worldwide is 1068. SAT Score range is 400-1600 and the mathematical average of SAT is 1000. Now this a fact that maximum candidates secure a score around 1050-1110 worldwide.
Ques. Is 1500 a Good SAT Score?
Ans. Highest SAT score is 1600 and out of 1600, a SAT score of 1500 is definitely a good score.
*The article might have information for the previous academic years, which will be updated soon subject to the notification issued by the University/College.


Comments