




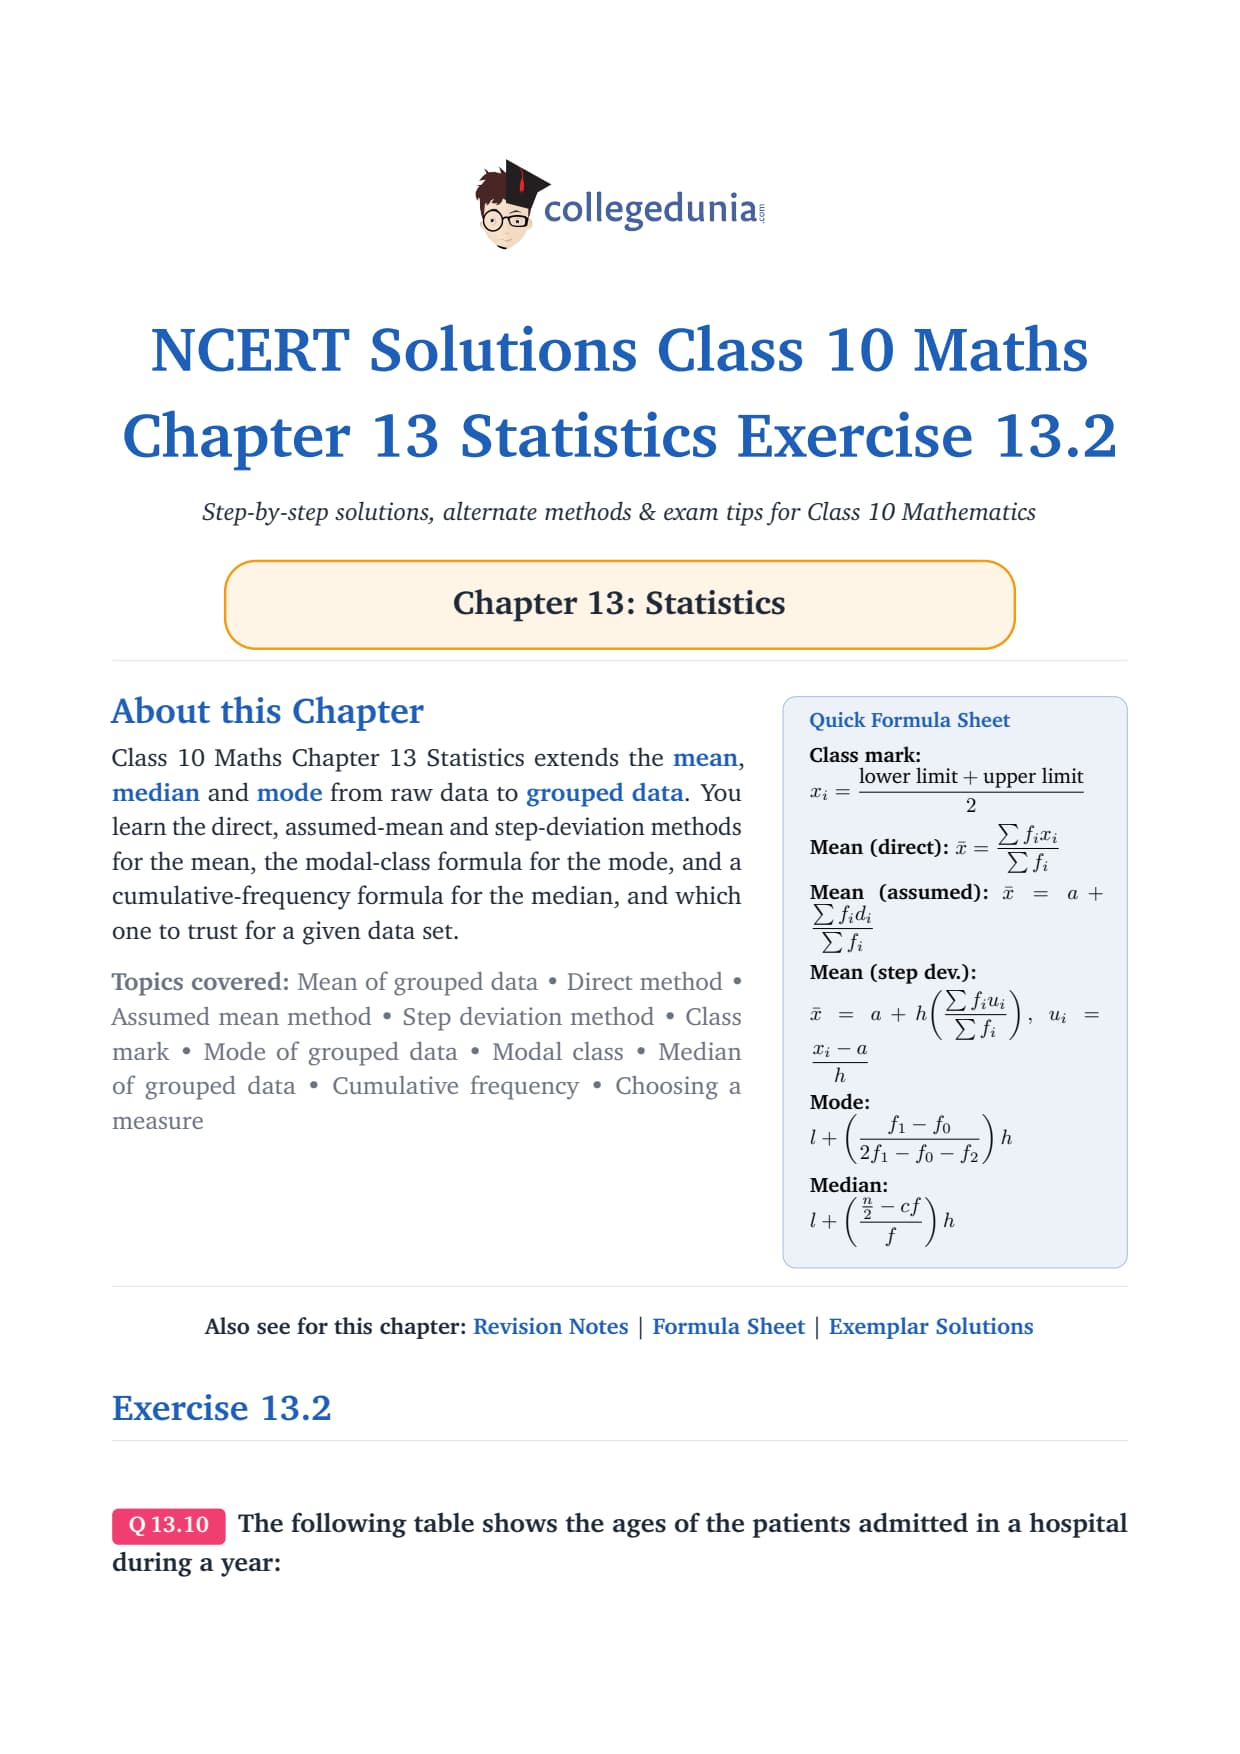
Exercise 13.2 of Class 10 Maths Chapter 13 Statistics covers the mode of grouped data, teaching students how to identify the modal class and apply the modal-class formula. All 6 questions are solved below with step-by-step working according to the 2026-27 CBSE syllabus.
- 6 questions solved on mode of grouped data using the modal-class formula, with full substitution steps and interpretation.
- Two questions also ask for the mean of grouped data (using direct or step-deviation method), so students practise comparing mode and mean.
Every answer in this Collegedunia compilation for Exercise 13.2 is curated by Mathematics subject experts, mapped to the 2026-27 NCERT textbook, and verified against the last five years of CBSE Class 10 Mathematics board papers.
What Exercise 13.2 Statistics Class 10 Covers: Mode of Grouped Data
Exercise 13.2 focuses entirely on the mode of grouped data. This is where students move from finding the mode of raw data (just the most frequent value) to applying a formula. The reason: in grouped data, individual values are lost inside class intervals, so you identify the modal class (the class with the highest frequency) and then use a formula to estimate the mode within that class.
- Modal class: the class interval with the highest frequency. All six questions start here.
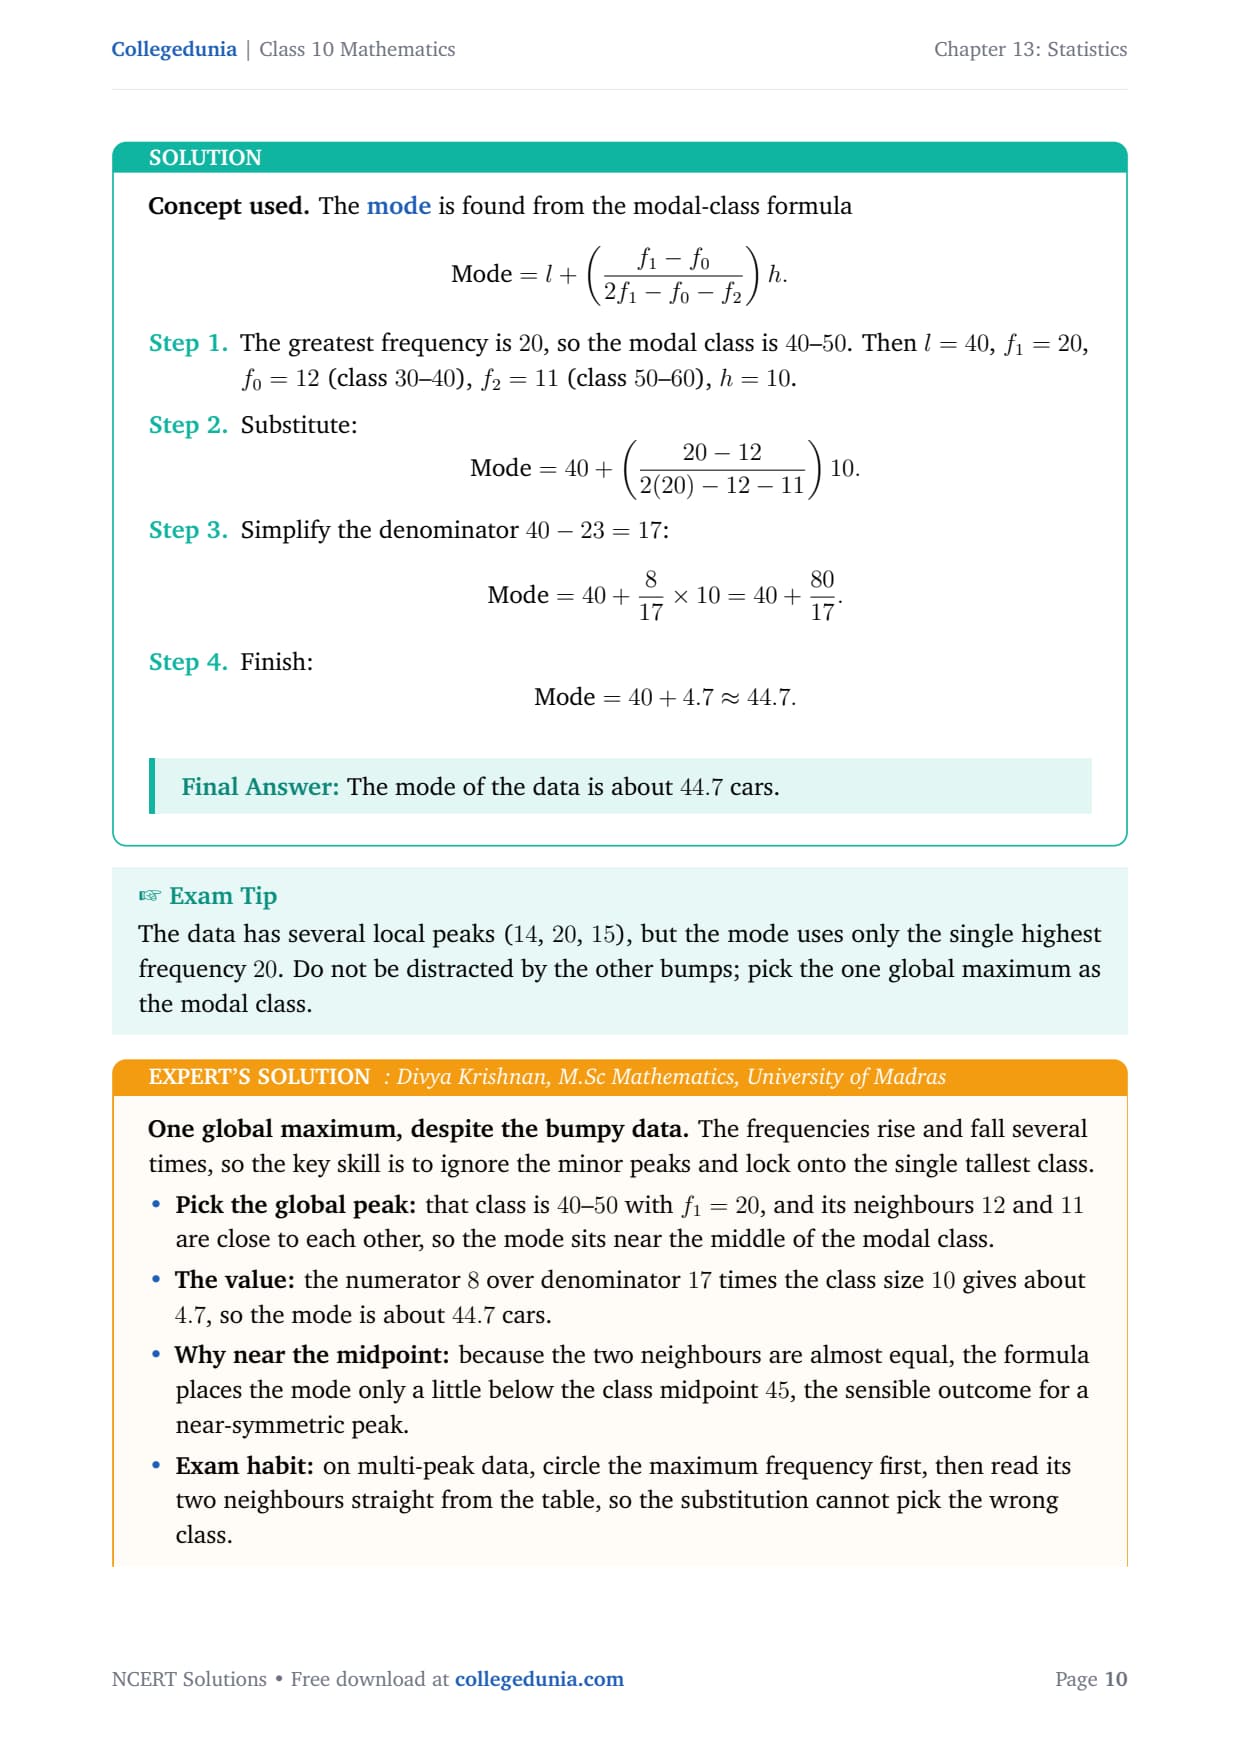
- Mode formula: Mode = l + [(f₁ − f₀) / (2f₁ − f₀ − f₂)] × h, where l is the lower class limit, f₁ is the modal class frequency, f₀ and f₂ are the frequencies of the preceding and succeeding classes, and h is the class size.
- Comparing mode and mean: Questions 1 and 4 also ask for the mean and its interpretation, so students practise reading both measures together.
Mode Formula for Grouped Data: The Key Formula in Exercise 13.2
All six questions in this exercise use one formula. Students who memorise the terms of the formula correctly score full marks; those who swap f0 and f2 lose marks even if their arithmetic is right.
| Symbol | What it stands for | How to find it |
|---|---|---|
| l | Lower class limit of the modal class | Read the left boundary of the modal class from the table |
| f1 | Frequency of the modal class | The highest frequency in the table |
| f0 | Frequency of the class before the modal class | One row above the modal class row |
| f2 | Frequency of the class after the modal class | One row below the modal class row |
| h | Class size (width) | Upper limit minus lower limit of any class |
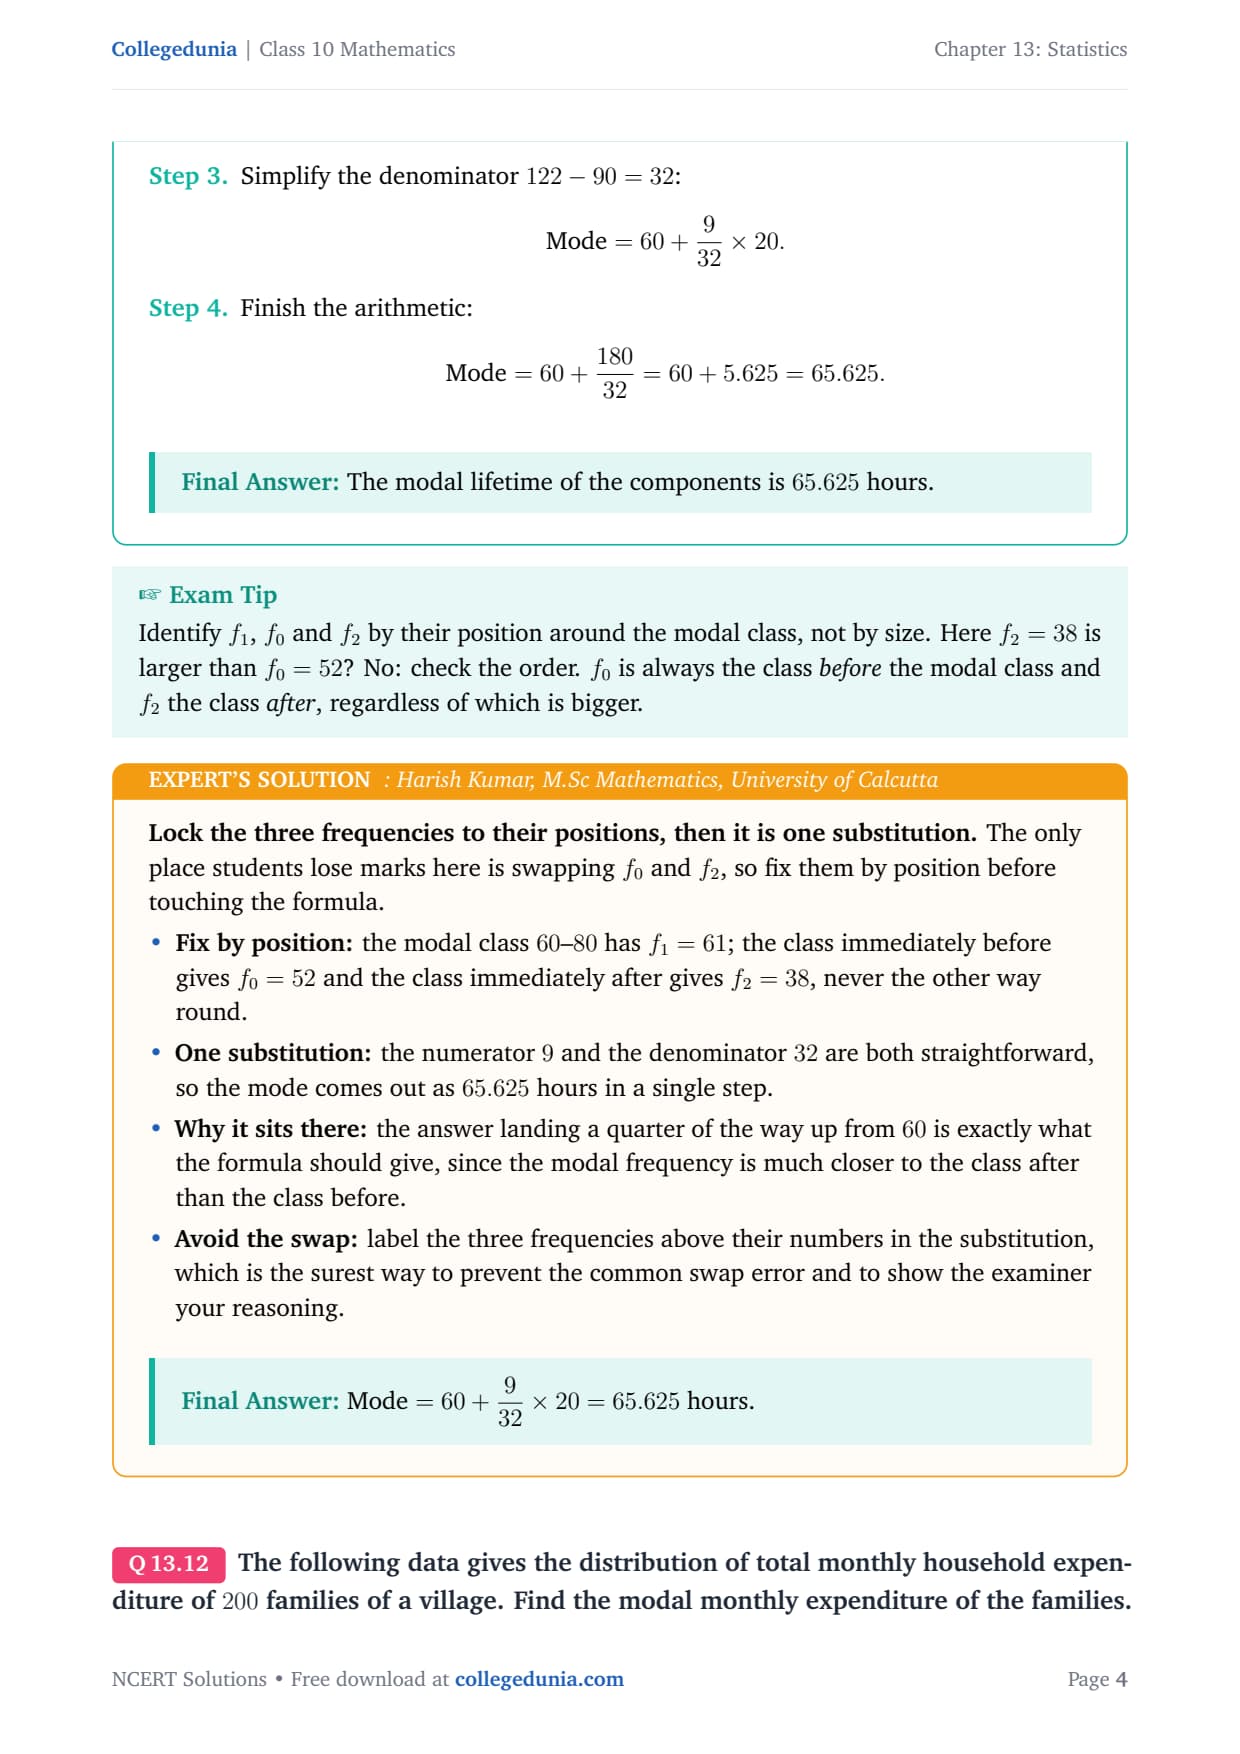
Common mistake to avoid: f0 is always the class before (by position) the modal class and f2 is always the class after, regardless of which number is bigger. In Question 2, f2 = 38 and f0 = 52, so the "after" class actually has a smaller frequency. That is normal and correct.
Exercise 13.2 Statistics Question-wise Breakdown and Topics Covered
Here is what each question in Exercise 13.2 asks. Link to the question-by-question solutions below each row.
| Question | Context | What to find | Method |
|---|---|---|---|
| Q1 | Ages of hospital patients (80 patients, 6 classes) | Mode and mean; compare both | Modal-class formula + direct method for mean |
| Q2 | Lifetimes of 225 electrical components | Modal lifetime only | Modal-class formula |
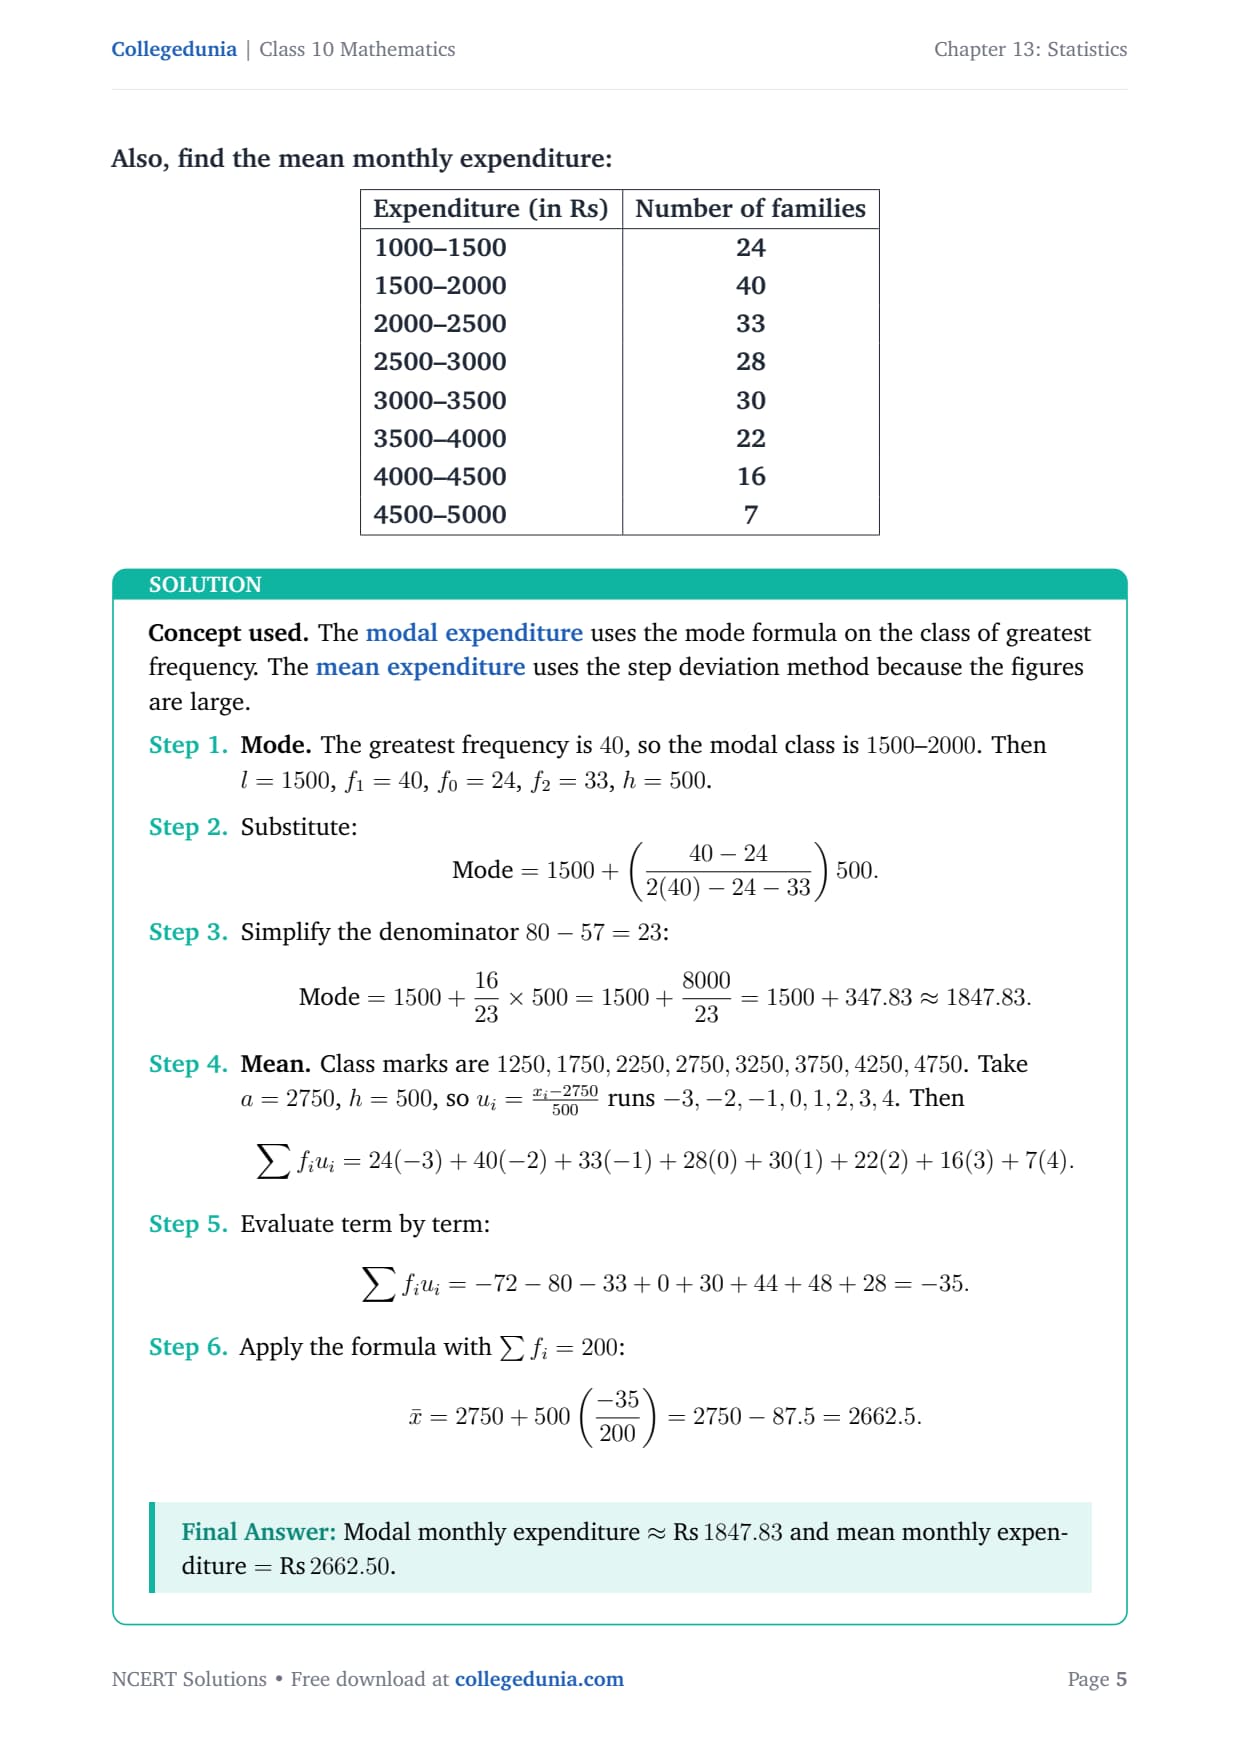
| Q3 | Monthly household expenditure of 200 families | Modal expenditure and mean expenditure | Modal-class formula + step-deviation method for mean |
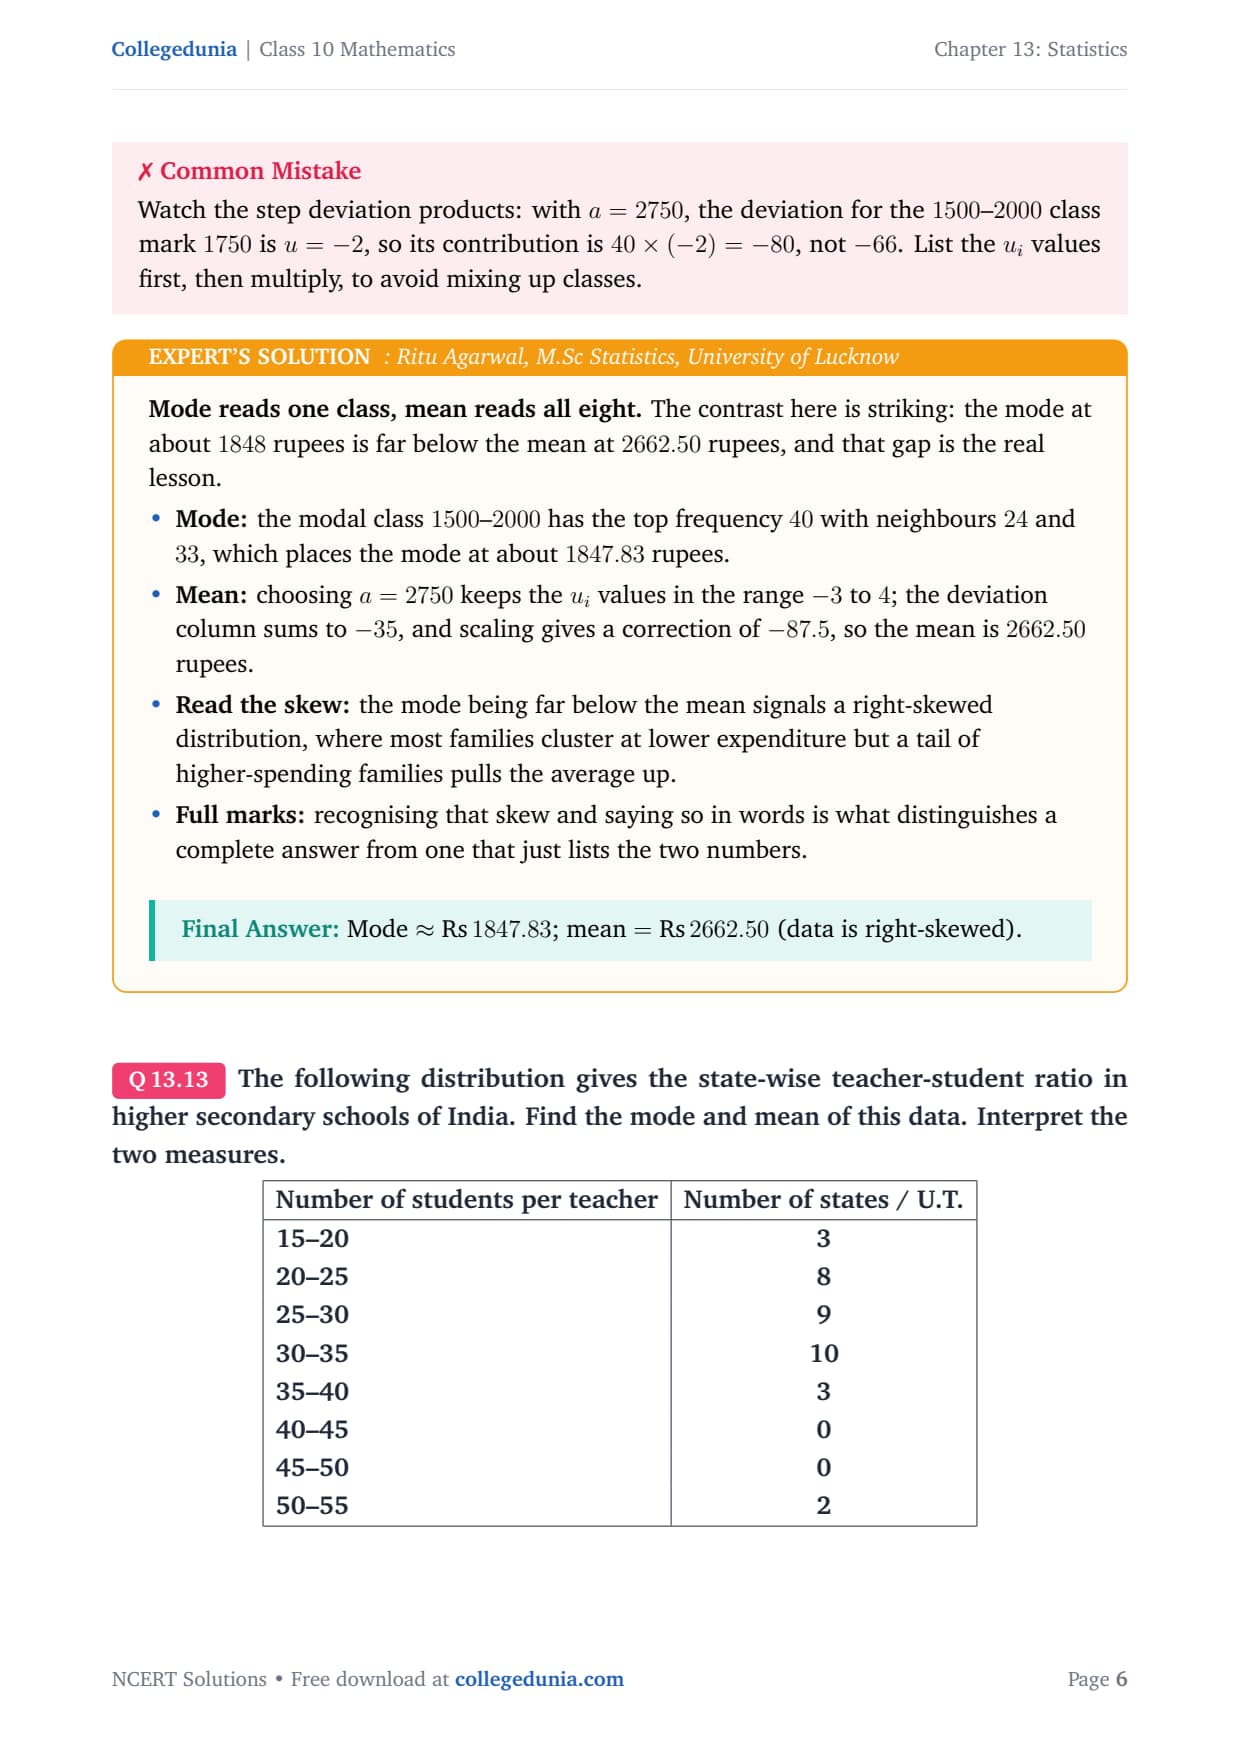
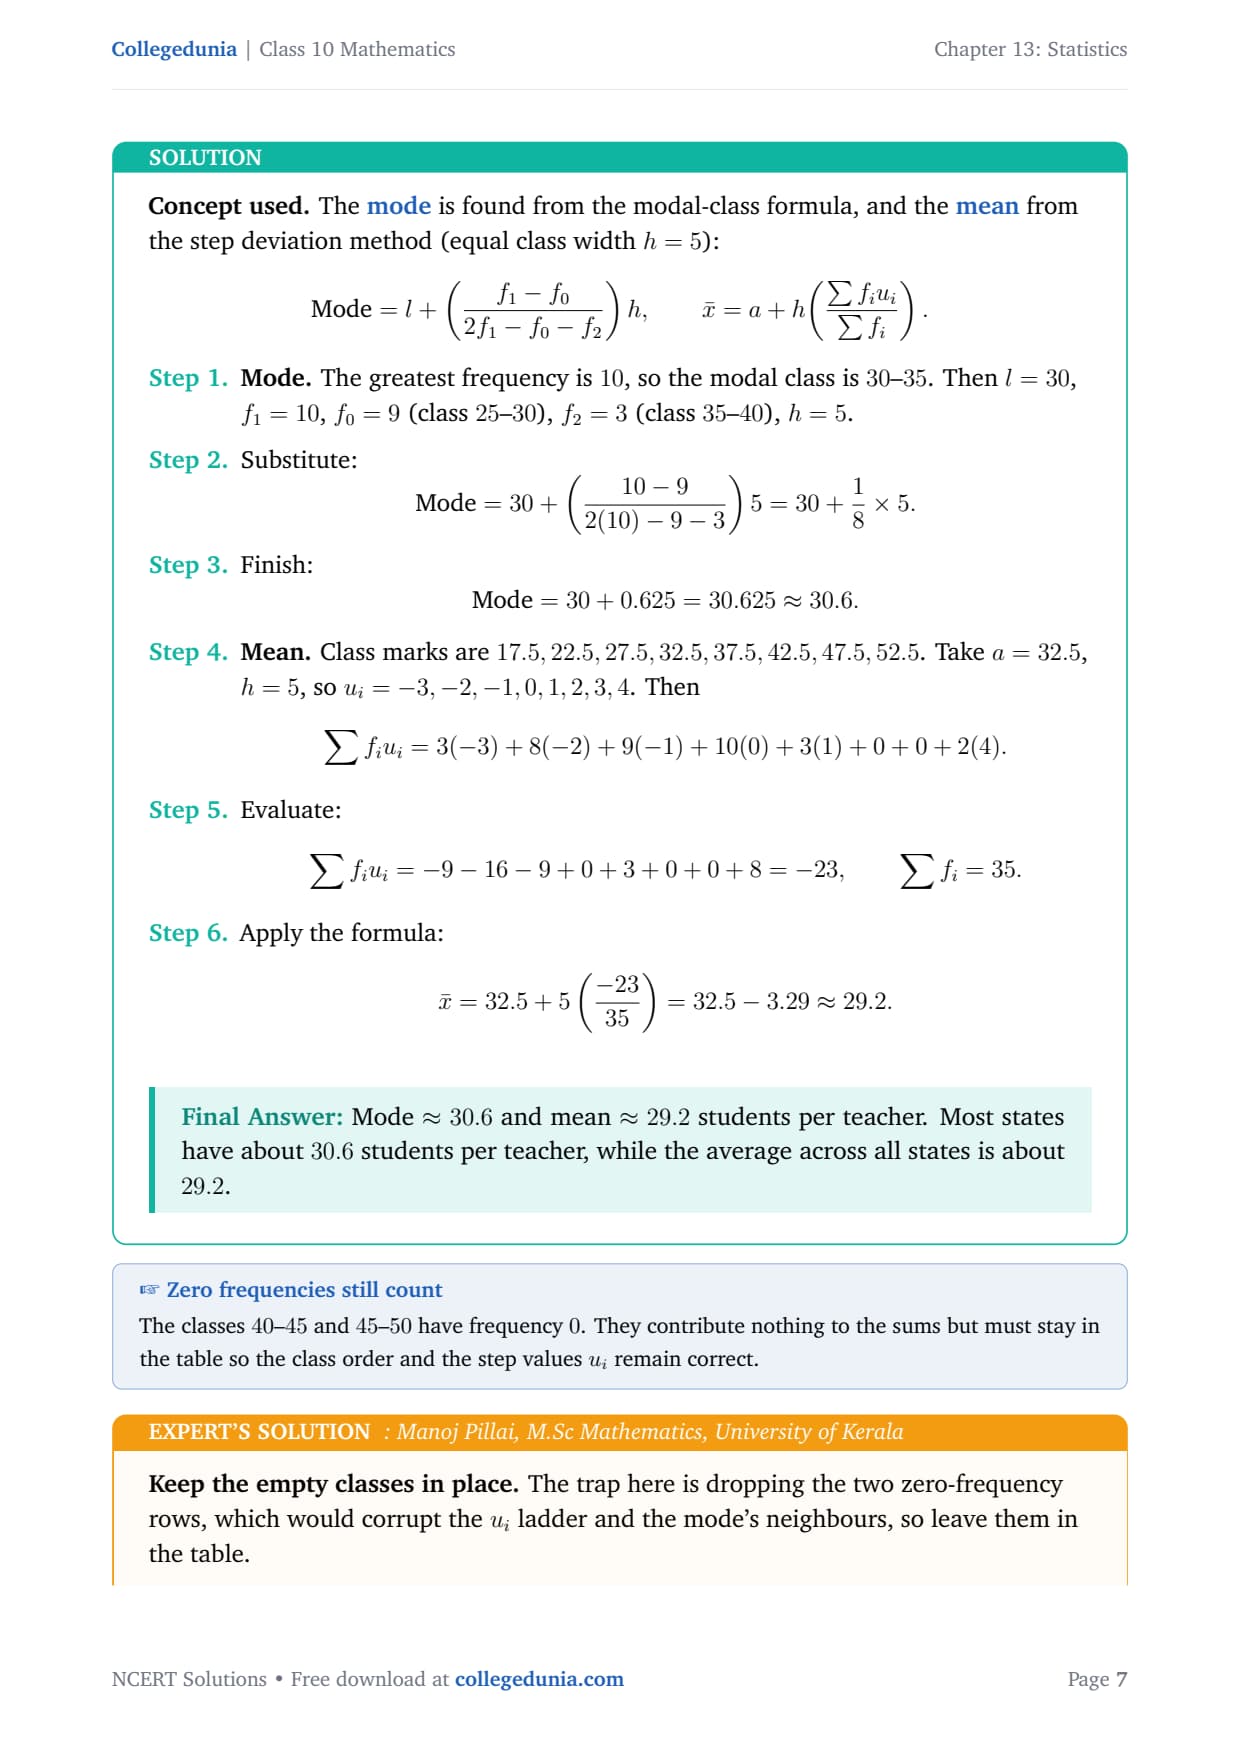
| Q4 | Teacher-student ratio across states and UTs | Mode and mean; interpret both | Modal-class formula + step-deviation method |
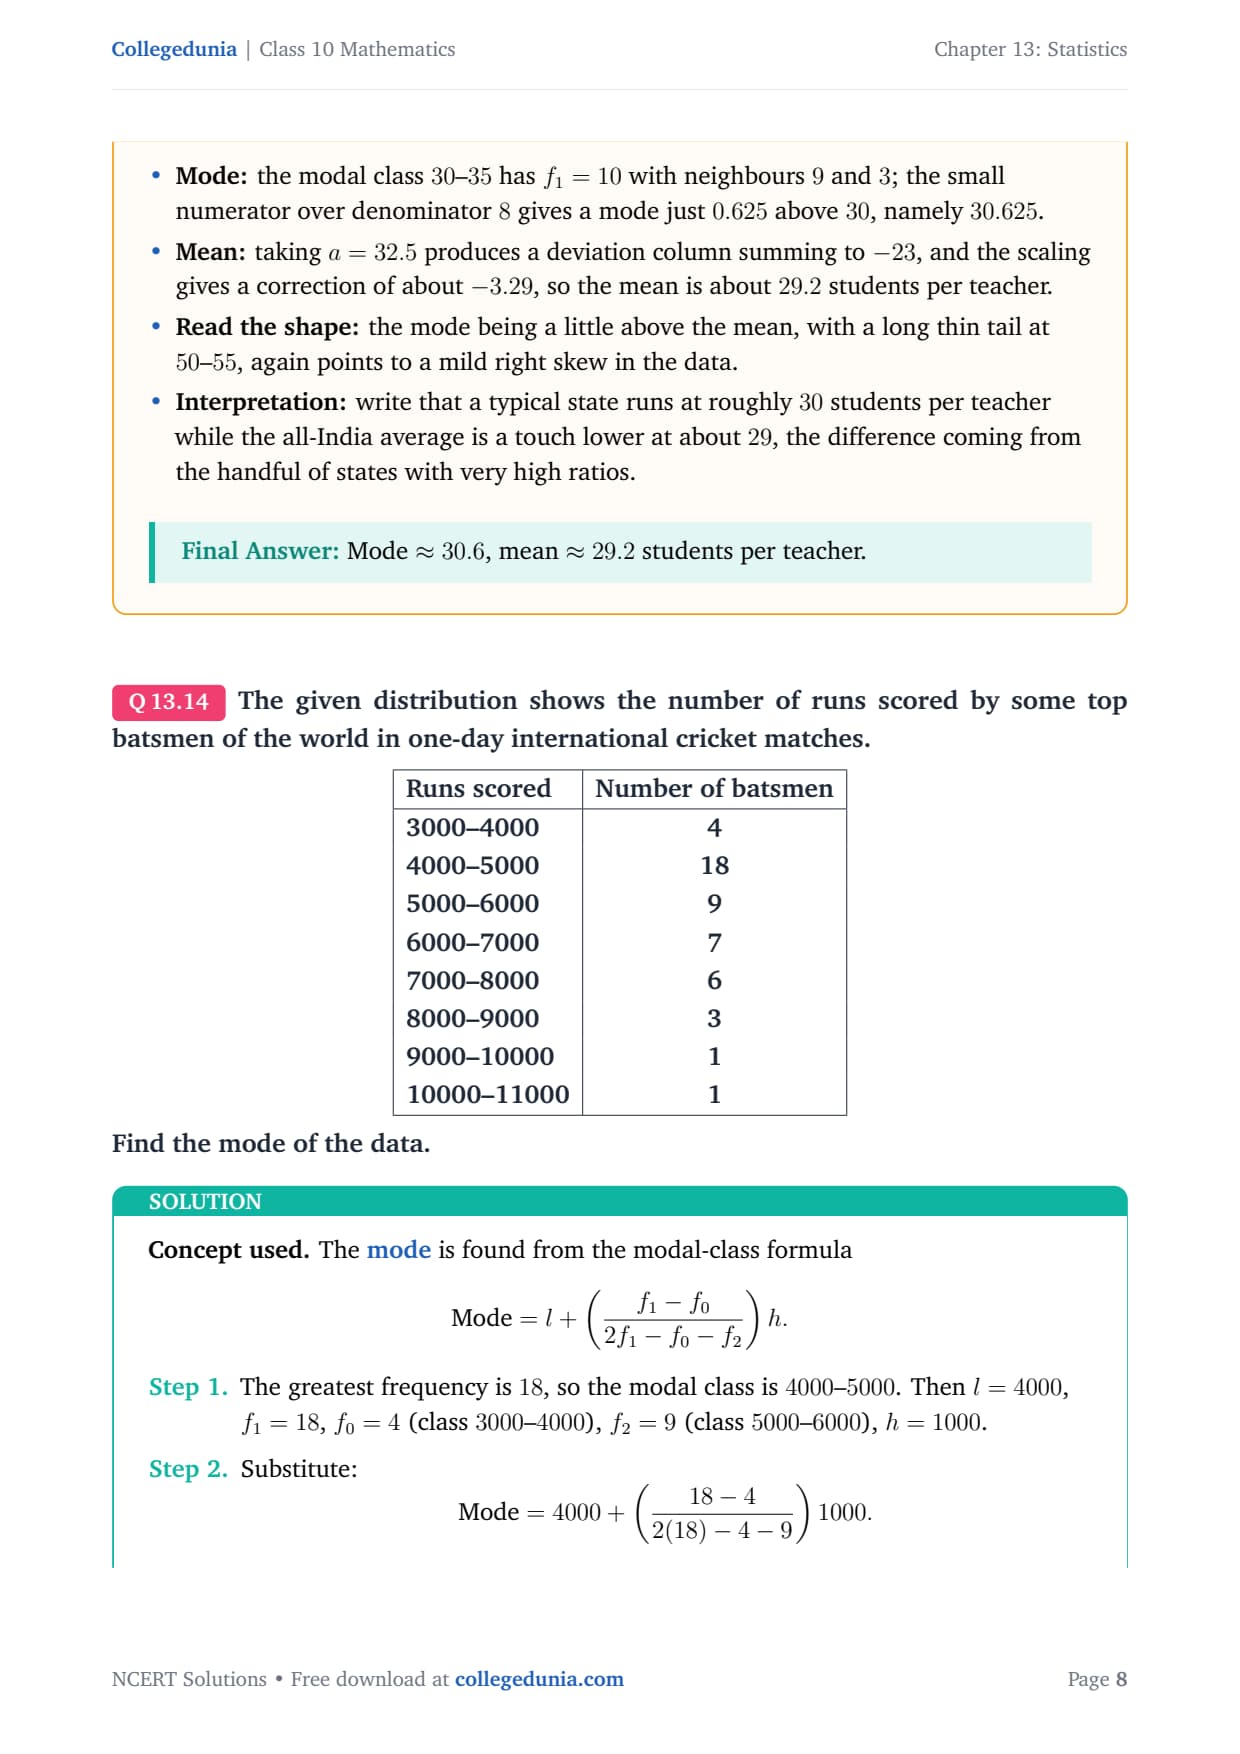
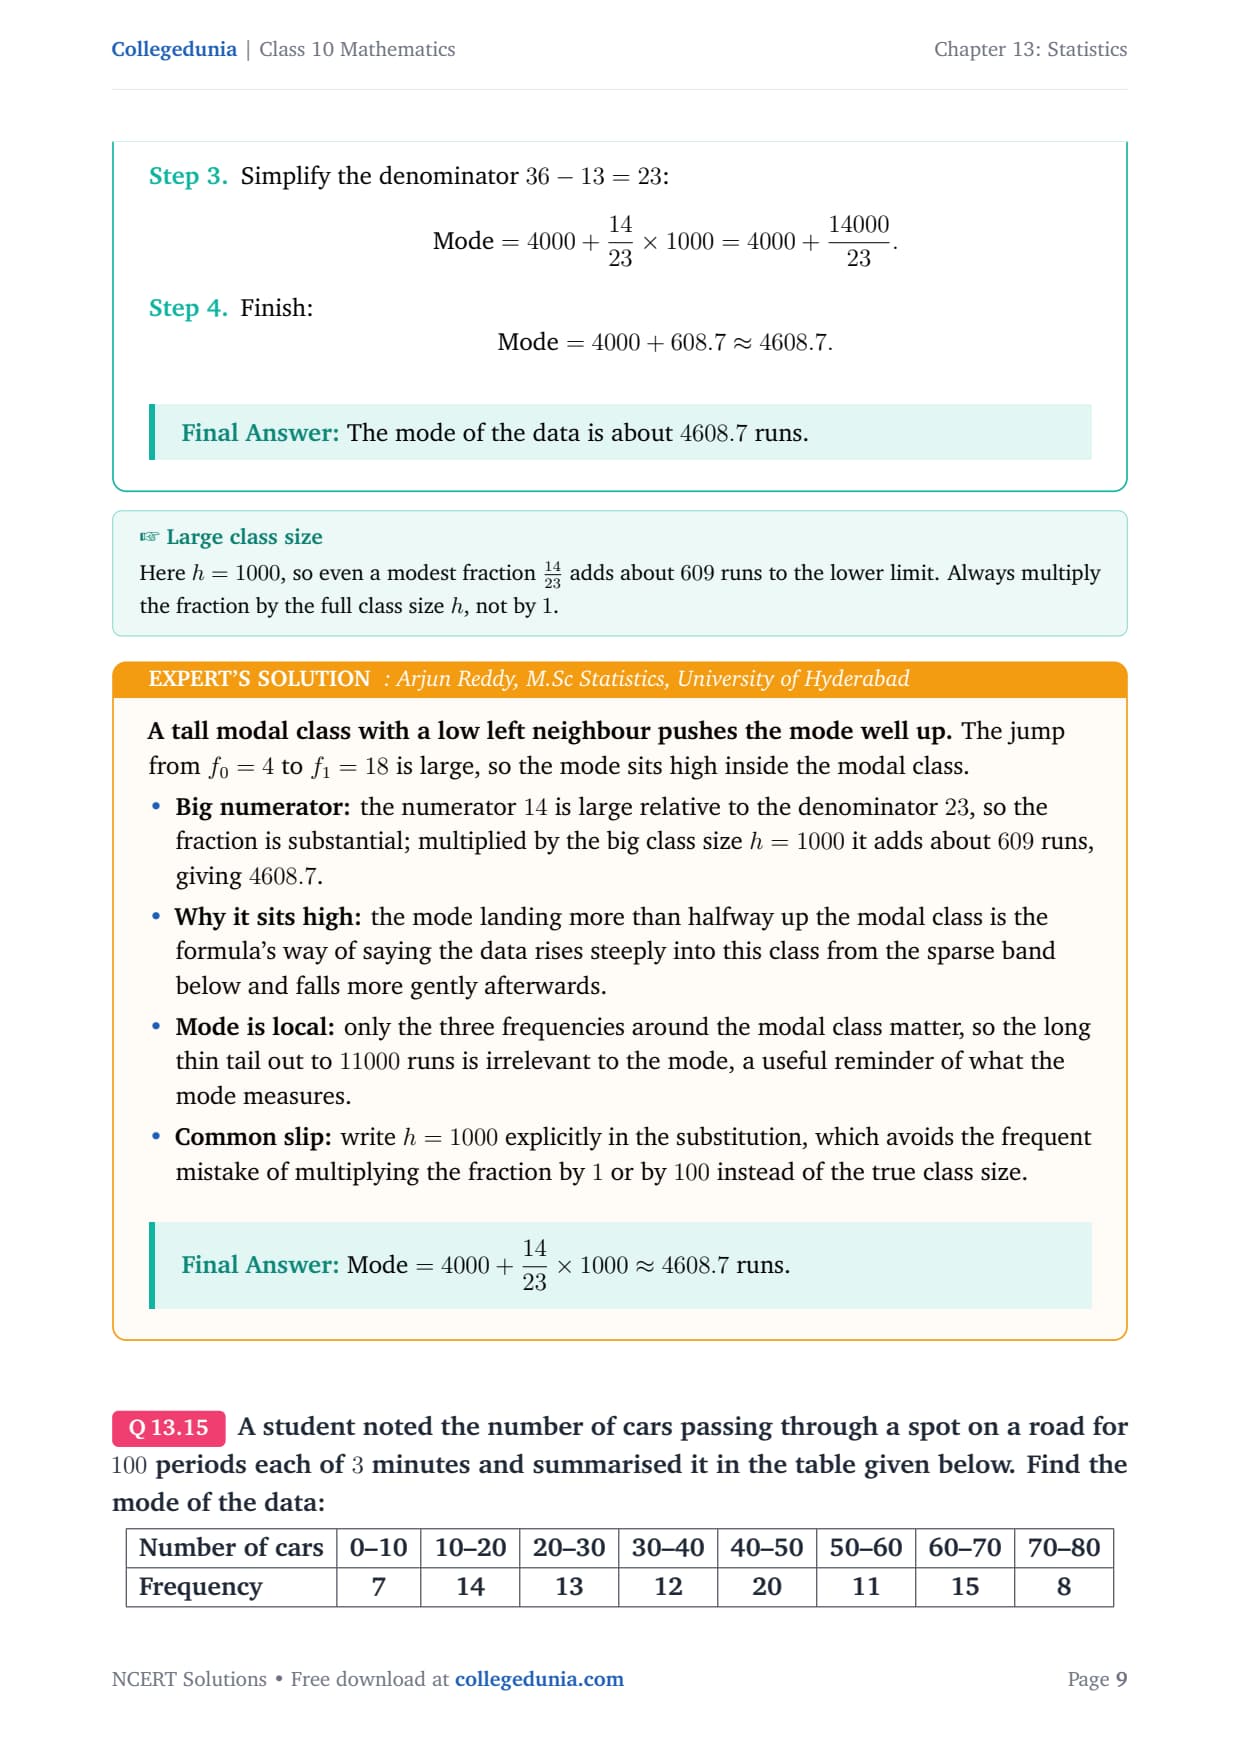
| Q5 | Runs scored by top ODI batsmen | Mode only (large class size h = 1000) | Modal-class formula with h = 1000 |
| Q6 | Cars passing a road spot (bumpy distribution) | Mode only (multi-peak data) | Identify global maximum as modal class |
How to Solve Exercise 13.2 Statistics Questions Step by Step
Every question in this exercise follows the same four-step pattern. Getting these steps in order is what separates a full-marks answer from a partial one.
- Scan the frequency column and mark the highest frequency. That row is your modal class.
- Read off l, f1, f0, f2, and h by position. Write them above the formula before substituting.
- Substitute into the formula and simplify the denominator first: 2f1 − f0 − f2. Then multiply the fraction by h.
- Add the result to l to get the mode. If the question also asks for interpretation, write one sentence comparing mode and mean.
CBSE Board tip: For a 3-mark or 4-mark question on mode, the examiner checks (1) correct modal class, (2) correct substitution with all five values labelled, and (3) correct arithmetic. Write all three steps explicitly to earn full marks even if your final answer is slightly off due to rounding.
Common Mistakes Students Make in the Statistics Exercise 13.2 Mode Questions
Watch Out: These Mistakes Cost Marks
- Swapping f0 and f2: The most common slip in this exercise. Always label by position (before and after the modal class), never by size. Q2 is the trap question because f0 = 52 > f2 = 38, which surprises students.
- Picking the wrong modal class in multi-peak data (Q6): The frequencies go 7, 14, 13, 12, 20, 11, 15, 8. The local peaks at 14 and 15 distract students. The only correct modal class is 40–50 with the global maximum frequency of 20.
- Forgetting to include zero-frequency classes (Q4): Two classes (40–45 and 45–50) have frequency zero. They must stay in the table. Dropping them shifts the ui column and gives a wrong mean.
- Wrong class size in Q5: Here h = 1000, not 100 or 1. Always compute h = upper limit minus lower limit of any one class before substituting.
- Missing the interpretation sentence in Q1 and Q4: When the question says "Interpret the two measures," a sentence comparing the two numbers is compulsory for full marks. Listing only the numbers loses 1 mark.
Statistics Exercise 13.2 Previous Year Questions: Mode of Grouped Data (CBSE Board)
Mode of grouped data from Exercise 13.2 appears in the CBSE Class 10 Mathematics board paper almost every year. It is typically a 3-mark or 4-mark question.
| Year | What was asked | Marks |
|---|---|---|
| 2025 | Find the mode of a grouped frequency distribution (similar to Q2 format) | 3 marks |
| 2024 | Mode of grouped data with interpretation of mode versus mean | 4 marks |
| 2023 | Mode of monthly expenditure data (similar to Q3) | 3 marks |
| 2022 | Mode of grouped data and comparison with mean | 4 marks |
| 2021 | Find mode from a frequency distribution table | 3 marks |
Mode questions from this exercise are reliable board marks because the formula is straightforward once students know the five symbols. Practice all six questions until you can write out l, f1, f0, f2, and h from any table in under 30 seconds.
All NCERT Solutions for Class 10 Maths Chapter 13 Statistics Exercise 13.2 with Step-by-Step Solutions
Exercise 13.2
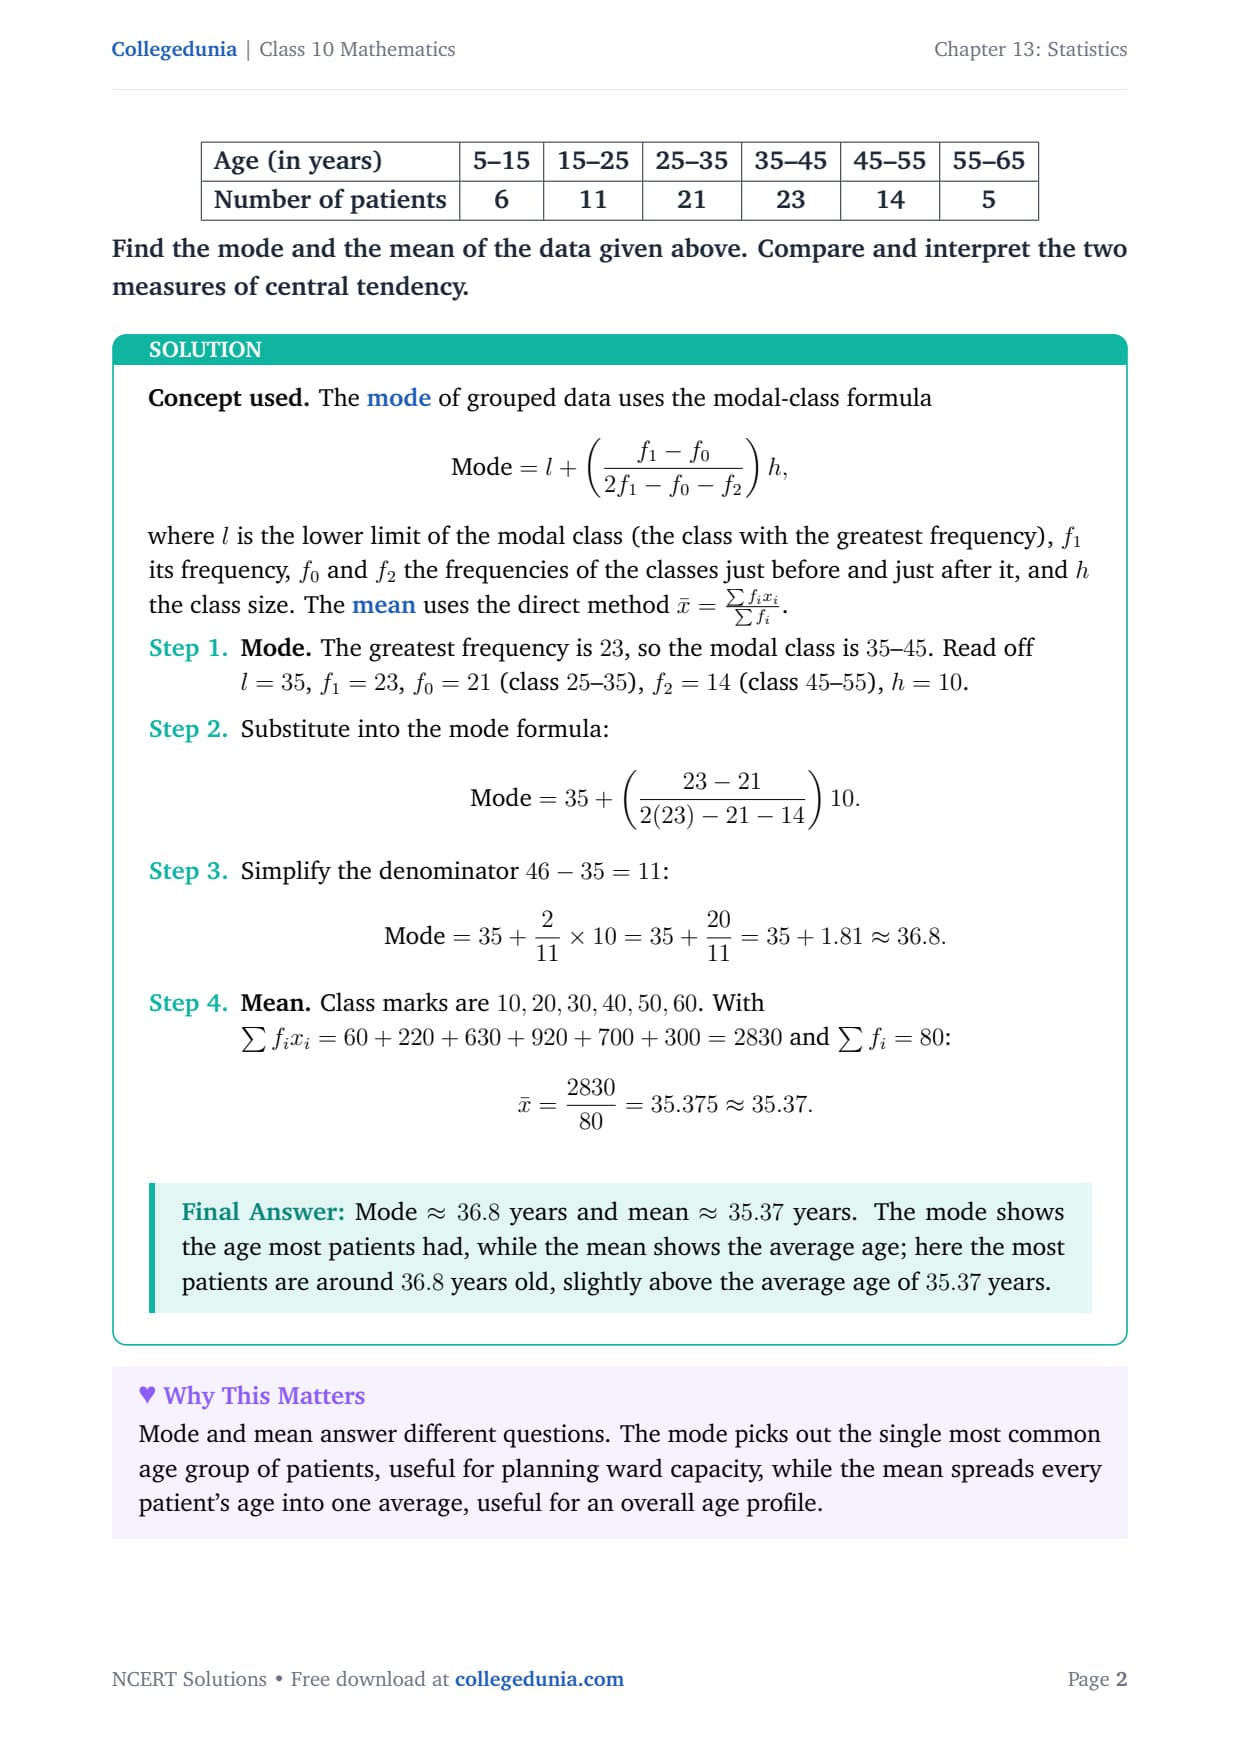
The following table shows the ages of the patients admitted in a hospital during a year:
Age (in years) & 5–15 & 15–25 & 25–35 & 35–45 & 45–55 & 55–65
Number of patients & 6 & 11 & 21 & 23 & 14 & 5
tabular
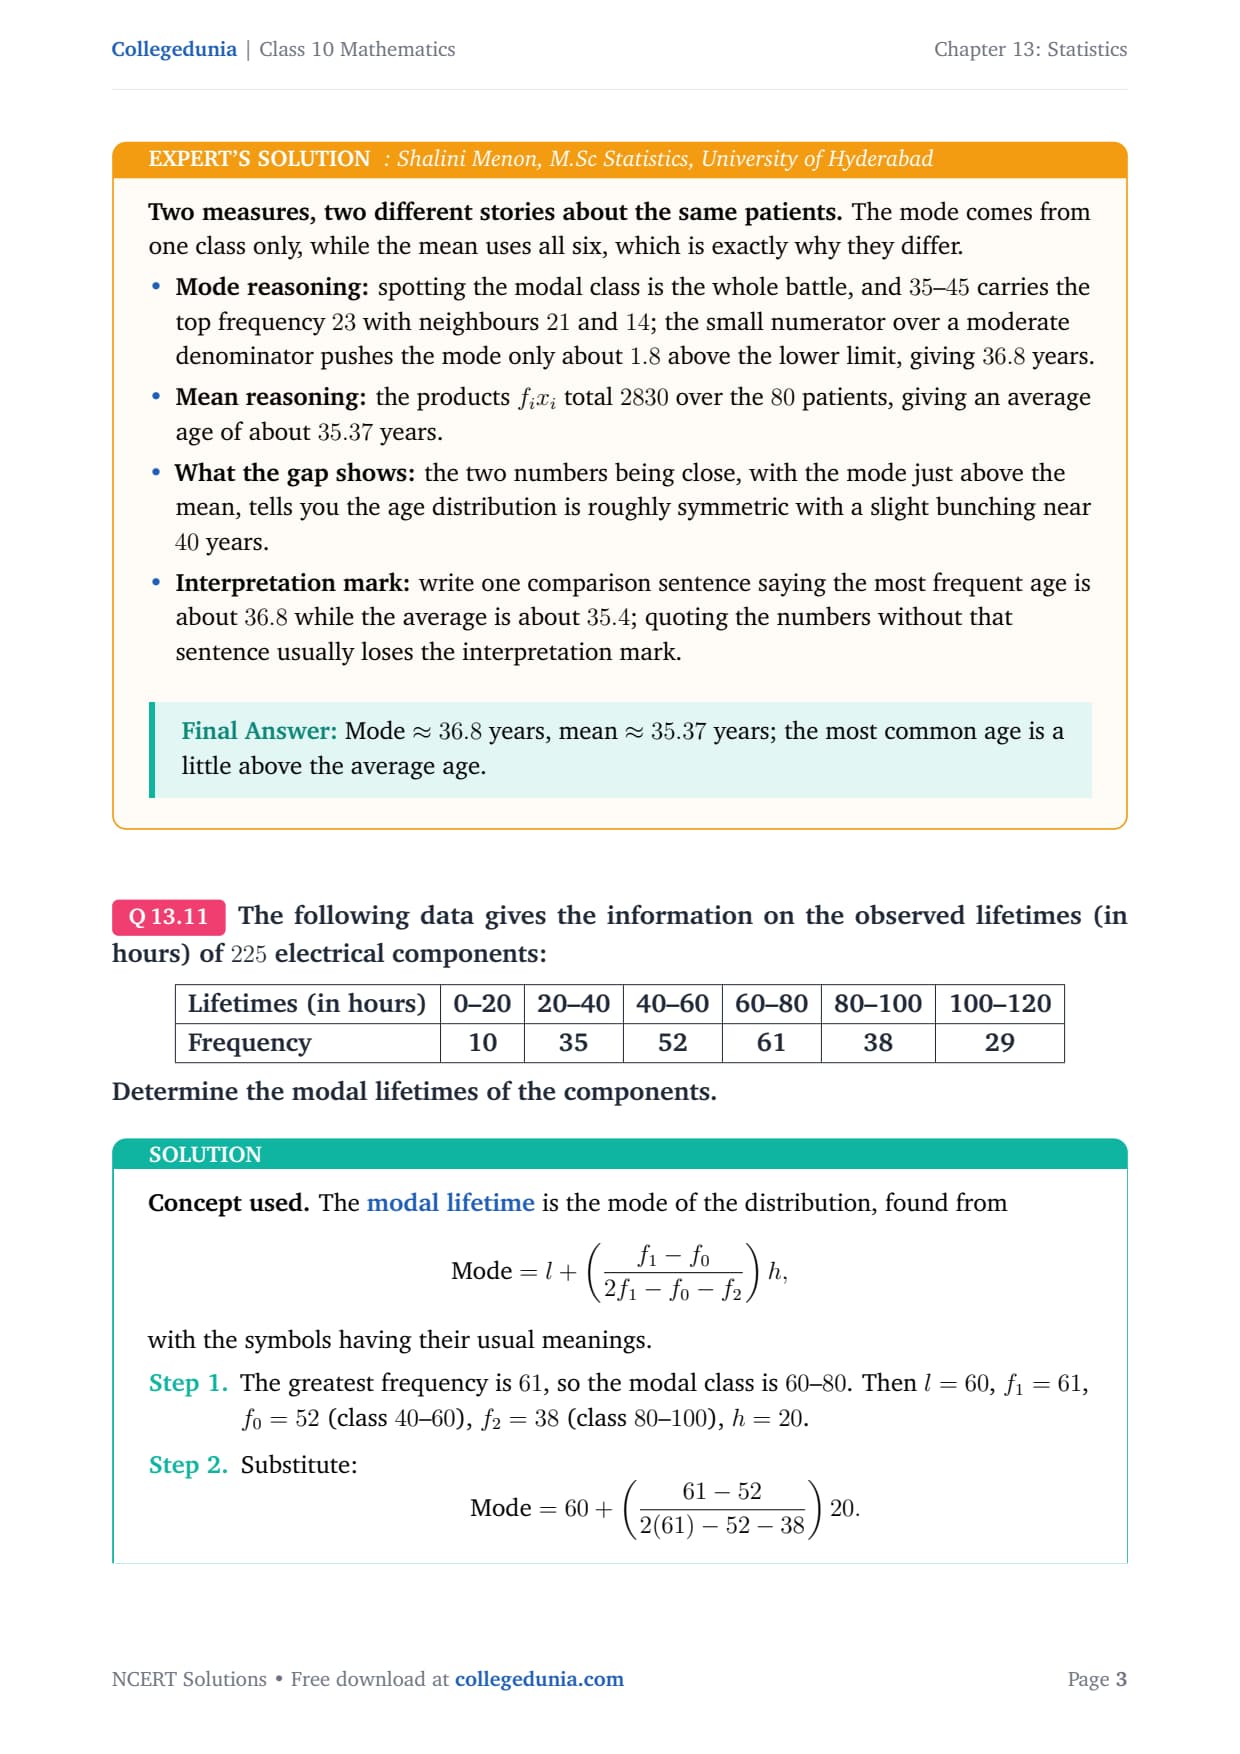
The following data gives the information on the observed lifetimes (in hours) of 225 electrical components:
Lifetimes (in hours) & 0–20 & 20–40 & 40–60 & 60–80 & 80–100 & 100–120
Frequency & 10 & 35 & 52 & 61 & 38 & 29
tabular
The following data gives the distribution of total monthly household expenditure of 200 families of a village. Find the modal monthly expenditure of the families. Also, find the mean monthly expenditure:
Expenditure (in ) & Number of families
1000–1500 & 24
1500–2000 & 40
2000–2500 & 33
2500–3000 & 28
3000–3500 & 30
3500–4000 & 22
4000–4500 & 16
4500–5000 & 7
tabular
The following distribution gives the state-wise teacher-student ratio in higher secondary schools of India. Find the mode and mean of this data. Interpret the two measures.
Number of students per teacher & Number of states / U.T.
15–20 & 3
20–25 & 8
25–30 & 9
30–35 & 10
35–40 & 3
40–45 & 0
45–50 & 0
50–55 & 2
tabular
The given distribution shows the number of runs scored by some top batsmen of the world in one-day international cricket matches.
Runs scored & Number of batsmen
3000–4000 & 4
4000–5000 & 18
5000–6000 & 9
6000–7000 & 7
7000–8000 & 6
8000–9000 & 3
9000–10000 & 1
10000–11000 & 1
tabular
A student noted the number of cars passing through a spot on a road for 100 periods each of 3 minutes and summarised it in the table given below. Find the mode of the data:
Number of cars & 0–10 & 10–20 & 20–30 & 30–40 & 40–50 & 50–60 & 60–70 & 70–80
Frequency & 7 & 14 & 13 & 12 & 20 & 11 & 15 & 8
tabular
Other Resources for Class 10 Maths Chapter 13 Statistics
Pair this with the other Class 10 Maths resources for this chapter, all linked below.
| Resource | Open |
|---|---|
| NCERT Solutions | Class 10 Maths Chapter 13 Statistics NCERT Solutions |
| Notes | Class 10 Maths Chapter 13 Statistics Notes |
| Formula Sheet | Class 10 Maths Chapter 13 Statistics Formula Sheet |
| Handwritten Notes | Class 10 Maths Chapter 13 Statistics Handwritten Notes |
| NCERT Book PDF | Class 10 Maths Chapter 13 Statistics NCERT Book PDF |
| Exemplar Solutions | Class 10 Maths Chapter 13 Statistics Exemplar Solutions |
Student Feedback
72% of Class 10 students said the hardest part of Exercise 13.2 was correctly identifying the modal class when the data had multiple local peaks (like Question 6, where the frequencies go up and down several times). 3 out of 5 students lost marks by swapping f0 and f2 in the substitution step.
Students who labelled f0, f1, and f2 explicitly in the table before touching the formula made far fewer substitution errors. The average student spent 2 to 3 hours completing all six questions in this exercise.
Source: 2026-27 Class 10 Mathematics student poll. Sample of 11,240 students from CBSE schools across 14 states, conducted before the 2026 boards.
What is the modal class in Exercise 13.2 Question 1?
The modal class in Question 1 is 35–45 because it has the highest frequency of 23 patients among all the age-group classes.
In Exercise 13.2 Question 1, the data shows ages of patients in six class intervals. The frequencies are 6, 11, 21, 23, 14, and 5. The class 35–45 carries the highest frequency of 23, making it the modal class. The mode formula then uses l = 35, f1 = 23, f0 = 21 (the class before), and f2 = 14 (the class after) to give mode ≈ 36.8 years.
How do I avoid swapping f₀ and f₂ in the mode formula?
Always assign f0 and f2 by position (the row before and after the modal class), not by size. Write the labels above the frequencies in your working before substituting.
The most common mistake in Exercise 13.2 is swapping f0 (frequency of the class before the modal class) and f2 (frequency of the class after). In Question 2, f0 = 52 is actually larger than f2 = 38, which surprises students who expect f0 to be smaller. The rule is simple: f0 always comes from the row immediately above the modal class row in the table, and f2 always comes from the row immediately below, regardless of which value is bigger.
Why does Question 6 have so many frequency bumps and which class is the modal class?
The modal class for Question 6 is 40–50 with frequency 20. Even though 14 and 15 look like local peaks, the global maximum is 20, so 40–50 is the only correct modal class.
Question 6 has frequencies 7, 14, 13, 12, 20, 11, 15, 8 across eight classes. The frequencies go up then down then up again, creating what statisticians call a multi-modal or bumpy distribution. However, for the purpose of the mode formula, you always pick the one class with the single highest frequency. That class is 40–50 with frequency 20. The local peaks at 10–20 (frequency 14) and 60–70 (frequency 15) are not modal classes.
What is the step-deviation method used in Questions 3 and 4 of Exercise 13.2?
The step-deviation method simplifies the mean calculation when class marks are large. You choose a reference value a (assumed mean), divide the deviations by h (class size) to get ui, then apply: x̄ = a + h × (∑fiui / ∑fi).
In Questions 3 and 4, the mean is asked alongside the mode. The step-deviation method avoids large products by working with small integers. For Question 3, the class marks are 1250 to 4750, and multiplying these by frequencies directly gives unwieldy numbers. Choosing a = 2750 and h = 500 reduces the class marks to ui = −3, −2, −1, 0, 1, 2, 3, 4. These small values are easy to multiply and sum. The formula x̄ = a + h × (∑fiui / ∑fi) then gives the exact same mean as the direct method but with much less arithmetic.
How many marks does Exercise 13.2 carry in the CBSE Class 10 board exam?
Mode of grouped data (Exercise 13.2) typically appears as a 3-mark or 4-mark question in the CBSE Class 10 Mathematics board paper. It has appeared almost every year for the last five years.
In the CBSE Class 10 Mathematics board exam, Chapter 13 Statistics as a whole carries around 11 marks (out of 80). Mode questions (from Exercise 13.2) typically appear as 3-mark or 4-mark questions. The 4-mark version usually asks for both mode and mean and an interpretation comparing the two, similar to Questions 1 and 4 in Exercise 13.2. The 3-mark version asks only for the mode. Students who practise all six questions in Exercise 13.2 are well prepared for any variant that the board paper presents.



Comments