




The Class 12 Geography Practical Work in Geography Chapter 2 Data Processing textbook PDF is the official NCERT source for every board question on measures of central tendency, mean, median, and mode. It carries about 4 to 5 marks in the CBSE board exam and builds directly on the data collected and tabulated in Chapter 1.
- Official NCERT Practical Work in Geography Class 12 Chapter 2 PDF covering mean (direct and indirect methods), median, mode, and the normal distribution curve.
- 4-5 marks CBSE board-paper weightage for Chapter 2; the official textbook is the only source CBSE references when it sets short-answer and numerical questions on statistical processing.
- Pair with the matching NCERT Solutions, Notes and Handwritten Notes for complete chapter coverage.
Student Feedback
In a 2026 Collegedunia poll of 8,700 Class 12 Geography students, 81% said reading the NCERT Practical Work in Geography Chapter 2 PDF directly helped them answer numerical questions on mean, median, and mode more accurately than any guide book. Students who read the full PDF averaged 4.4 out of 5 marks on questions from this chapter.
What This Chapter Covers in the NCERT Class 12 Book
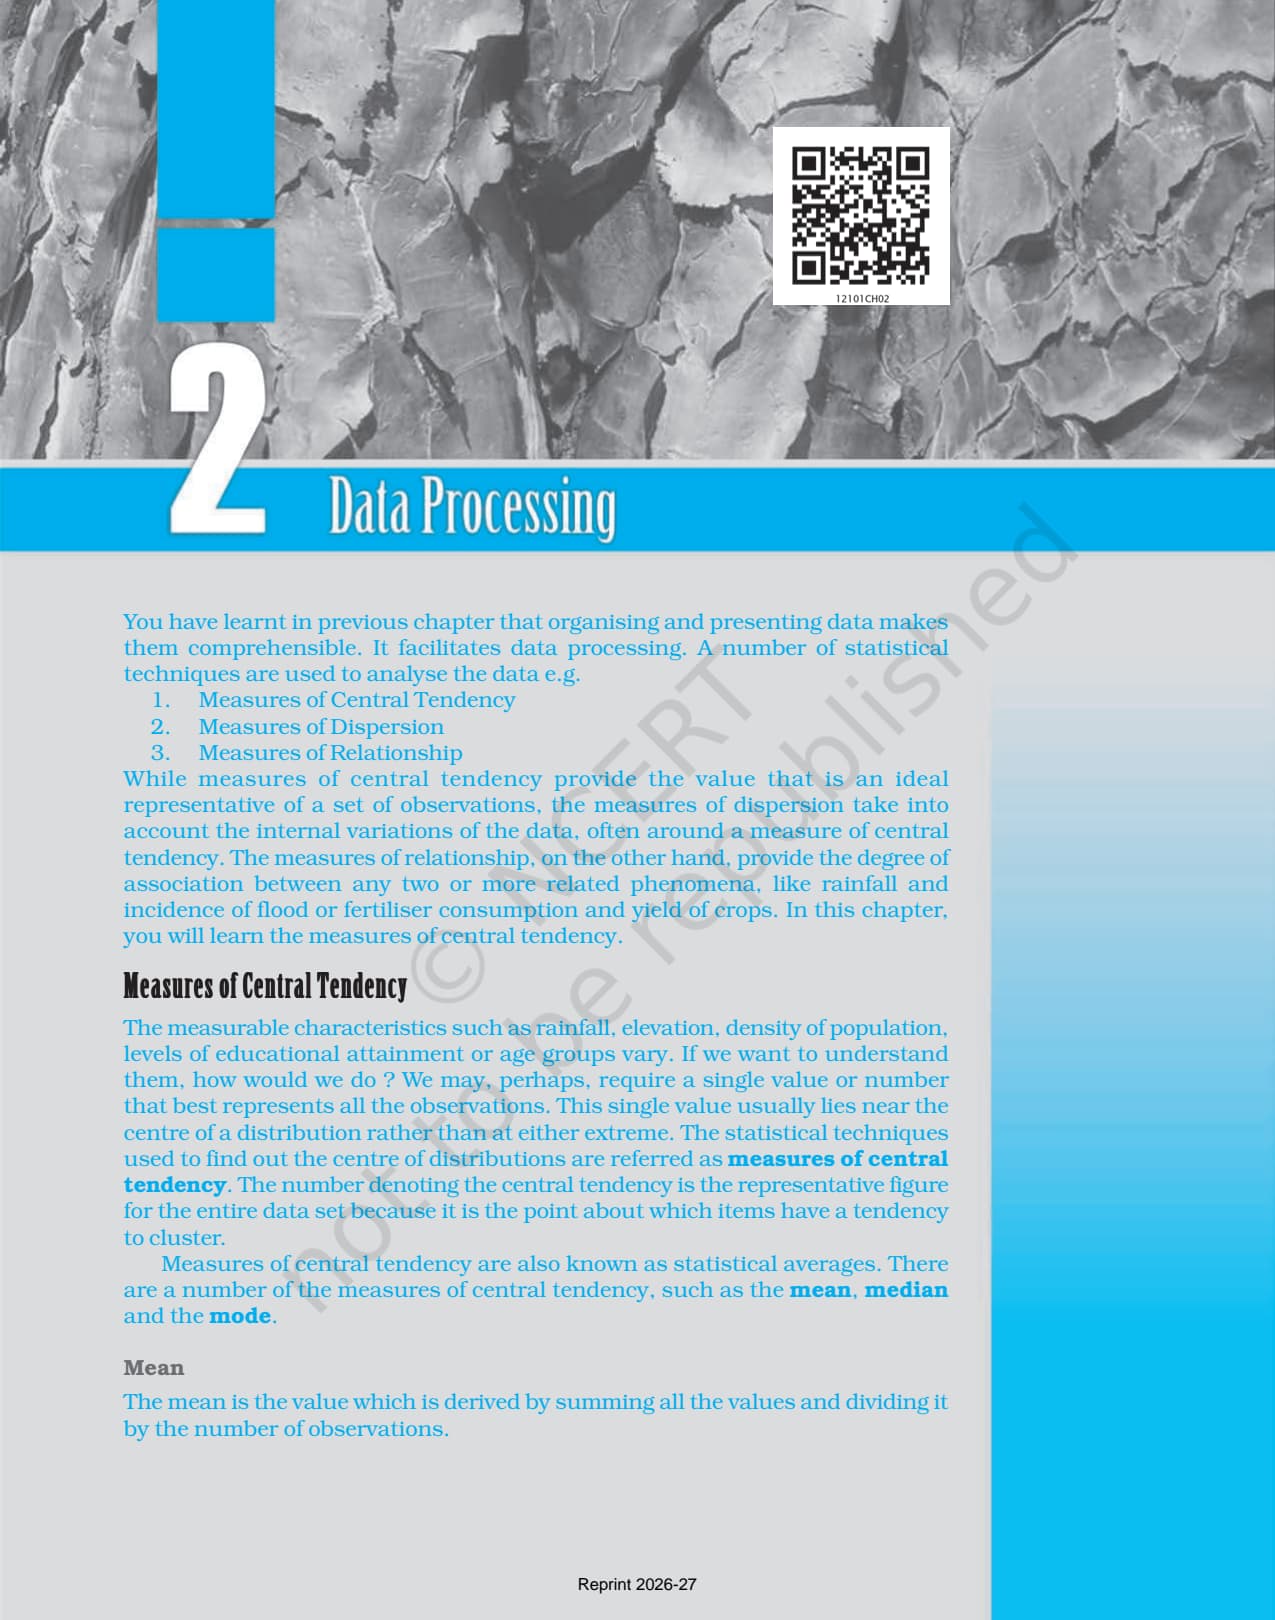
The data processing class 12 geography NCERT PDF is the official source for every board question on statistical averages. It explains how raw geographical data is turned into a single representative value using mean, median, and mode, then compares all three with the normal distribution curve and skewed data. The chapter builds on Chapter 1. For the 2026-27 board paper, read this PDF before any guide book, since every numerical and theory question traces back to these pages.
Source: AC eduhub on YouTube
Topics in the Chapter (Section-Wise Map of the NCERT PDF)
The PDF covers all three measures of central tendency and their comparison. The table below maps each topic to its exam concept.
| Topic | NCERT sub-topic | Dominant exam concept |
|---|---|---|
| Measures of Central Tendency | Introduction and overview | Definition, purpose, types: mean, median, mode |
| Mean | Ungrouped data: direct and indirect methods | Formula X = sum(x)/N; assumed mean shortcut; rainfall worked example |
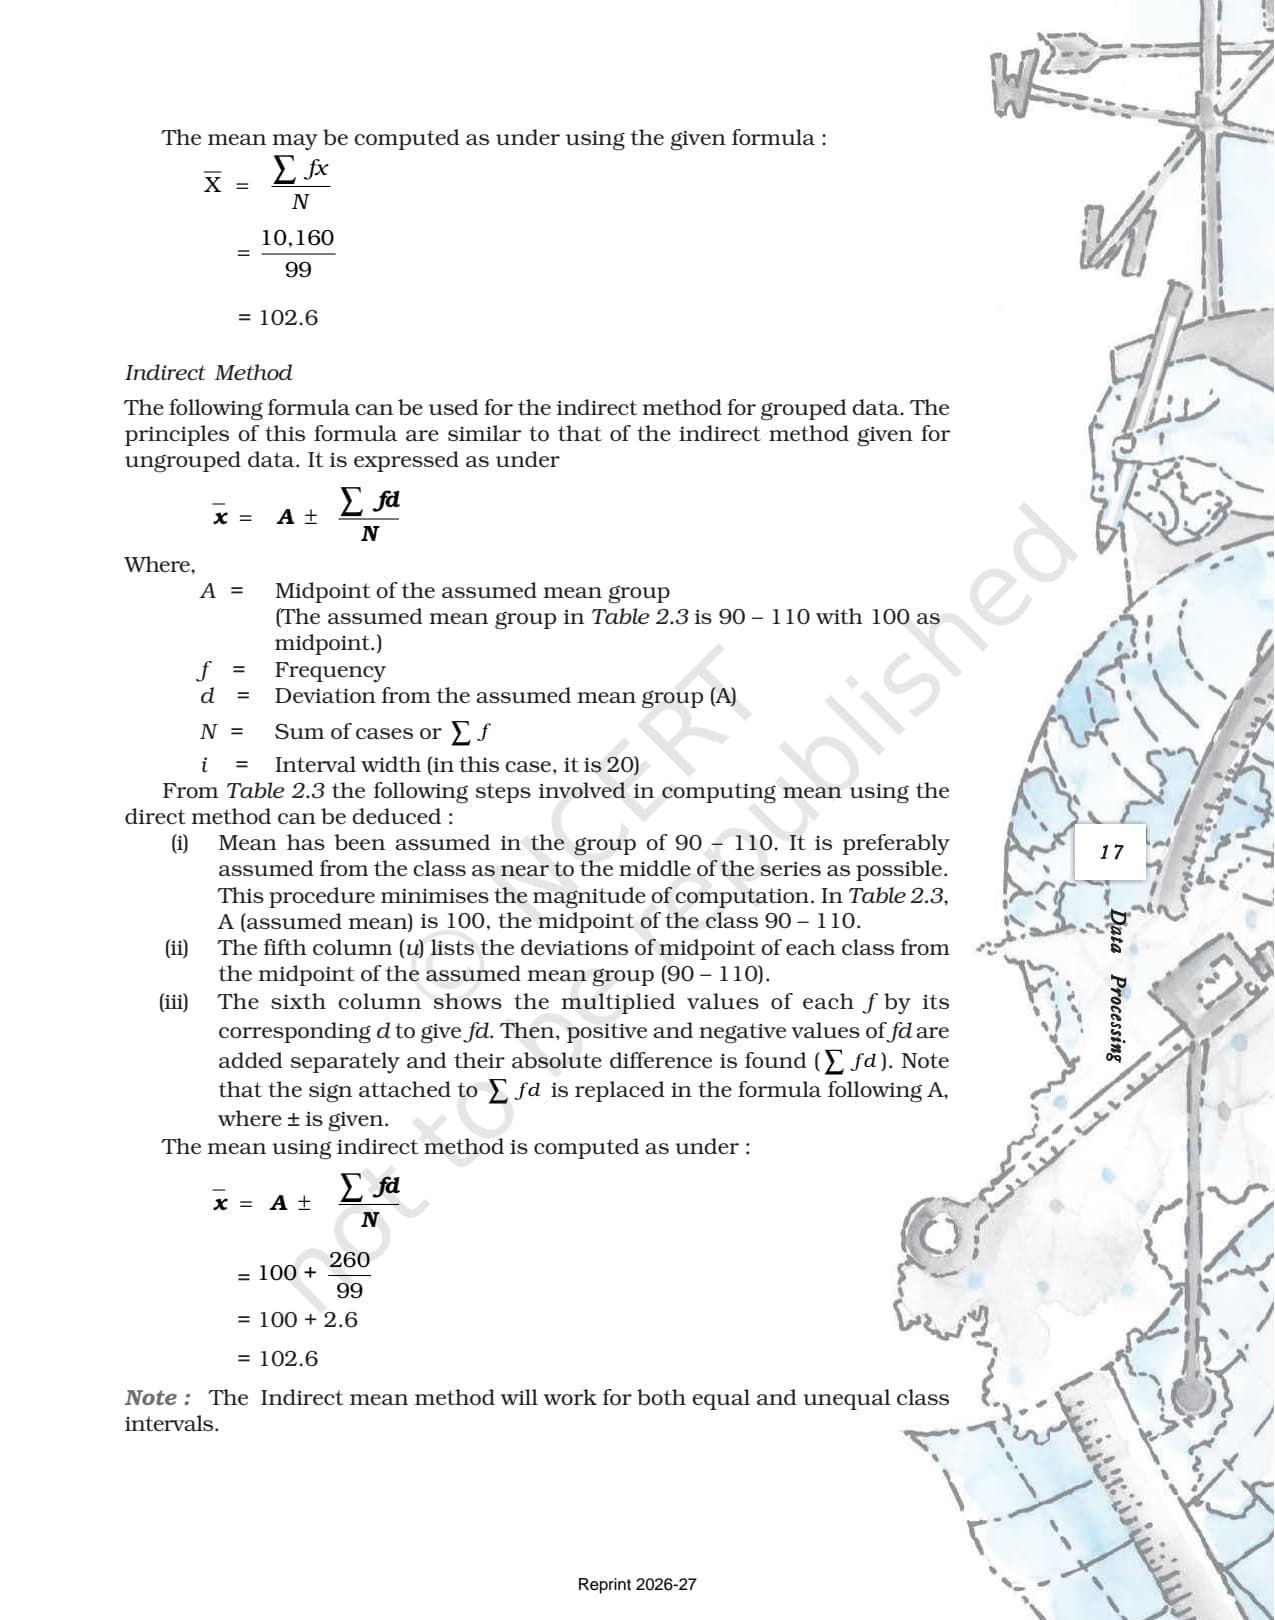
| Mean | Grouped data: direct and indirect methods | Formula X = sum(fx)/N; midpoint method; step-deviation method |
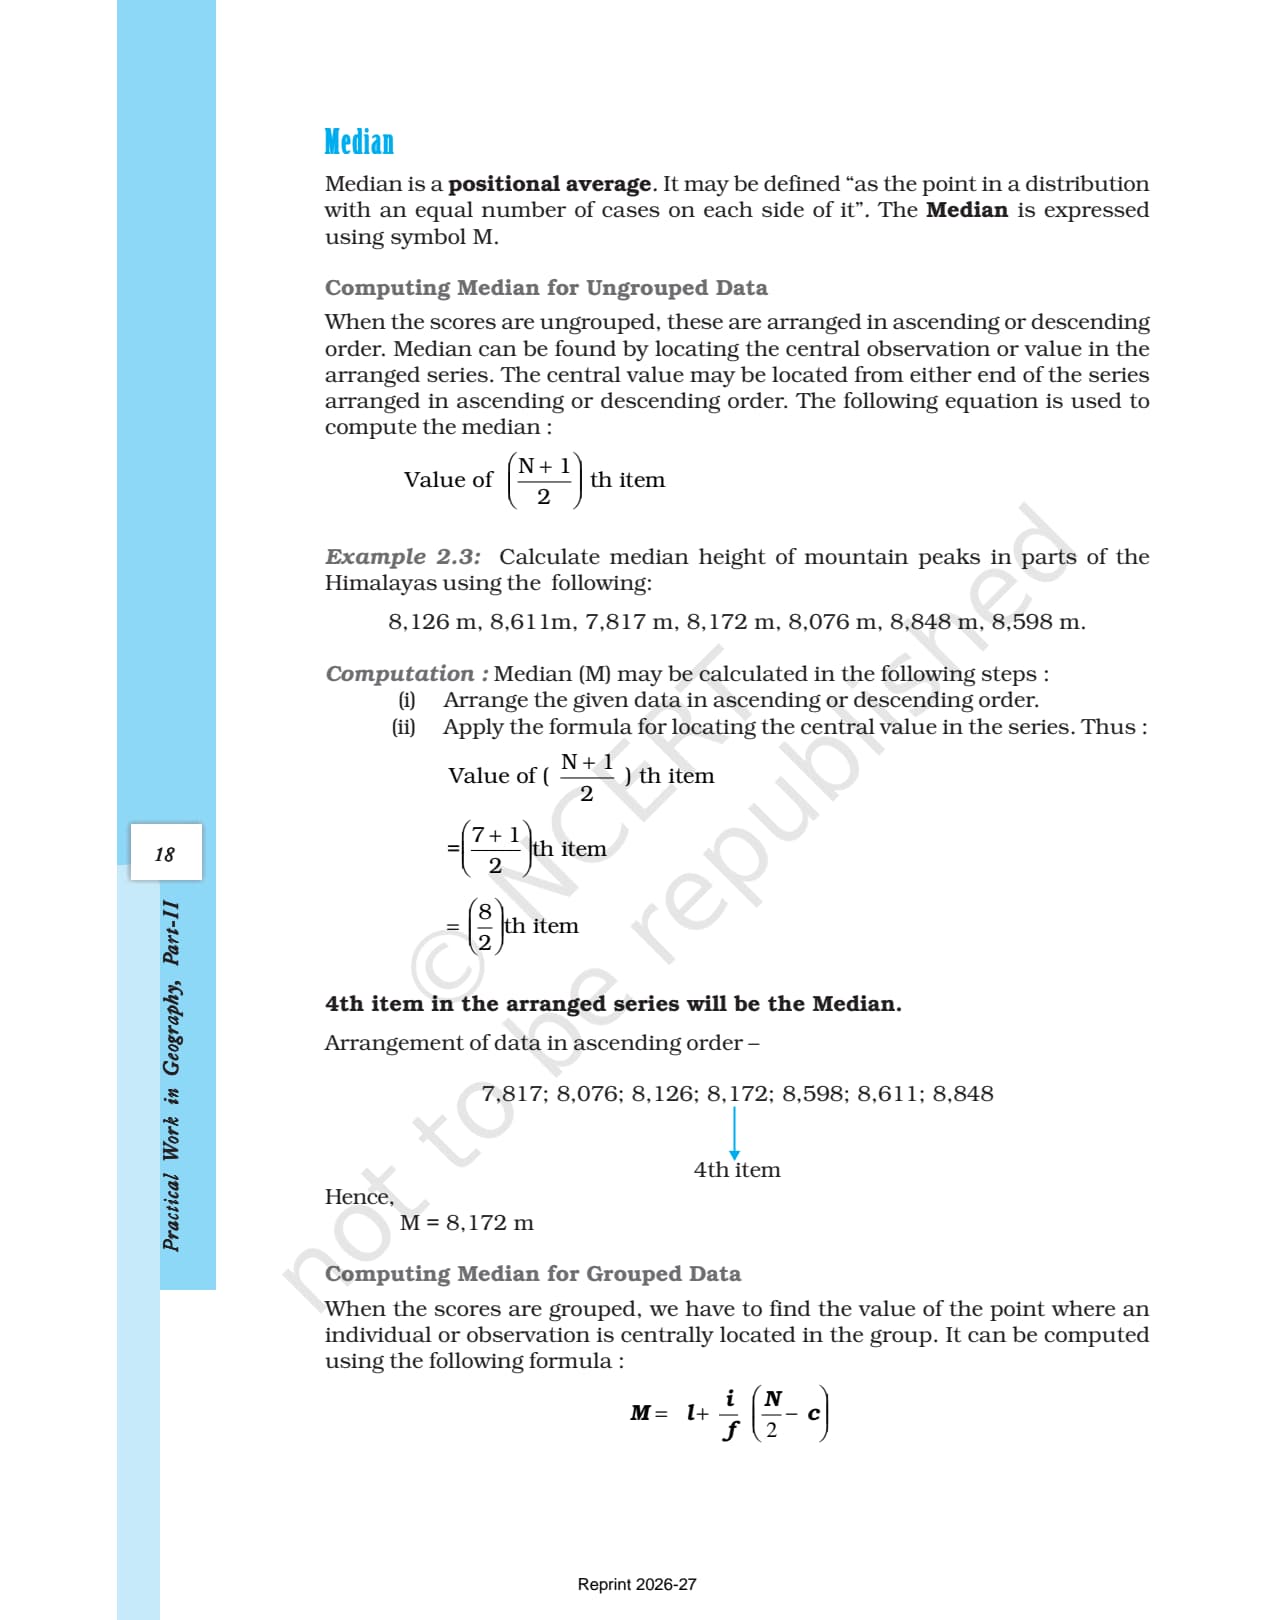
| Median | Ungrouped data | Arranging in order; locating middle rank; even-number rule |
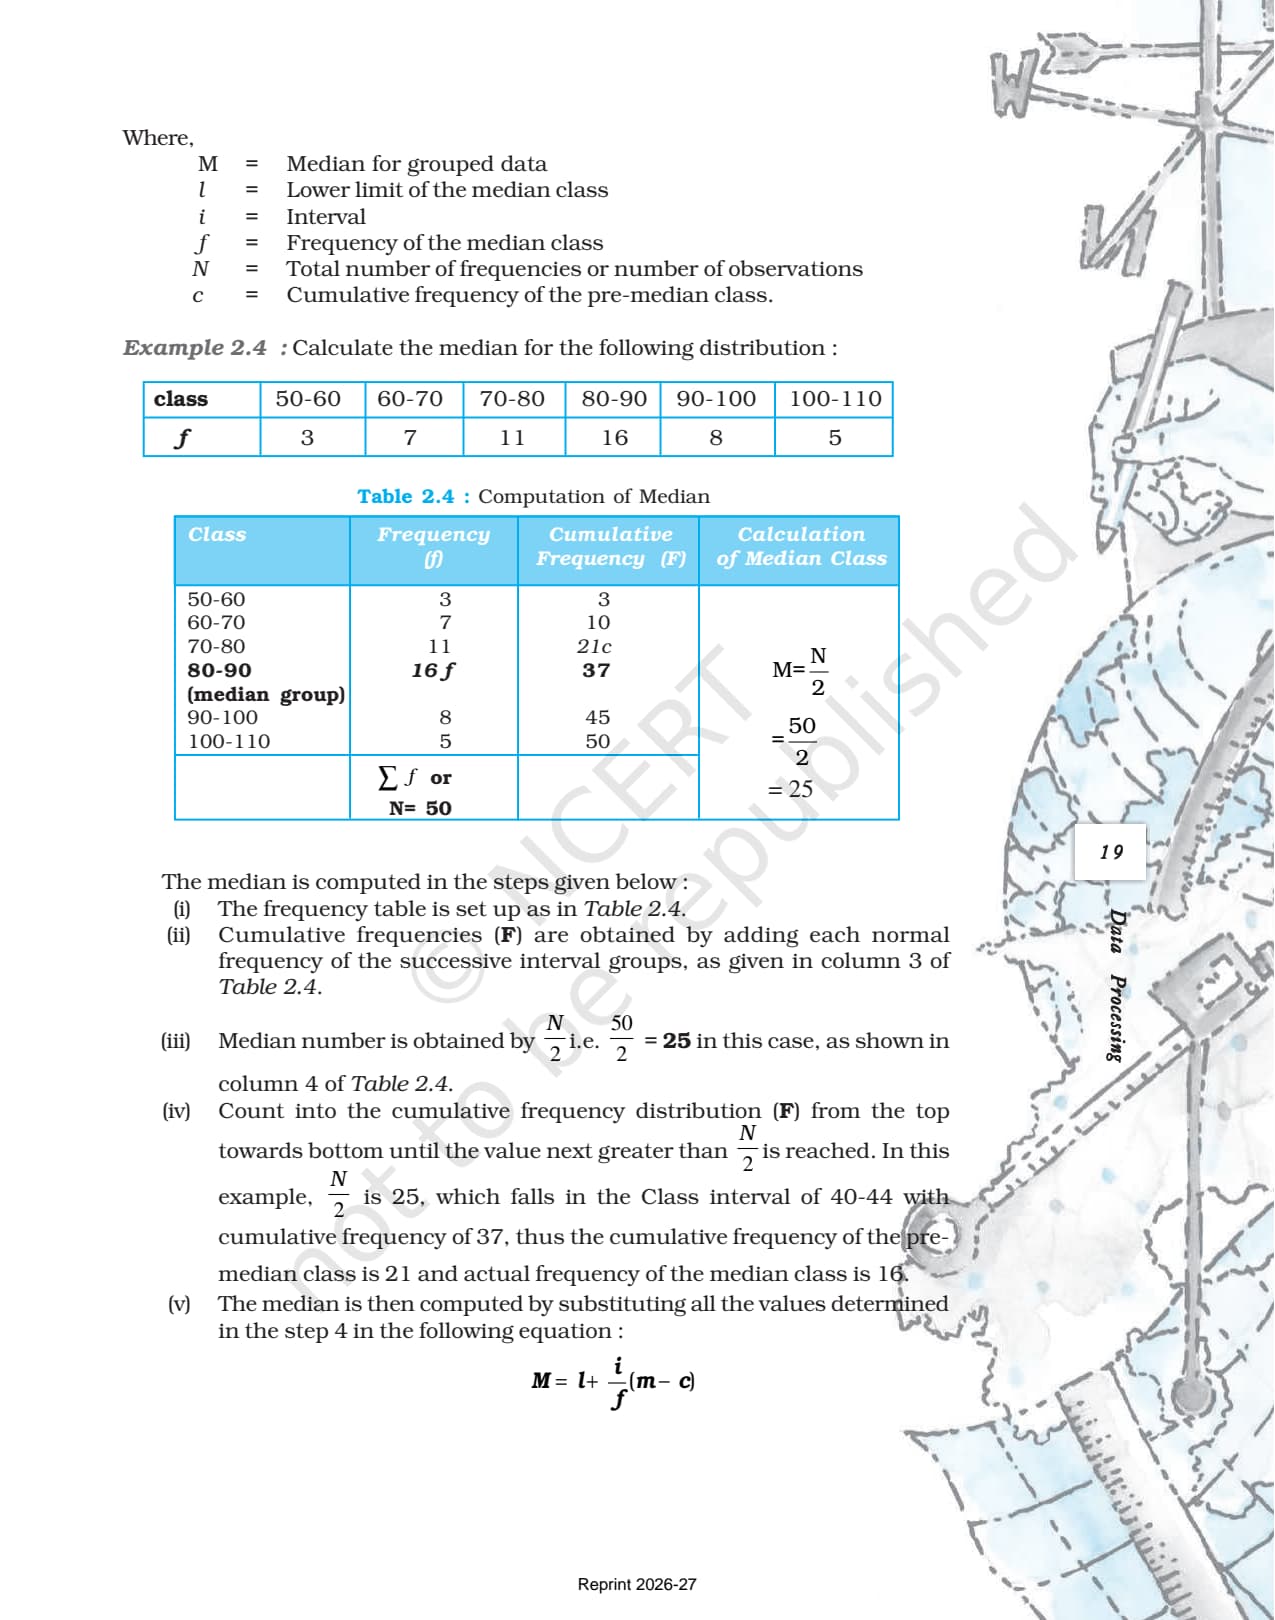
| Median | Grouped data | Formula M = l + (i/f)(N/2 - c); cumulative frequency method |
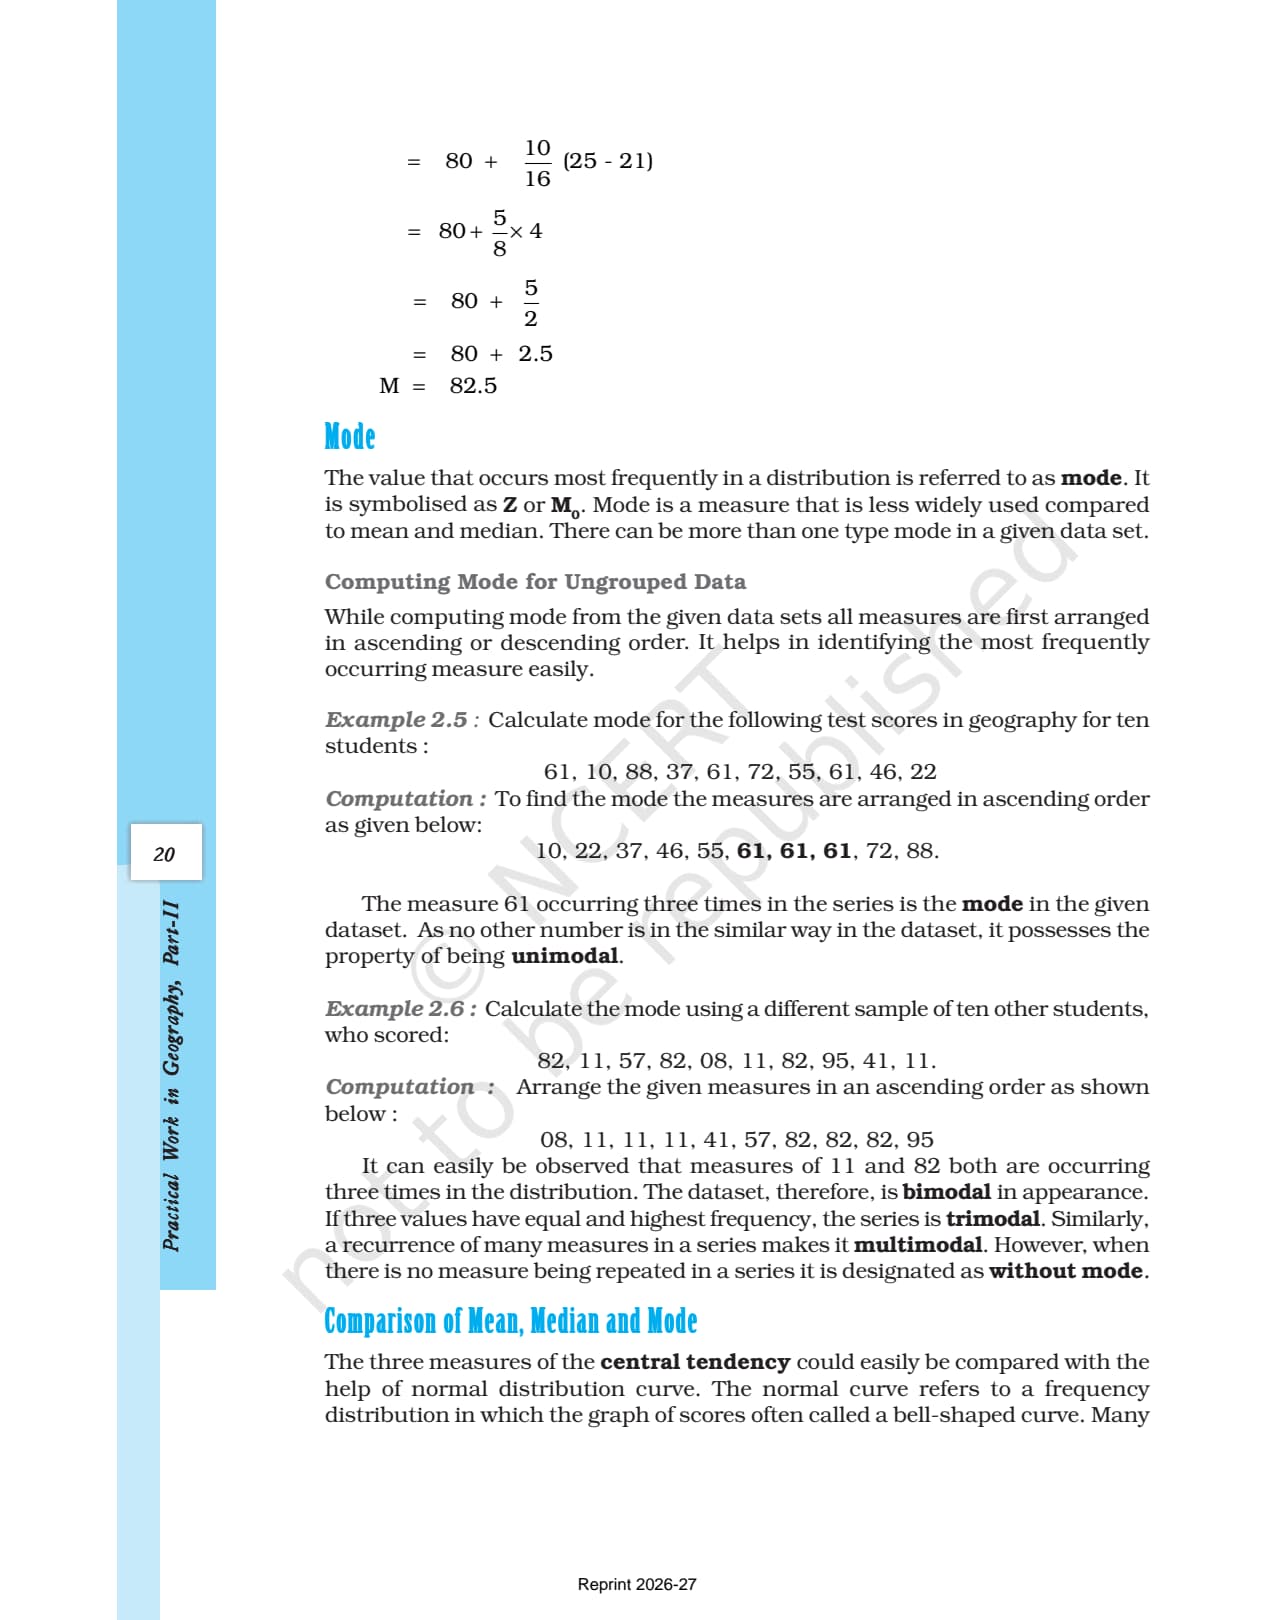
| Mode | Ungrouped data | Most frequent value; unimodal, bimodal, multimodal datasets |
| Comparison | Normal, positive skew, negative skew | Bell-shaped curve; relationship of mean, median, mode in symmetrical and skewed data |
Students preparing data processing class 12 notes should map each page of their notes to one row above. The mean section alone accounts for about half of all numerical questions from this chapter, because both direct and indirect methods are testable and the grouped-data variant adds computation that students often get wrong under exam pressure.
Key Concepts From the NCERT Textbook
The four concept blocks below are taken directly from the chapter. Reproducing this NCERT phrasing in the board paper is the fastest route to full marks on theory questions.
Mean: Direct and Indirect Methods
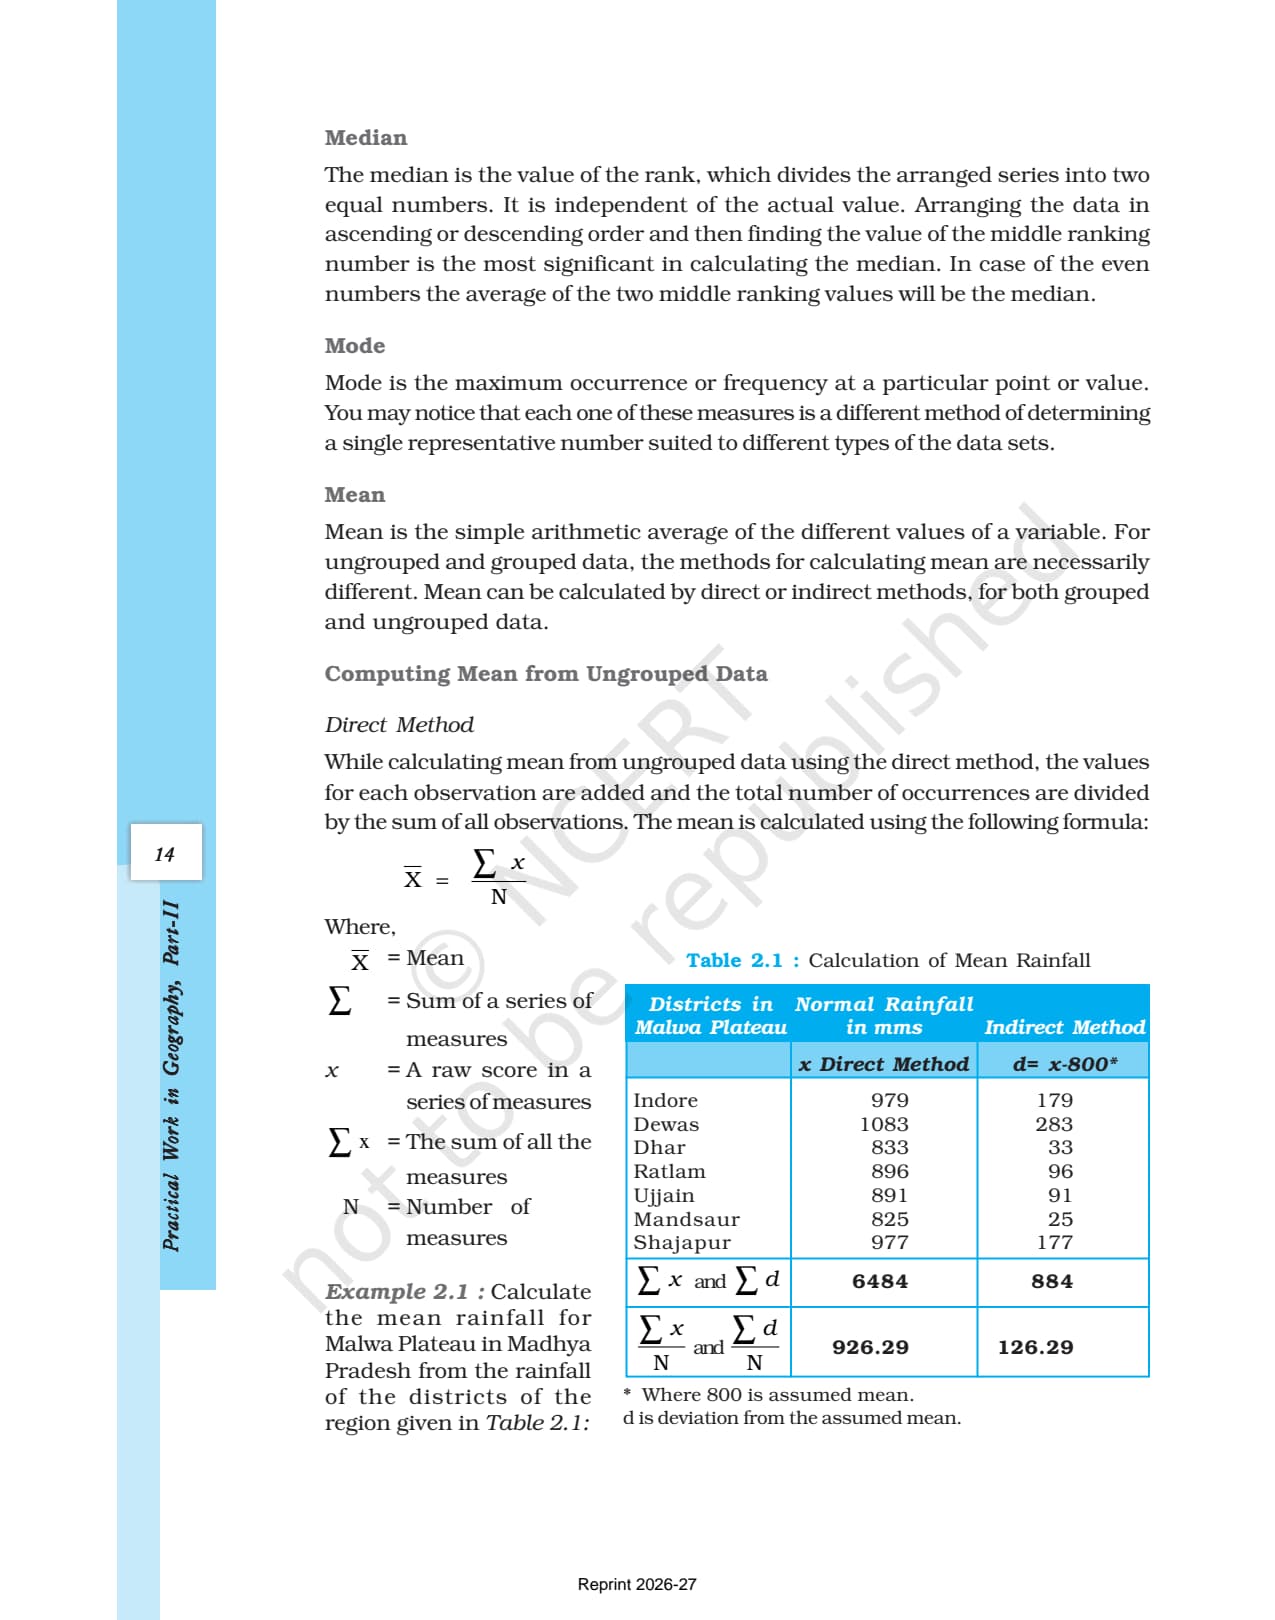
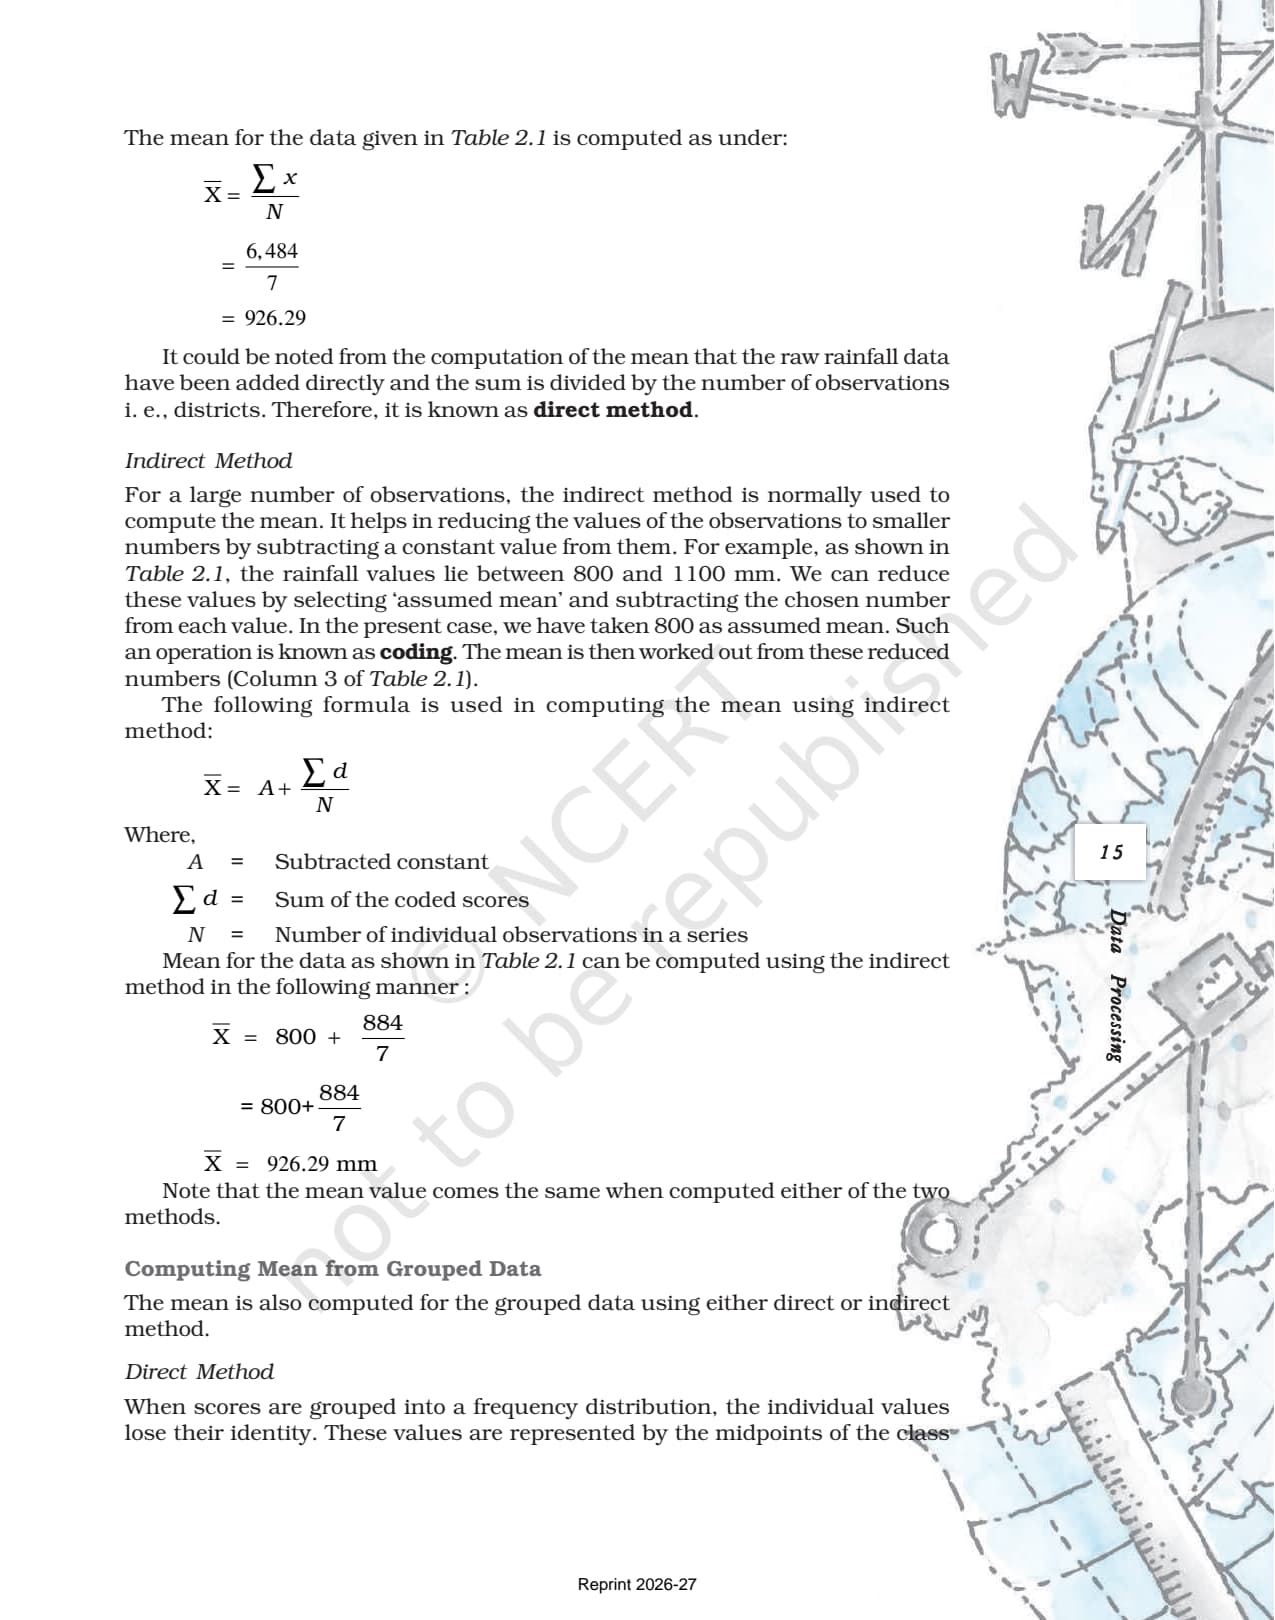
Mean is the value found by summing all observations and dividing by their number. For ungrouped data the direct method uses X = sum(x) / N. The PDF works a rainfall example for seven districts of the Malwa Plateau (mean = 926.29 mm). The indirect method uses an assumed mean (800 here) to shrink the numbers before computing, and reaches the same answer.
Mean from Grouped Data
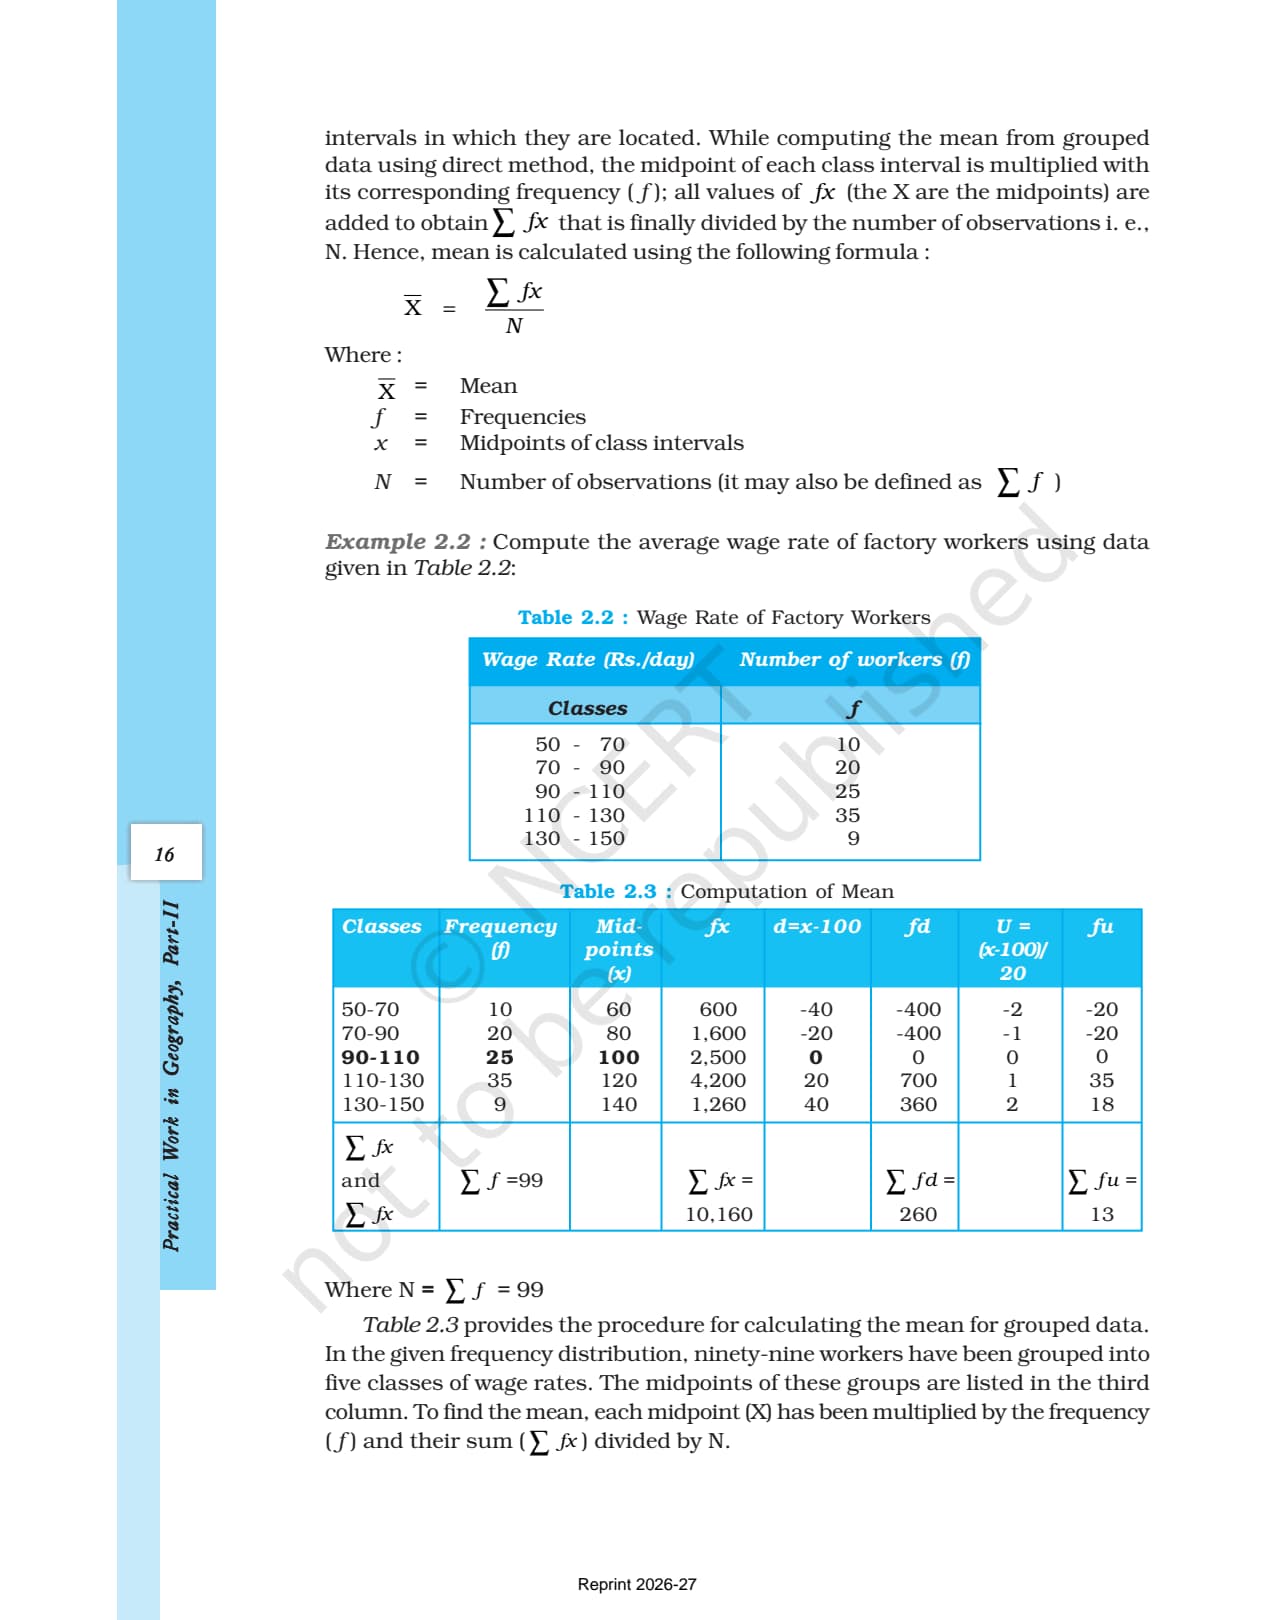
When data is grouped into class intervals, each class is represented by its midpoint, so the formula becomes X = sum(fx) / N, where f is the frequency and x is the midpoint. The step-deviation method converts each midpoint to a unit deviation u = (x - A) / i, where A is the assumed mean and i is the class width. The NCERT wage-rate example in Table 2.3 walks through all three methods side by side.
Median: Ungrouped and Grouped
Median is the value of the rank that splits an arranged series into two equal halves. For ungrouped data, arrange the values in ascending order and pick the middle rank (average the two middle values if the count is even). For grouped data, M = l + (i/f)(N/2 - c), where l is the lower limit of the median class, i is the class interval, f is its frequency, N is the total count, and c is the cumulative frequency before the median class.
Mode and the Normal Distribution Curve
Mode is the value that occurs most often; datasets can be unimodal, bimodal, or multimodal, and one with no repeating value has no mode. The chapter closes with the normal distribution curve, a symmetrical bell shape where mean, median, and mode coincide at the same central value. In positive skew the mean is pulled above the mode; in negative skew, below. A diagram of each type appears in the chapter and is often asked in short-answer questions.
Previous Year Question Trends From This NCERT Chapter
The data processing questions that appear in the CBSE board paper follow a stable pattern. Students preparing for the 2026-27 paper should expect roughly the same distribution shown below, because CBSE has not changed the structure of the Practical Work in Geography paper for this chapter. The chapter has averaged 4 to 5 marks across the last five board papers, with numerical questions on mean calculation appearing most frequently.
| Year | Marks | Question types | Most common topic |
|---|---|---|---|
| 2025 | 4 | 1 short answer + 1 numerical | Median from grouped data |
| 2024 | 5 | 1 MCQ + 1 short answer + 1 numerical | Mean by direct method |
| 2023 | 4 | 1 short answer + 1 numerical | Mode from ungrouped data |
| 2022 | 5 | 2 short answers + 1 numerical | Mean by indirect method; normal curve comparison |
| 2020 | 5 | 1 MCQ + 1 short answer + 1 numerical | Grouped data mean; skewed distribution |
The dominant question type across years is a three-to-five mark numerical asking students to calculate mean or median from grouped data. Both numericals require students to set up a frequency table with midpoints and cumulative frequencies, which is the exact method the NCERT PDF teaches in Tables 2.2, 2.3, and 2.4. Students who have worked through the textbook tables once score these marks reliably.
Connecting This Chapter to the Rest of Practical Work in Geography
Chapter 2 is the computational engine that feeds the remaining chapters. Without being able to process data into a central tendency measure, students cannot interpret graphical representations in Chapter 3 or analyse spatial data in Chapter 4. The measures of central tendency introduced here reappear as axis labels and summary statistics in every bar graph, histogram, and GIS dataset that the later chapters discuss.
| Later Chapter | Concept Inherited From Chapter 2 |
|---|---|
| Chapter 3: Graphical Representation of Data | Mean and median used to interpret bar graphs, frequency polygons, and Ogives drawn from the same datasets |
| Chapter 4: Spatial Information Technology | Statistical summaries (mean, mode) used to describe attribute data attached to geographic features in GIS |
Quick Glossary From the NCERT Chapter on Data Processing
The chapter introduces about fifteen technical terms. Students should be able to define each one in a single line for one-mark MCQs and short-answer questions. The glossary below extracts the most testable terms directly from the NCERT PDF. Using these exact definitions in the board paper is the fastest route to full marks on theory questions.
- Measures of central tendency: Statistical techniques used to find the centre of a distribution; also called statistical averages.
- Mean: The arithmetic average obtained by summing all observations and dividing by the number of observations.
- Assumed mean: A constant subtracted from all observations to reduce their size before computing mean by the indirect method.
- Coding: The operation of subtracting an assumed mean from each observation to obtain smaller deviation values.
- Median: The value of the rank that divides an arranged series into two equal halves; independent of extreme values.
- Mode: The value that occurs most frequently in a distribution; symbolised as Z or M0.
- Unimodal: A dataset with exactly one mode.
- Bimodal: A dataset with two values of equal highest frequency.
- Normal distribution curve: A symmetrical bell-shaped curve where mean, median, and mode coincide at the same central value.
- Positive skew: A distribution where extreme high values pull the mean above the median and mode.
- Negative skew: A distribution where extreme low values pull the mean below the median and mode.
Also Explore Other Resources for Class 12 Geography Chapter 2
| Resource | Link |
|---|---|
| NCERT Solutions | Class 12 Geography Chapter 2 PWG NCERT Solutions |
| Revision Notes | Class 12 Geography Chapter 2 PWG Notes |
| Handwritten Notes | Class 12 Geography Chapter 2 PWG Handwritten Notes |
| Subject Hub | Class 12 Geography All Chapters |
All Chapters: Class 12 Geography NCERT Book PDF (Practical Work in Geography)
| Chapter | NCERT Book PDF |
|---|---|
| Chapter 1 | Data: Its Source and Compilation NCERT Book PDF |
| Chapter 2 | Data Processing NCERT Book PDF (You are here) |
| Chapter 3 | Graphical Representation of Data NCERT Book PDF |
| Chapter 4 | Spatial Information Technology NCERT Book PDF |
Frequently Asked Questions on Class 12 Geography Chapter 2 PWG NCERT Book PDF
Ques. Where can students download the official NCERT Class 12 Geography Practical Work Chapter 2 PDF?
Ans. Students can download the official data processing class 12 geography NCERT book PDF directly from the download card at the top of this page. The PDF is the single-chapter file from the Practical Work in Geography textbook, aligned to the 2026-27 CBSE syllabus.
Ques. What are the three measures of central tendency in Class 12 Geography Chapter 2?
Ans. The three measures are mean (arithmetic average), median (middle value of a ranked series), and mode (most frequently occurring value). Each is suited to a different type of dataset and a different analytical purpose in geographical studies.
Ques. What is the difference between the direct and indirect methods of calculating mean?
Ans. The direct method adds all raw observation values and divides by the count (X = sum(x)/N). The indirect method subtracts an assumed mean from each value to create smaller deviation scores, computes the mean of those deviations, and adds the assumed mean back. Both methods give the same answer. The indirect method is faster when the original values are large numbers.
Ques. How is median calculated for grouped data in the NCERT Class 12 Geography chapter?
Ans. The formula is M = l + (i/f)(N/2 - c), where l is the lower limit of the median class, i is the class interval width, f is the frequency of the median class, N is the total number of observations, and c is the cumulative frequency of the class before the median class. The median class is the one whose cumulative frequency first crosses N/2.
Ques. What is a normal distribution curve and why does it matter in this chapter?
Ans. A normal distribution curve is a symmetrical bell-shaped frequency distribution where mean, median, and mode all coincide at the same central value. It matters because it is the reference shape against which skewed distributions are compared. In positive skew, the mean is pulled above the mode; in negative skew, the mean falls below the mode. The chapter's Figures 2.1, 2.2, and 2.3 illustrate all three shapes.
Ques. What is the step-deviation method for computing mean from grouped data?
Ans. The step-deviation method converts each class midpoint into a unit deviation u = (x - A) / i, where A is the assumed mean and i is the class width. Mean is then computed as X = A + i x (sum(fu)/N). This method reduces both the size and the number of decimal places in the working, making it easier to use in an exam setting where mental arithmetic is required.
Ques. What is the difference between unimodal, bimodal, and multimodal distributions?
Ans. A unimodal distribution has exactly one value occurring most frequently. A bimodal distribution has two values with equal highest frequency. A trimodal distribution has three such values and a multimodal distribution has many. When no value repeats, the dataset has no mode at all. These distinctions appear in MCQ and short-answer questions in the CBSE board paper.
Ques. How does Class 12 Geography Chapter 2 relate to CBSE board exam preparation for 2026-27?
Ans. The chapter contributes 4 to 5 marks to the CBSE board paper through a combination of MCQs, short-answer theory questions on definitions, and one numerical question on mean or median. The 2026-27 syllabus is unchanged from previous years. Students who read the official NCERT PDF and work through the three exercise questions in the chapter are well prepared for all question types.
Ques. How does CUET test Class 12 Geography Practical Work Chapter 2?
Ans. CUET Geography questions from this chapter typically appear as MCQs testing the formula for mean or median, the definition of mode, and the characteristic of the normal distribution curve. Students preparing for CUET should focus on the formula definitions and the comparison of mean, median, and mode in symmetrical versus skewed distributions, as these are the most MCQ-friendly concepts in the chapter.
Ques. What is the best order to use the NCERT PDF, Notes, and Solutions for Class 12 Geography Chapter 2?
Ans. Read the NCERT PDF cold first, working through the Malwa Plateau and wage-rate examples on paper. Then open the Class 12 Geography Chapter 2 PWG Notes alongside the PDF and write all formulas in your own words. Attempt all exercise questions and verify them against the NCERT Solutions. Use the handwritten notes for last-mile revision the night before the exam.



Comments