




NCERT Class 8 Mathematics Chapter 5 Tales by Dots and Lines Notes cover mean, median, frequency tables, spreadsheets and line graphs for the 2026-27 Ganita Prakash Part 2 syllabus. The notes explain each idea with dot plots, short formulas, graph-reading steps and a 20-page revision PDF.
- Download a 20-page NCERT Notes PDF for Class 8 Mathematics Part 2 Chapter 5.
- Revise mean, median, frequency tables and line graphs in one place.
- Use the inline images for quick recall before a class test.
Chapter5TalesbyDotsandLinesNotes.pdf?page=1&dpi=150)
Chapter5TalesbyDotsandLinesNotes.pdf?page=2&dpi=150)
Chapter5TalesbyDotsandLinesNotes.pdf?page=3&dpi=150)
Chapter5TalesbyDotsandLinesNotes.pdf?page=4&dpi=150)
Chapter5TalesbyDotsandLinesNotes.pdf?page=5&dpi=150)
Chapter5TalesbyDotsandLinesNotes.pdf?page=6&dpi=150)
Chapter5TalesbyDotsandLinesNotes.pdf?page=7&dpi=150)
Chapter5TalesbyDotsandLinesNotes.pdf?page=8&dpi=150)
Chapter5TalesbyDotsandLinesNotes.pdf?page=9&dpi=150)
Chapter5TalesbyDotsandLinesNotes.pdf?page=10&dpi=150)
Chapter5TalesbyDotsandLinesNotes.pdf?page=11&dpi=150)
Chapter5TalesbyDotsandLinesNotes.pdf?page=12&dpi=150)
Chapter5TalesbyDotsandLinesNotes.pdf?page=13&dpi=150)
Chapter5TalesbyDotsandLinesNotes.pdf?page=14&dpi=150)
Chapter5TalesbyDotsandLinesNotes.pdf?page=15&dpi=150)
Chapter5TalesbyDotsandLinesNotes.pdf?page=16&dpi=150)
Chapter5TalesbyDotsandLinesNotes.pdf?page=17&dpi=150)
Chapter5TalesbyDotsandLinesNotes.pdf?page=18&dpi=150)
Chapter5TalesbyDotsandLinesNotes.pdf?page=19&dpi=150)
Chapter5TalesbyDotsandLinesNotes.pdf?page=20&dpi=150)
Chapter5TalesbyDotsandLinesNotes_flat_MobileCard.pdf?page=1&dpi=150)
Chapter5TalesbyDotsandLinesNotes_flat_MobileCard.pdf?page=2&dpi=150)
Chapter5TalesbyDotsandLinesNotes_flat_MobileCard.pdf?page=3&dpi=150)
Chapter5TalesbyDotsandLinesNotes_flat_MobileCard.pdf?page=4&dpi=150)
Chapter5TalesbyDotsandLinesNotes_flat_MobileCard.pdf?page=5&dpi=150)
Chapter5TalesbyDotsandLinesNotes_flat_MobileCard.pdf?page=6&dpi=150)
Chapter5TalesbyDotsandLinesNotes_flat_MobileCard.pdf?page=7&dpi=150)
Chapter5TalesbyDotsandLinesNotes_flat_MobileCard.pdf?page=8&dpi=150)
Chapter5TalesbyDotsandLinesNotes_flat_MobileCard.pdf?page=9&dpi=150)
Chapter5TalesbyDotsandLinesNotes_flat_MobileCard.pdf?page=10&dpi=150)
Chapter5TalesbyDotsandLinesNotes_flat_MobileCard.pdf?page=11&dpi=150)
Chapter5TalesbyDotsandLinesNotes_flat_MobileCard.pdf?page=12&dpi=150)
Chapter5TalesbyDotsandLinesNotes_flat_MobileCard.pdf?page=13&dpi=150)
Chapter5TalesbyDotsandLinesNotes_flat_MobileCard.pdf?page=14&dpi=150)
Chapter5TalesbyDotsandLinesNotes_flat_MobileCard.pdf?page=15&dpi=150)
Chapter5TalesbyDotsandLinesNotes_flat_MobileCard.pdf?page=16&dpi=150)
Chapter5TalesbyDotsandLinesNotes_flat_MobileCard.pdf?page=17&dpi=150)
Chapter5TalesbyDotsandLinesNotes_flat_MobileCard.pdf?page=18&dpi=150)
Chapter5TalesbyDotsandLinesNotes_flat_MobileCard.pdf?page=19&dpi=150)
Chapter5TalesbyDotsandLinesNotes_flat_MobileCard.pdf?page=20&dpi=150)
Chapter5TalesbyDotsandLinesNotes_flat_MobileCard.pdf?page=21&dpi=150)
Chapter5TalesbyDotsandLinesNotes_flat_MobileCard.pdf?page=22&dpi=150)
Chapter5TalesbyDotsandLinesNotes_flat_MobileCard.pdf?page=23&dpi=150)
Chapter5TalesbyDotsandLinesNotes_flat_MobileCard.pdf?page=24&dpi=150)
Chapter5TalesbyDotsandLinesNotes_flat_MobileCard.pdf?page=25&dpi=150)
Chapter5TalesbyDotsandLinesNotes_flat_MobileCard.pdf?page=26&dpi=150)
Chapter5TalesbyDotsandLinesNotes_flat_MobileCard.pdf?page=27&dpi=150)
Chapter5TalesbyDotsandLinesNotes_flat_MobileCard.pdf?page=28&dpi=150)
|
Table of Contents |
NCERT Class 8 Mathematics Chapter 5 Notes PDF Overview
The chapter begins with a simple question: how can a number represent the centre of a data set? NCERT answers this through dots and lines, so students can see data before calculating. Mean is treated as a balance point, while median is treated as the middle position after sorting.
The most important idea is that mean uses every value, but median uses order. This difference helps students decide which method fits a question.
| Topic | What Students Revise | Quick Cue |
|---|---|---|
| Mean | Fair share, balance point and change in mean. | Use total and count. |
| Median | Middle value and cumulative frequency. | Sort first. |
| Graphs | Line graphs and safe conclusions. | Read scale first. |
Tales by Dots and Lines Video Revision
Source: Magnet Brains on YouTube
Mean as a Balance Point in Tales by Dots and Lines
For two numbers, the mean is the midpoint. For larger data sets, the mean is better understood as a point where the total distance on the left balances the total distance on the right. This is why the chapter uses dot plots instead of only a formula.
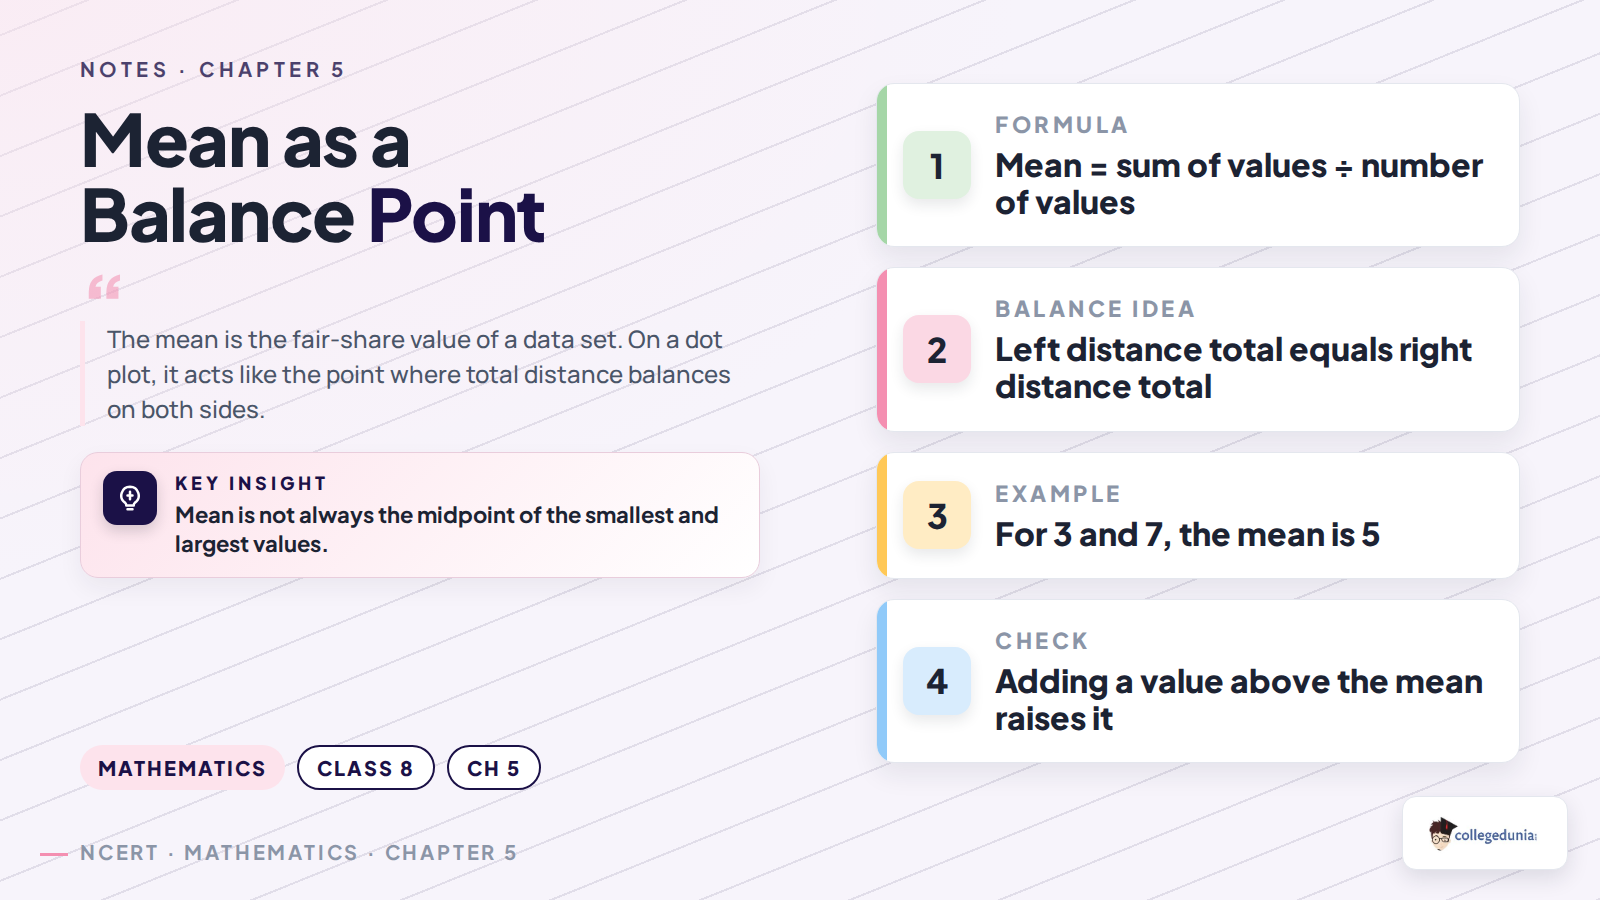
For example, in the data 10, 10, 11 and 17, the mean is 12. The distances on the left are 2, 2 and 1, and the distance on the right is 5. Both sides balance at 12.
Common mistake: students often take the midpoint of the smallest and largest values. That does not always give the mean.
How the Mean Changes When Data Changes
The chapter asks students to predict the direction of change before calculating. If a value greater than the mean is added, the mean increases. If a smaller value is added, the mean decreases. If a value equal to the mean is added, the mean stays the same.
When every value increases by a fixed number, the mean increases by the same number. When every value is multiplied by a fixed number, the mean is also multiplied by that number.
- Shift rule: old mean a, add k to every value, new mean a+k.
- Scale rule: old mean a, multiply every value by k, new mean ka.
- Unchanged mean: added values must balance around the old mean.
Median and Frequency Tables in Class 8 Mathematics Chapter 5
Median depends on order. For an odd number of values, take the middle value. For an even number of values, take the average of the two middle values. In a frequency table, students do not need to write every repeated value. They can use cumulative frequency.
Frequency tables need two different habits: multiply for mean, accumulate for median. This one line prevents most mistakes from the NCERT examples.
| Task | Method |
|---|---|
| Mean from frequency table | Use sum of value times frequency divided by total frequency. |
| Median from frequency table | Use cumulative frequency to locate the middle position. |
Finding Unknown Values Using the Mean
NCERT uses the wrestler-weight example and coconut-harvest example to show a useful trick. First convert the average into total. Then subtract the known total or correct the wrong total.
Unknown value method: total equals mean times number of values. Missing value equals total minus known total. For corrected data, adjust the total first and divide again.
This method is useful in marks, attendance, harvest and sports questions because students can repair a data set without rewriting every value.
Line Graphs and Spreadsheet Data Interpretation
After mean and median, the chapter moves to spreadsheets and graphs. A spreadsheet stores rows, columns and formulas. A line graph connects data points, usually across time, and helps students notice increase, decrease and sudden jumps.
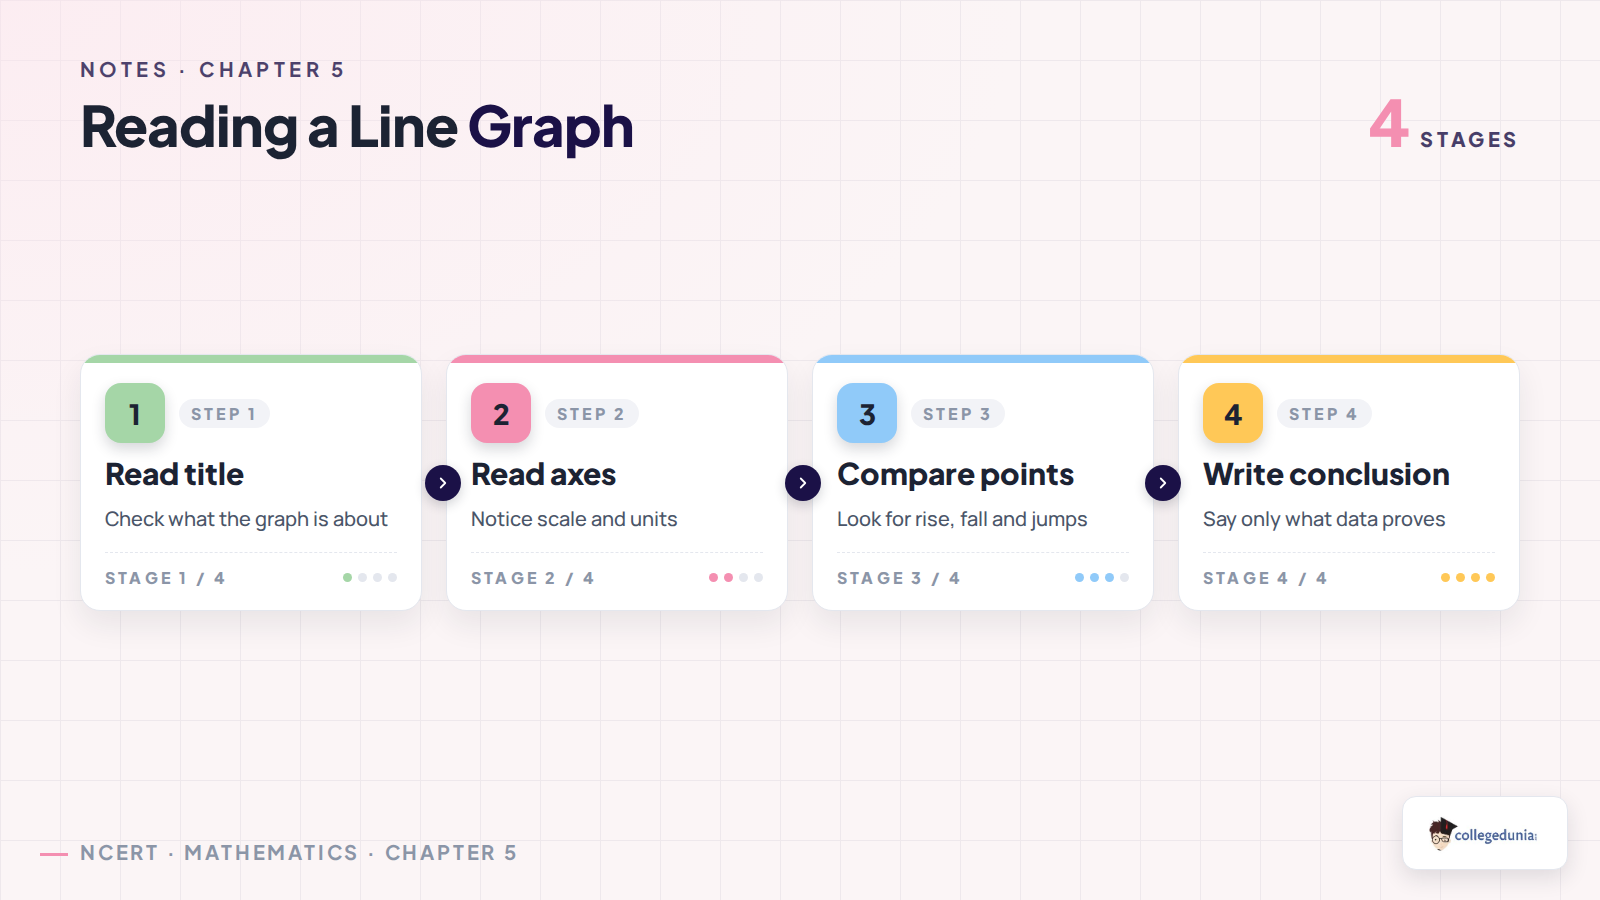
A safe graph conclusion says what the data shows. It does not guess the reason unless extra information is given. For example, a rising line shows increase, but not the cause of the increase.
How to Use These Class 8 Mathematics Notes
Start with the PDF for one quick reading. Then use the tables above to revise mean, median and graph interpretation. After that, solve the NCERT Figure It Out questions from the textbook.
- Use the mean section before questions on missing values.
- Use the median section before frequency-table questions.
- Use the graph section before line graph and activity-strip questions.
Related NCERT Class 8 Mathematics Chapter 5 Resources
Use these links when you want the chapter PDF, solved exercises or visual notes from the same Class 8 Mathematics chapter.
| Resource | Link |
|---|---|
| NCERT Solutions | Class 8 Mathematics Chapter 5 NCERT Solutions |
| NCERT Book PDF | Class 8 Mathematics Chapter 5 Book PDF |
| Handwritten Notes | Class 8 Mathematics Chapter 5 Handwritten Notes |
All Chapters for Class 8 Mathematics Part 2 Notes
| Chapter | Notes |
|---|---|
| Chapter 1 Fractions in Disguise | Class 8 Mathematics Notes |
| Chapter 2 The Baudhayana Pythagoras Theorem | Class 8 Mathematics Notes |
| Chapter 3 Proportional Reasoning 2 | Class 8 Mathematics Notes |
| Chapter 4 Exploring Some Geometric Themes | Class 8 Mathematics Notes |
| Chapter 5 Tales by Dots and Lines | Current chapter notes |
Common Questions Before Downloading the Notes
NCERT Class 8 Mathematics Chapter 5 Notes FAQs
Ques. What is covered in NCERT Class 8 Mathematics Chapter 5 Tales by Dots and Lines?
Ans. The chapter covers mean, median, frequency tables, spreadsheets, line graphs and data interpretation using dot plots and visual reasoning.
Ques. What is the main idea of mean in this chapter?
Ans. Mean is shown as a balance point. It is the value where total distance on the left balances total distance on the right.
Ques. How is median different from mean?
Ans. Median depends on the middle position after sorting the data. Mean depends on the total of all values divided by the count.
Ques. How should students revise line graphs from this chapter?
Ans. Students should read the title, axes, scale and units first, compare the plotted points, and write only conclusions supported by the data.



Comments