



These Notes for Class 10 Maths Chapter 13 Statistics cover the three measures of central tendency (mean, median, mode) for grouped data, cumulative frequency, and the ogive graph. They follow the 2026-27 CBSE syllabus. Statistics is one of the most scoring chapters in the board paper.
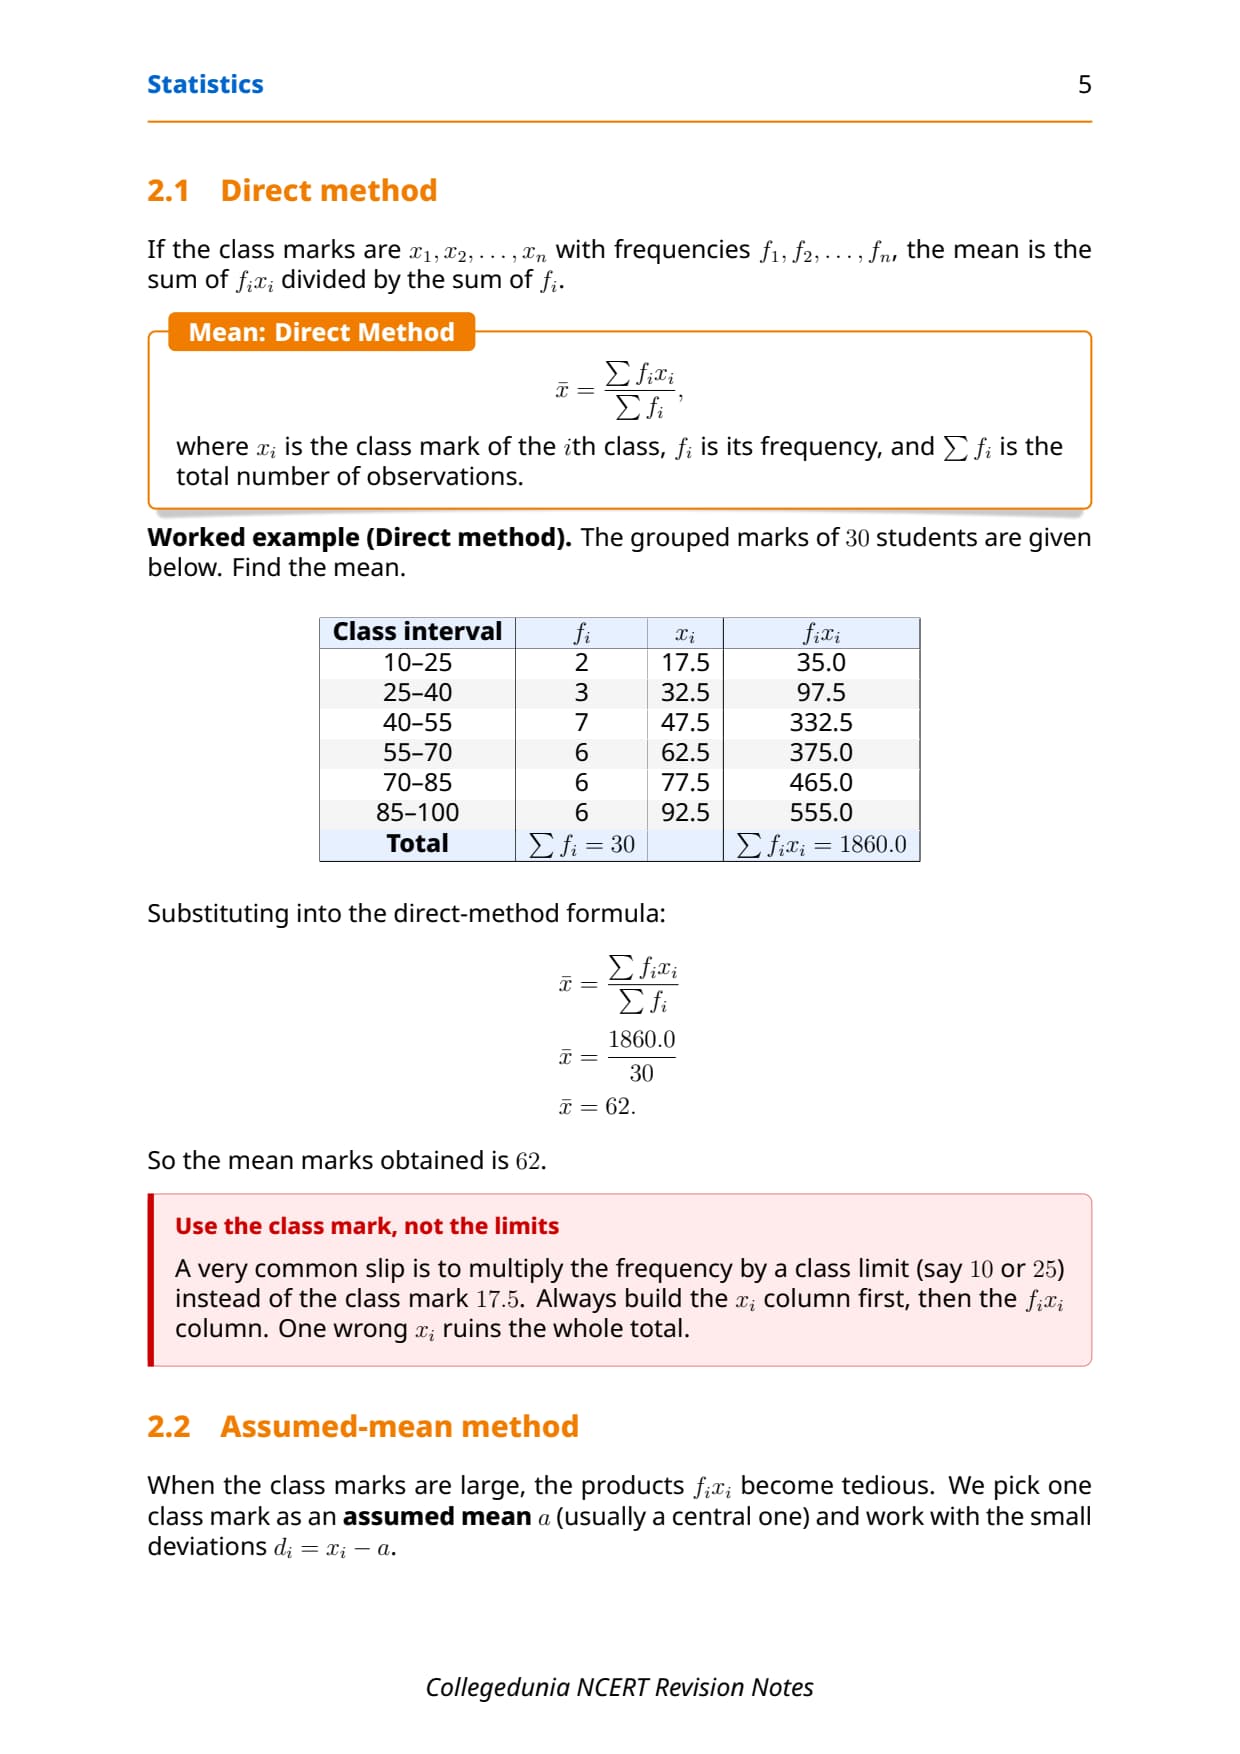
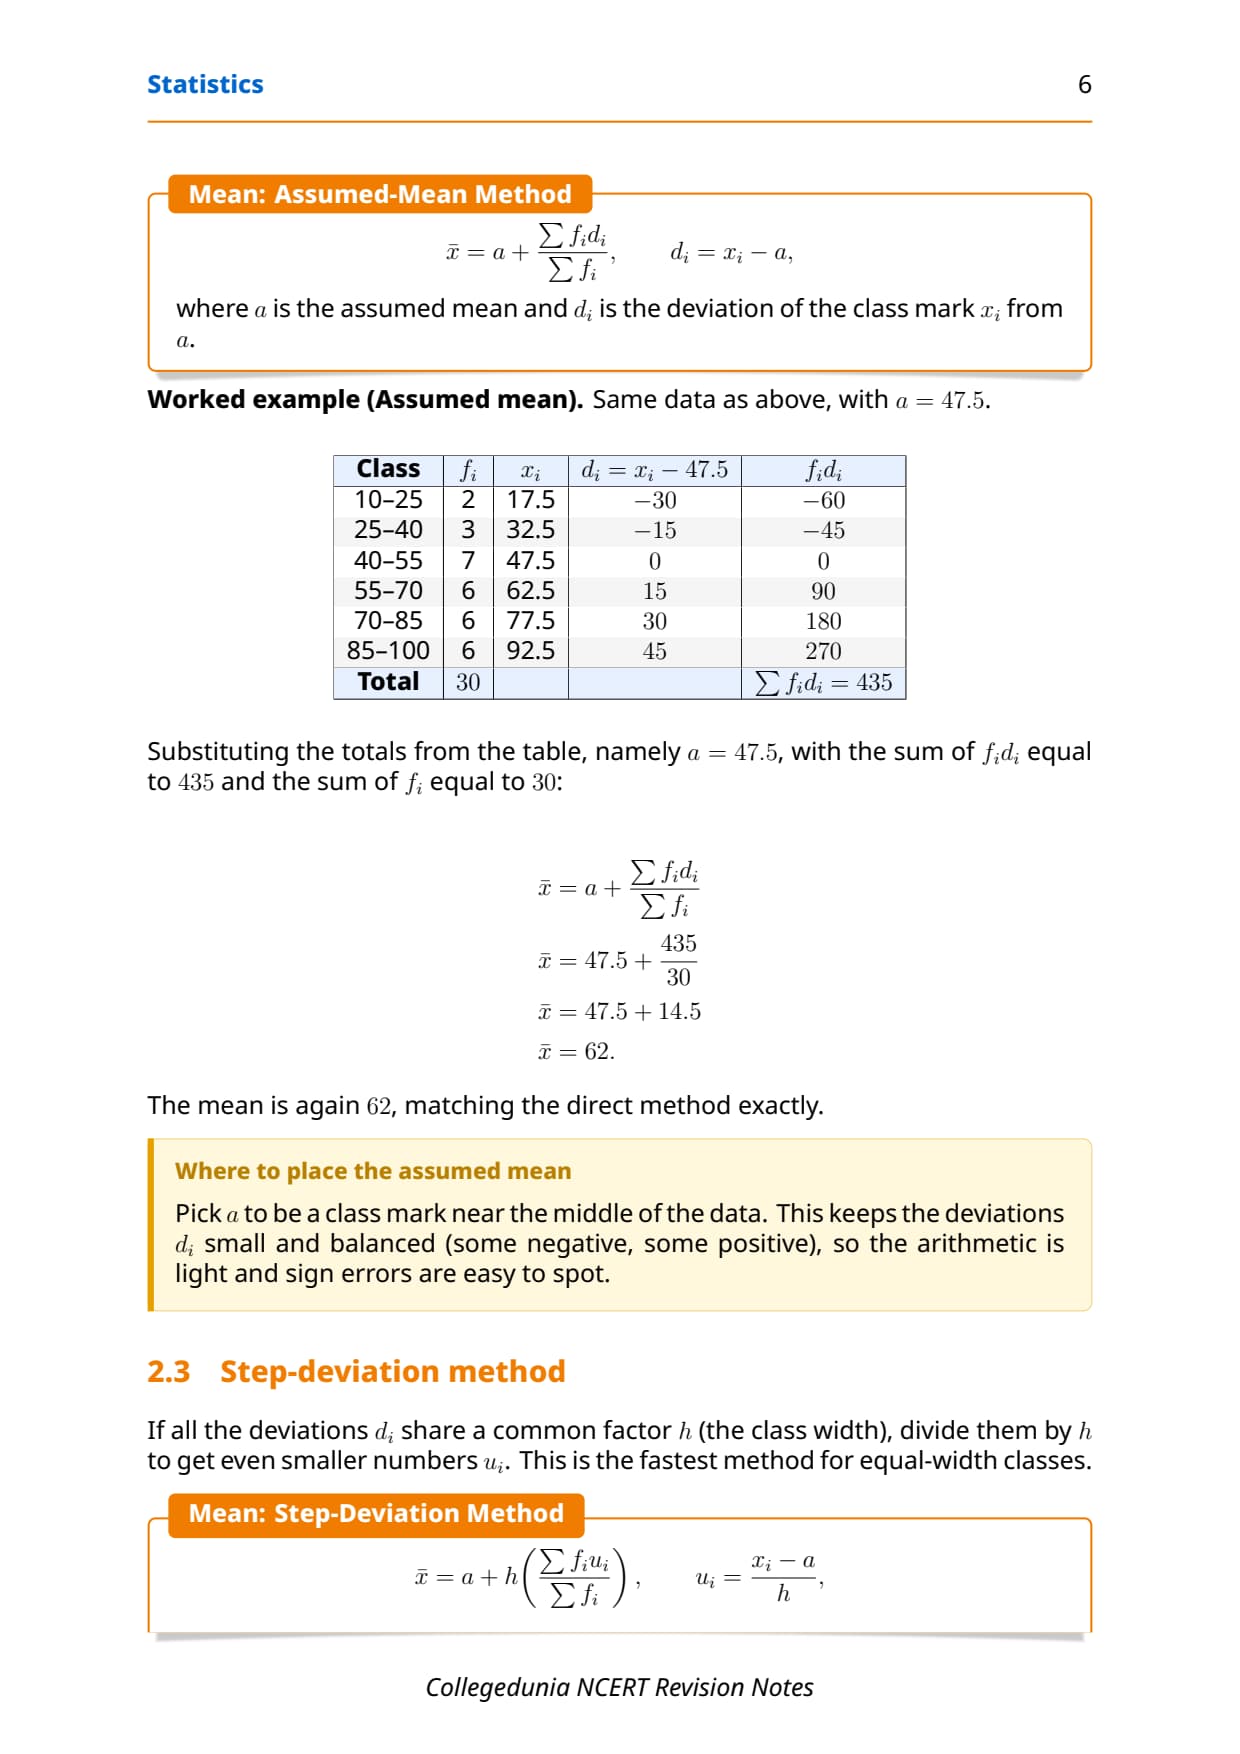
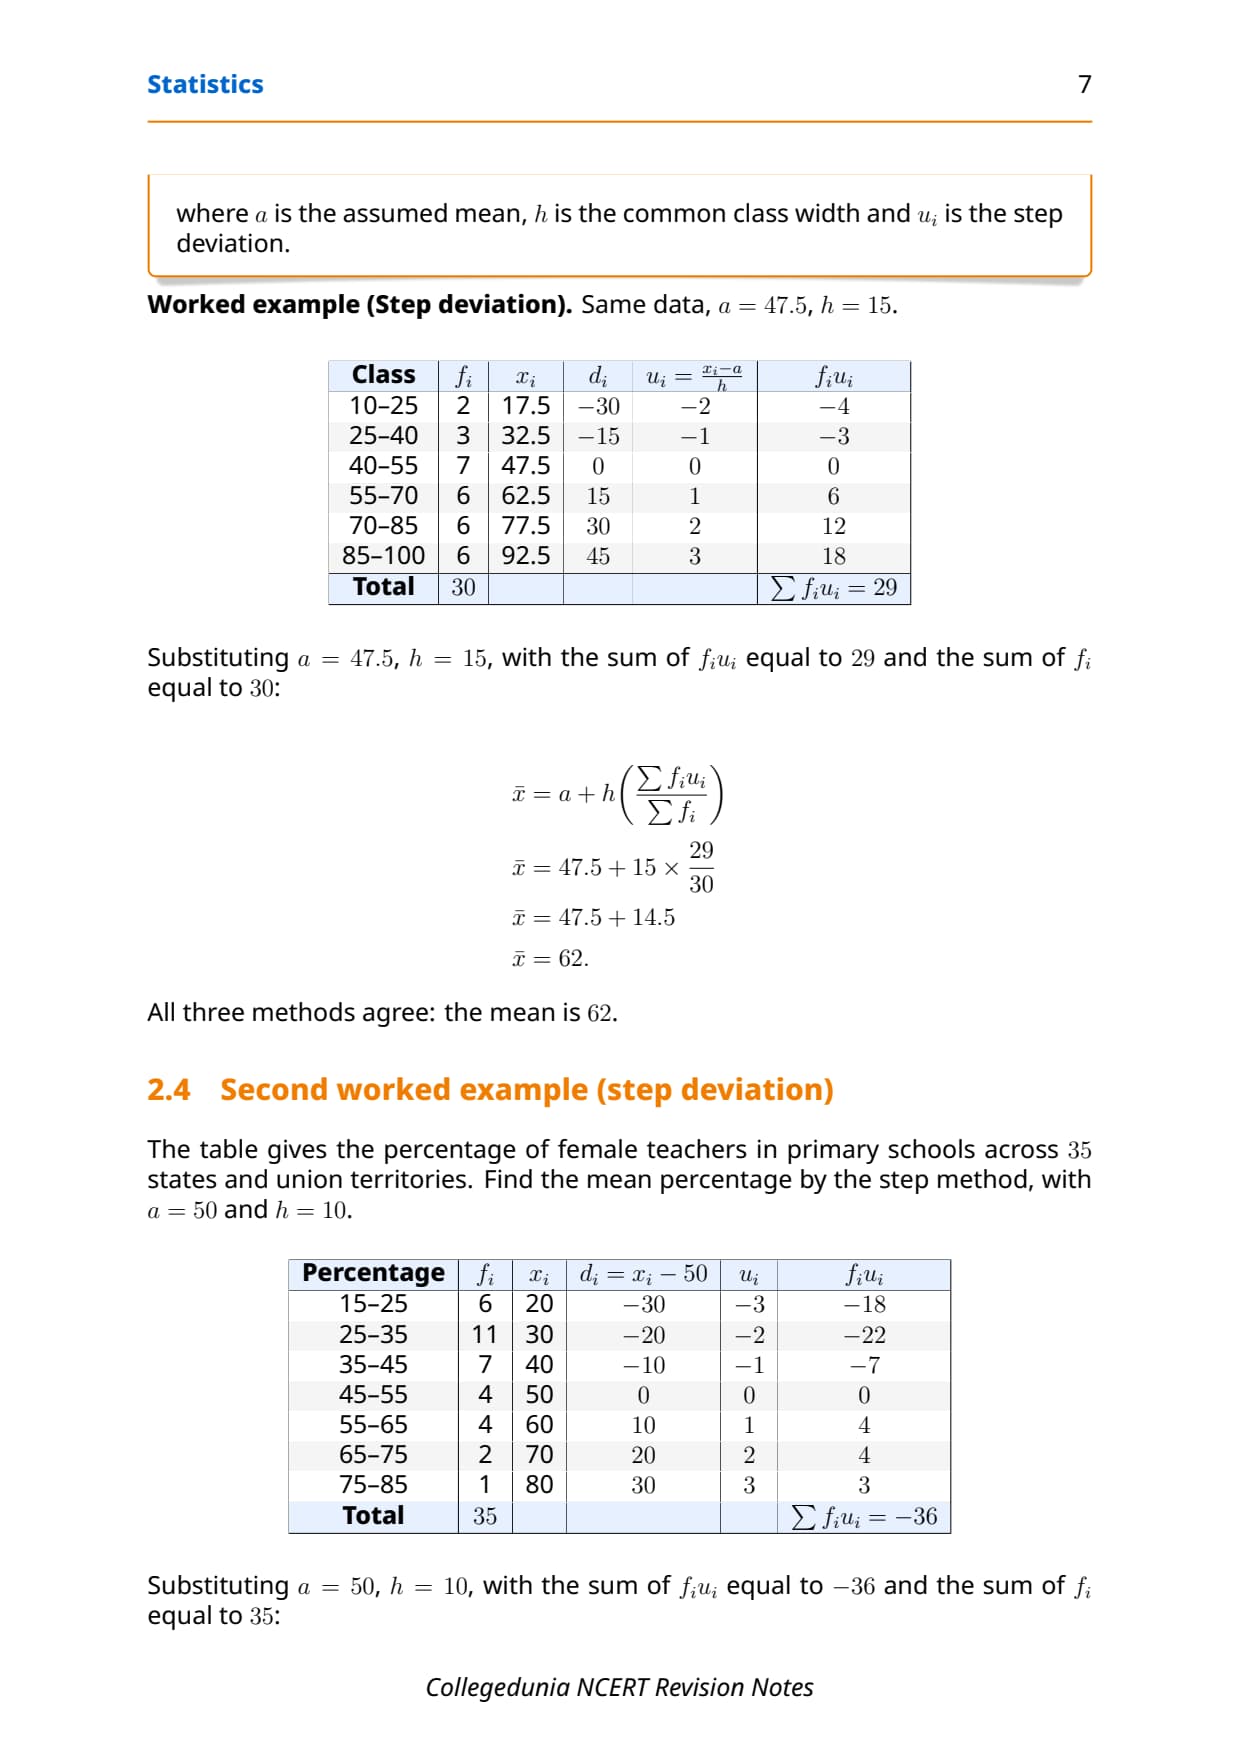
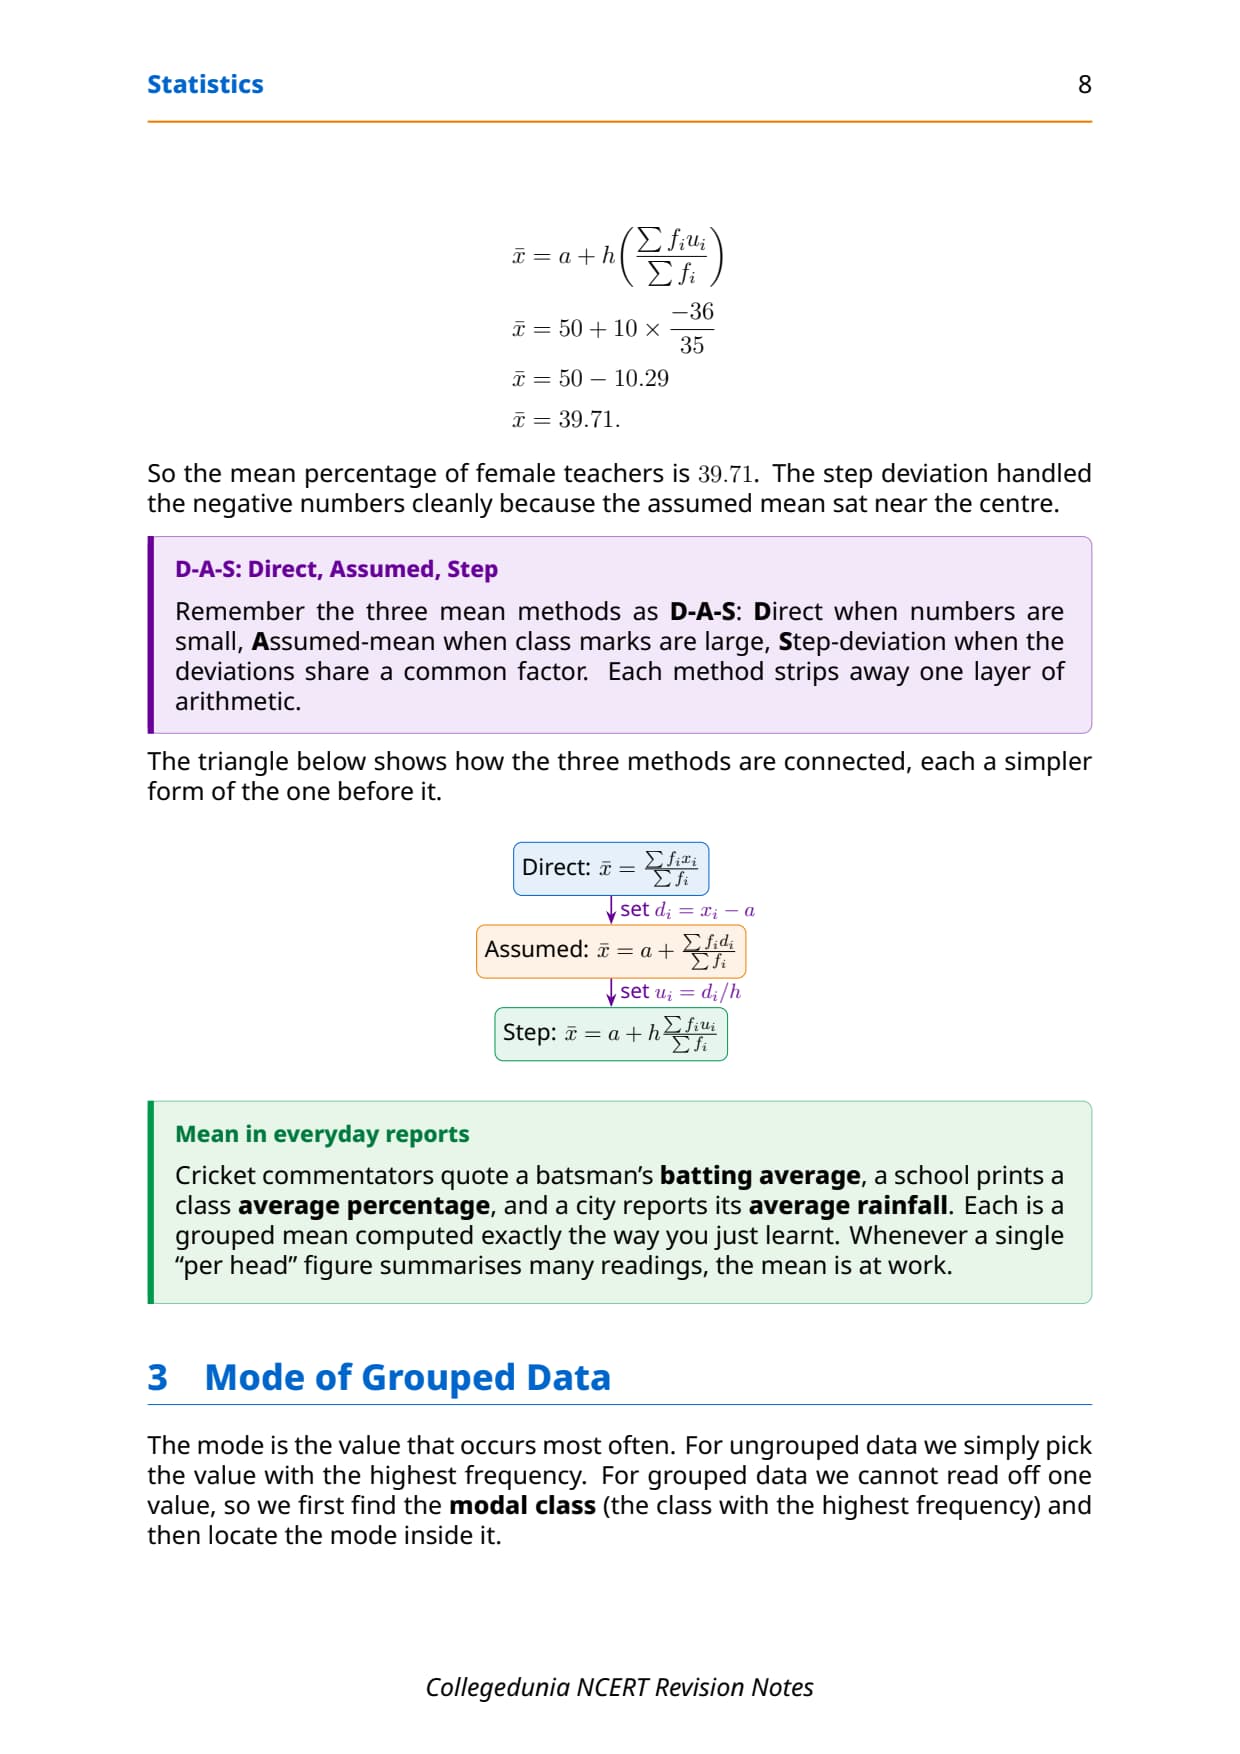
- All three methods for mean (Direct, Assumed Mean, Step-Deviation) with the formula, when to use each, and worked examples.
- Median and mode for grouped data, cumulative frequency tables, and ogive drawing, each broken into clear steps.
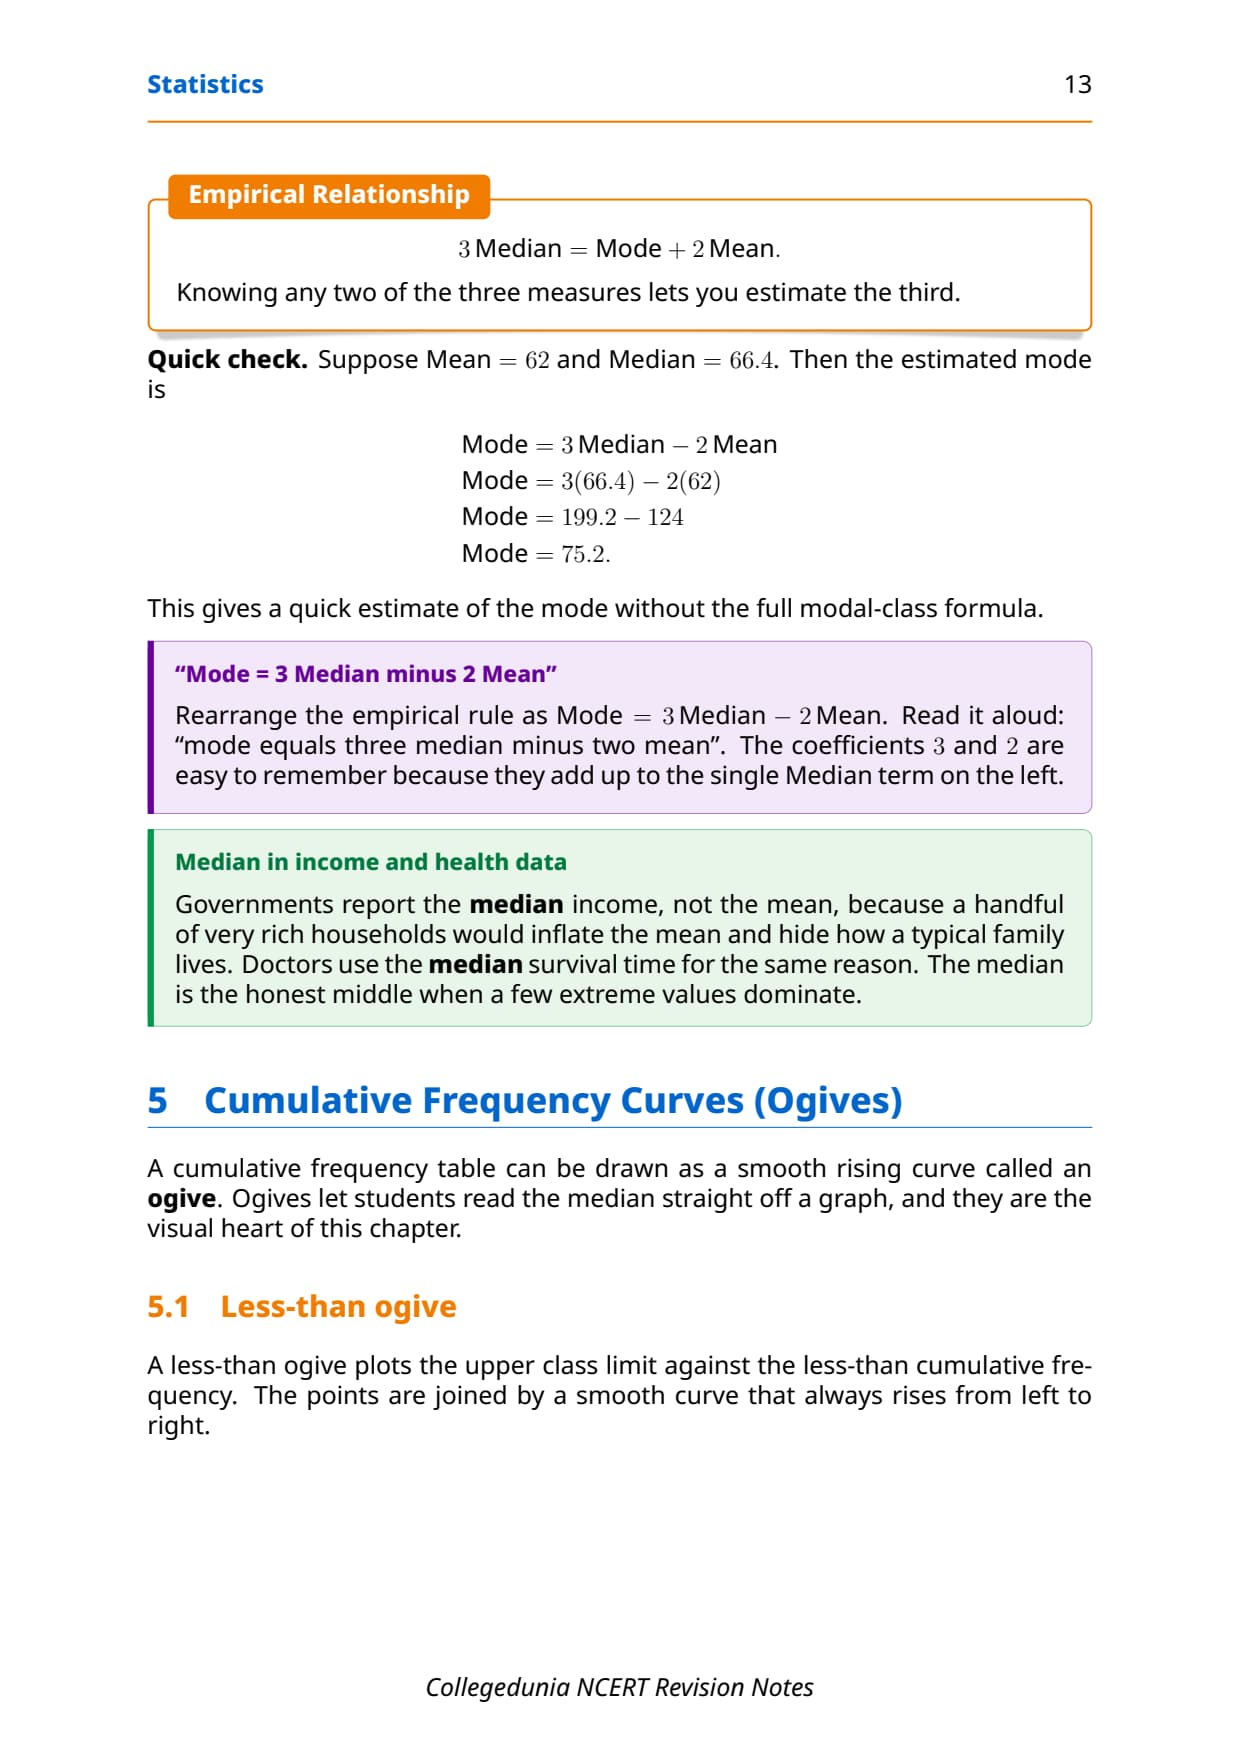
- Built for the 10 to 12 marks this chapter carries in every board exam, so you can score full marks.
These Collegedunia revision notes are curated by Maths subject experts, according to the 2026-27 NCERT textbook, and refined against the last five years of CBSE Class 10 Maths board papers.
Student Feedback: what 8,700 students told us
81% of students said one habit saved them from calculation errors: write the full frequency table first, with the class mark and the product f × xi in labelled columns, before any formula. Those who jumped straight to the formula often slipped in the product column or forgot to add the frequencies.
Top scorers called this one of the most marks-per-effort chapters in the paper. The formulas are few, but the table arithmetic takes time. Students who practised filling the table fast and accurately scored 4 to 5 marks more than those who knew the theory but were slow.
Source: 2026-27 Class 10 Maths student poll, 8,700 students from CBSE schools in 13 states, before the 2026 boards.
|
Table of Contents |
Watch Statistics Class 10 Maths Explained
Source: Magnet Brains on YouTube
What These Statistics Notes Cover
This chapter moves from ungrouped data to grouped data, where numbers sit in class intervals. You learn three measures of central tendency and two cumulative-frequency graphs.
- Mean: three methods, Direct, Assumed Mean (deviations di), and Step-Deviation (ui = di/h). All three give the same answer.
- Median: build a cumulative frequency table, find the median class (holds the n/2-th value), then use the formula. The answer is an estimate.
- Mode: find the modal class (highest frequency), then use the three frequencies around it.
- Ogive: less-than (rising) and more-than (falling); they cross at the median.
- Exercises: 13.1 (mean), 13.2 (mode, median), 13.3 (cumulative frequency, ogive), all in the board syllabus.
Mean of Grouped Data: Three Methods
Only class marks (midpoints) are given, not raw values. NCERT gives three methods, and the paper may ask for any one.
Direct Method
Mean = Σfixi / Σfi, where xi is the class mark (lower limit + upper limit)/2 and fi its frequency. Use it when class marks and frequencies are small.
Assumed Mean Method
Mean = a + (Σfidi / Σfi), where a is the assumed mean and di = xi - a. Pick a middle class mark as a so deviations stay small and partly cancel.
Step-Deviation Method
Mean = a + h (Σfiui / Σfi), where h is the class width and ui = (xi - a)/h. Fastest when class widths are equal (true in every exercise here). Most students prefer this in the board exam.
| Method | Formula | When to use |
|---|---|---|
| Direct Method | Mean = Σfixi / Σfi | Small class marks and frequencies; quick to compute |
| Assumed Mean Method | Mean = a + (Σfidi / Σfi) | Large class marks; deviations from a middle value reduce arithmetic |
| Step-Deviation Method | Mean = a + h (Σfiui / Σfi) | Equal class widths; most efficient for board exam time pressure |
Median of Grouped Data: Formula & Cumulative Frequency
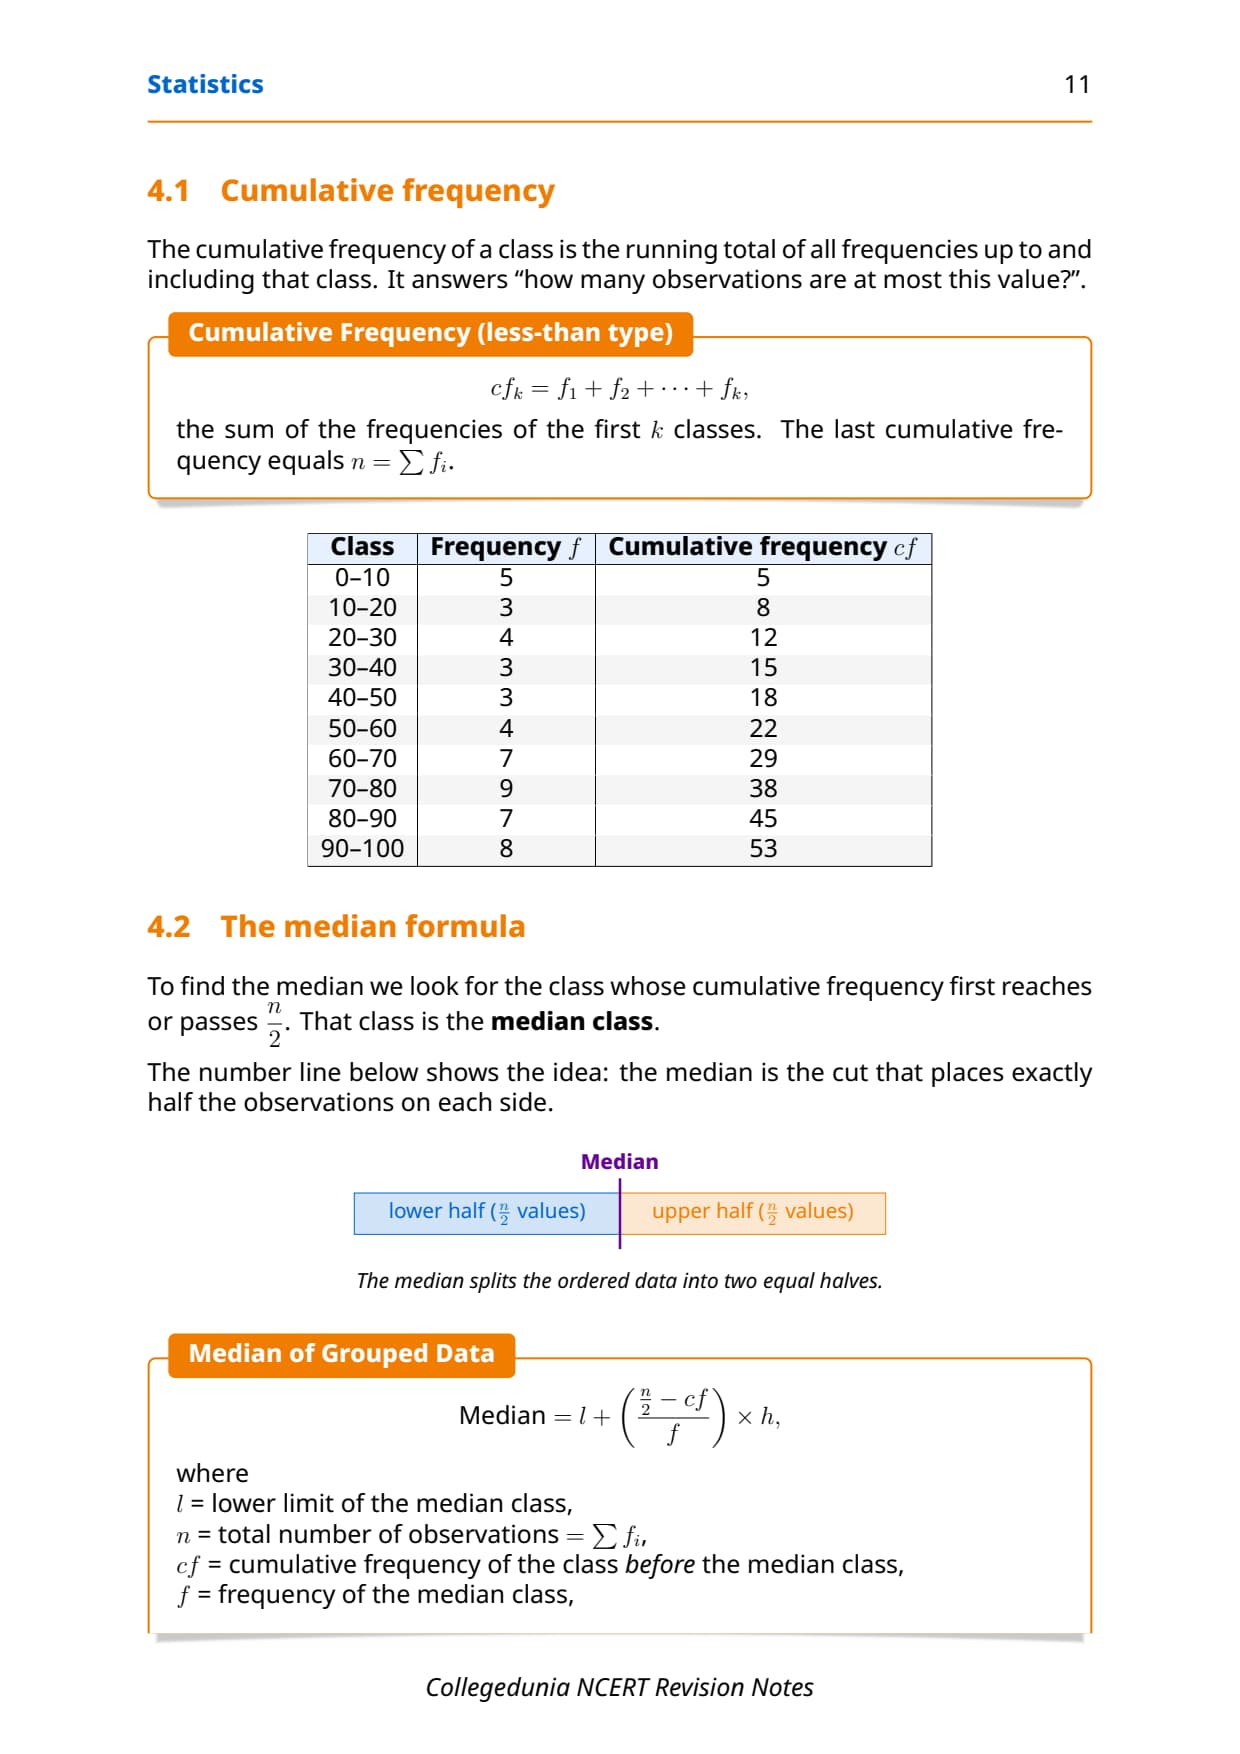
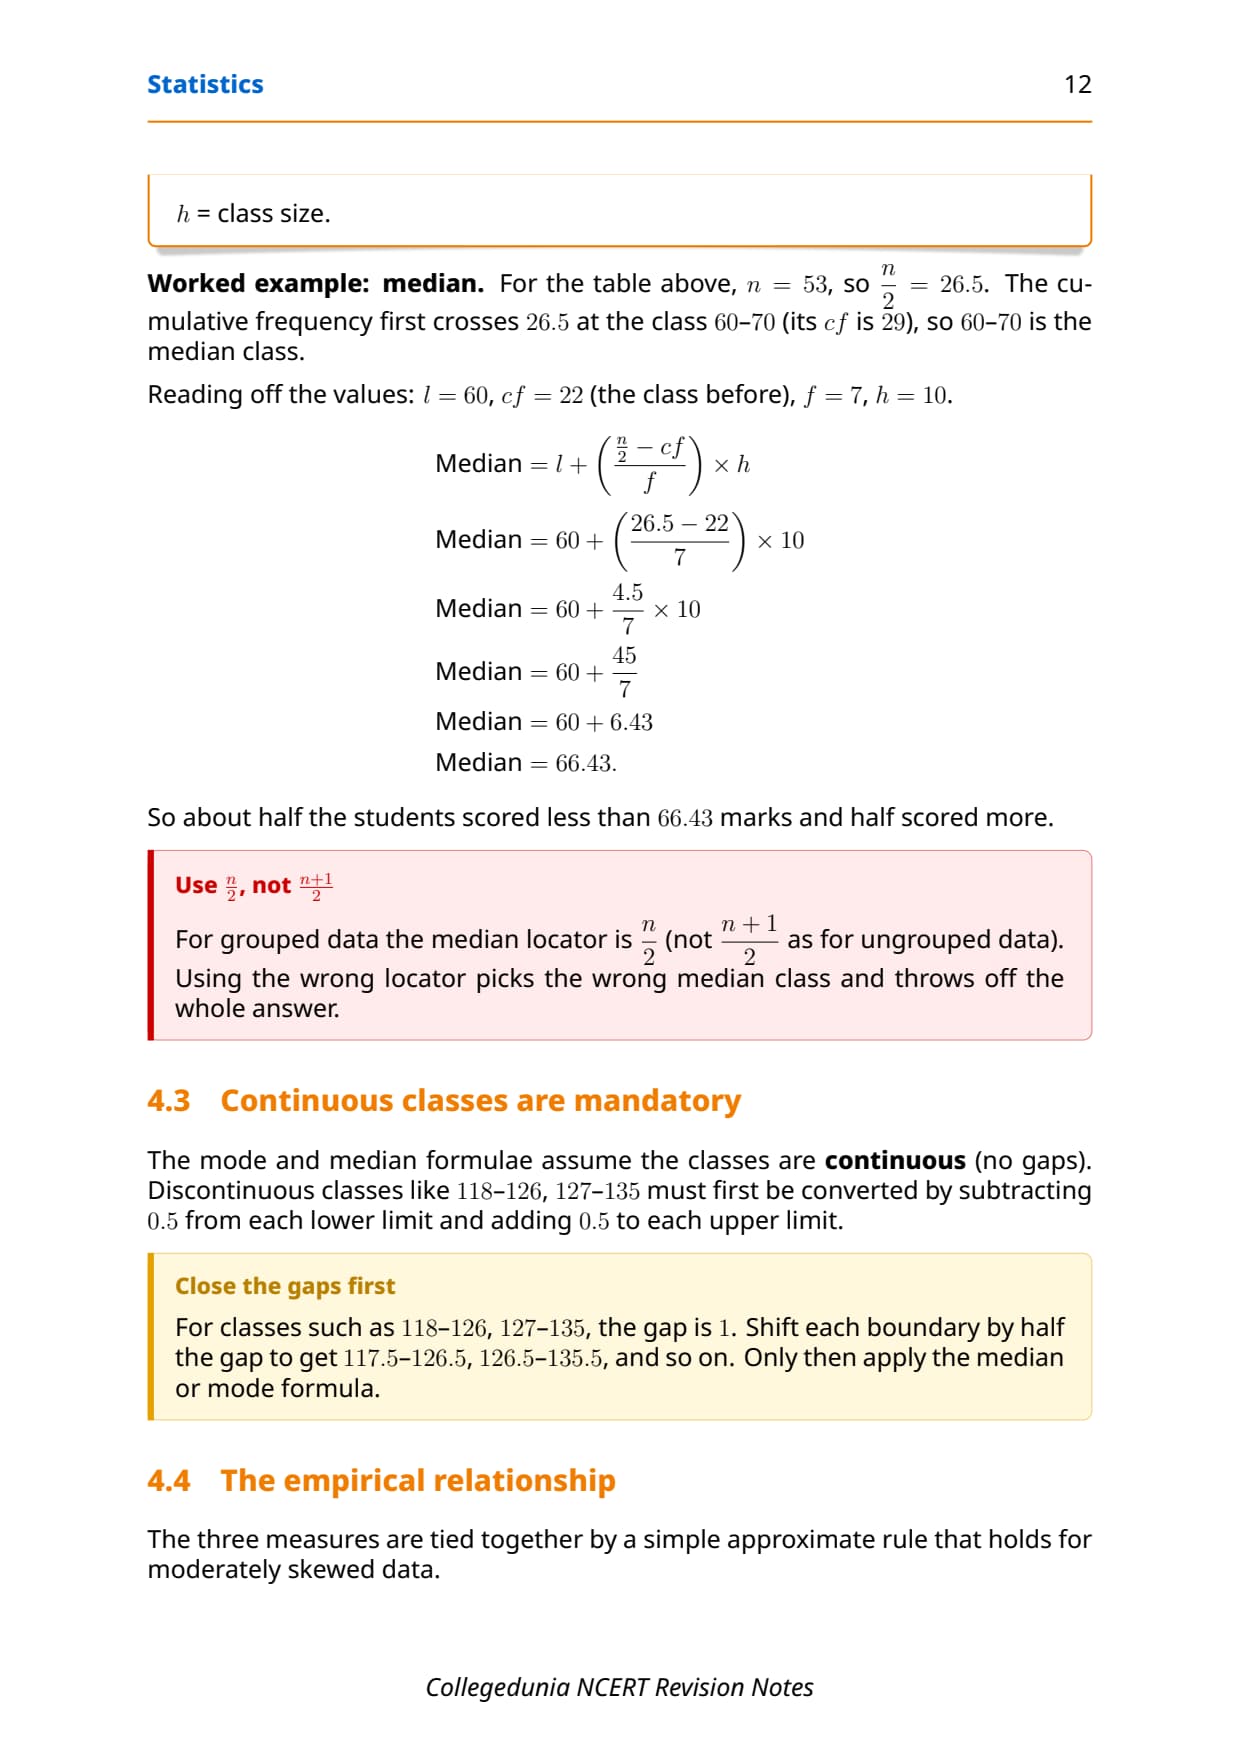
The median is the n/2-th value. Build a cumulative frequency (cf) column; the median class is the first class whose cf passes n/2. Then use the formula.
Median = l + [ (n/2 - cf) / f ] × h
| Variable | What it means |
|---|---|
| l | Lower class limit of the median class |
| n | Total number of observations (Σfi) |
| cf | Cumulative frequency of the class just before the median class |
| f | Frequency of the median class |
| h | Class width (class size) of the median class |
Mode of Grouped Data: Modal Class & Formula
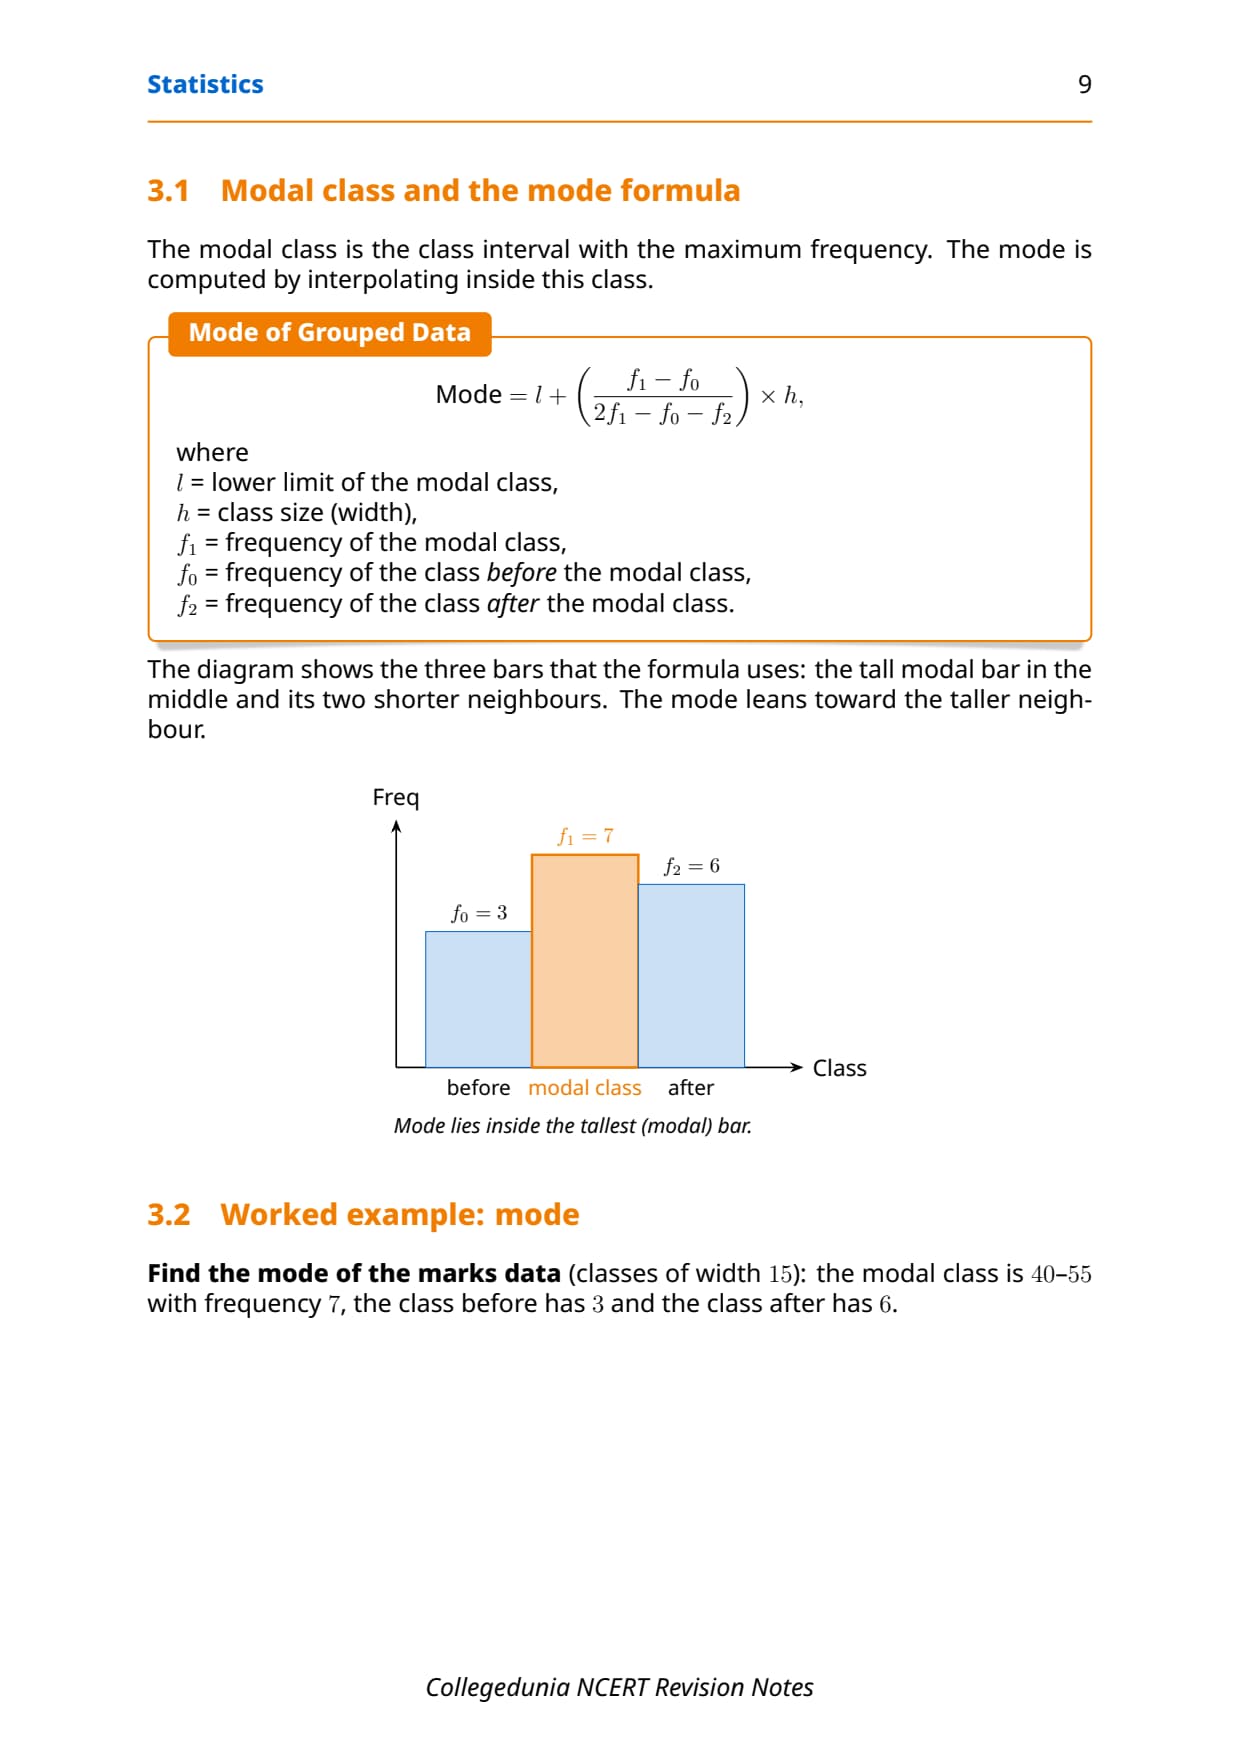
First spot the modal class (highest frequency), then use the formula with that class and its two neighbours.
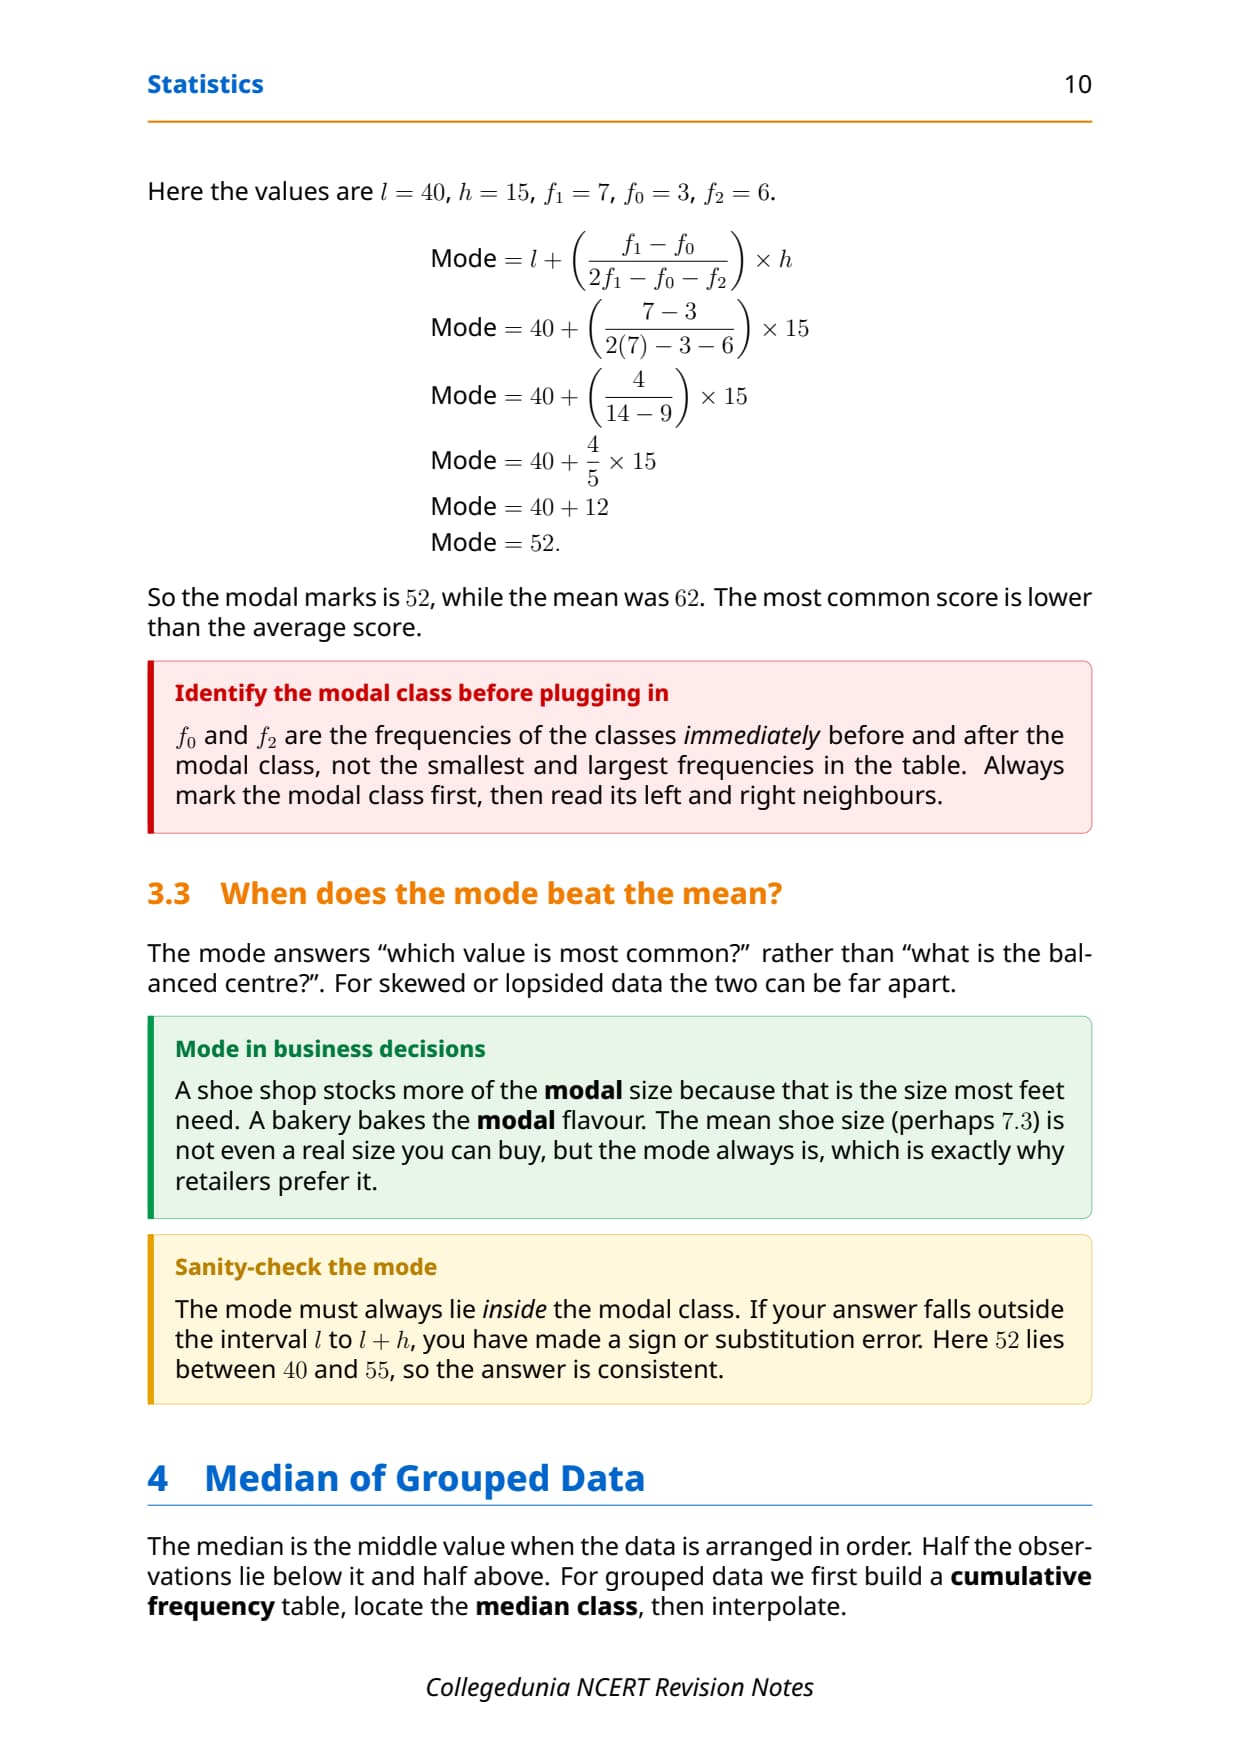
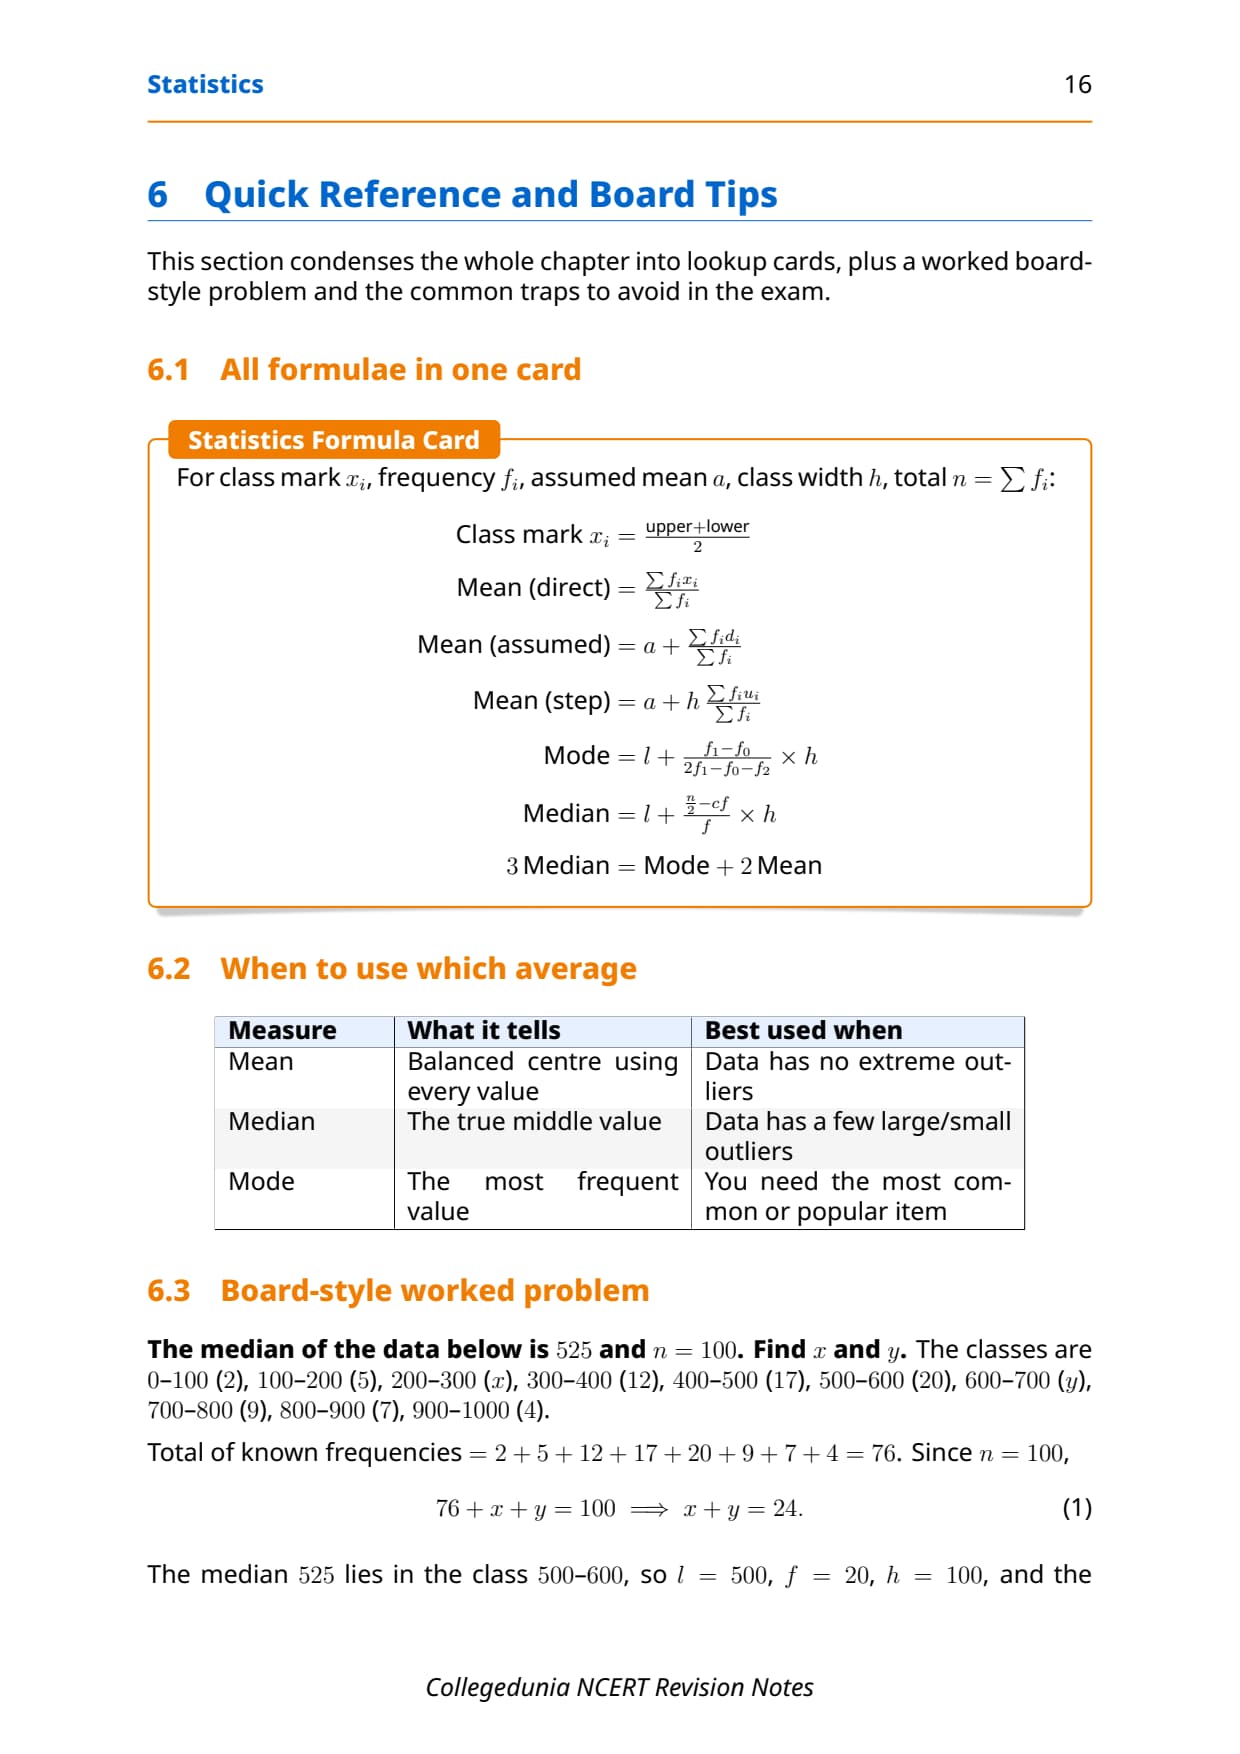
Mode = l + [ (f1 - f0) / (2f1 - f0 - f2) ] × h
| Variable | What it means |
|---|---|
| l | Lower class limit of the modal class |
| f1 | Frequency of the modal class (the highest frequency) |
| f0 | Frequency of the class just before the modal class |
| f2 | Frequency of the class just after the modal class |
| h | Class width of the modal class |
Mode uses only three frequencies: the modal class and its two neighbours. No cumulative frequency table is needed. The denominator is 2f1 - f0 - f2, so do not drop the 2 or flip the sign on f2.
Cumulative Frequency & Ogive: Less-Than and More-Than
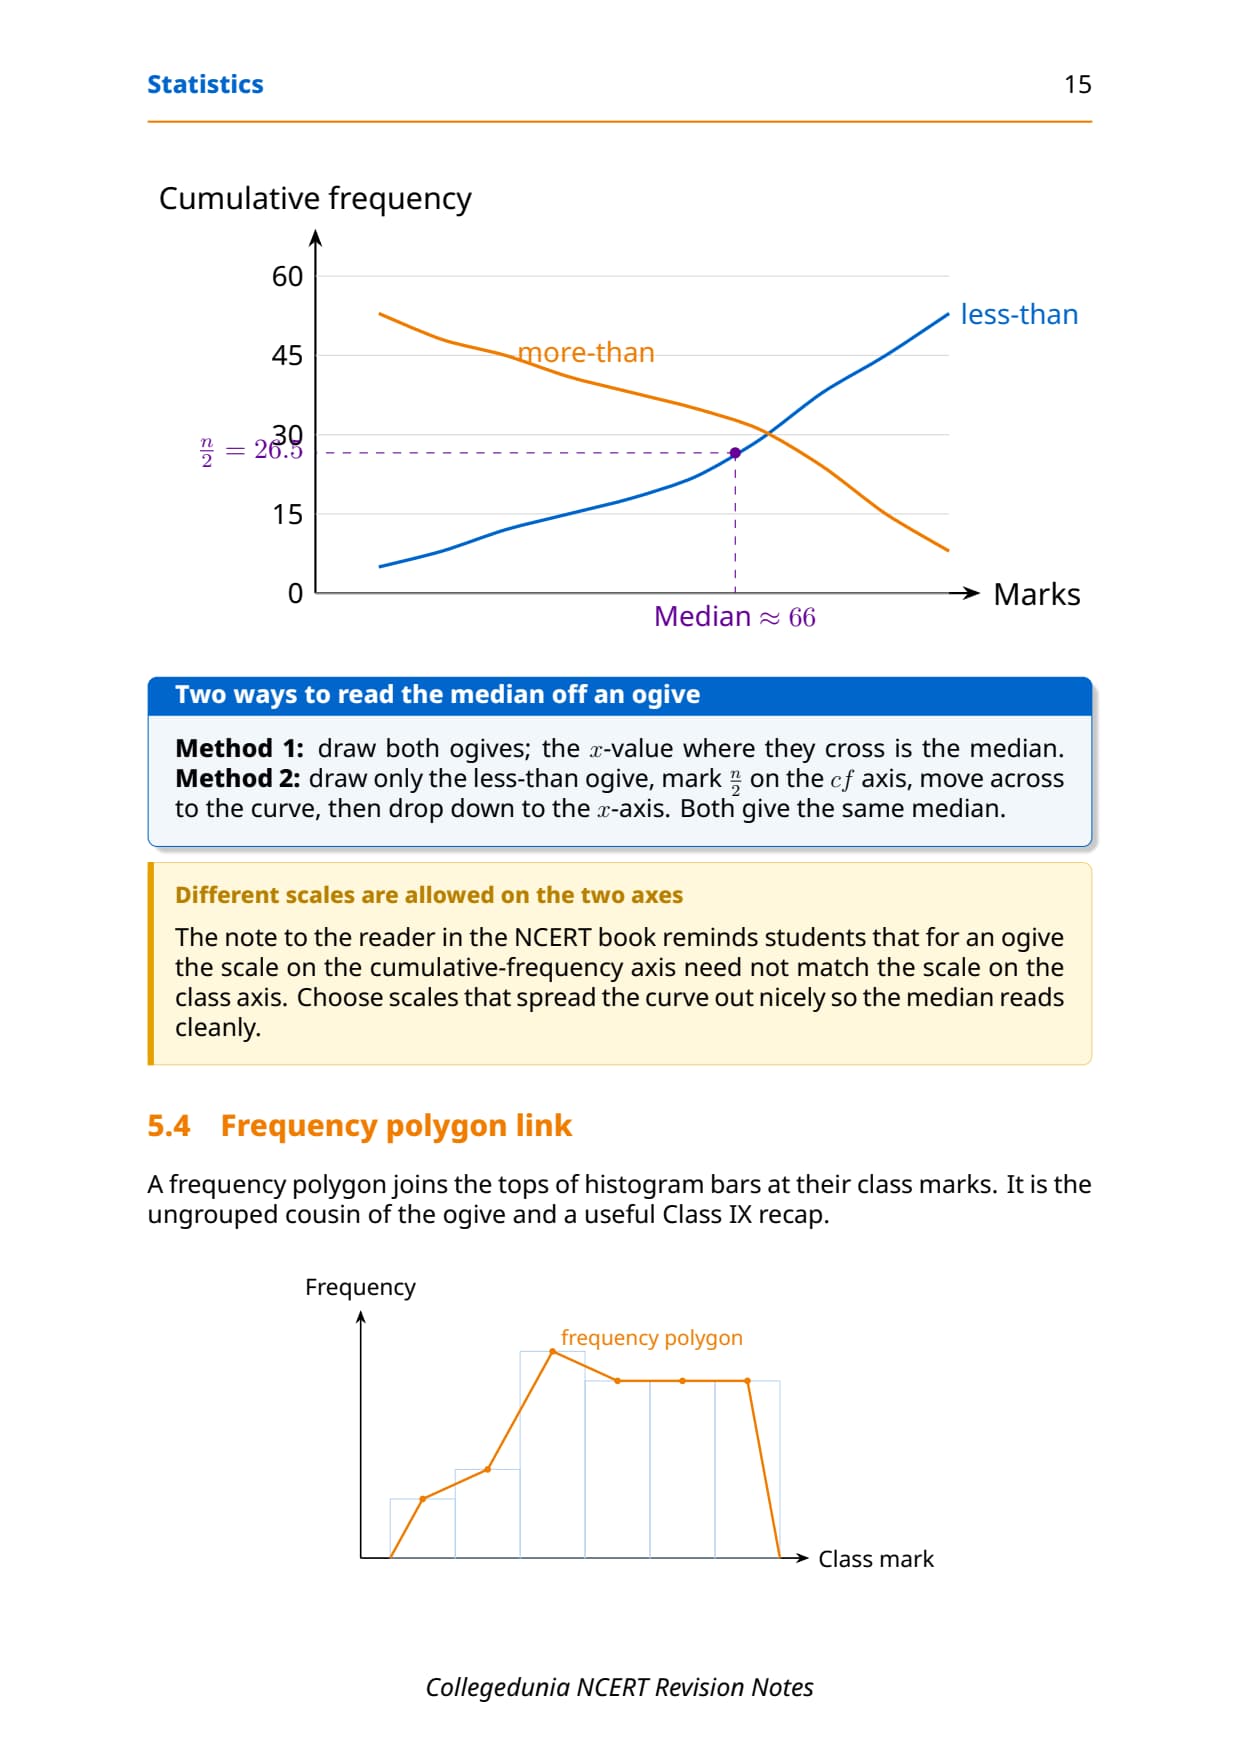
The ogive (say "oh-jive") plots cumulative frequency against class boundaries. The less-than and more-than ogives cross at the median, giving it graphically with no formula.
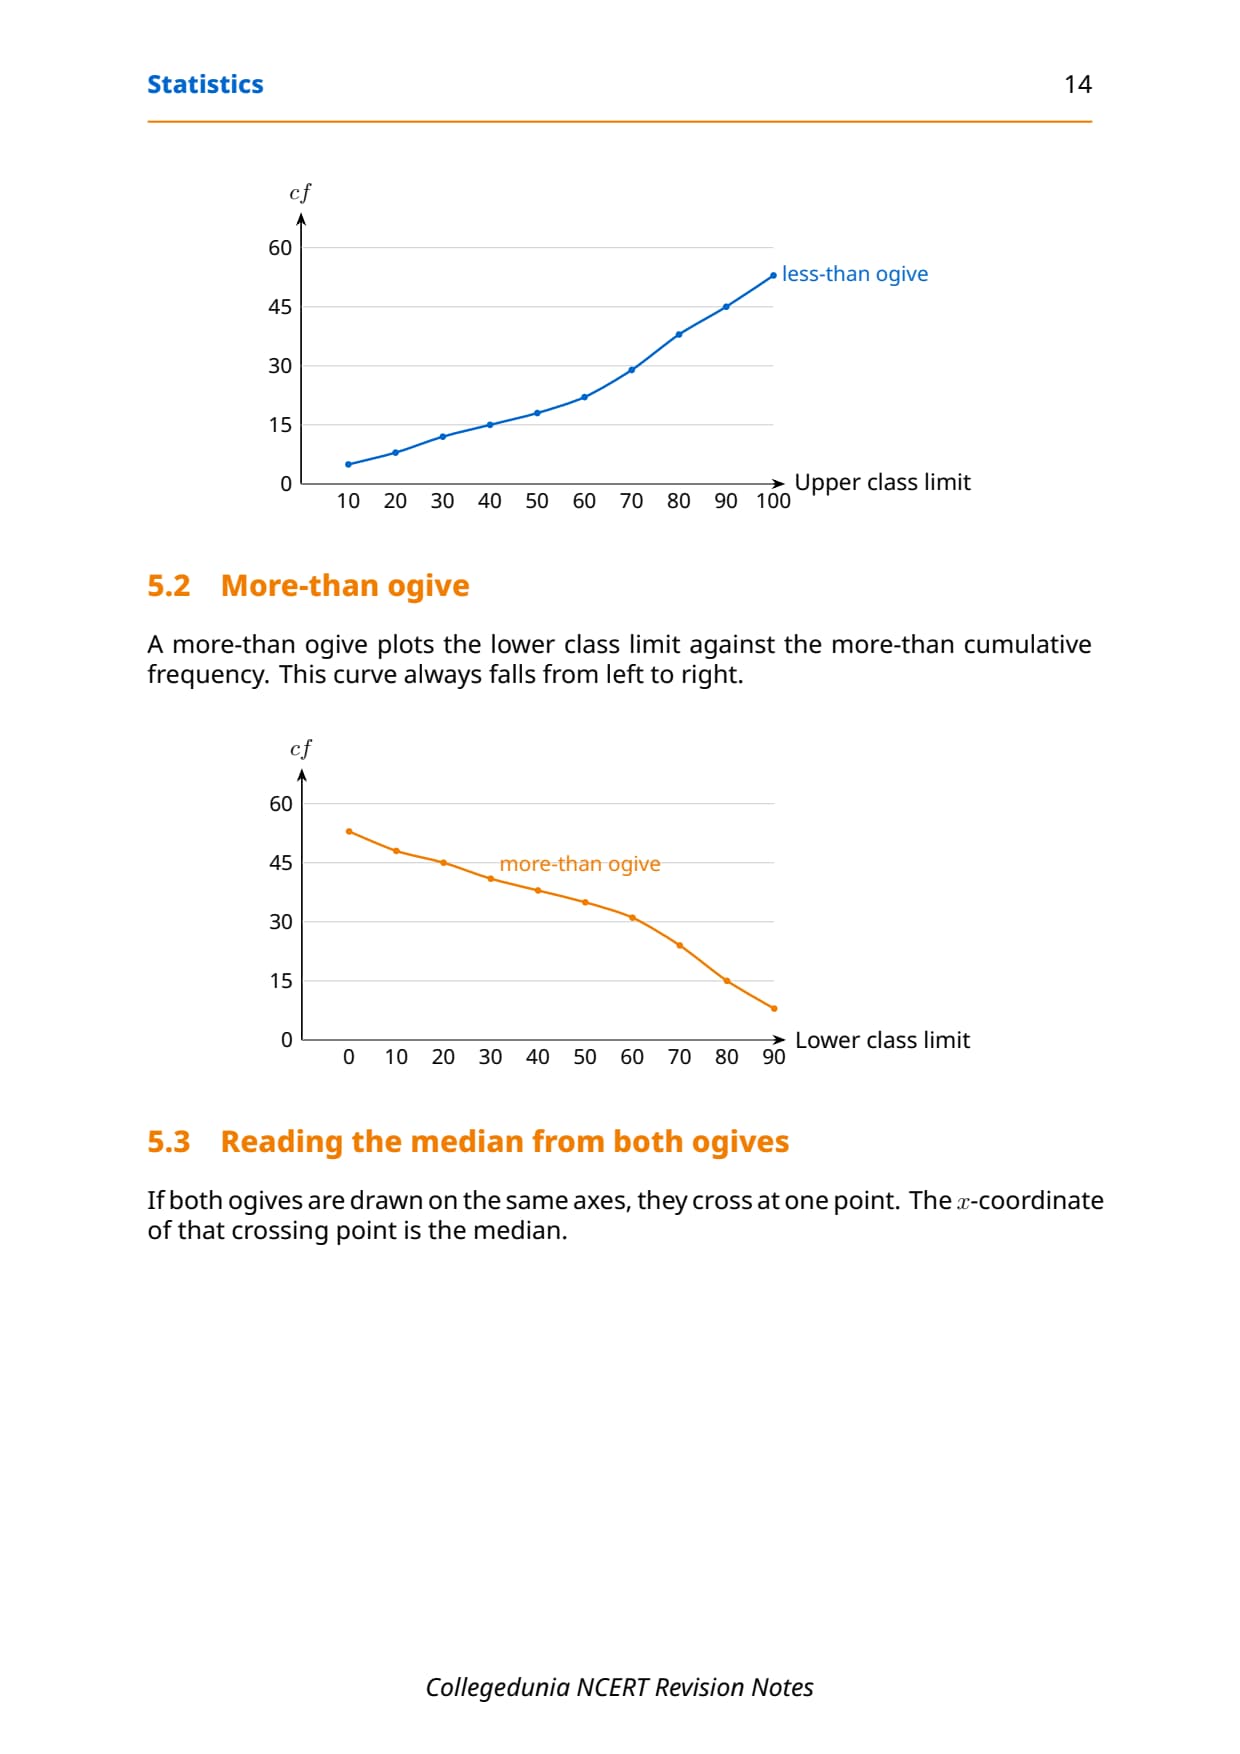
- Less-than ogive: plot cumulative frequencies against the upper limits, running up to n; smooth rising curve.
- More-than ogive: plot from above against the lower limits, starting at n; smooth falling curve.
- Reading the median: draw both on one graph; drop a perpendicular from their crossing point to the x-axis. Or mark n/2 on the y-axis of the less-than ogive, read across, then drop down.
Worked Board Problems
These cover the question types the board paper uses most. Each writes the formula before substituting.
Problem 1: Find the mean by the Step-Deviation Method
Given: Ages of 30 patients. Find the mean age.
| Age (years) | Frequency (fi) | Class mark (xi) | ui = (xi - 35) / 10 | fiui |
|---|---|---|---|---|
| 10-20 | 3 | 15 | -2 | -6 |
| 20-30 | 5 | 25 | -1 | -5 |
| 30-40 | 9 | 35 (= a) | 0 | 0 |
| 40-50 | 8 | 45 | 1 | 8 |
| 50-60 | 5 | 55 | 2 | 10 |
| Total | 30 | 7 |
- Assumed mean a = 35 (class mark of the middle class 30-40). Class width h = 10.
- Mean = a + h (Σfiui / Σfi) = 35 + 10 × (7/30) = 35 + 70/30 = 35 + 2.33 = 37.33 years.
Problem 2: Find the median from a frequency distribution
Given: Marks of 50 students. Find the median.
| Marks | Frequency (fi) | Cumulative Frequency (cf) |
|---|---|---|
| 0-10 | 5 | 5 |
| 10-20 | 8 | 13 |
| 20-30 | 15 | 28 |
| 30-40 | 12 | 40 |
| 40-50 | 10 | 50 |
| Total | 50 |
- n = 50, so n/2 = 25.
- The cumulative frequency first exceeds 25 at the class 20-30 (cf = 28). So the median class = 20-30.
- l = 20, cf = 13 (cumulative frequency of the class before 20-30), f = 15, h = 10.
- Median = l + [(n/2 - cf) / f] × h = 20 + [(25 - 13) / 15] × 10 = 20 + [12/15] × 10 = 20 + 8 = 28 marks.
Common Mistakes to Avoid
The formula list is short, but most marks are lost to table errors and formula mix-ups.
- Wrong cf in the median formula: use the cf of the class BEFORE the median class, not the median class itself.
- Wrong mode denominator: it is 2f1 - f0 - f2, not f1 - f0 - f2.
- Forgetting h in Step-Deviation: the formula is a + h (Σfiui / Σfi).
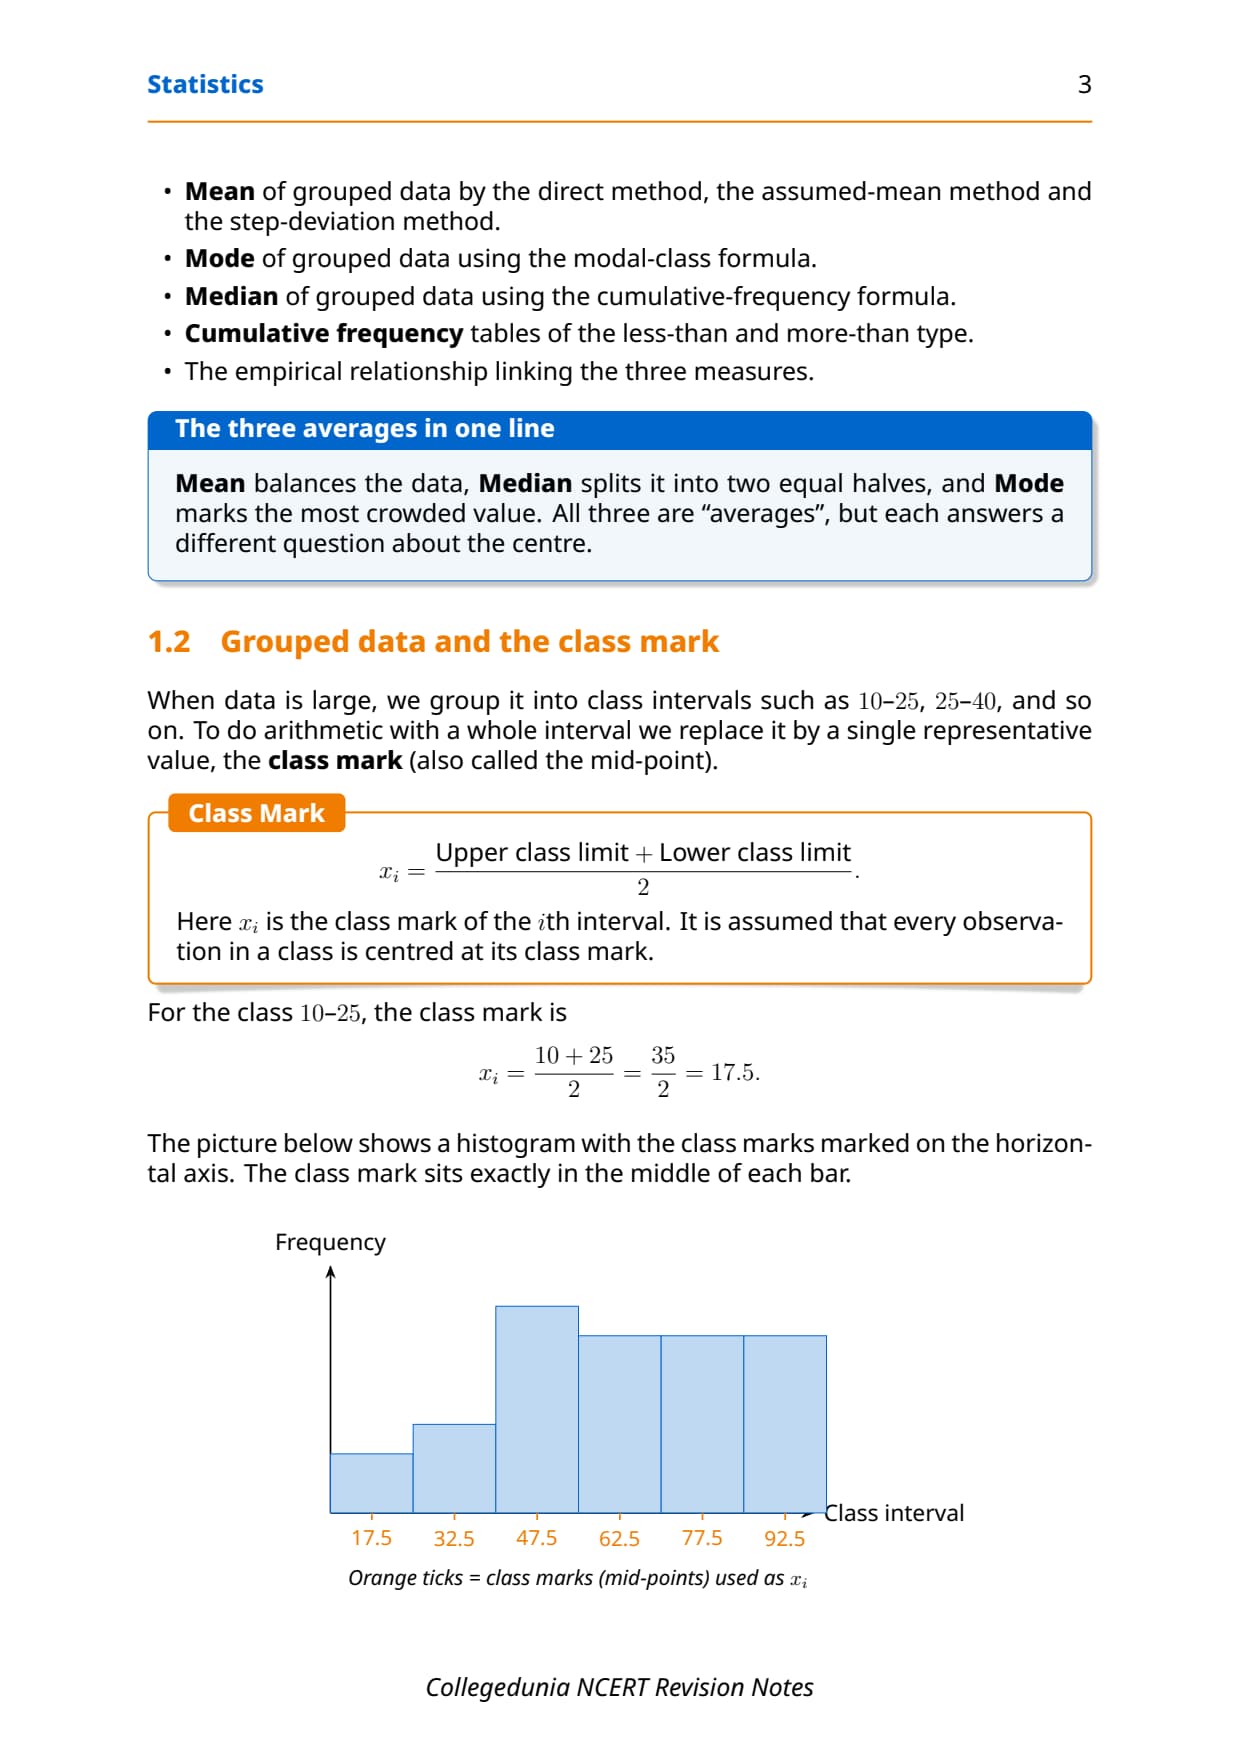
- Wrong class mark: it is (lower limit + upper limit)/2, so 20-30 gives 25, not 20.
- cf errors: each cf = previous cf + current frequency; the last cf must equal n.
- No formula before substituting: CBSE gives 1 mark for the formula on its own.
Previous Year Question Trends
Statistics is one of the most consistent scoring chapters, usually 8 to 10 marks across 3-mark and 5-mark problems. The types are easy to predict.
| Year | Question type asked | Marks |
|---|---|---|
| 2025 | Mean by Step-Deviation; median from frequency table | 3 + 4 |
| 2024 | Mode and median for same distribution | 5 |
| 2023 | Draw less-than ogive and find median graphically | 4 |
| 2022 | Mean by Assumed Mean; median from cumulative frequency | 3 + 3 |
Also Check: The complete set of step-by-step NCERT exercise solutions for Chapter 13 is at the Chapter 13 Statistics NCERT Solutions page.
Quick Revision Summary
Use this the night before the exam as a one-stop formula lookup.
All formulas in one place
- Mean (Direct Method): Mean = Σfixi / Σfi
- Mean (Assumed Mean Method): Mean = a + (Σfidi / Σfi), where di = xi - a
- Mean (Step-Deviation Method): Mean = a + h (Σfiui / Σfi), where ui = (xi - a) / h
- Median: Median = l + [(n/2 - cf) / f] × h
- Mode: Mode = l + [(f1 - f0) / (2f1 - f0 - f2)] × h
- Class mark: xi = (lower limit + upper limit) / 2
- Step deviation: ui = (xi - a) / h
Other Resources for Chapter 13
Pair these notes with the matching NCERT Solutions, formula sheet, handwritten notes, and the official NCERT book chapter. All Class 10 Maths Chapter 13 resources are linked below.
| Resource | What it covers | Open |
|---|---|---|
| Notes | Concept-first notes on mean (three methods), median, mode, cumulative frequency, ogive, worked problems, and a revision summary. | You are here |
| NCERT Solutions | Step-by-step answers to all Exercise 13.1, 13.2, and 13.3 questions, with full tables and ogive guidance. | Class 10 Maths Chapter 13 NCERT Solutions |
| Formula Sheet | One-page reference with all Statistics formulas: the three mean methods, median, and mode, with variables defined. | Class 10 Maths Chapter 13 Formula Sheet |
| Handwritten Notes | Scanned-style pages on all three mean methods, median and mode, cumulative frequency tables, and ogive drawing. | Class 10 Maths Chapter 13 Handwritten Notes |
| NCERT Book PDF | Official NCERT Statistics chapter in PDF, with all figures, exercises, and worked examples from the 2026-27 edition. | Class 10 Maths Chapter 13 NCERT Book PDF |
| Exemplar Solutions | Worked answers to the harder NCERT Exemplar problems for deeper board practice on ogives and mean-median-mode. | Class 10 Maths Chapter 13 Exemplar Solutions |
Notes for Class 10 Maths: All Chapters
Related Links: Open the notes for any other chapter below. Each one has the same concept-first style, a full PDF download, and a revision FAQ.
| Chapter | Notes link |
|---|---|
| Chapter 1 | Real Numbers Notes |
| Chapter 2 | Polynomials Notes |
| Chapter 3 | Pair of Linear Equations in Two Variables Notes |
| Chapter 4 | Quadratic Equations Notes |
| Chapter 5 | Arithmetic Progressions Notes |
| Chapter 6 | Triangles Notes |
| Chapter 7 | Coordinate Geometry Notes |
| Chapter 8 | Introduction to Trigonometry Notes |
| Chapter 9 | Some Applications of Trigonometry Notes |
| Chapter 10 | Circles Notes |
| Chapter 11 | Areas Related to Circles Notes |
| Chapter 12 | Surface Areas and Volumes Notes |
| Chapter 13 | Statistics Notes (You are here) |
| Chapter 14 | Probability Notes |
Notes Class 10 Maths Chapter 13 Statistics FAQs
Ques. What does Chapter 13 Statistics cover in Class 10 Maths?
Ans. Chapter 13 covers three measures of central tendency for grouped data: mean, median, and mode. For mean you learn three methods: Direct (Σfixi / Σfi), Assumed Mean (a + Σfidi/Σfi), and Step-Deviation (a + h × Σfiui/Σfi). For median you build a cumulative frequency table and use the interpolation formula. For mode you find the modal class and use three consecutive frequencies. The chapter also covers ogives, less-than and more-than, and reading the median where they cross. The three exercises are 13.1 (mean), 13.2 (mode and median), and 13.3 (ogive and cumulative frequency).
Ques. What is the median formula for grouped data in Class 10?
Ans. The median formula is Median = l + [(n/2 - cf) / f] × h. Here l is the lower limit of the median class, n is the total number of values, cf is the cumulative frequency of the class just before it, f is the frequency of the median class, and h is the class width. Find the median class from a cumulative frequency table: it is the first class whose cf passes n/2. The result is an estimate, since grouped data hides exact values.
Ques. What is the mode formula for grouped data and what is the modal class?
Ans. The mode formula is Mode = l + [(f1 - f0) / (2f1 - f0 - f2)] × h. Here l is the lower limit of the modal class, f1 is the highest frequency, f0 is the frequency just before it, f2 is the frequency just after it, and h is the class width. The modal class is the class with the highest frequency. Mode uses only three frequencies and needs no cumulative frequency table.
Ques. What is an ogive and how do you draw it for Class 10 Statistics?
Ans. An ogive plots cumulative frequency against class boundaries and finds the median graphically. There are two types. For a less-than ogive, plot cumulative frequencies against upper limits and join with a smooth rising curve. For a more-than ogive, plot from above against lower limits and join with a smooth falling curve. Draw both on one graph; they cross at one point. Drop a perpendicular from there to the x-axis, and that value is the median. You can also use the less-than ogive alone: mark n/2 on the y-axis, go across to the curve, then drop down to the x-axis.
Ques. Where can I download the Chapter 13 Statistics Notes PDF?
Ans. Use the Download button at the top of this page. Both the typed and handwritten versions are free. The PDF covers all three mean methods, the median and mode formulas with worked examples, cumulative frequency tables, ogive drawing, common mistakes, and a last-day revision summary with all formulas, on the 2026-27 CBSE syllabus.
Ques. Which is the best method to find mean of grouped data in board exams?
Ans. The Step-Deviation Method is usually the fastest and safest when all class widths are equal, which is almost always true here. The ui values are small integers (often -2, -1, 0, 1, 2), so multiplying is easy and errors drop. If the question names the Direct or Assumed Mean Method, use that. If it just says "find the mean," pick Step-Deviation. CBSE gives marks for the formula, the table, and the final answer, so write each step clearly.
Ques. Is Chapter 13 Statistics important for CBSE Class 10 board exams?
Ans. Yes. Statistics is one of the most consistently tested chapters in the board paper. It usually carries 8 to 10 marks across two or three questions, mostly 3-mark and 5-mark problems. The types are easy to predict: find the mean (often by Step-Deviation or Assumed Mean), find the median or mode, and draw or read an ogive. Since the types repeat each year, practising Statistics from the last five board papers is one of the quickest ways to raise your score.
Ques. How many pages is the Class 10 Maths Chapter 13 Statistics Notes PDF?
Ans. The PDF runs about 20 to 22 pages. It covers all three mean methods with worked examples, the median formula with cumulative frequency tables, the mode formula, ogive drawing, a common mistakes section, and a full revision summary with every formula, on the 2026-27 CBSE syllabus.



Comments