




This Class 10 Maths Chapter 13 Statistics formula sheet puts every formula on one page. The chapter takes the three measures of central tendency, mean, mode and median, into grouped data. You get three mean methods, the mode and median formulas, the empirical relation and ogives. Every formula follows the 2026-27 CBSE syllabus.
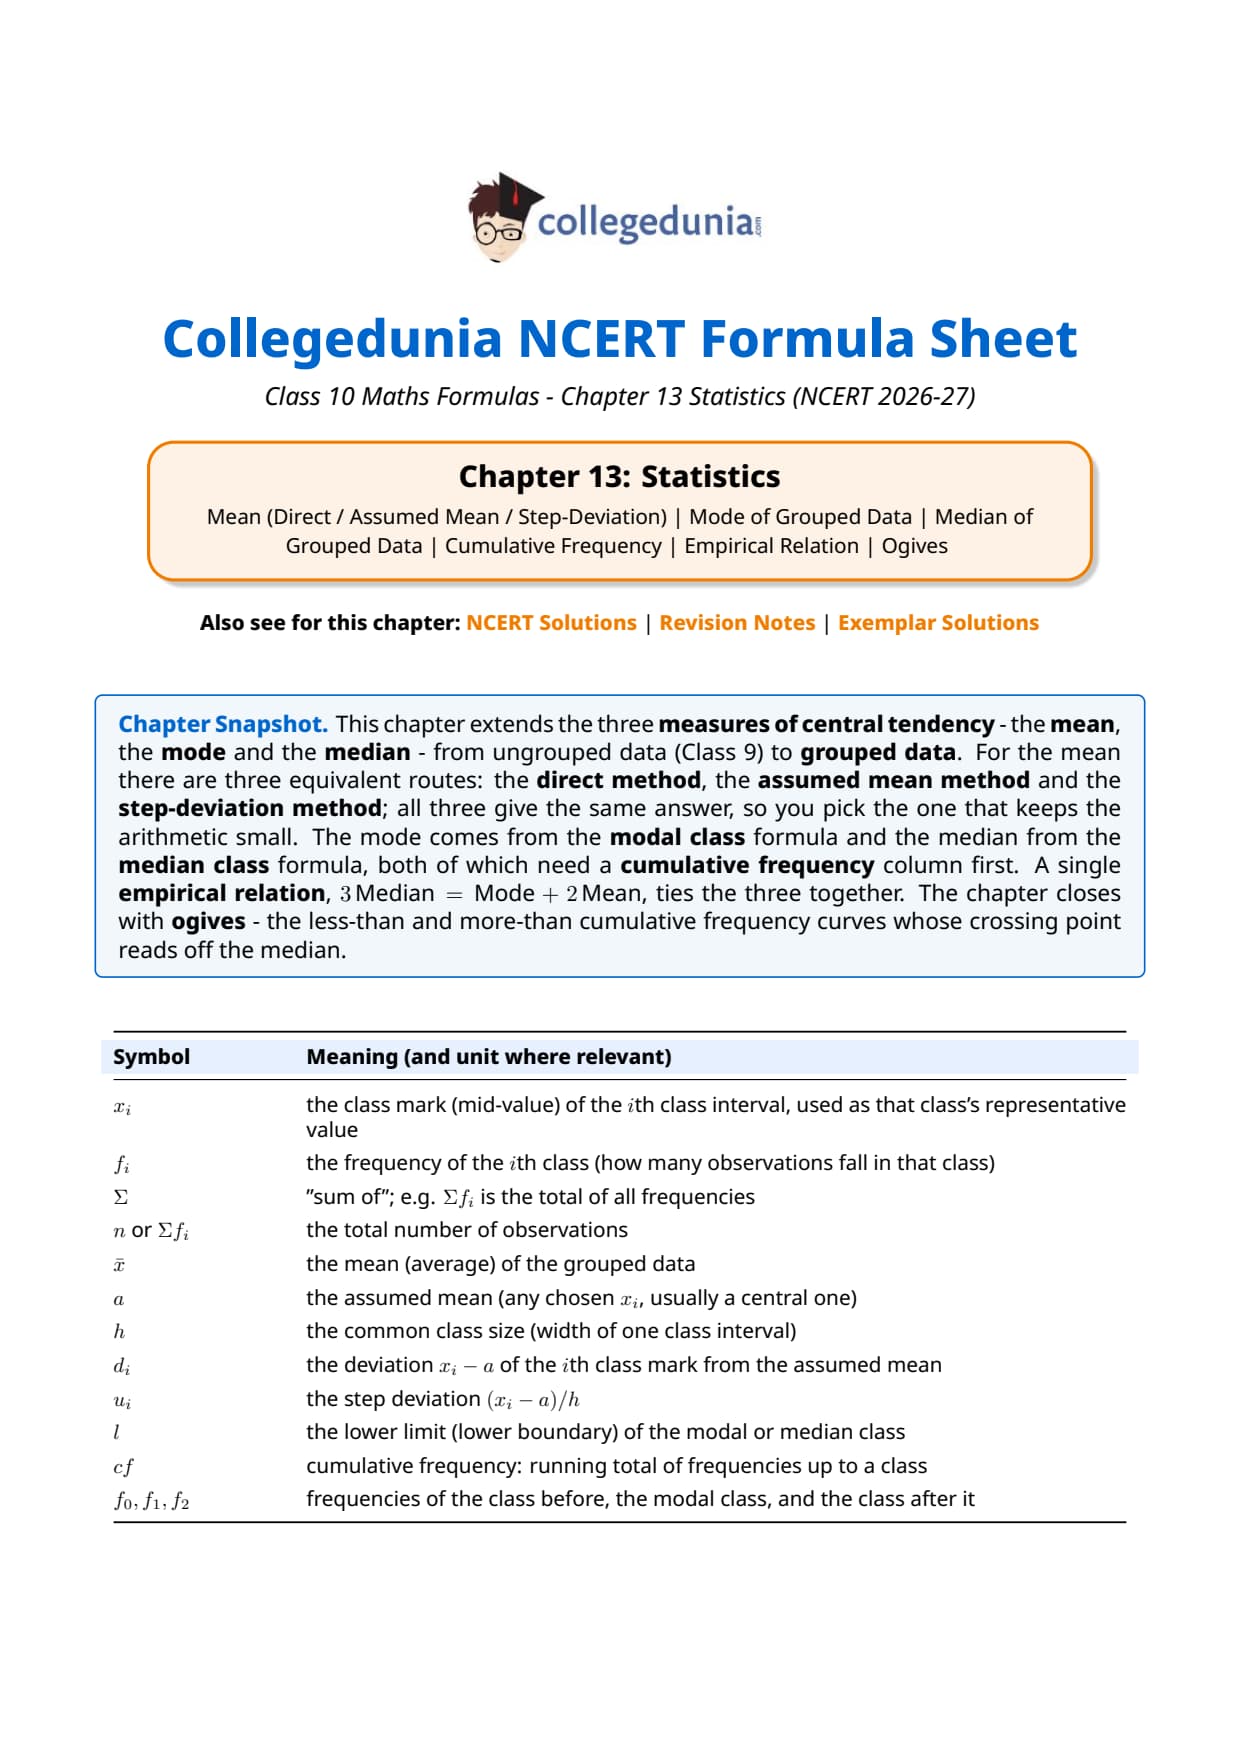
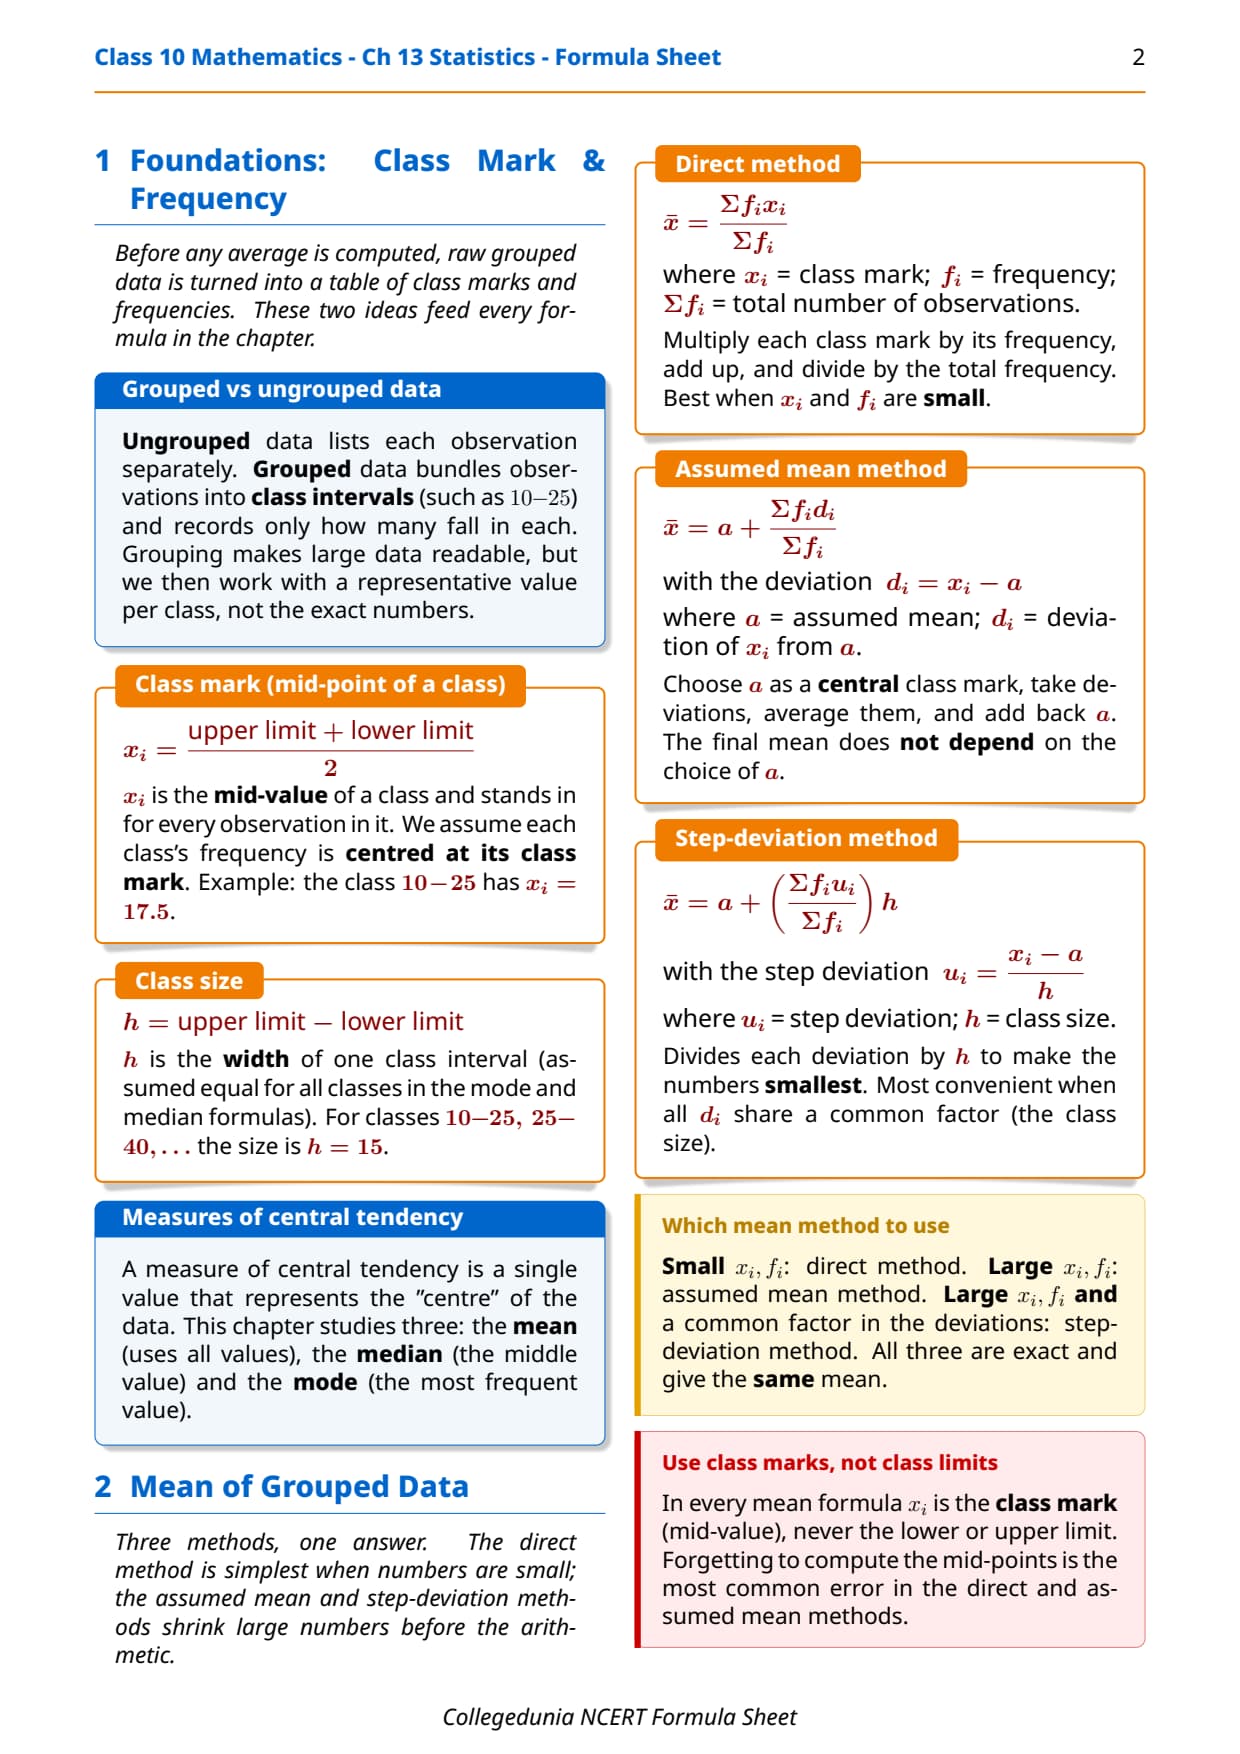
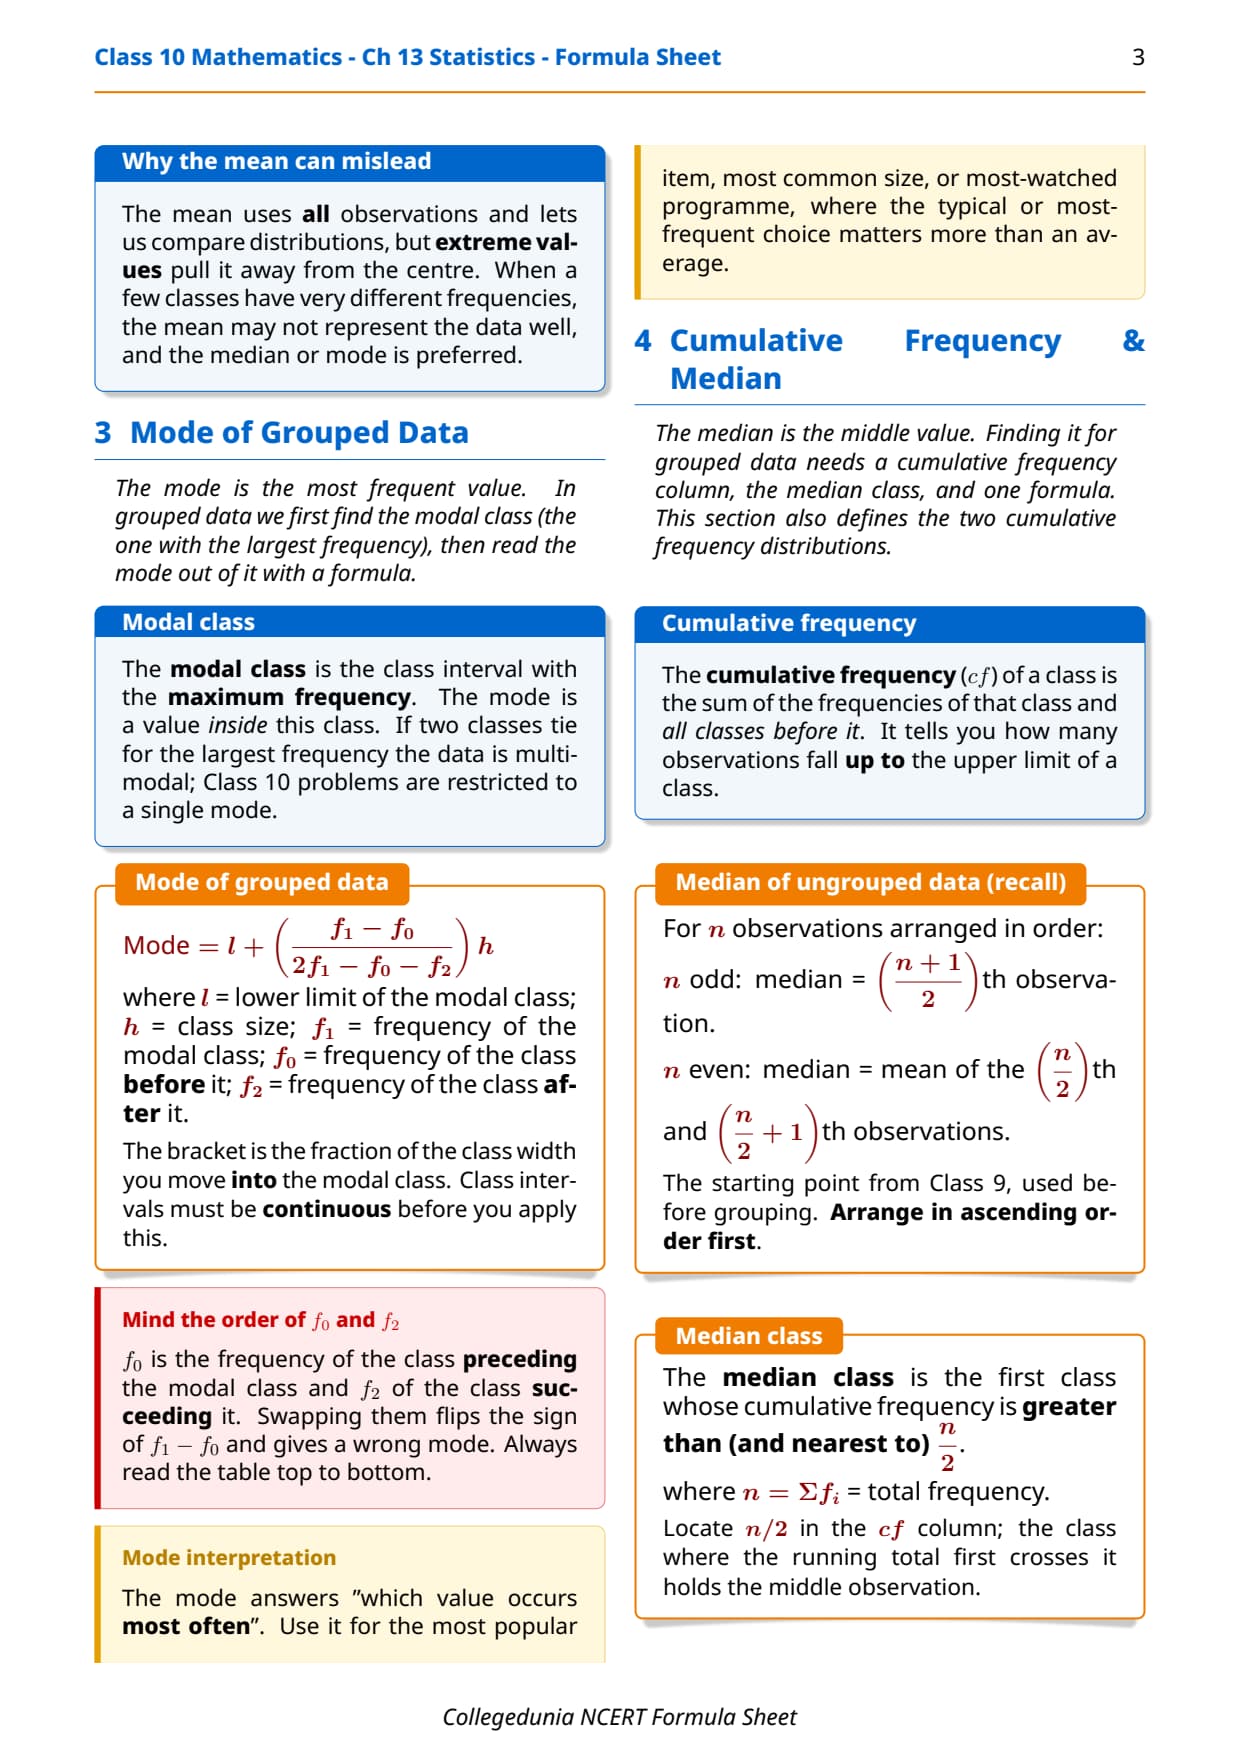
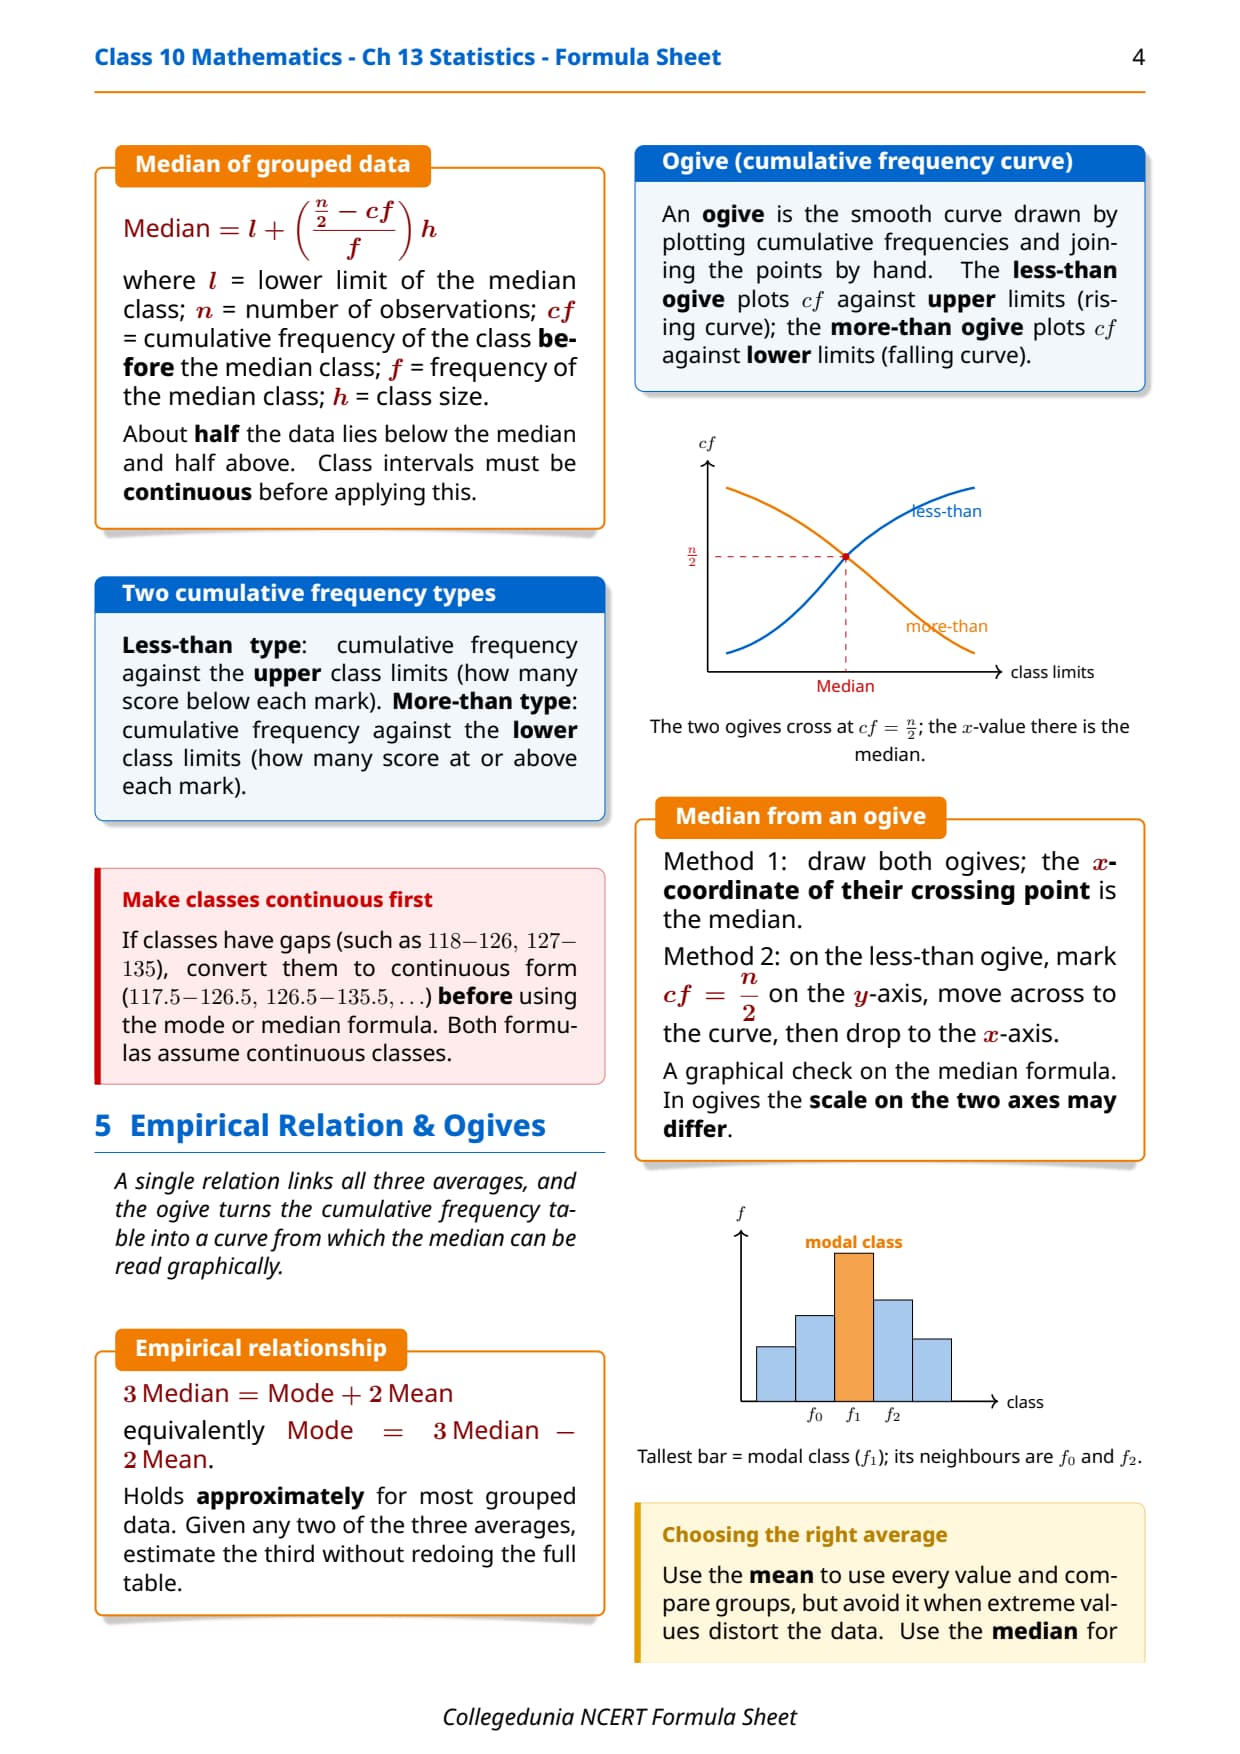
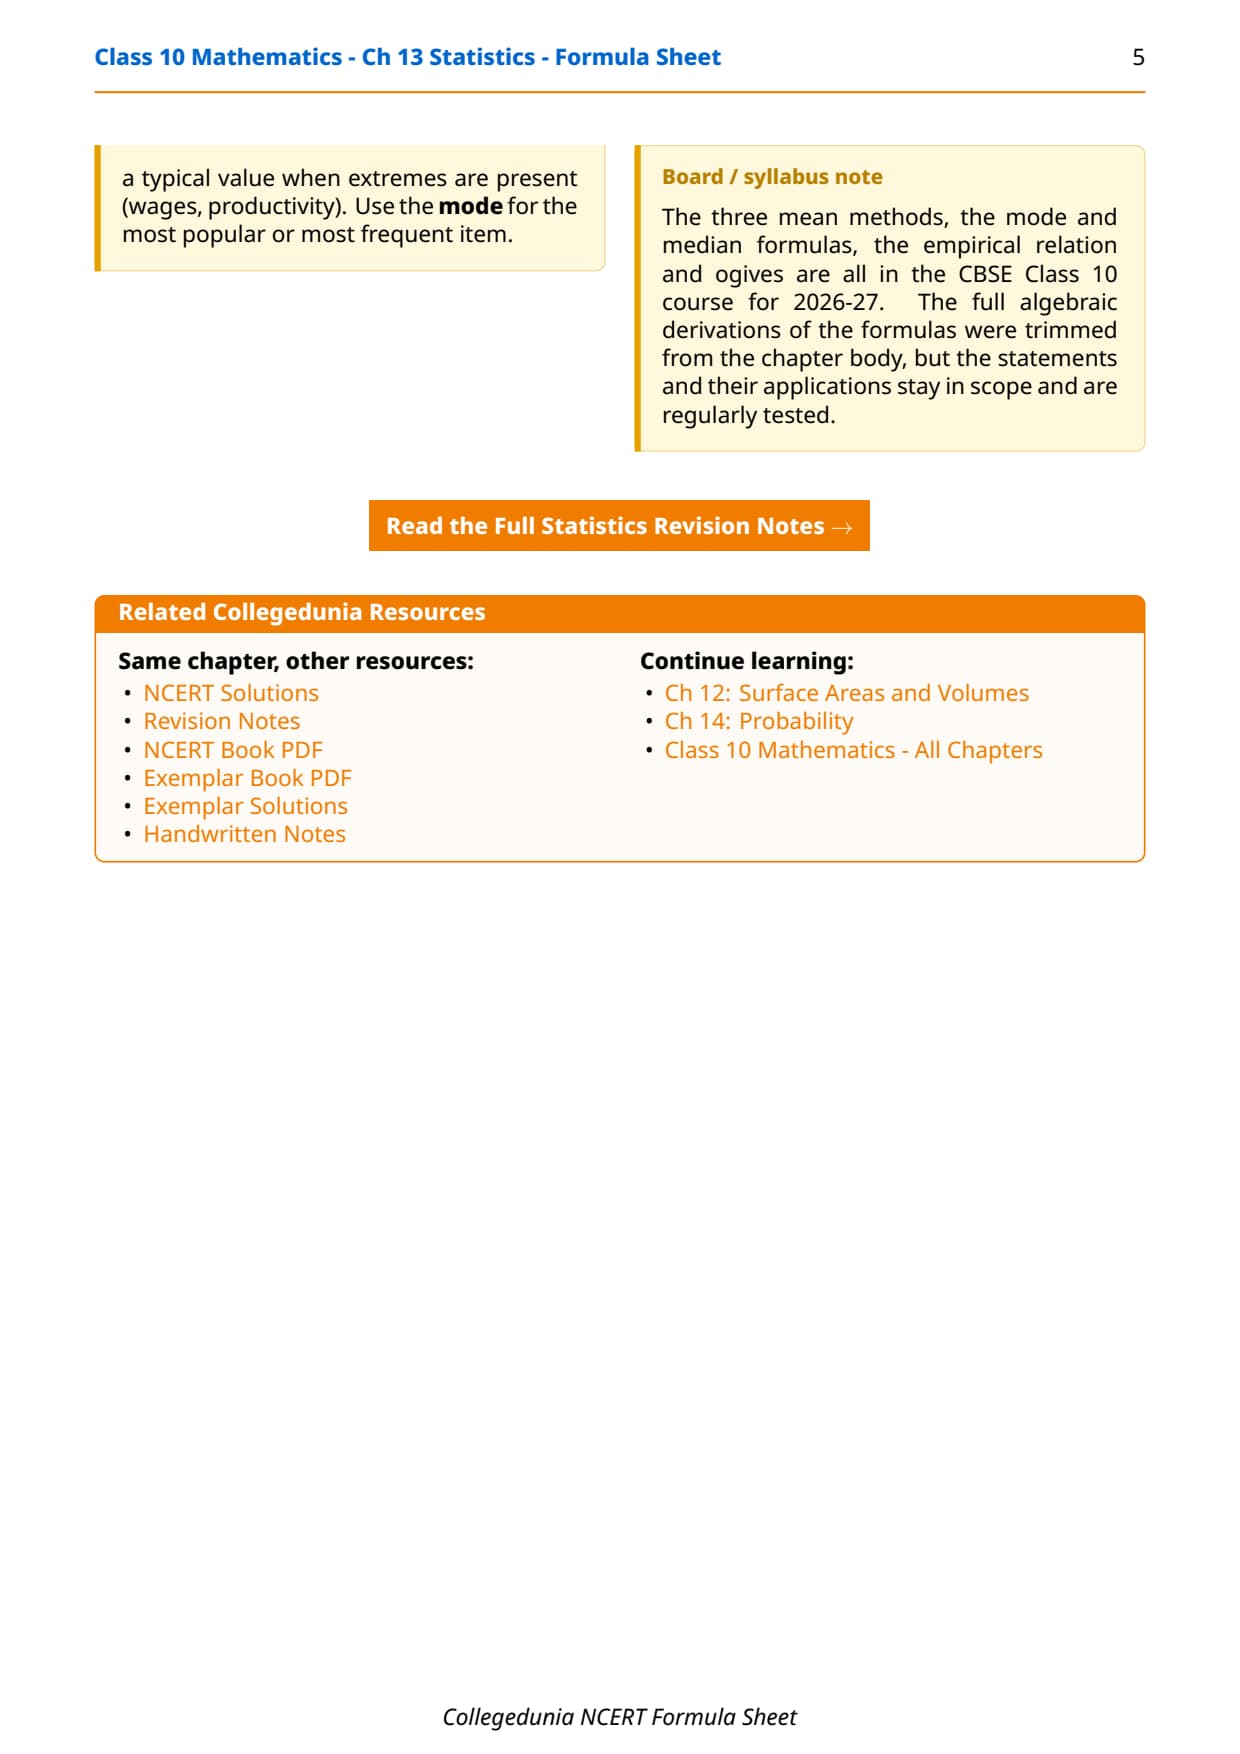
- Topics covered: mean by direct, assumed mean and step-deviation methods; mode and median of grouped data; the empirical relation (3 Median = Mode + 2 Mean); less-than and more-than ogives.
- Board context: Statistics usually carries 6 to 8 marks per paper through mean, mode, median and ogive problems.
Student Feedback: In a Collegedunia poll of 2,600 Class 10 students before the 2026 boards, 84% of students found the step-deviation method confusing at first. Those who wrote all three mean formulas side by side first solved Statistics sums in under 4 minutes.
|
Table of Contents |
Watch Statistics Class 10 Maths Explained
Source: Magnet Brains on YouTube
Complete Formula List
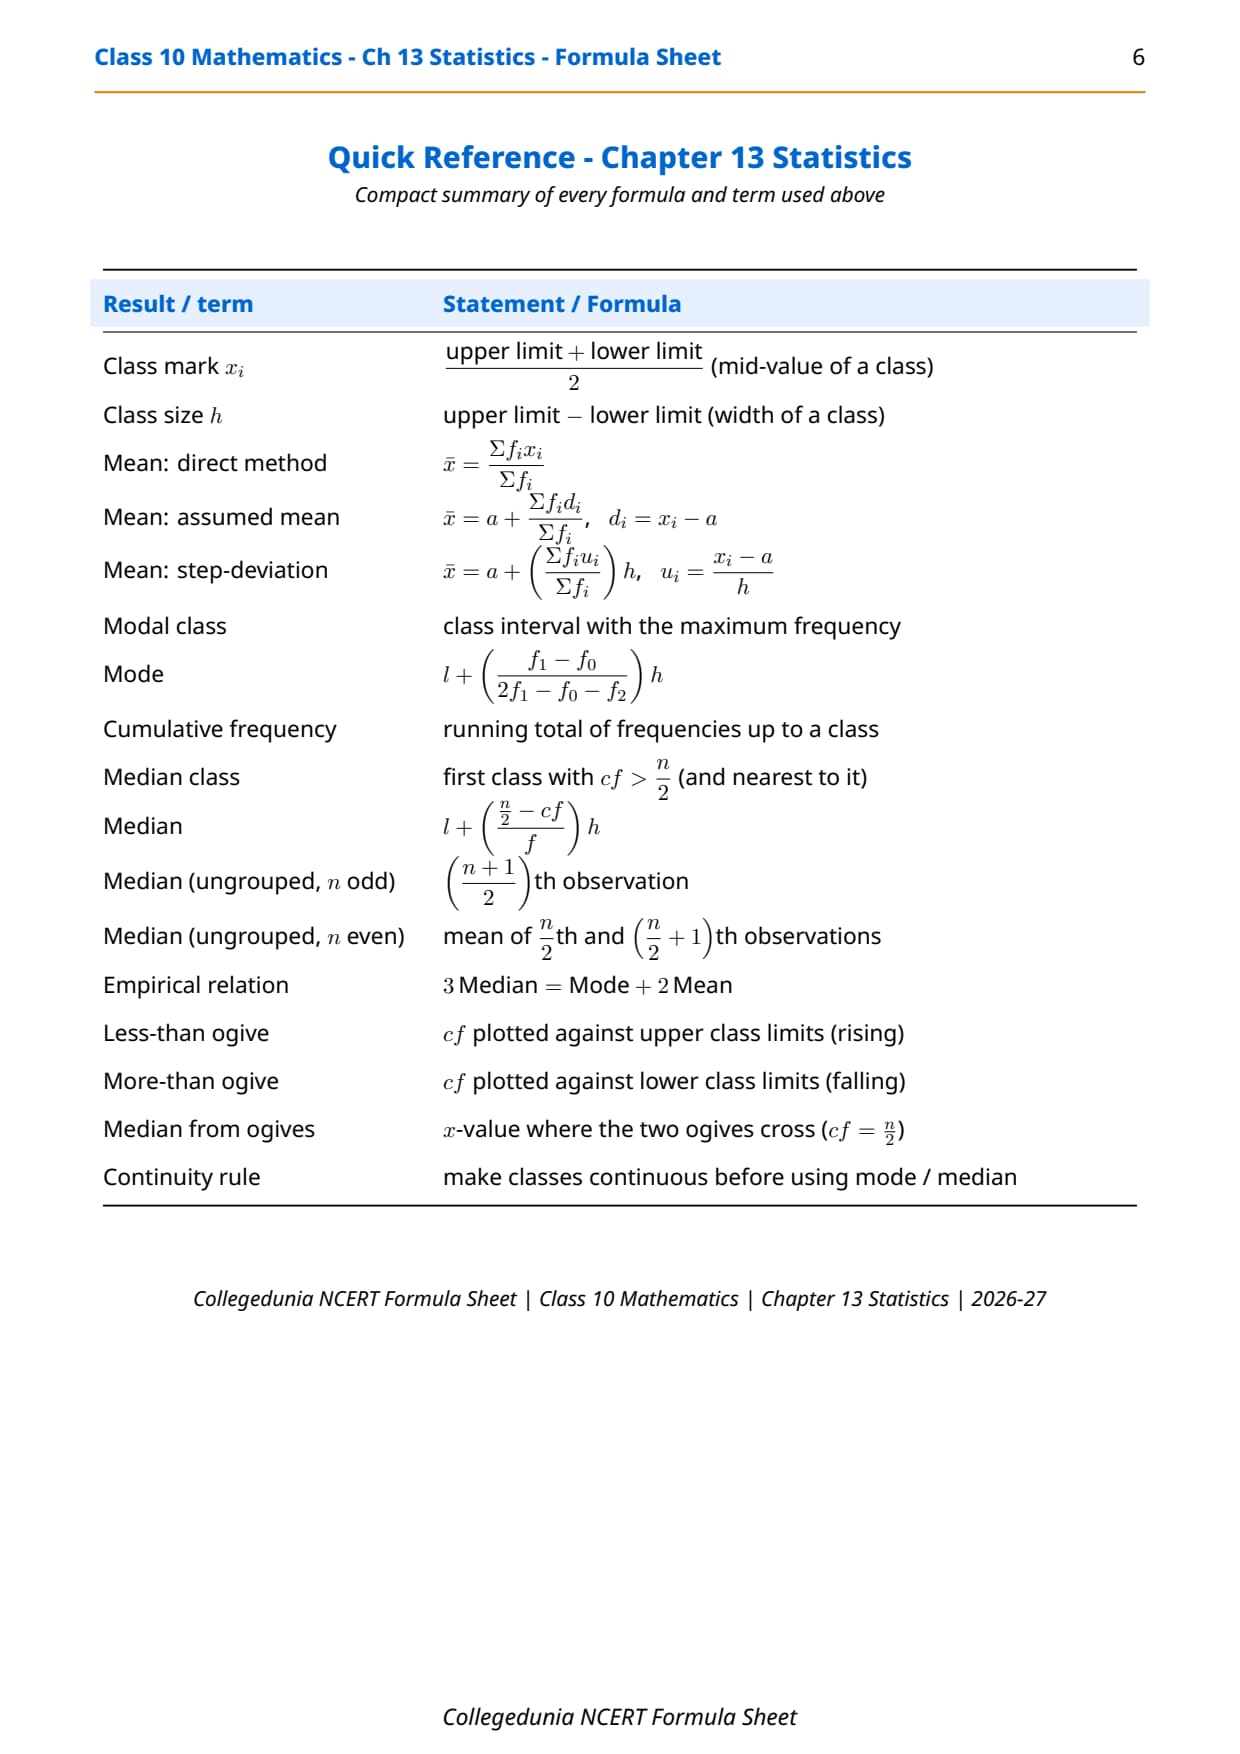
The table below lists every formula and relation from Statistics, with the concept, the formula and a short usage note. The chapter rests on three measures: mean, mode and median, each with its own grouped-data formula. Every board question asks you to find one of these averages, apply the empirical relation, or draw an ogive.
| Concept | Formula / Definition | Usage Note |
|---|---|---|
| Class mark (xi) | xi = (upper limit + lower limit) / 2 | Representative value for each class; used in every mean formula |
| Class size (h) | h = upper limit − lower limit | Must be equal across all classes for the mode and median formulas |
| Mean: direct method | x̄ = Σfixi / Σfi | Best when class marks and frequencies are small |
| Mean: assumed mean method | x̄ = a + (Σfidi / Σfi), where di = xi − a | Choose a central class mark as the assumed mean a |
| Mean: step-deviation method | x̄ = a + (Σfiui / Σfi) × h, where ui = (xi − a) / h | Most compact when all deviations share a common factor h |
| Modal class | Class interval with the maximum frequency | Identify this row before applying the mode formula |
| Mode of grouped data | Mode = l + [(f1 − f0) / (2f1 − f0 − f2)] × h | l = lower limit of modal class; f0, f1, f2 = frequencies before, of, and after modal class |
| Cumulative frequency (cf) | Running total of frequencies from the first class up to and including the current class | Build cf column before applying the median formula |
| Median class | First class whose cf ≥ n/2 (where n = Σfi) | Locate n/2 in the cf column |
| Median of grouped data | Median = l + [(n/2 − cf) / f] × h | l = lower limit of median class; cf = cumulative frequency before median class; f = frequency of median class |
| Empirical relation | 3 Median = Mode + 2 Mean | Estimate any one average when the other two are known |
| Less-than ogive | Plot cf against upper class limits; gives a rising curve | Drop a perpendicular from cf = n/2 to read the median |
| More-than ogive | Plot cf against lower class limits; gives a falling curve | The x-coordinate where the two ogives cross equals the median |
Mean formulas for grouped data: direct method, assumed mean method and step-deviation method - all three give the same answer but differ in computational effort.
Mean of Grouped Data: Three Methods
You can find the mean of grouped data three ways: the direct, assumed mean and step-deviation methods. All three give the same answer, so pick the one that keeps the arithmetic simplest. The direct method multiplies each class mark by its frequency; the other two shrink large numbers first.
Mode of Grouped Data
First find the modal class (highest frequency), then use the formula. Mode = l + [(f1 − f0) / (2f1 − f0 − f2)] × h, where l is the lower limit of the modal class, f1 its frequency, f0 the frequency before it, and f2 the frequency after it. Swapping f0 and f2 is the most common mode error.
Median of Grouped Data
The median needs a cumulative frequency (cf) column and the median formula. Find n/2 and locate the class where the running total first reaches it. Median = l + [(n/2 − cf) / f] × h, where l is the lower limit of the median class, cf the cumulative frequency of the class just before it, and f the frequency of the median class. Using the median class's own cf, instead of the class before it, is the top median error.
Mode and median formulas for grouped data: the modal class has the highest frequency and the median class is where the running total first reaches n/2.
Empirical Relation: Mean, Mode & Median
The empirical relation links all three averages: 3 Median = Mode + 2 Mean. Use it when a question gives two averages and asks for the third with no full table to recompute. The relation gives an approximate value, so use it for estimation only.
| Given | Find | Formula to use |
|---|---|---|
| Mean and Mode | Median | Median = (Mode + 2 Mean) / 3 |
| Mean and Median | Mode | Mode = 3 Median − 2 Mean |
| Mode and Median | Mean | Mean = (3 Median − Mode) / 2 |
Ogives: Reading the Median off a Curve
An ogive is the graph of a cumulative frequency distribution. There are two types, the less-than ogive and the more-than ogive, and both let you read the median off a graph without the formula. For the less-than ogive, plot upper class limits against cumulative frequencies; mark n/2 on the y-axis, go across to the curve, then drop to the x-axis to read the median. The more-than ogive plots lower class limits against falling totals. The point where the two ogives cross gives the median.
| Type | x-axis values | y-axis values | Shape | How to read median |
|---|---|---|---|---|
| Less-than ogive | Upper class limits | Less-than cf (rising totals) | Rising S-curve | Mark y = n/2; go across to curve; drop to x-axis |
| More-than ogive | Lower class limits | More-than cf (falling totals) | Falling S-curve | The x-value where both curves cross |
CBSE Board Exam Weightage
Statistics is a steady source of 3-mark and 4-mark questions, testing both formula recall and multi-step numerical work.
| Topic | Typical Question Type | Usual Marks |
|---|---|---|
| Mean by direct or assumed mean method | Compute the mean of a given frequency distribution | 3 marks |
| Mean by step-deviation method | Compute the mean; question usually specifies which method | 3 marks |
| Mode of grouped data | Find the mode from a grouped frequency table | 3 marks |
| Median of grouped data | Find the median; requires building the cf column first | 3 to 4 marks |
| Empirical relation | Estimate one average given the other two | 2 to 3 marks |
| Ogive drawing / interpretation | Draw the less-than or more-than ogive; read the median | 4 to 5 marks |
Statistics usually adds 6 to 8 marks to the board paper. The median and the ogive drawing are the most tested items in recent years.
Common Mistakes to Avoid
Mistake 1: Using class limits instead of class marks xi = (upper + lower) / 2 in the mean.
Mistake 2: Swapping f0 (before modal class) and f2 (after) in the mode formula, which flips the numerator sign.
Mistake 3: Using the median class's own cf instead of the class before it; this shifts the answer by one full class width.
Mistake 4: Forgetting to multiply by h in the step-deviation method, leaving the answer in step units.
Mistake 5: Plotting ogive points at class marks; less-than points go at upper limits, more-than at lower limits.
Each slip costs 1 to 2 marks in the board exam.
More Statistics Resources
Use this formula sheet with the other Statistics resources below. Each covers a different angle, so together they give full board prep.
| Resource | Best Used For |
|---|---|
| Statistics NCERT Solutions | Step-by-step answers to all textbook questions |
| Statistics Notes | Full chapter explanation with solved examples |
| Statistics Handwritten Notes | Quick visual revision in a notebook style |
| Statistics NCERT Book PDF | The official textbook chapter to read |
| Statistics NCERT Exemplar Solutions | Harder practice questions with solutions |
| Statistics NCERT Exemplar Book PDF | The official Exemplar problems to attempt |
All Class 10 Maths Formula Sheets
Jump to the formula sheet for any other chapter below.
| Chapter | Formula Sheet |
|---|---|
| Chapter 1 | Real Numbers Formula Sheet |
| Chapter 2 | Polynomials Formula Sheet |
| Chapter 3 | Pair of Linear Equations in Two Variables Formula Sheet |
| Chapter 4 | Quadratic Equations Formula Sheet |
| Chapter 5 | Arithmetic Progressions Formula Sheet |
| Chapter 6 | Triangles Formula Sheet |
| Chapter 7 | Coordinate Geometry Formula Sheet |
| Chapter 8 | Introduction to Trigonometry Formula Sheet |
| Chapter 9 | Some Applications of Trigonometry Formula Sheet |
| Chapter 10 | Circles Formula Sheet |
| Chapter 11 | Areas Related to Circles Formula Sheet |
| Chapter 12 | Surface Areas and Volumes Formula Sheet |
| Chapter 13 | Statistics Formula Sheet (this page) |
| Chapter 14 | Probability Formula Sheet |
Statistics Formula Sheet FAQs
Ques. What formulas are in the Class 10 Chapter 13 Statistics formula sheet?
Ans. The sheet covers three mean formulas for grouped data (direct method: x̄ = Σfixi / Σfi; assumed mean method: x̄ = a + Σfidi / Σfi; step-deviation method: x̄ = a + (Σfiui / Σfi) × h), the mode formula (l + [(f1 − f0) / (2f1 − f0 − f2)] × h), the median formula (l + [(n/2 − cf) / f] × h), the empirical relation (3 Median = Mode + 2 Mean), and definitions of the less-than and more-than ogives.
Ques. What is the difference between the three methods for finding mean?
Ans. All three methods give the same mean. The direct method (x̄ = Σfixi / Σfi) multiplies each class mark directly. The assumed mean method (x̄ = a + Σfidi / Σfi) reduces large class marks to small deviations di = xi − a by subtracting a chosen assumed mean a. The step-deviation method (x̄ = a + (Σfiui / Σfi) × h) goes further by dividing each deviation by the class size h to get even smaller integers ui = (xi − a) / h. Choose whichever method makes the arithmetic simplest for the given numbers.
Ques. How do you find the mode of grouped data?
Ans. First, find the modal class, which is the class interval with the highest frequency. Then apply the formula: Mode = l + [(f1 − f0) / (2f1 − f0 − f2)] × h, where l is the lower limit of the modal class, f1 is its frequency, f0 is the frequency of the class just before the modal class, f2 is the frequency of the class just after it, and h is the class size. Be careful to identify f0 and f2 in the correct order by reading the table from top to bottom.
Ques. How do you find the median of grouped data?
Ans. Add a cumulative frequency column to the table. Calculate n/2, where n is the total frequency. Find the median class, which is the first class whose cumulative frequency is greater than or equal to n/2. Then apply: Median = l + [(n/2 − cf) / f] × h, where l is the lower limit of the median class, cf is the cumulative frequency of the class before the median class (not of the median class itself), f is the frequency of the median class, and h is the class size.
Ques. What is the empirical relation between mean, mode and median?
Ans. The empirical relation is: 3 Median = Mode + 2 Mean. This can be rearranged to find any one of the three averages when the other two are known: Mode = 3 Median − 2 Mean; Median = (Mode + 2 Mean) / 3; Mean = (3 Median − Mode) / 2. The relation is approximate and holds for most grouped distributions. It is used in board questions where a full table-based calculation is not required.
Ques. Is this formula sheet aligned with the 2026-27 NCERT syllabus?
Ans. Yes. This page reflects the current 2026-27 CBSE Class 10 Mathematics syllabus. Chapter 13 Statistics is retained in full in the 2026-27 edition, including all three mean methods, the mode and median formulas, the empirical relation and ogives. All formulas on this sheet match the exercises, examples and definitions in the current NCERT textbook for Class 10 Maths.



Comments