



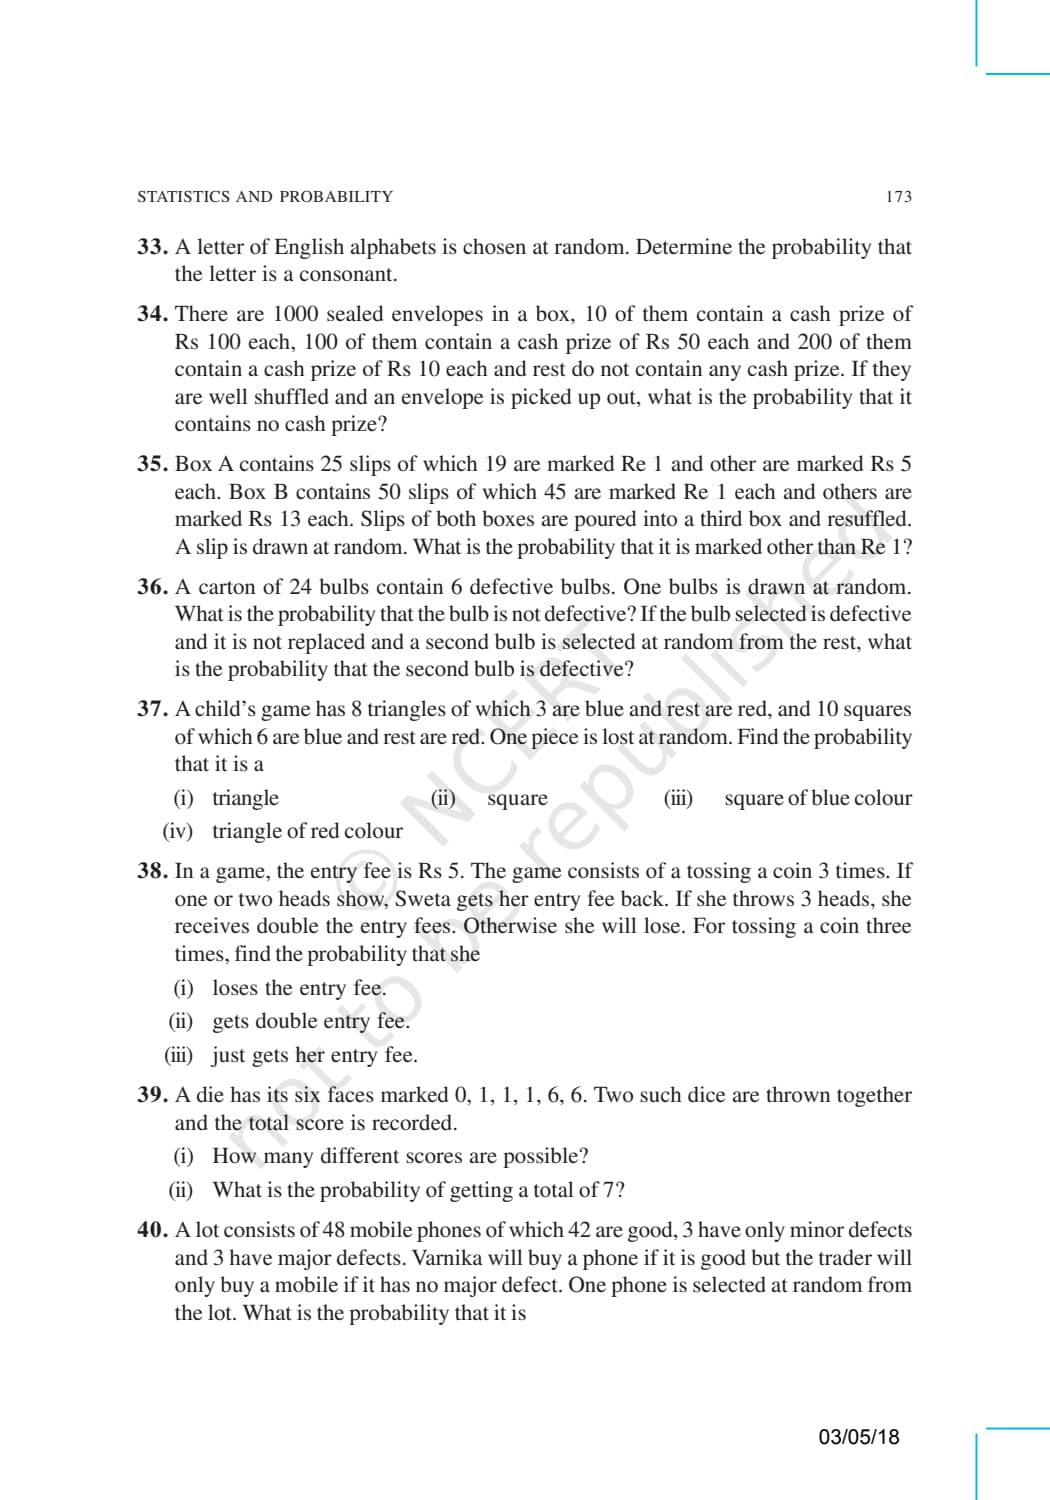
The NCERT Exemplar Class 10 Maths Statistics book is a free, download-ready problem set for Chapter 13, mapped to the 2026-27 NCERT syllabus. This page bundles the official Exemplar PDF with a question-type map, an Exemplar versus textbook difficulty guide, and a parallel study plan so students get harder CBSE-style practice on mean, median, mode, and cumulative frequency.
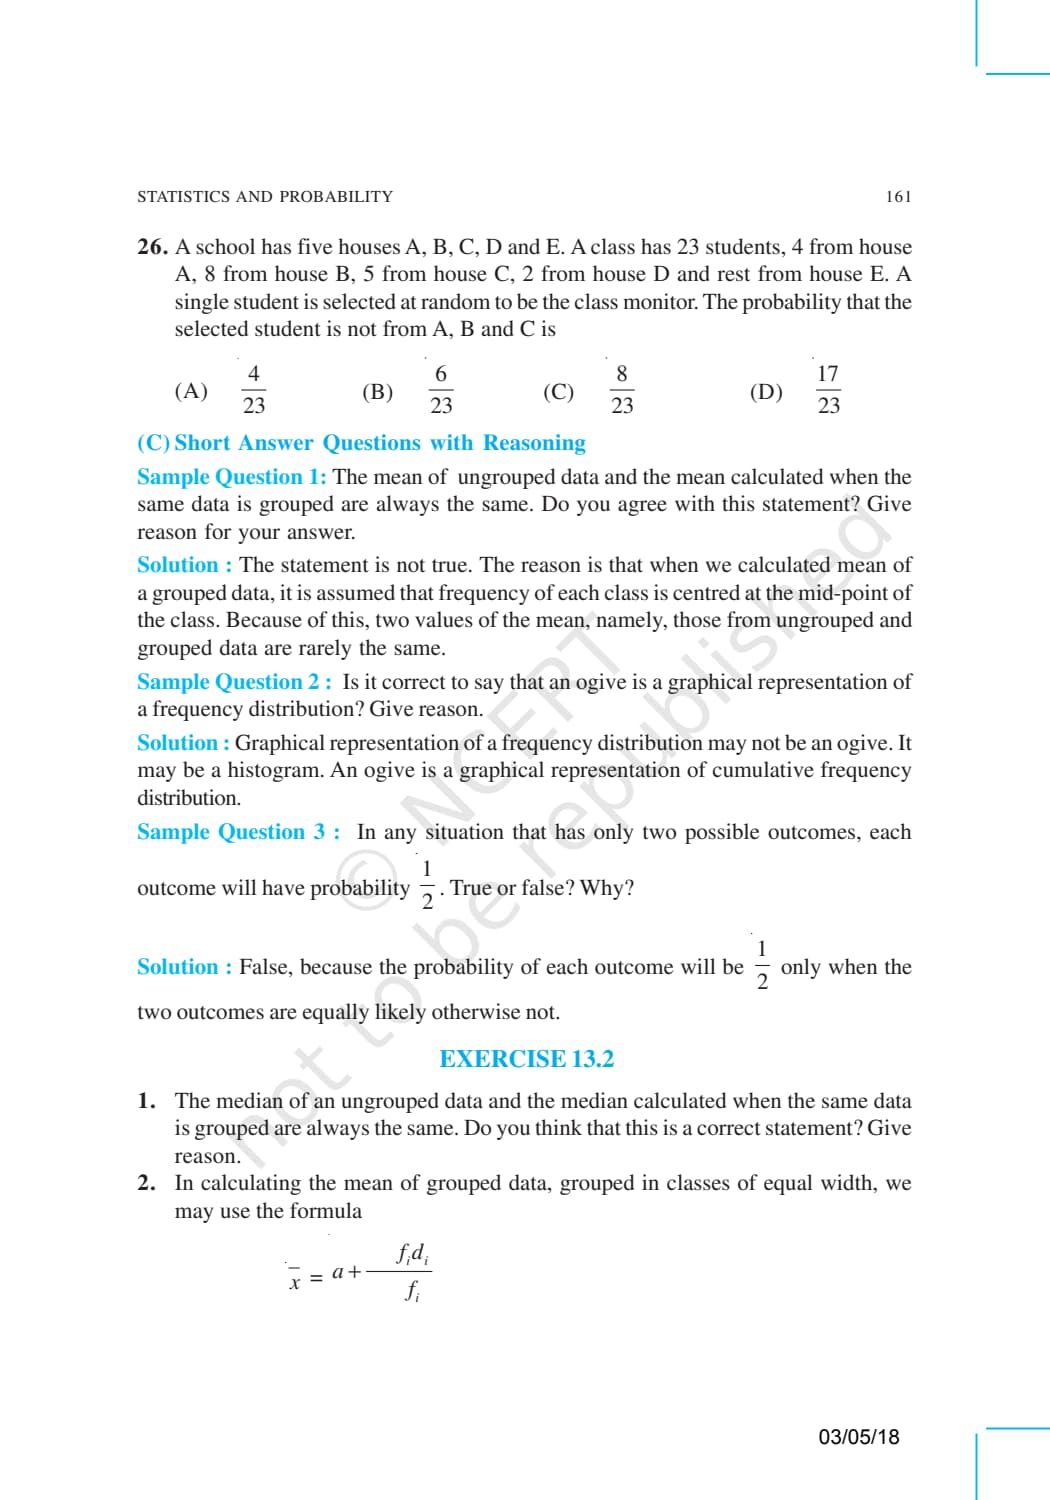
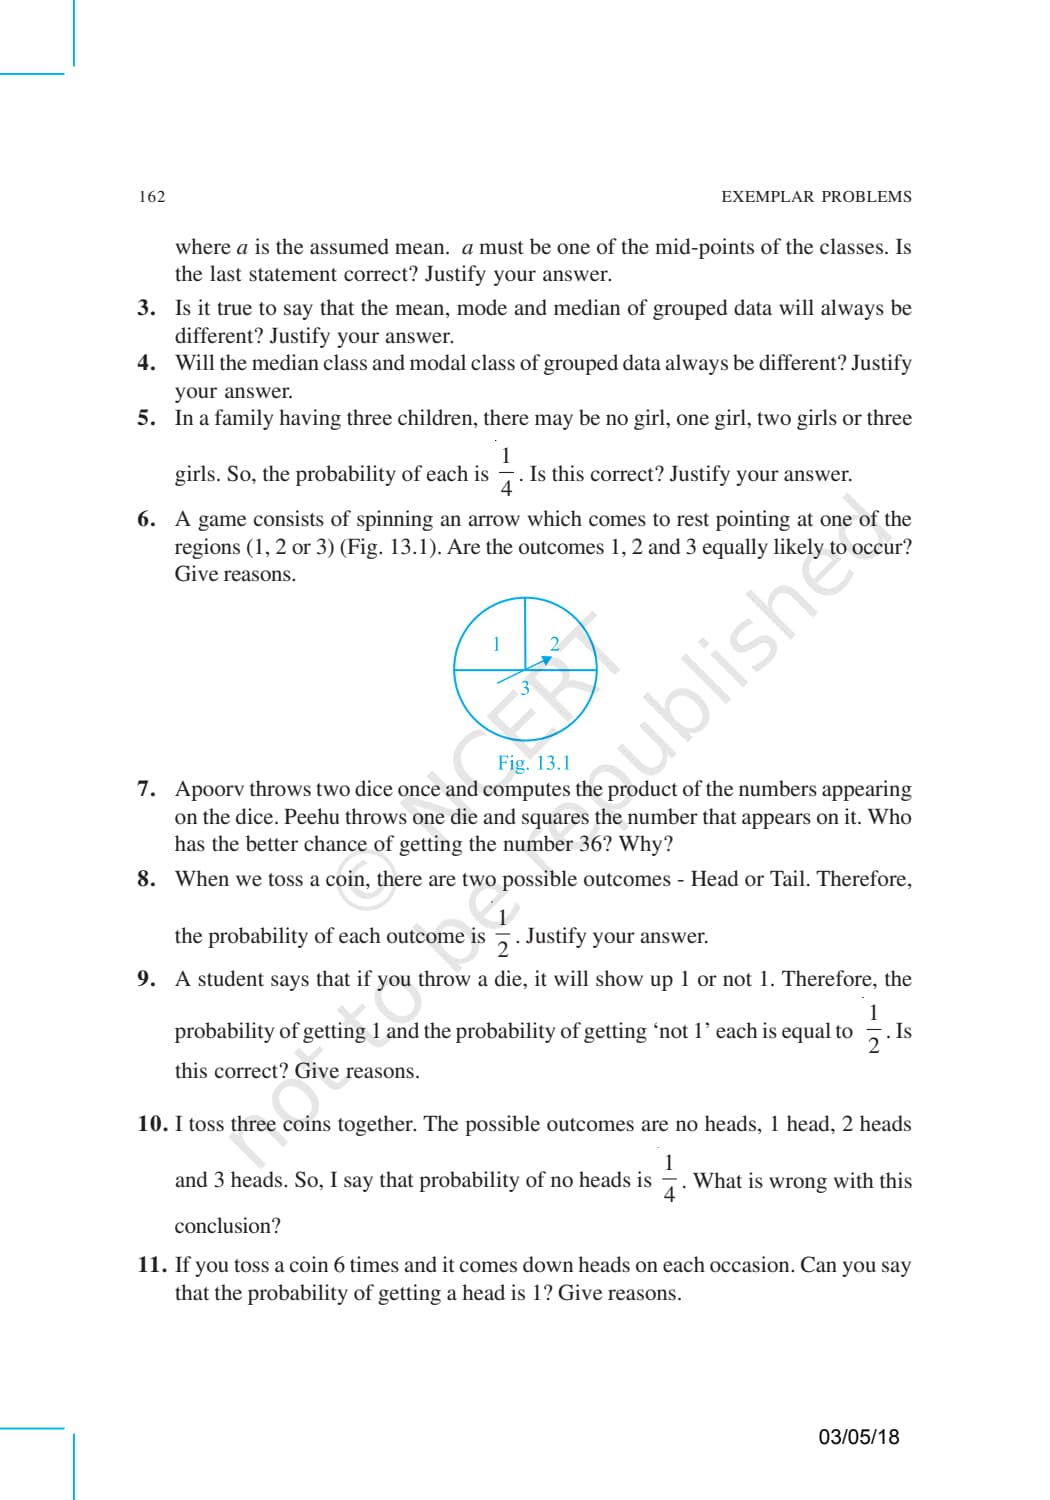
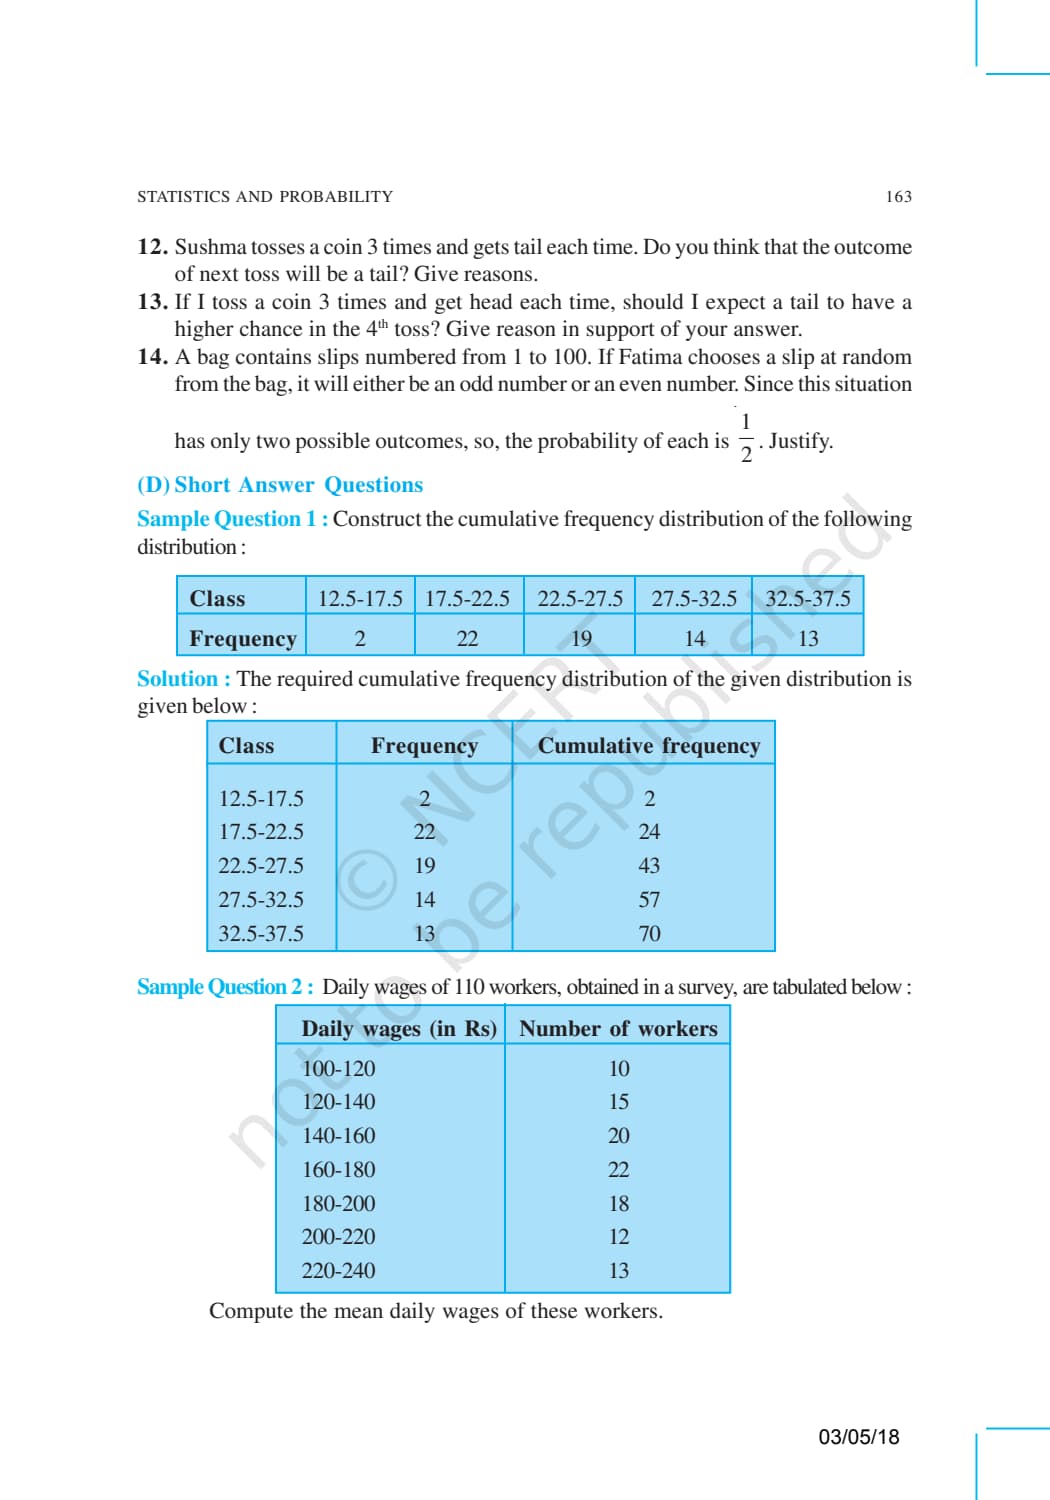
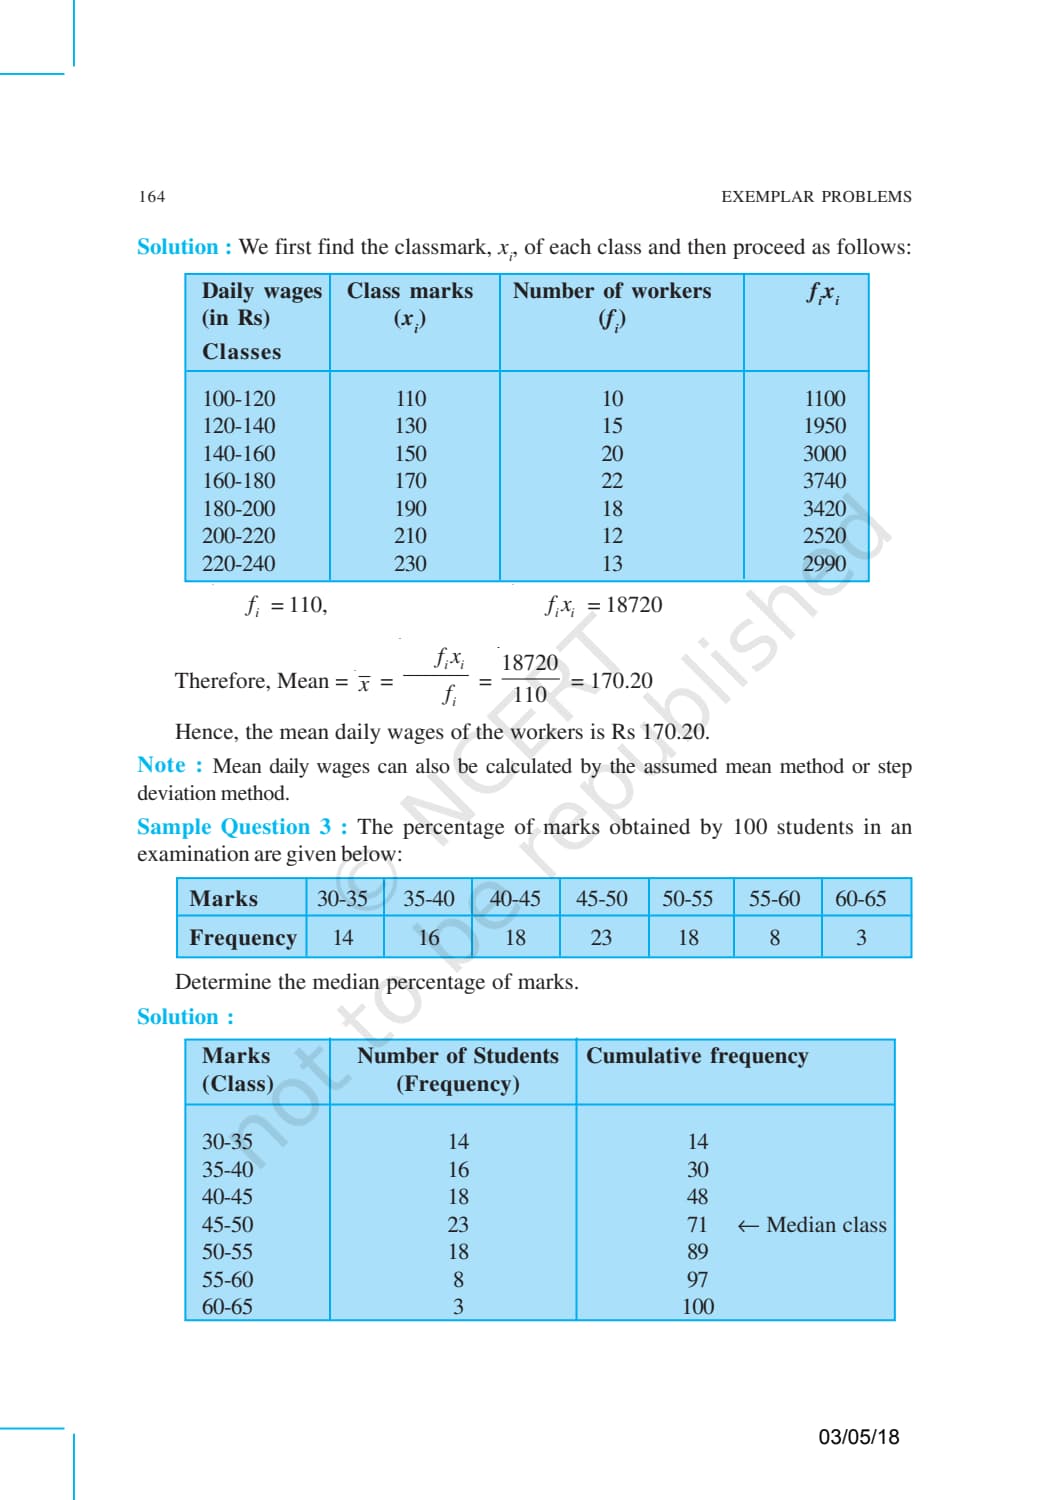
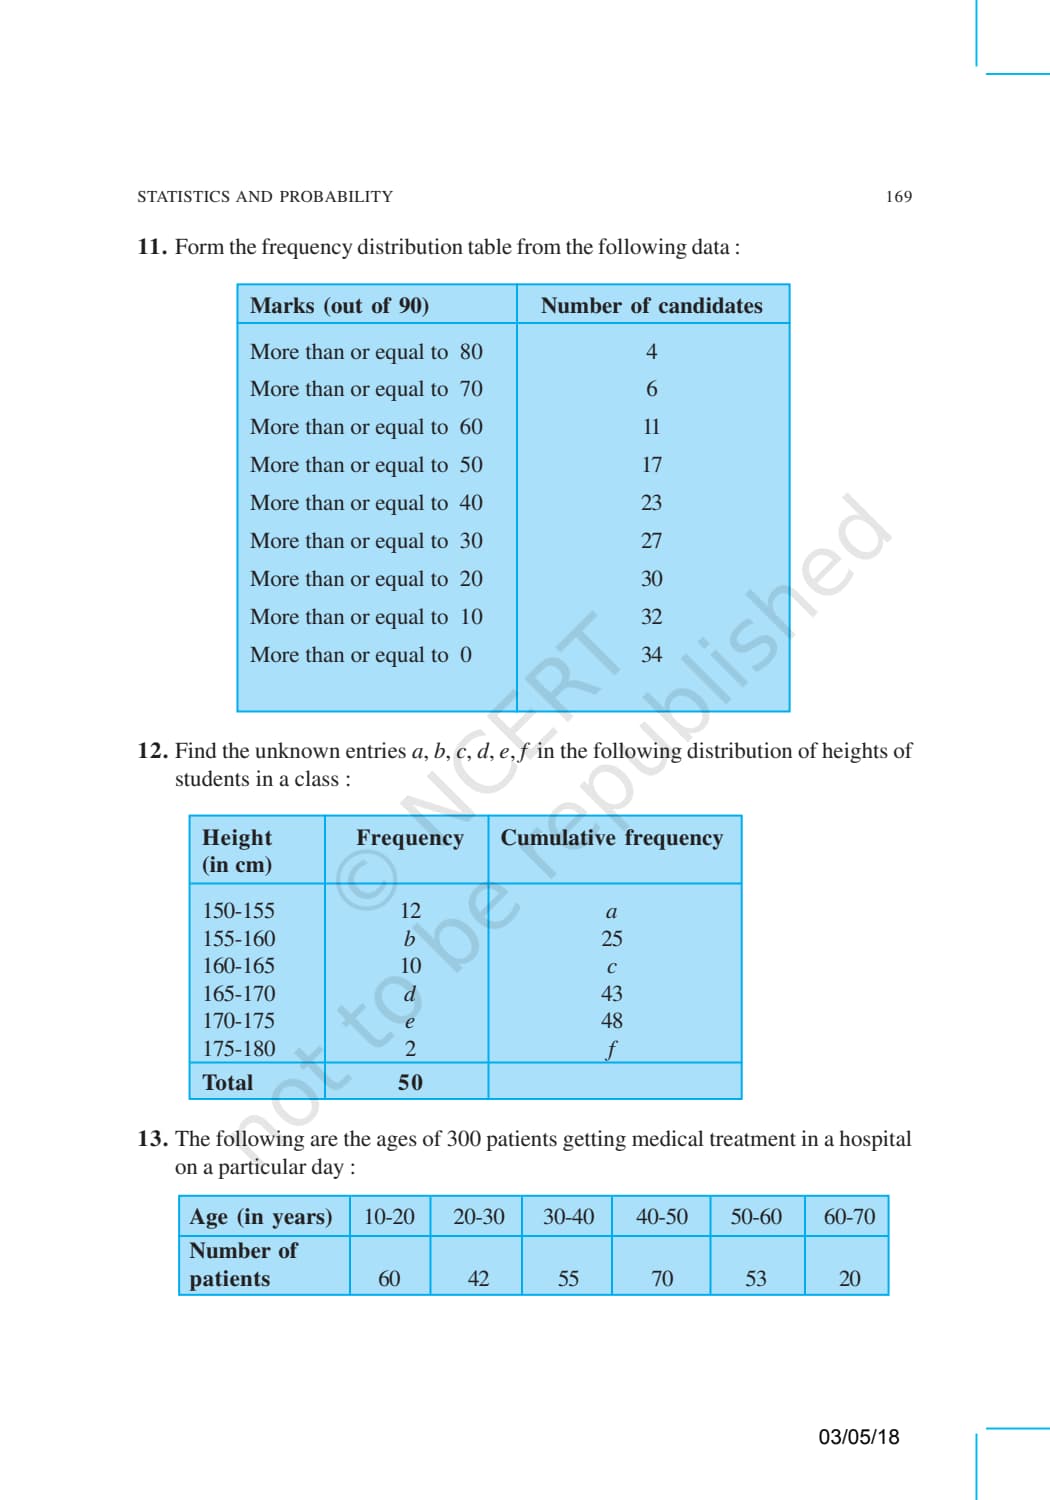
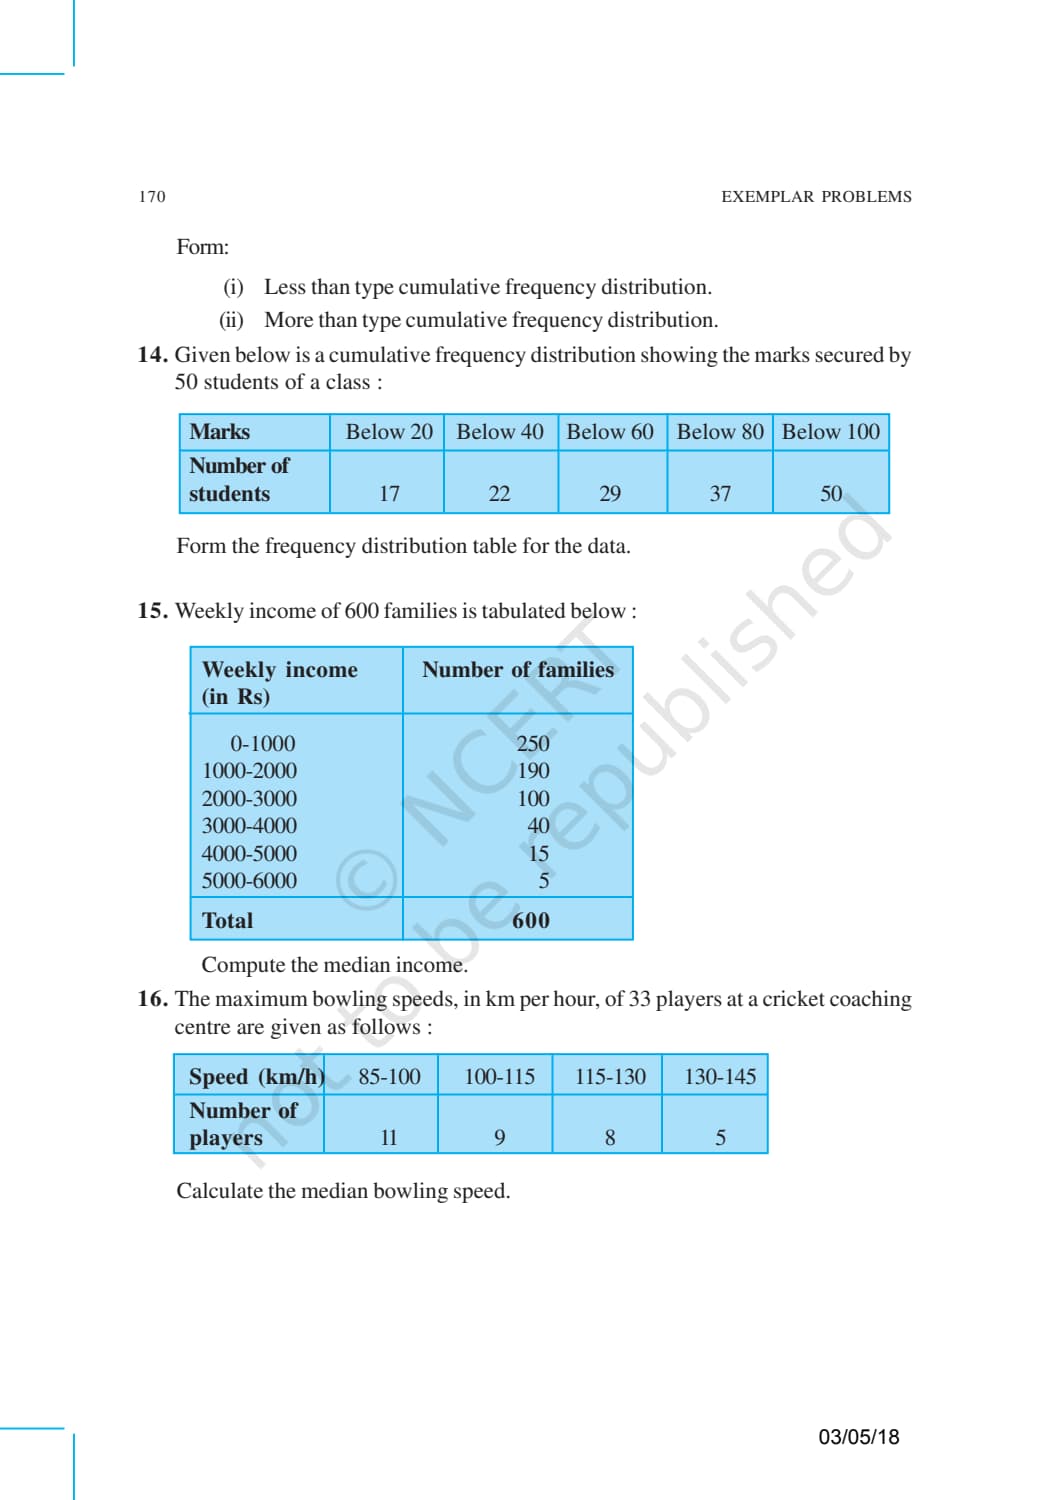
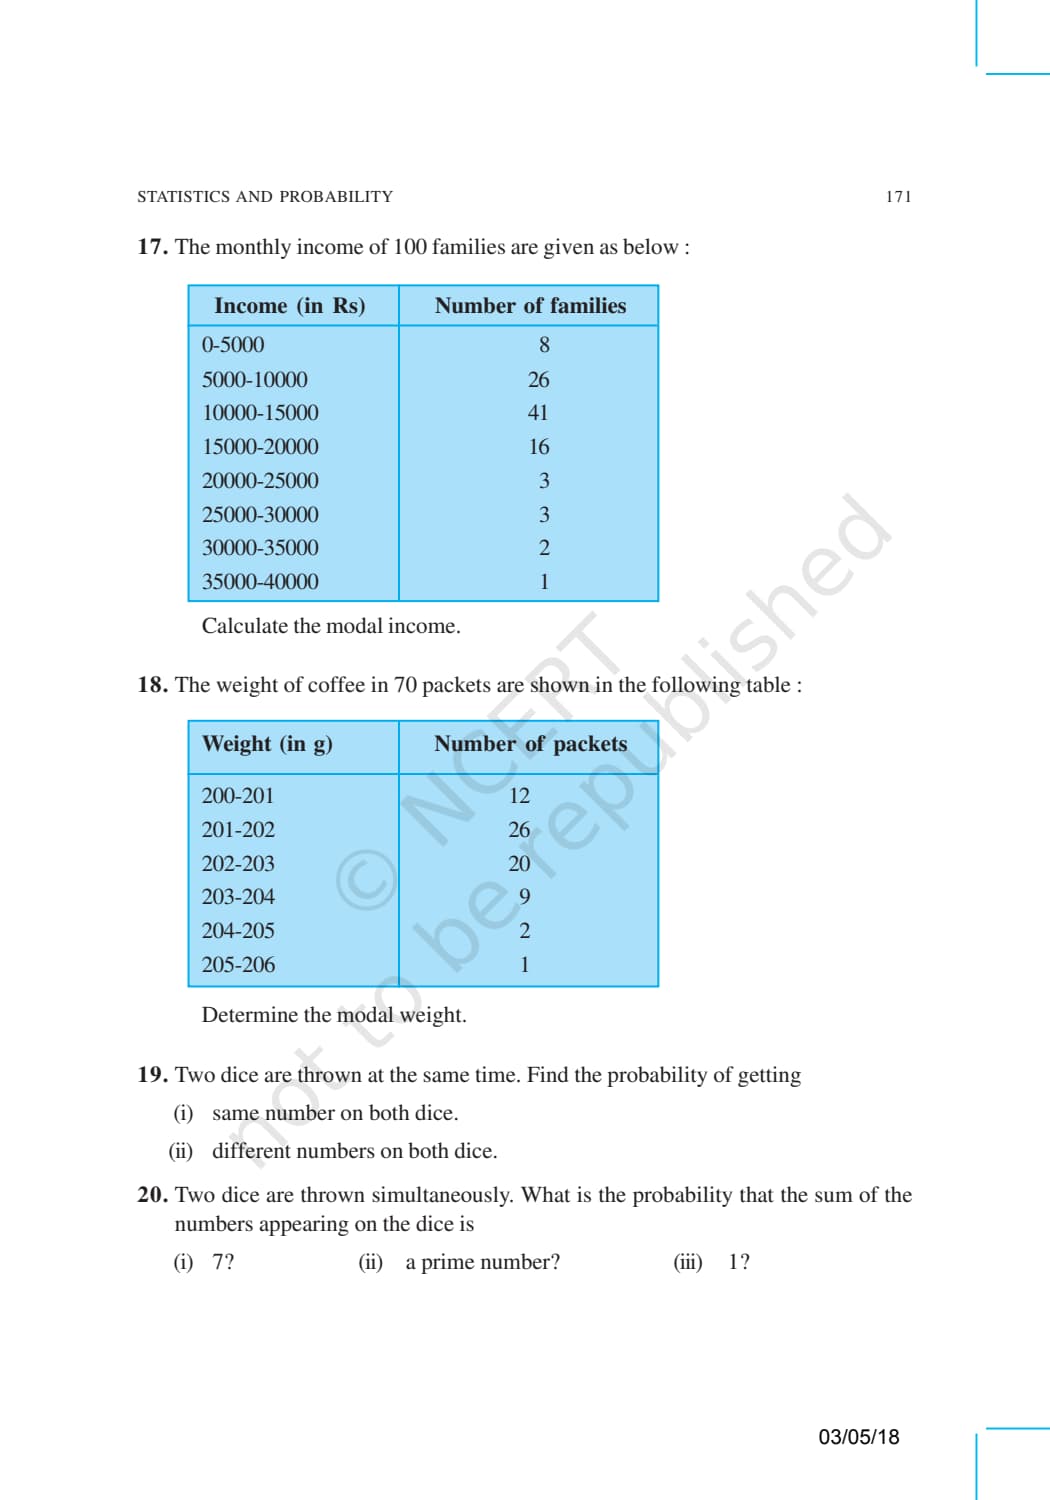
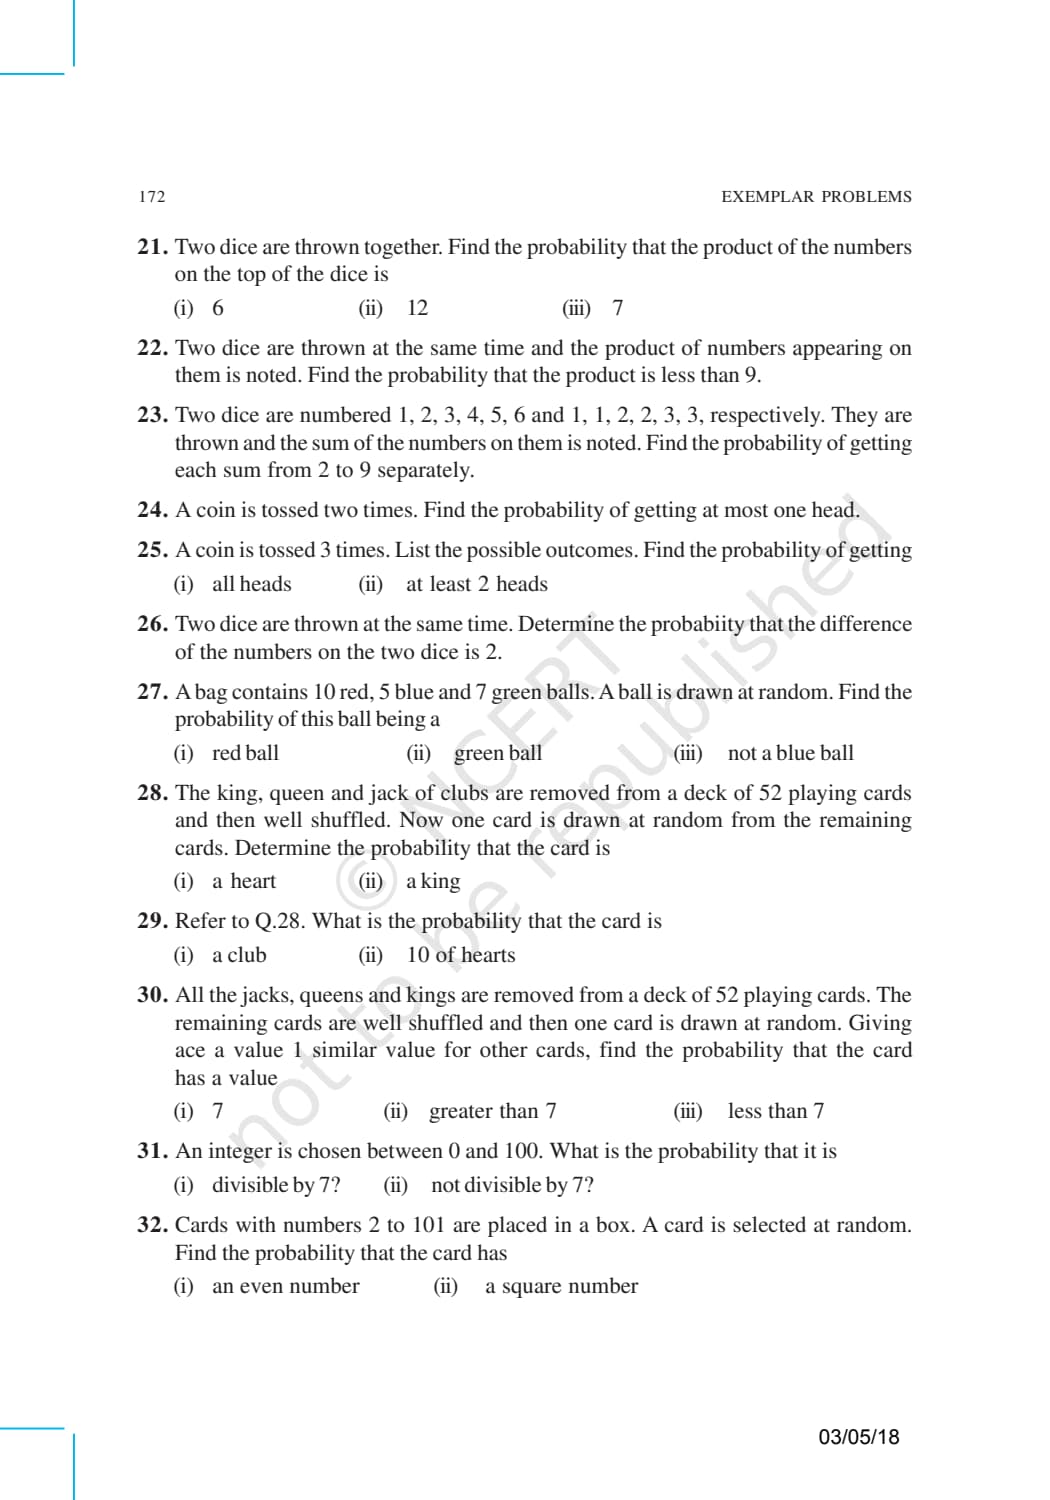
- CBSE Weightage: Statistics falls under the Statistics and Probability unit, which carries 11 marks in the Class 10 board paper.
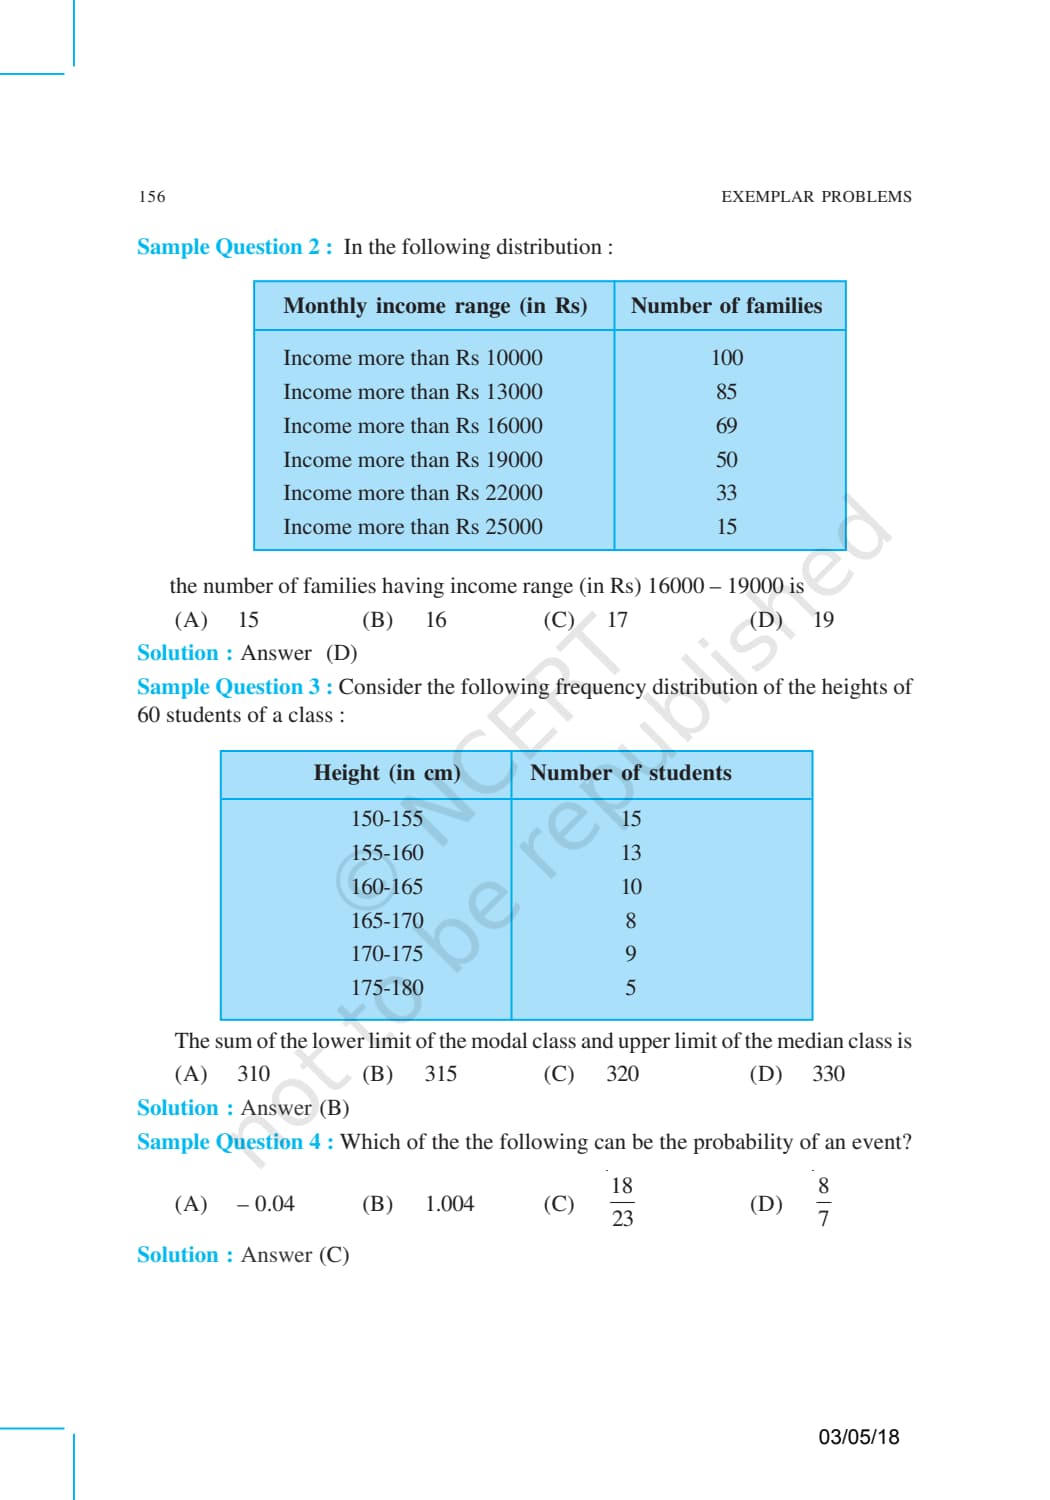
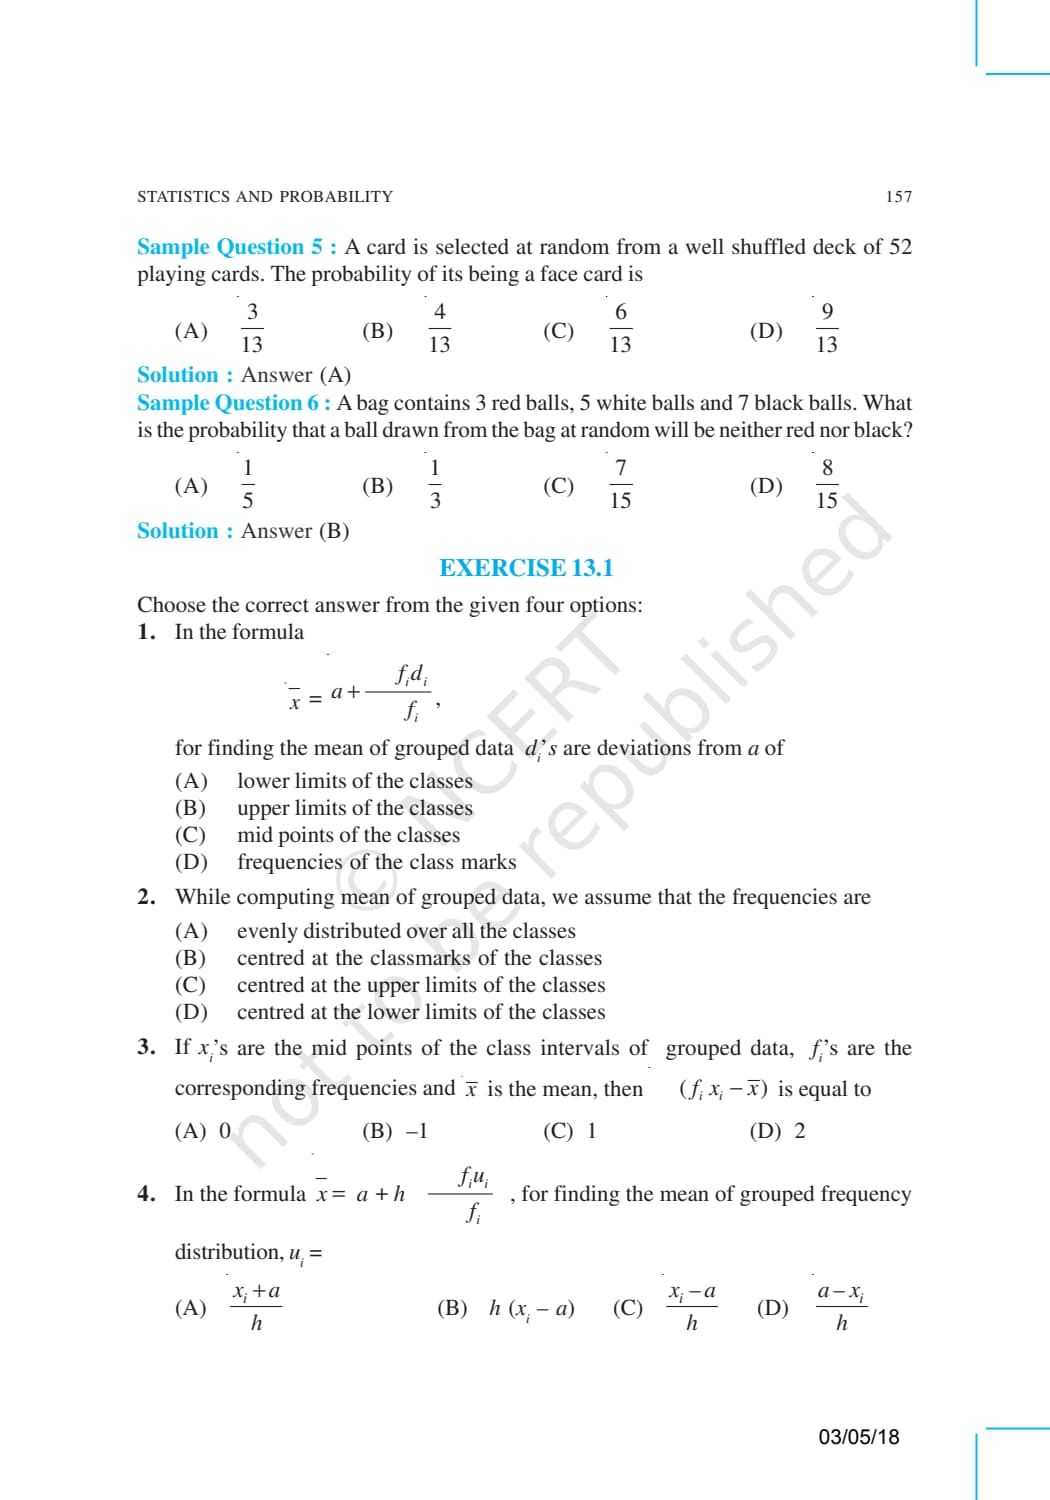
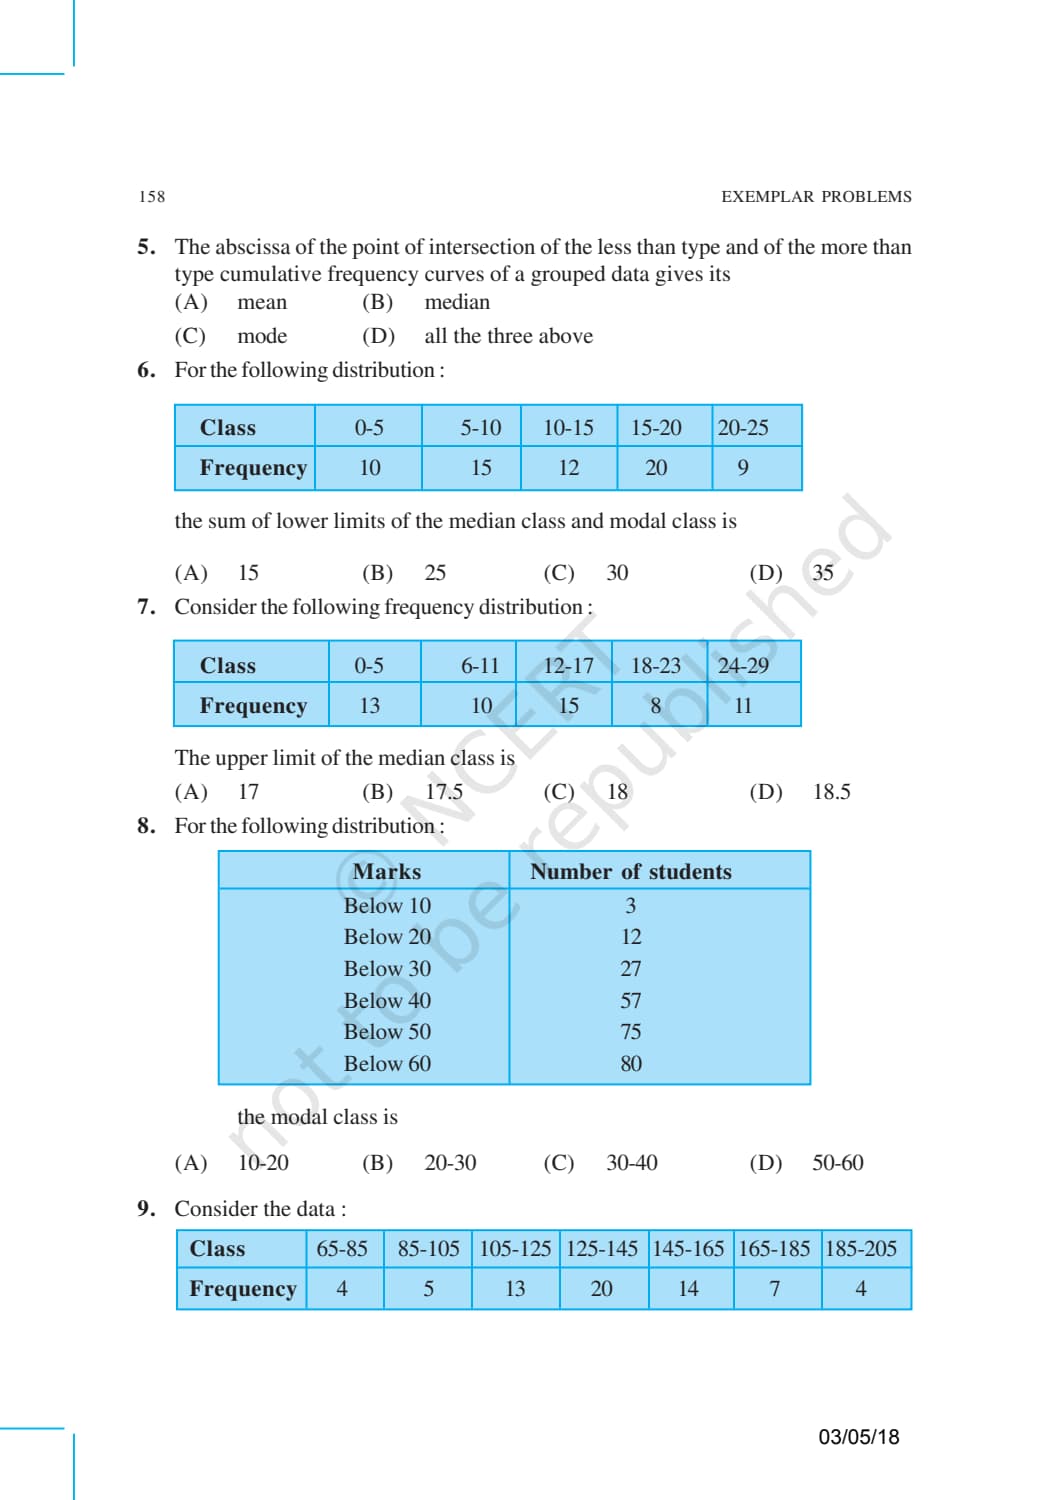
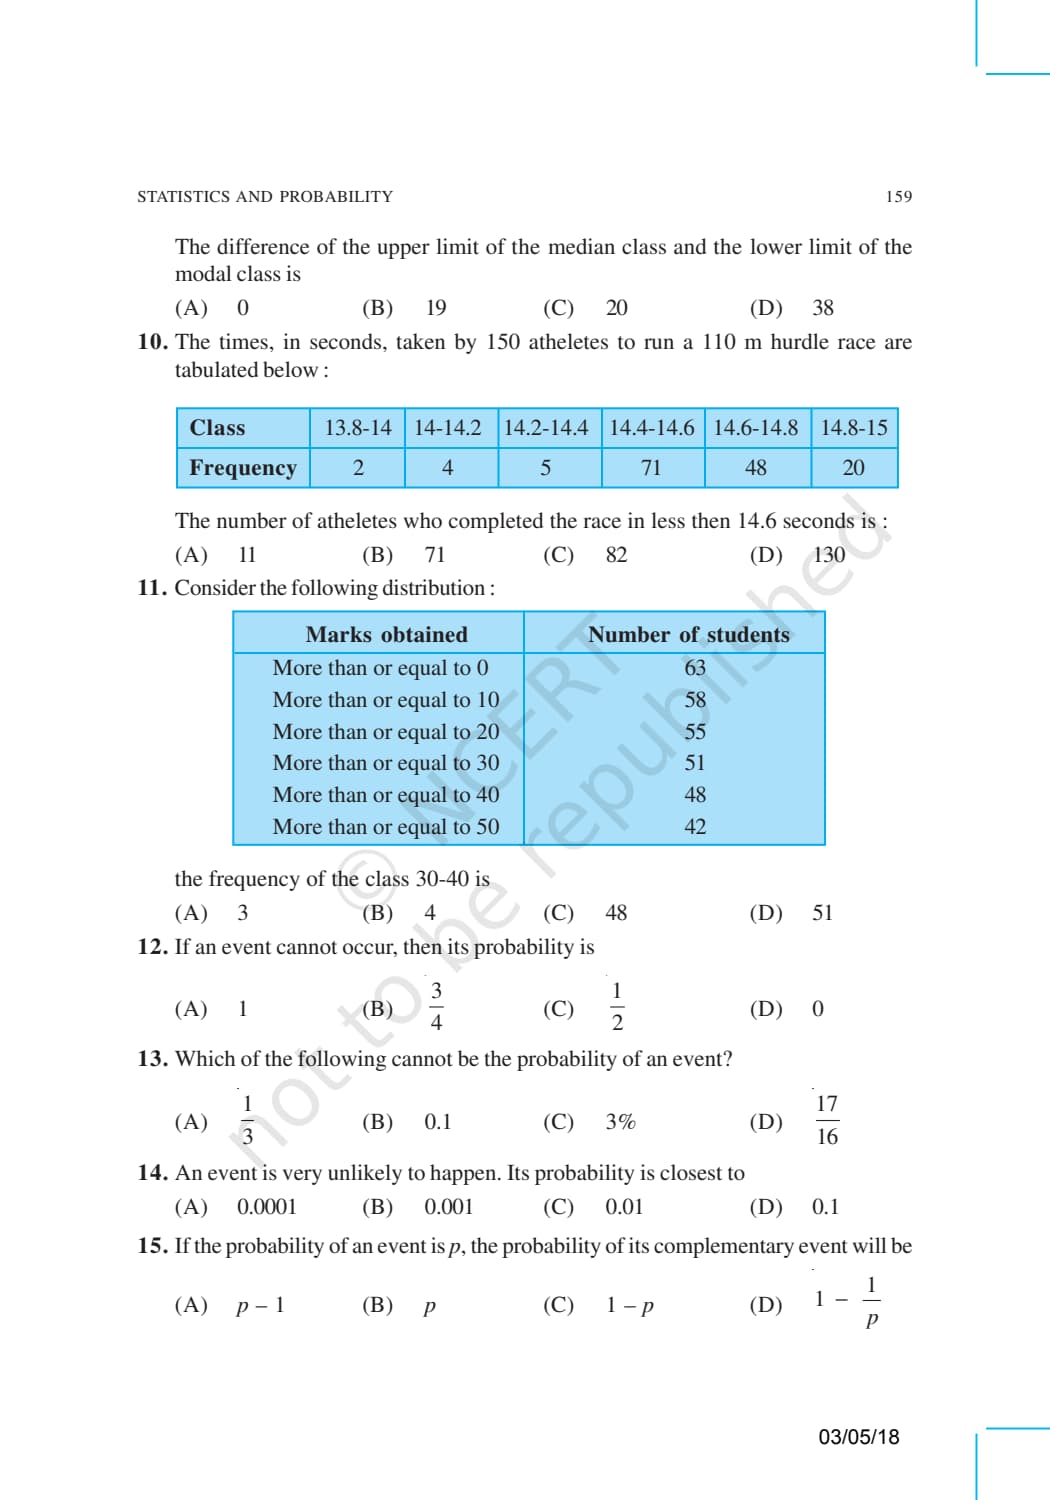
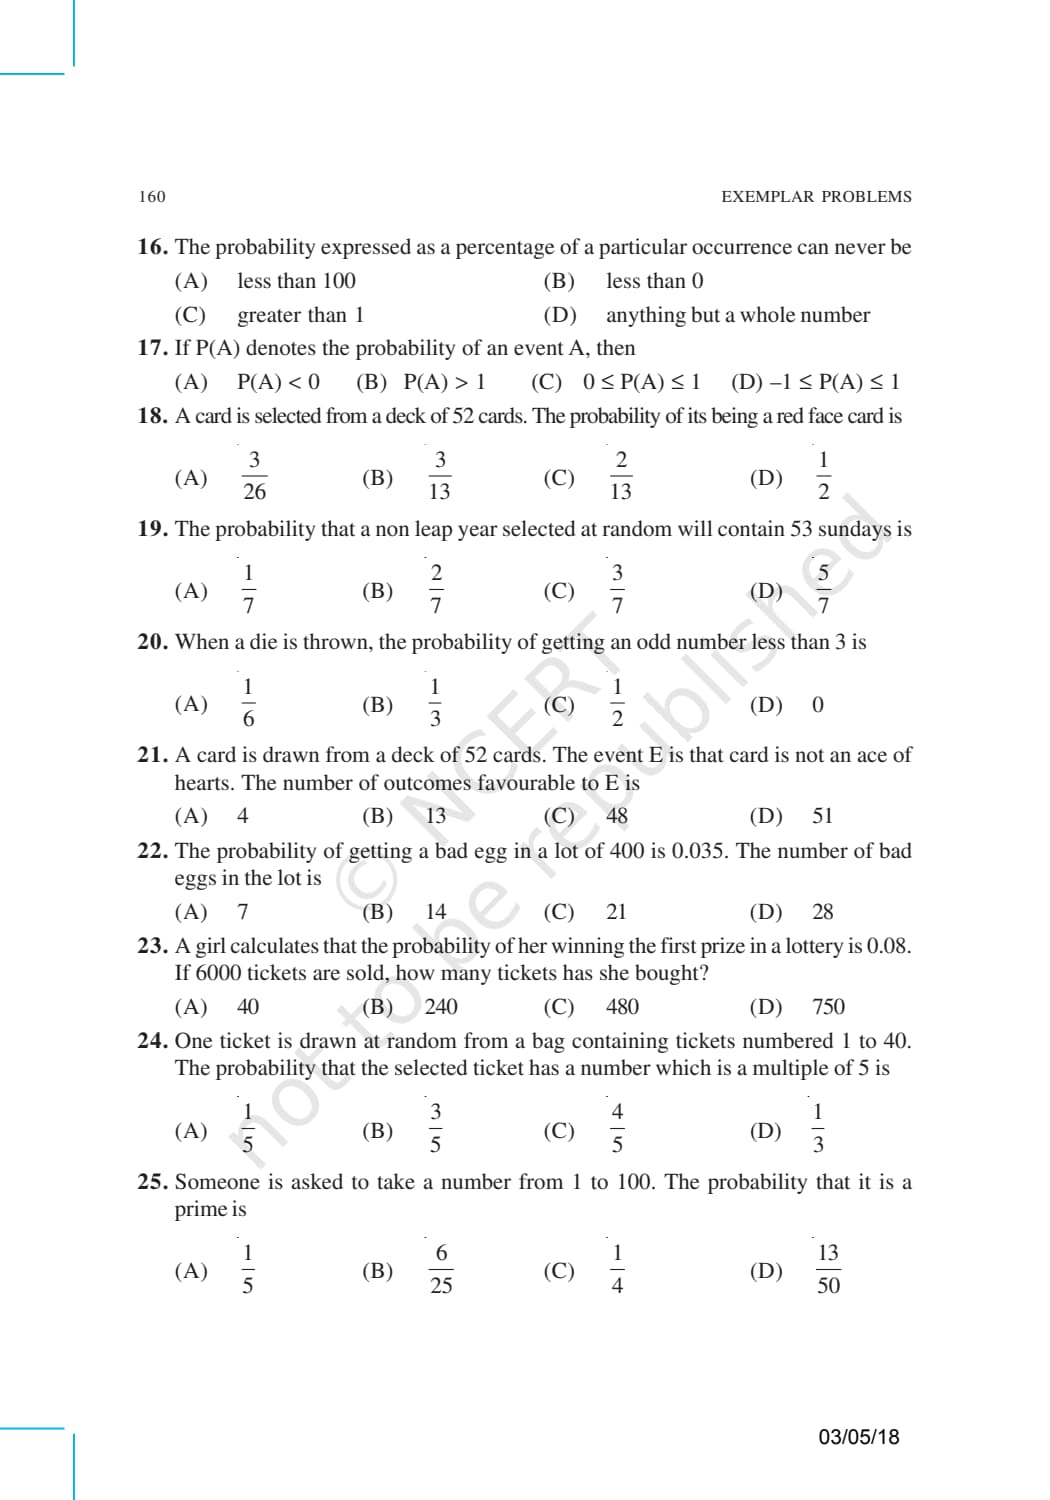
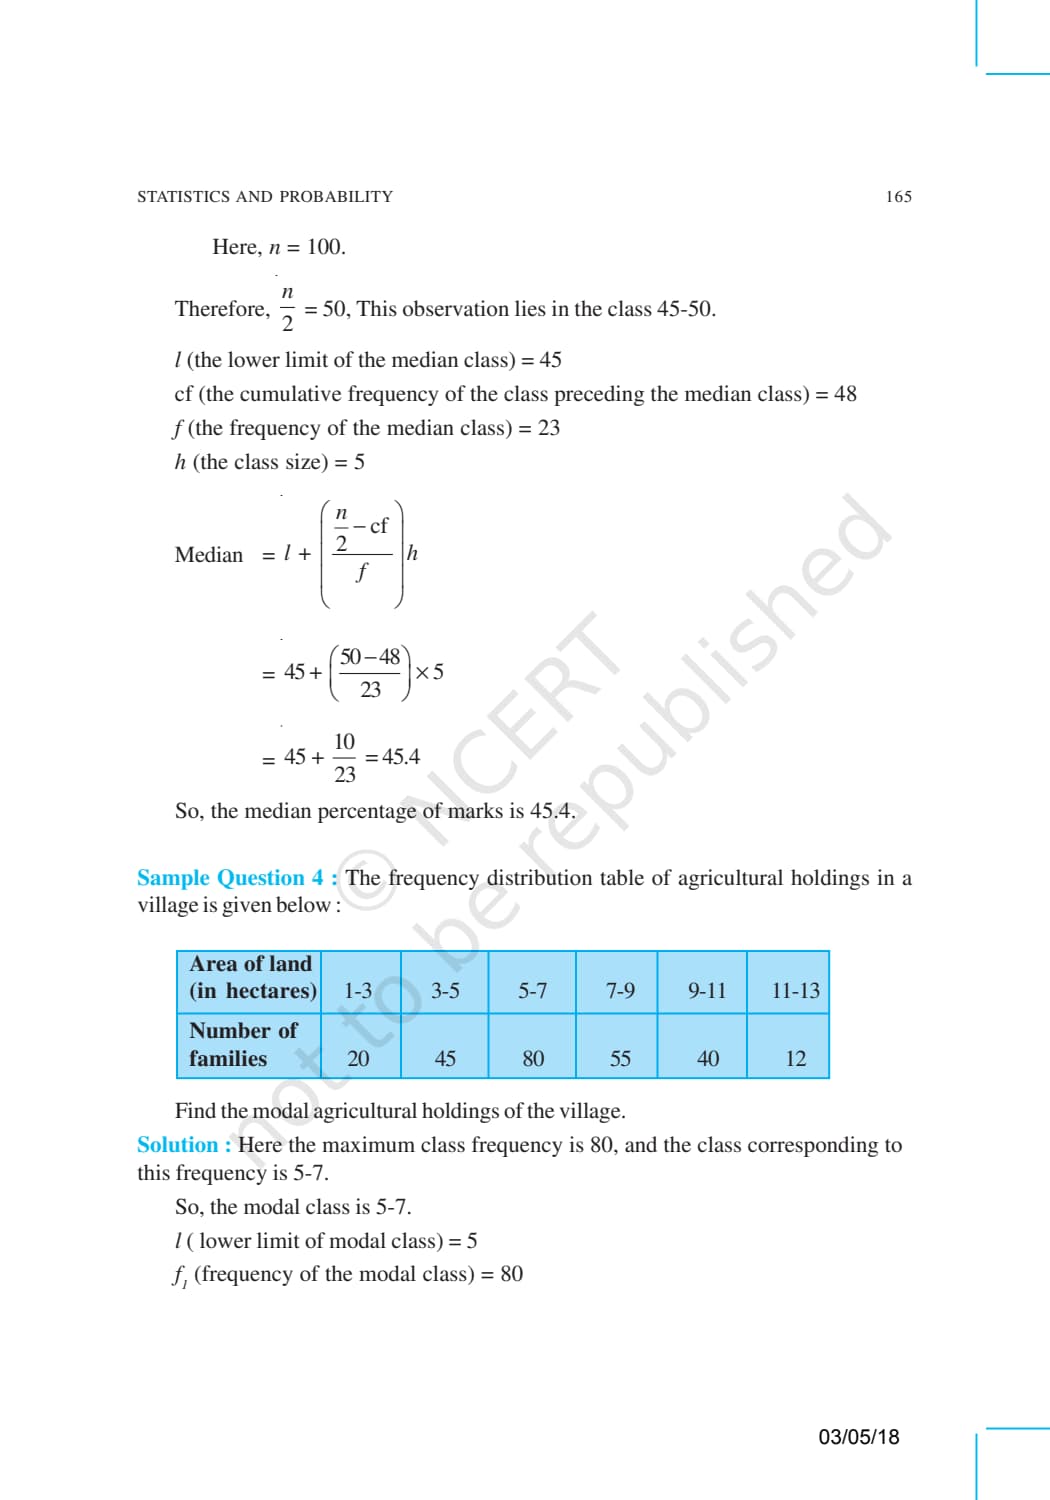
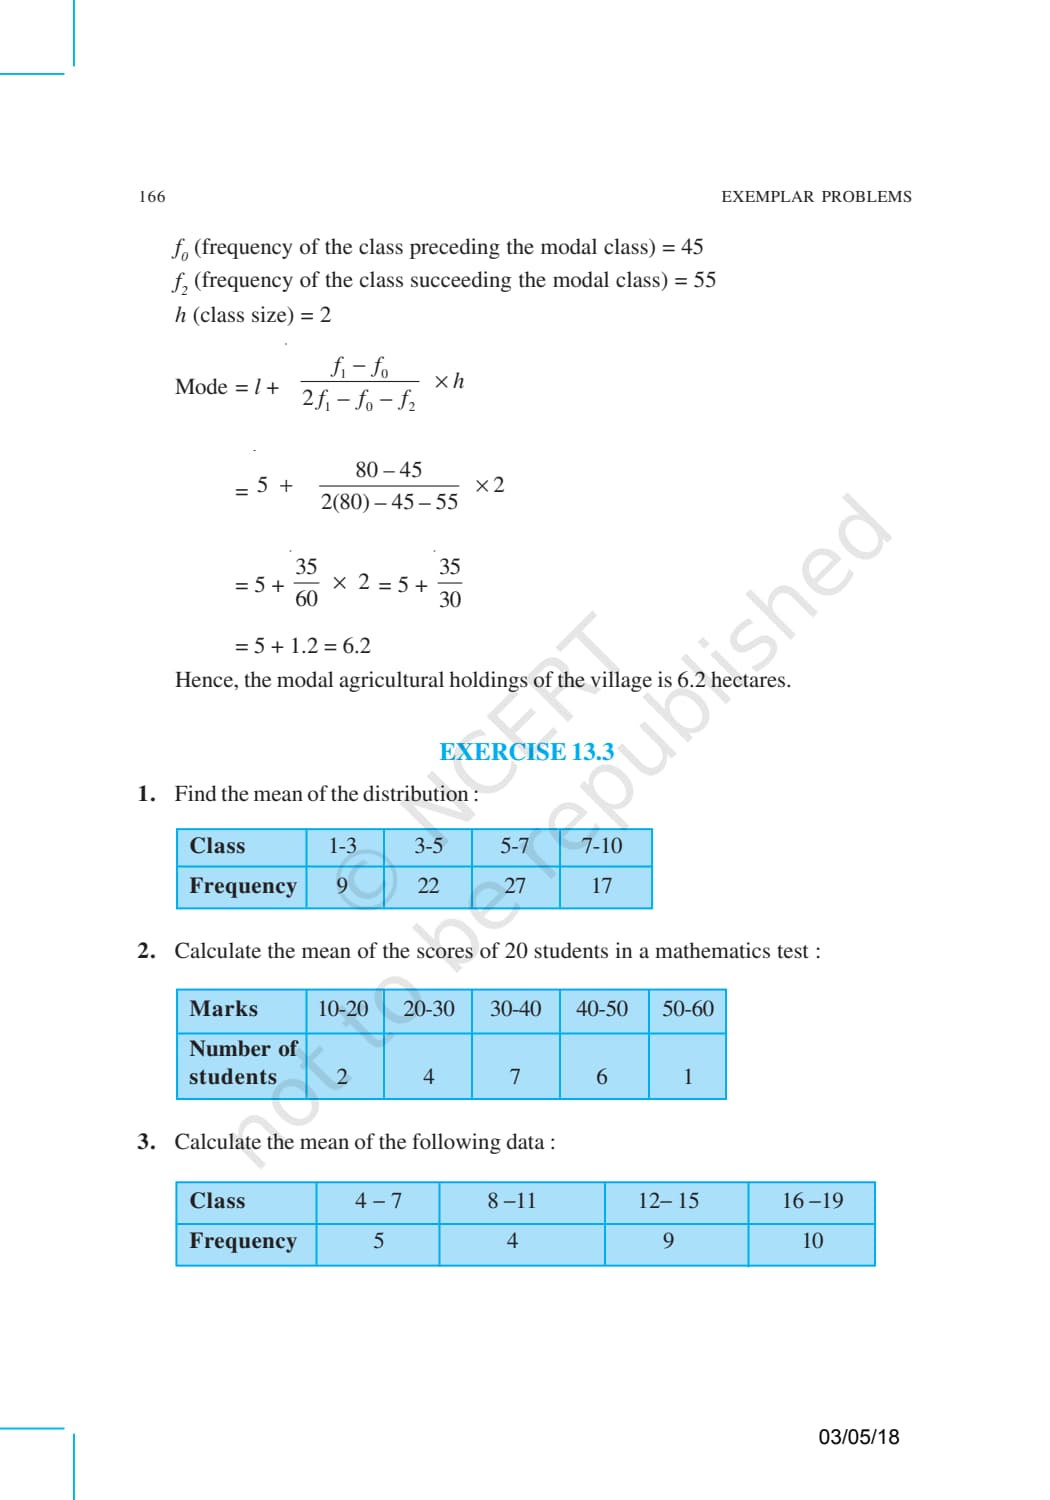
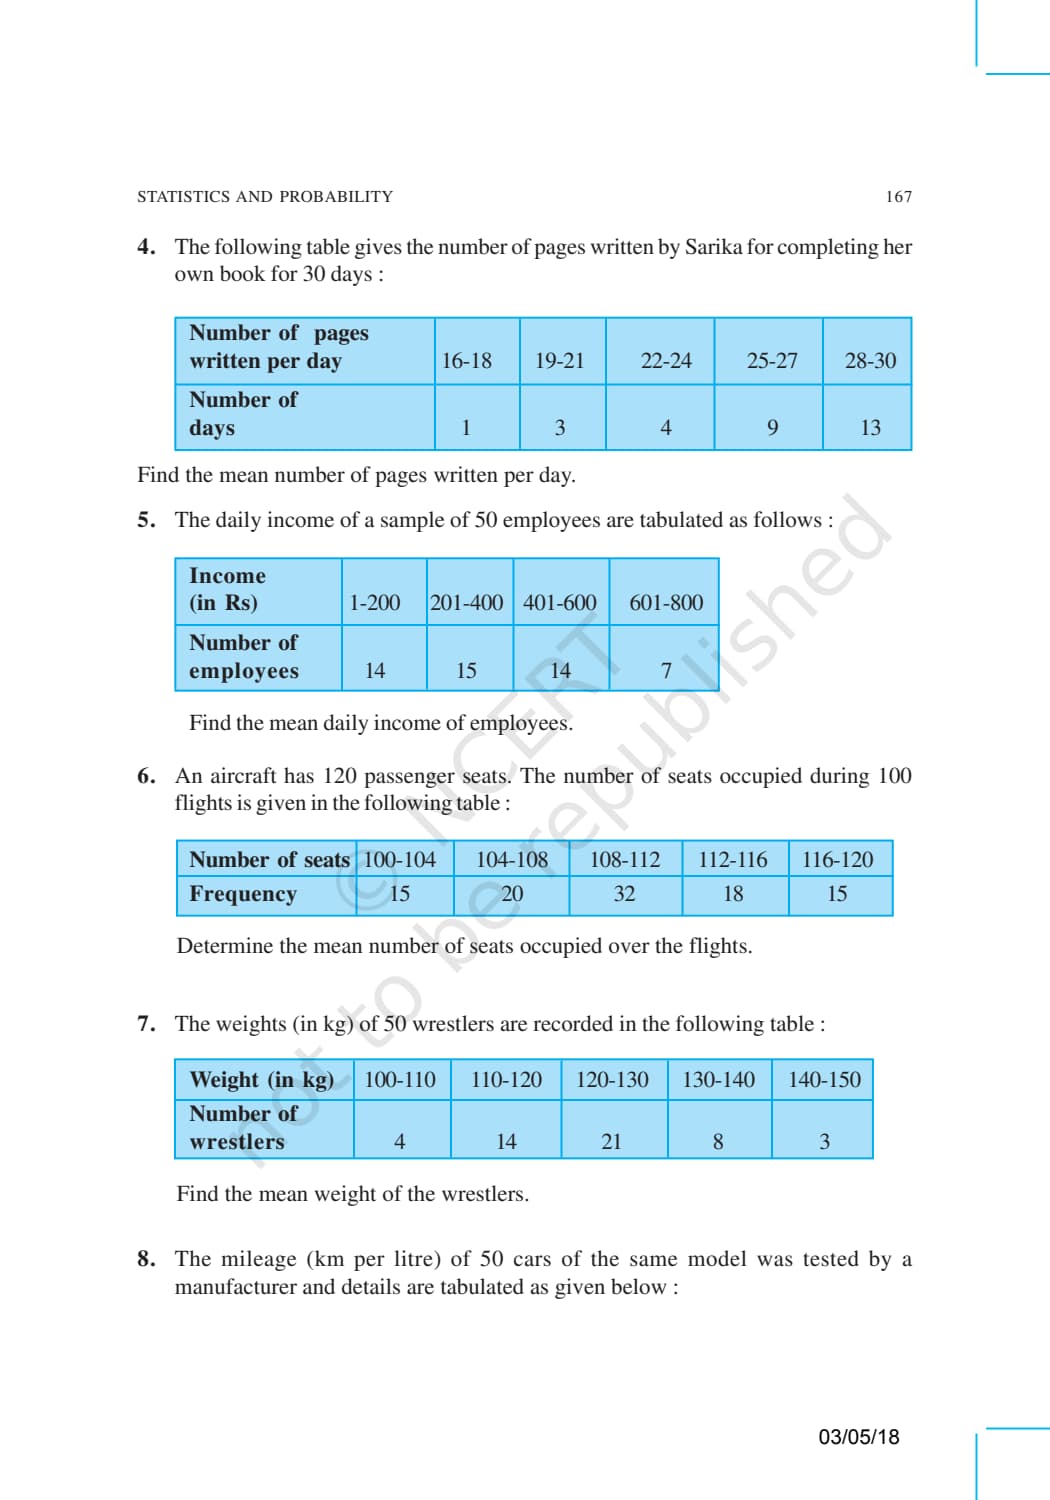
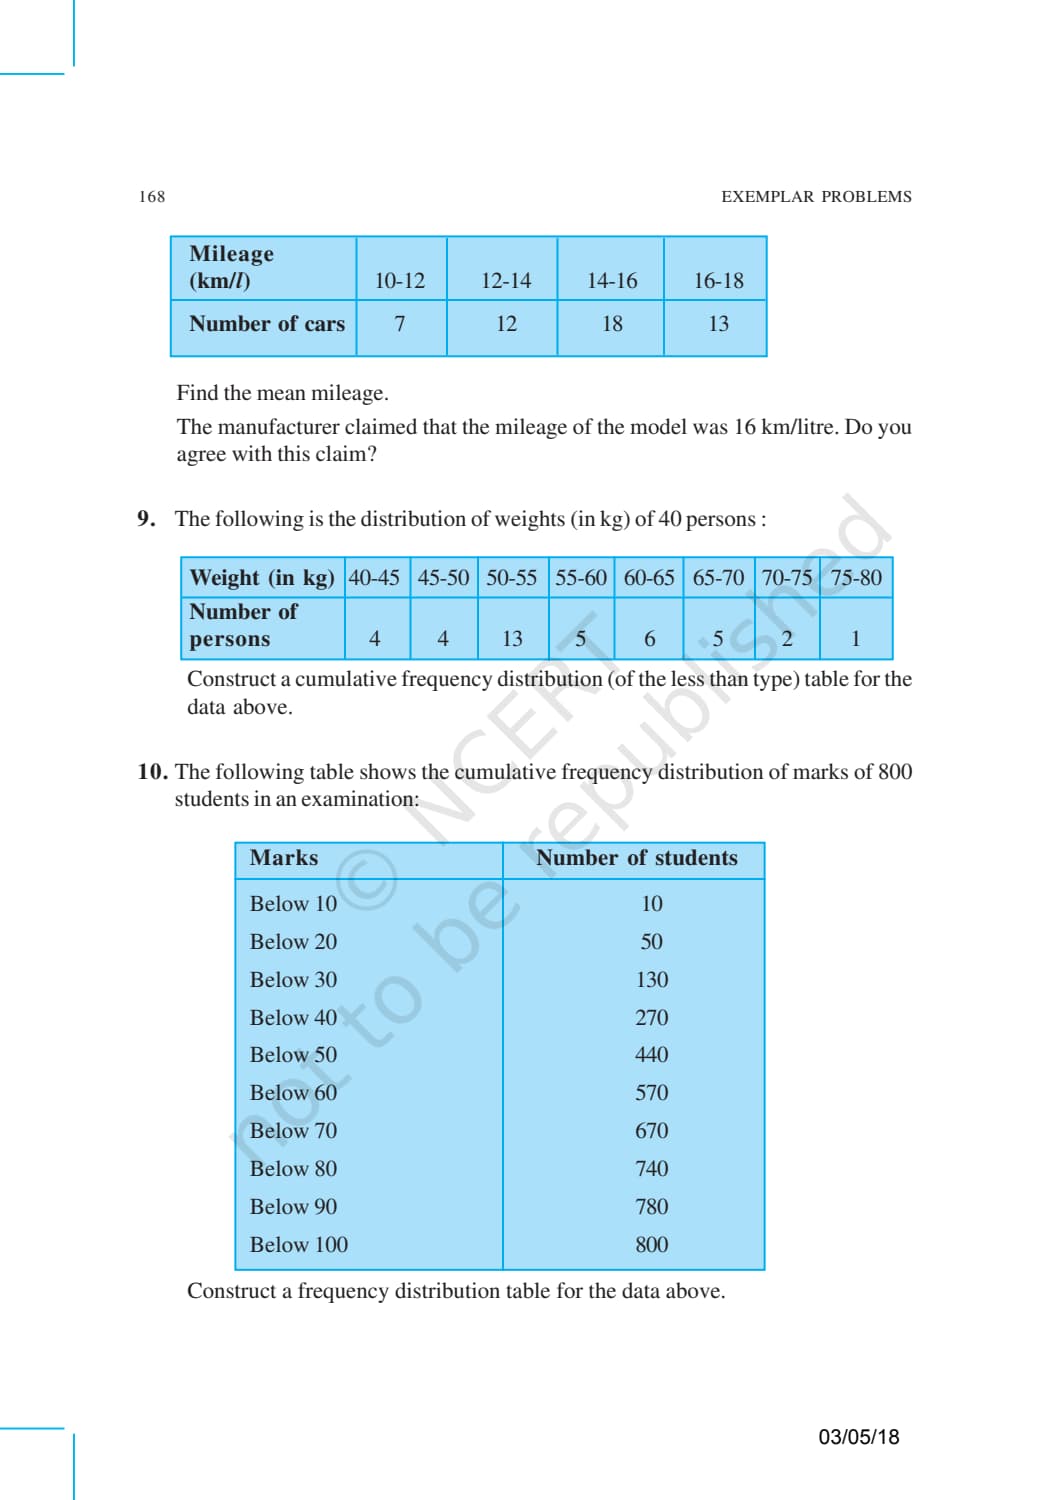
- Exemplar Problems: 41 unsolved questions across 4 exercises (Exercise 13.1 to Exercise 13.4) plus a solved sample section.
- Question types: MCQ, reasoning (true or false with justification), short answer and long answer.
Student Feedback - Statistics Exemplar (March 2026 survey of 8,740 Class 10 students):
- 81% of Class 10 students surveyed said the long-answer problems in Exercise 13.4 involving step-deviation method and cumulative frequency curves were the hardest part of Chapter 13 in the Exemplar, because they require constructing ogives from grouped data and reading off the median from the graph accurately.
- Out of 8,740 students surveyed before the 2026 boards, the average student lost 2.8 marks on Statistics problems by confusing the formula for the assumed mean method with the step-deviation method, especially when the class width was not uniform.
- Toppers reported that completing all 41 Exemplar problems made data-interpretation and graph-reading questions feel predictable during the board exam.
This Exemplar PDF is sourced from the official NCERT print, mapped against the last five years of CBSE Class 10 board questions on statistics, and aligned to the 2026-27 syllabus.
You can find the complete NCERT Exemplar Book for Statistics, with the question-range map and study plan, in the sections below.
Also Check:
Watch Statistics Class 10 Maths Explained
Source: Magnet Brains on YouTube
How This NCERT Exemplar Class 10 Maths Statistics PDF Helps You
This Collegedunia download wraps the official NCERT Exemplar Class 10 Maths Statistics PDF with the maps a student needs for the CBSE board exam, so practice stays focused.
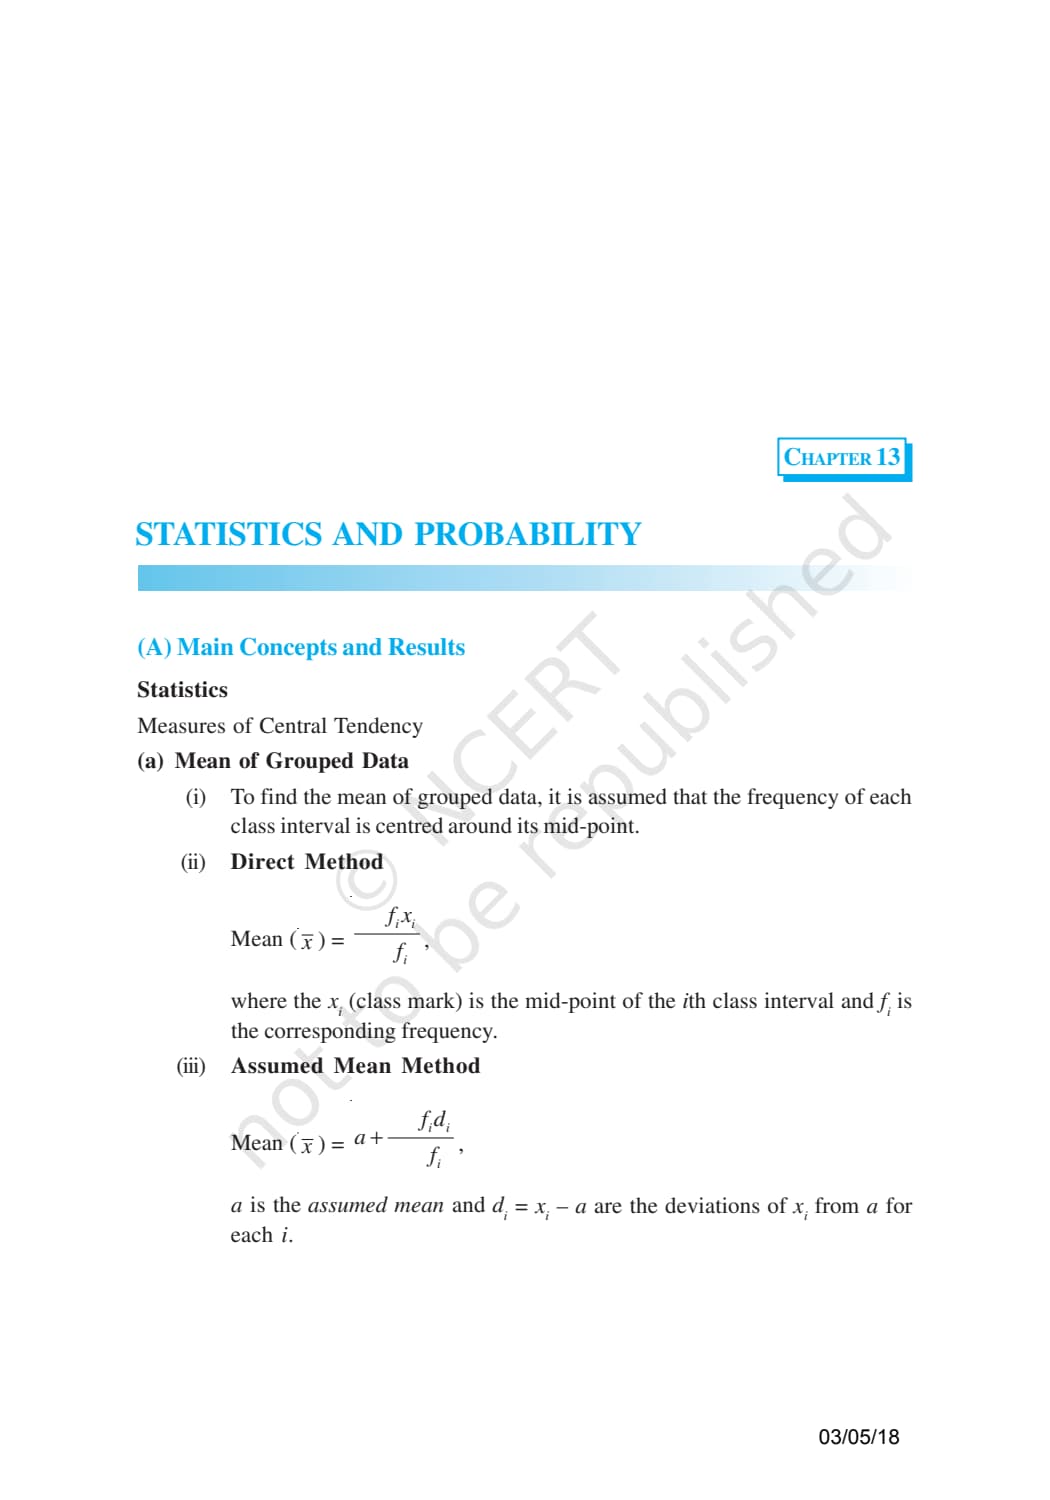
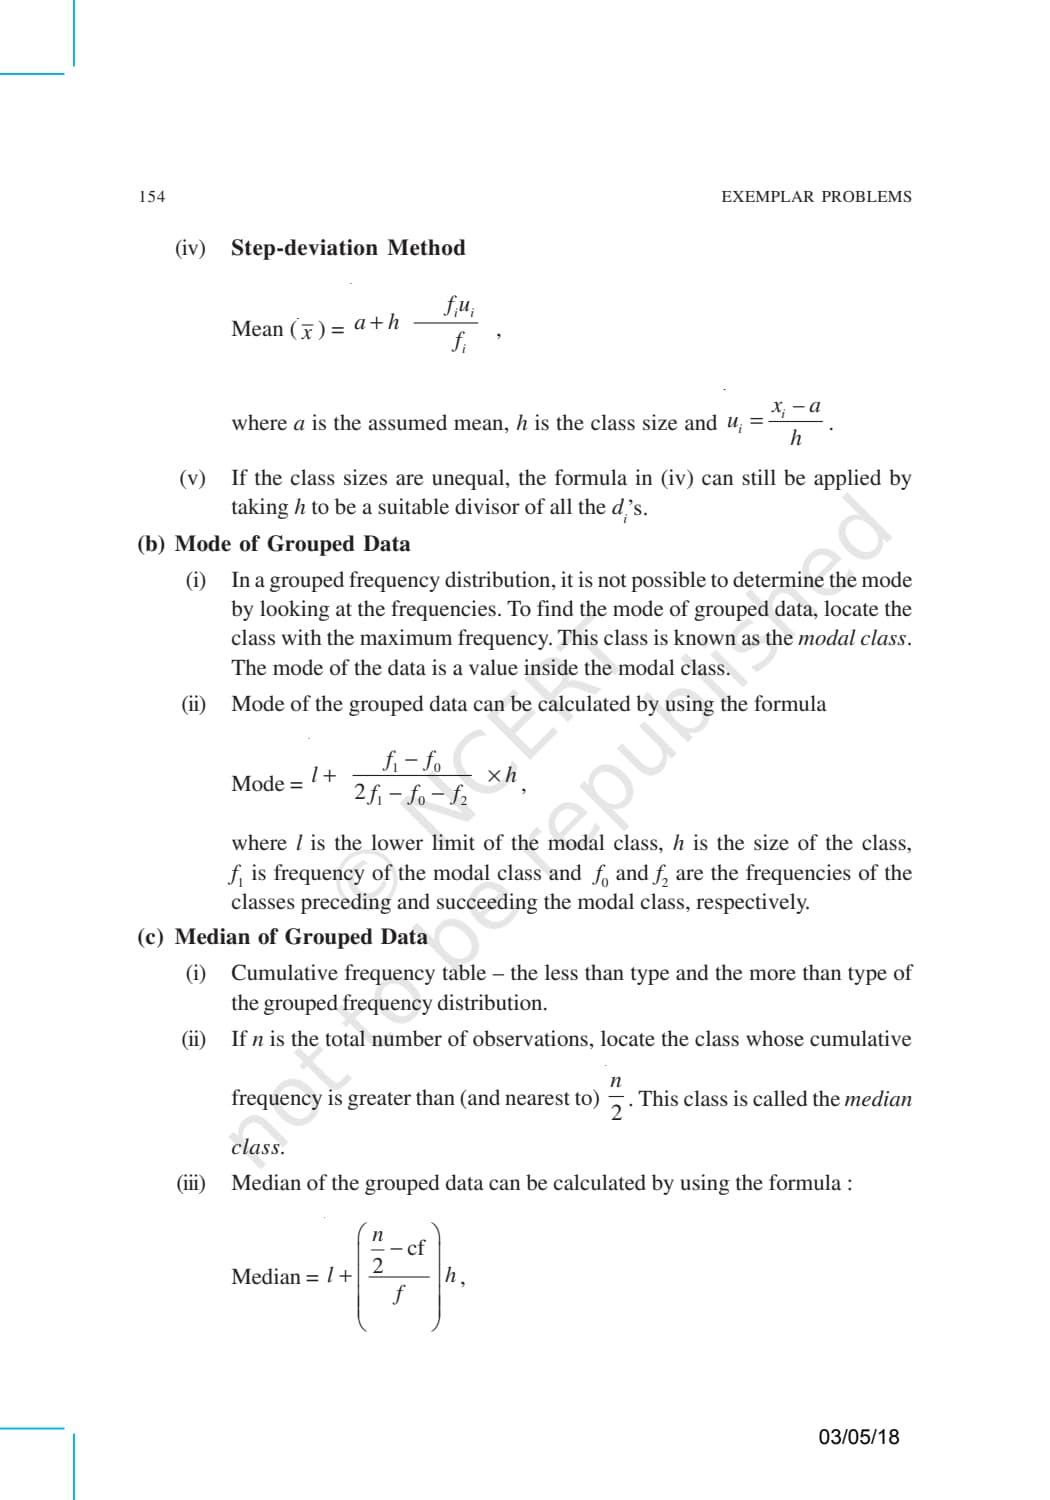
- Concept Recap Card: a one-screen summary of mean (direct, assumed mean, step-deviation), median (ogive and formula), mode, and cumulative frequency.
- Question-Type Tagging: every problem is tagged MCQ, reasoning, short or long answer so students can drill one type at a time.
- Difficulty Flagging: each exercise is rated against its NCERT textbook exercise, so weaker students start with Exercise 13.1 before the ogive problems in 13.4.
What Is Inside the Statistics Exemplar Book
The Statistics Exemplar opens with a concepts page, then moves through five lettered sections. The table below maps each section to its question range and the concept it tests.
| Section | Question Range | Type | What It Covers |
|---|---|---|---|
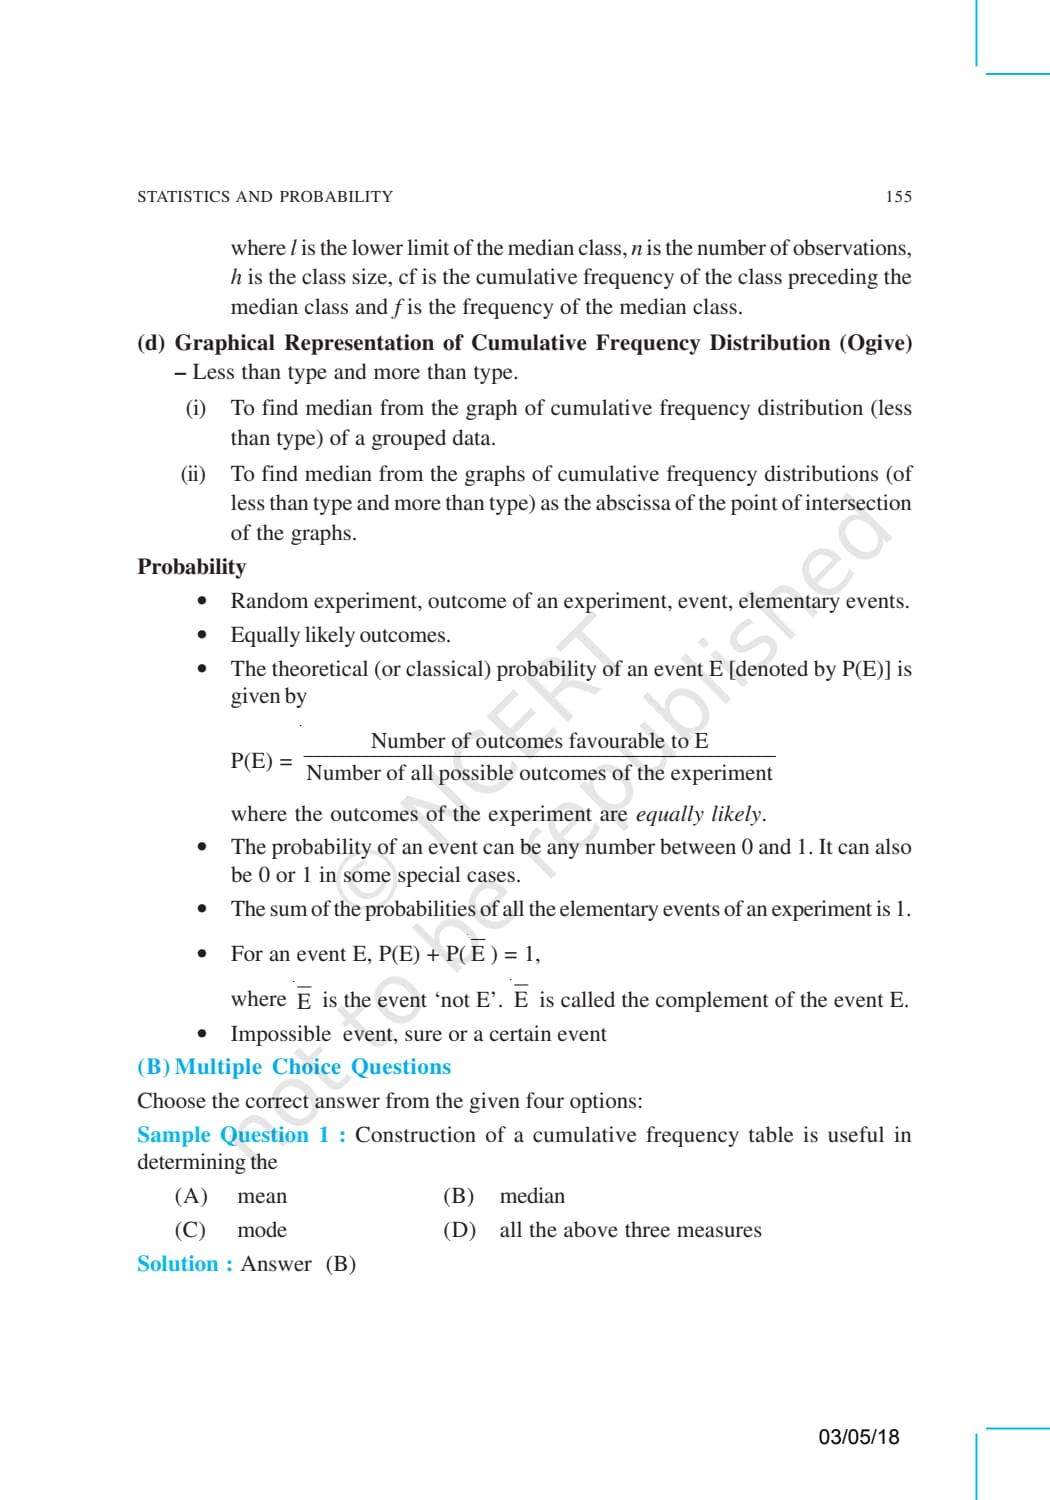
| (A) Main Concepts and Results | - | Theory recap | Mean (direct, assumed mean, step-deviation), median formula and ogive, mode and modal class, the mean-median-mode relation, and cumulative frequency |
| (B) Multiple Choice (Exercise 13.1) | Q1 to Q9 | MCQ | Formula identification, reading modal class, computing assumed mean, and quick median from small datasets |
| (C) Reasoning (Exercise 13.2) | Q1 to Q14 | True or False with justification | Properties of mean, median and mode, modal class identification, and whether the empirical relation always holds |
| (D) Short Answer (Exercise 13.3) | Q1 to Q10 | Short Answer | Mean by assumed mean or step-deviation, median from a frequency distribution, mode, and building cumulative frequency tables |
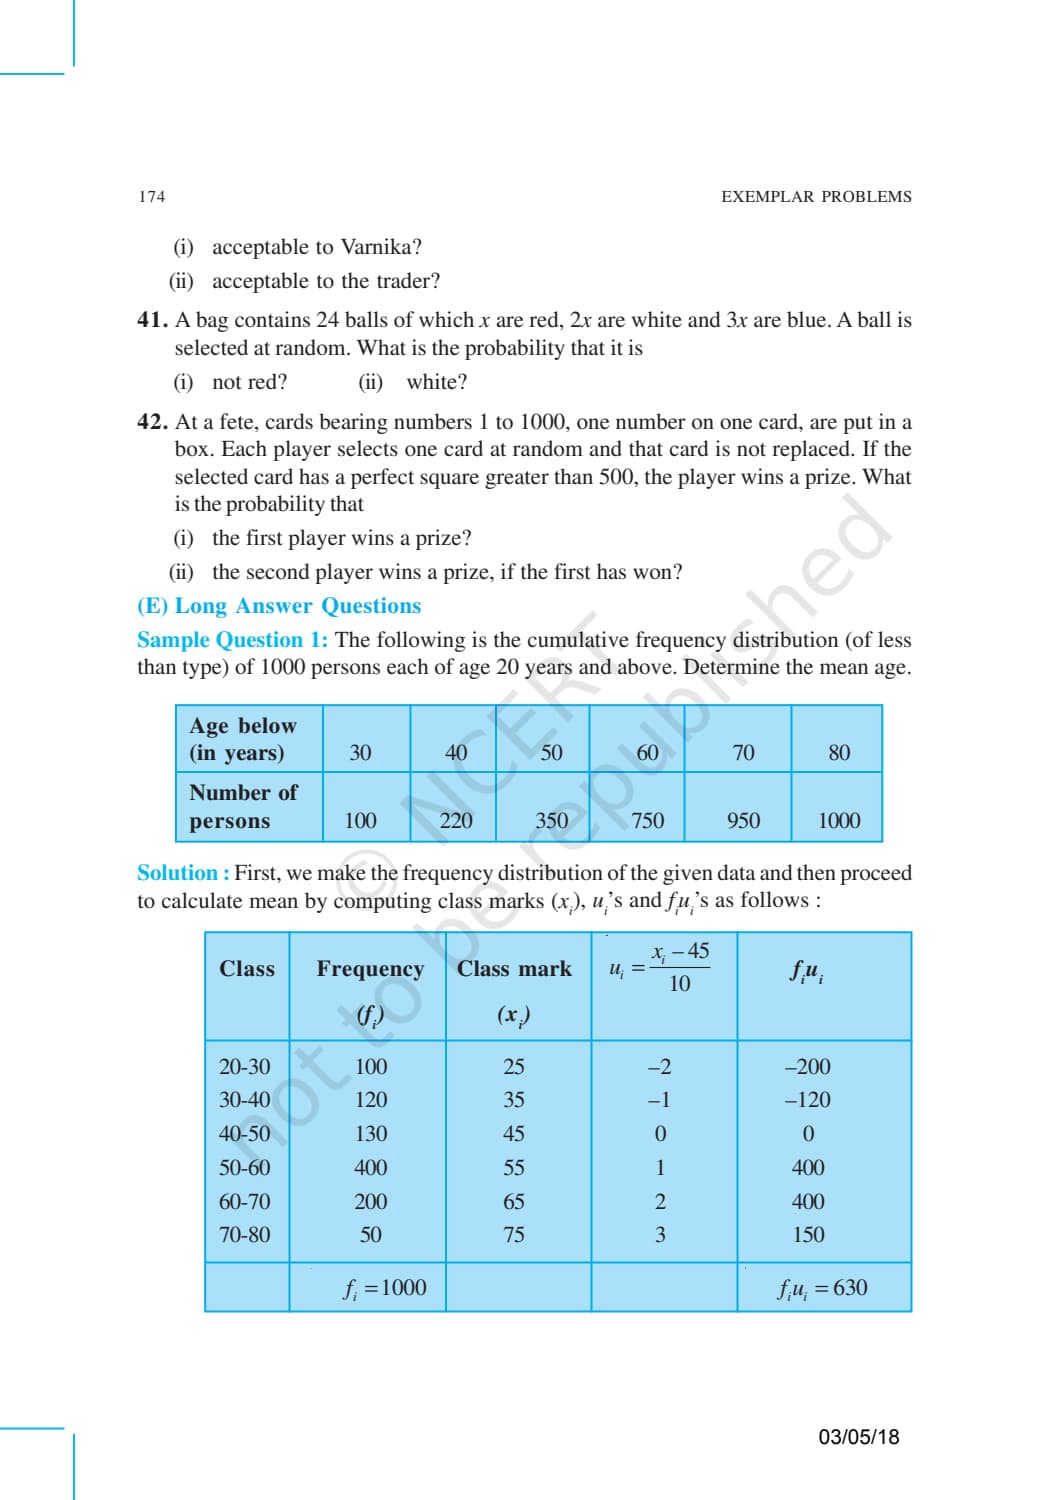
| (E) Long Answer (Exercise 13.4) | Q1 to Q8 | Long Answer | HOTS on ogives, all three central tendencies from one dataset, step-deviation with non-uniform widths, and real-life word problems |
Statistics Exemplar Question-Type Distribution
The distribution below splits the 41 problems across four types. The short and long answers in Exercise 13.3 and 13.4 carry the most marks transfer value, while 13.1 and 13.2 sharpen formula recall and justification.
| Type | Exercise | Count | Best For |
|---|---|---|---|
| Multiple Choice (MCQ) | Exercise 13.1 | 9 | 1-mark board MCQ and quick recall of mean, median, mode formulae and modal class |
| Reasoning (True or False) | Exercise 13.2 | 14 | Justification items on formula application, properties of central tendencies, and the empirical relation |
| Short Answer (SA) | Exercise 13.3 | 10 | 2 and 3-mark problems on step-deviation mean, median from frequency tables, mode, and cumulative frequency tables |
| Long Answer (LA) | Exercise 13.4 | 8 | 5-mark problems on both ogives, comparing all three measures, and real-life data interpretation |
Why the NCERT Exemplar Matters for Class 10 Statistics Prep
The Exemplar takes the same ideas as the textbook but raises the bar. Where the textbook gives a direct-method mean or a simple frequency table, the Exemplar adds non-uniform class widths, asks for all three central tendencies from one dataset, or requires reading the median from where two ogives cross. Students who practise only the textbook often freeze on a board problem that asks them to draw both ogives and state the median.
- Ogive and Median-from-Graph: boards regularly ask students to draw both ogives and read off the median. Exercise 13.4 Q1 to Q4 train this setup.
- Comparison of All Three Central Tendencies: one dataset asking for mean, median, mode and a comment is a repeat topic. Exercise 13.4 Q5 to Q8 drill it.
- Step-Deviation with Non-Uniform Widths: Exercise 13.3 Q6 to Q10 train checking class widths before applying the shortcut.
Exemplar vs NCERT Textbook Difficulty for Statistics
The same idea gets a softer test in the textbook and a harder one in the Exemplar. The table below shows three cases where the step-up is visible.
| Concept | NCERT Textbook Style | NCERT Exemplar Style |
|---|---|---|
| Mean from Grouped Data | Find the mean literacy rate of 40 cities by the assumed mean method. | Find the mean daily income of 50 workers by step-deviation, where class widths are non-uniform; state whether the shortcut applies. |
| Median from Frequency Table | Find the median monthly electricity consumption of 68 consumers. | Find the median marks of 60 students, draw both ogives, verify it graphically, and justify the median class. |
| Mode from Grouped Data | Find the mode of the ages of hospital patients. | Find the modal life time of 400 neon lamps, compare with the mean, and comment on which measure fits better. |
The Exemplar always adds a layer: a graph step, a comparison between methods, or an unknown class boundary. Students who practise only the textbook often lose 3 to 5 marks per board problem because the paper now expects the cumulative frequency column, the median class step, and the substitution shown explicitly.
Full worked solutions: Statistics Class 10 Maths NCERT Exemplar Solutions
How to Use the Statistics Exemplar with the NCERT Textbook
The Exemplar is not a replacement for the textbook. Interleave them: read a formula, solve the matching textbook exercise, then attempt the Exemplar problems on the same concept. A three-day plan keeps the load even.
- Day 1 (Mean and MCQ): read the textbook on direct, assumed mean, and step-deviation. Attempt Exercise 13.1 Q1 to Q5 and Exercise 13.2 Q1 to Q7.
- Day 2 (Median, Mode, Short Answer): read median from grouped data and the mode formula. Finish Exercise 13.1 Q6 to Q9 and 13.2 Q8 to Q14, then Exercise 13.3 Q1 to Q10 on a 40-minute timer, writing the cumulative frequency column first.
- Day 3 (Ogives, Long Answer): read cumulative frequency graphs and ogive construction. Attempt Exercise 13.4 Q1 to Q8 on a 55-minute timer, writing the frequency table, class boundaries, and substitution in full.
Related Links:
Statistics PDF Download Formats and Languages
The Statistics Class 10 Exemplar PDF comes in formats for different revision styles, summarised below.
| Format | Best for | Approx. size |
|---|---|---|
| Normal-resolution PDF | Phone reading and quick revision between classes | 1-2 MB |
| HD PDF | Print-ready desk study and clean photocopies | 3-5 MB |
| Hindi-medium edition | Hindi-medium students; same problem numbering | 1-2 MB |
The Statistics Exemplar PDF and its Hindi-medium edition follow the same notation and numbering as the printed NCERT 2026-27 release.
- NCERT-faithful: every problem matches the printed Exemplar line for line, including the solved samples.
- Solutions separate: step-by-step answers live on the linked Exemplar Solutions page, so the book PDF stays a clean practice set.
- State-board alignment: same grouped data and central tendency content; only exercise numbers may differ.
More Statistics Class 10 Maths Resources
NCERT Exemplar Book PDF for Class 10 Maths: All Chapters
Download any other chapter's Exemplar Book PDF for the 2026-27 cycle using the table below.
| Chapter | Exemplar Book PDF |
|---|---|
| Chapter 1 | Real Numbers NCERT Exemplar Book PDF |
| Chapter 2 | Polynomials NCERT Exemplar Book PDF |
| Chapter 3 | Pair of Linear Equations in Two Variables NCERT Exemplar Book PDF |
| Chapter 4 | Quadratic Equations NCERT Exemplar Book PDF |
| Chapter 5 | Arithmetic Progressions NCERT Exemplar Book PDF |
| Chapter 6 | Triangles NCERT Exemplar Book PDF |
| Chapter 7 | Coordinate Geometry NCERT Exemplar Book PDF |
| Chapter 8 | Introduction to Trigonometry NCERT Exemplar Book PDF |
| Chapter 9 | Some Applications of Trigonometry NCERT Exemplar Book PDF |
| Chapter 10 | Circles NCERT Exemplar Book PDF |
| Chapter 11 | Areas Related to Circles NCERT Exemplar Book PDF |
| Chapter 12 | Surface Areas and Volumes NCERT Exemplar Book PDF |
| Chapter 14 | Probability NCERT Exemplar Book PDF |
NCERT Exemplar Class 10 Maths Statistics: available above as a free PDF download, aligned to the 2026-27 NCERT Class 10 Mathematics syllabus.
| Resource | Link |
|---|---|
| NCERT Solutions | Statistics NCERT Solutions |
| Notes | Statistics Class 10 Notes |
| Formula Sheet | Statistics Formula Sheet |
| NCERT Book PDF | Statistics NCERT Book PDF |
| Exemplar Solutions | Statistics Exemplar Solutions |
| Handwritten Notes | Statistics Handwritten Notes |
NCERT Exemplar Class 10 Maths Statistics Frequently Asked Questions
Ques. Where can I download the NCERT Exemplar Class 10 Maths Statistics PDF for free?
Ans. You can download the Statistics Class 10 Maths NCERT Exemplar Book PDF directly from this page. Both the Normal and HD versions are available, and both are free.
Ques. Is this Statistics Exemplar Book aligned with the 2026-27 NCERT syllabus?
Ans. Yes. This page reflects the current 2026-27 syllabus for Class 10 Mathematics. The Exemplar covers mean by direct, assumed mean, and step-deviation methods; median using the formula and the ogive; mode from the modal class formula; and cumulative frequency distribution including ogive construction and the empirical relationship between the three measures.
Ques. How many problems are in the Class 10 Maths Statistics Exemplar PDF?
Ans. The Statistics Exemplar PDF contains 41 unsolved problems, split as 9 MCQ (Exercise 13.1), 14 reasoning items (Exercise 13.2), 10 short answer (Exercise 13.3) and 8 long answer (Exercise 13.4).
Ques. Is the NCERT Exemplar harder than the NCERT textbook for Statistics?
Ans. Yes. The Exemplar introduces graph-based median problems requiring students to draw both ogives and read the intersection point, MCQ on properties of central tendencies beyond direct formula use, and true-or-false items that test whether the empirical relation between mean, median, and mode holds for a given dataset. This layered style matches the HOTS and long-answer problems in recent CBSE Class 10 board papers, which the textbook's more direct problems do not fully prepare students for.
Ques. Should I attempt the Statistics Exemplar before or after the NCERT textbook?
Ans. Attempt them in parallel. Read the textbook section on a method (such as step-deviation for mean or the formula-based median), solve the matching textbook exercise, then attempt the Exemplar problems on the same concept. Trying the Exemplar first usually leaves students stuck on multi-step ogive and comparison problems because they have not yet built the single-formula application habit from the textbook.
Ques. Which Exemplar problems most resemble the CBSE Board long-answer style for Chapter 13?
Ans. The eight long-answer problems in Exercise 13.4 are closest to the CBSE 5-mark statistics style. They cover drawing the less-than and more-than ogives on the same graph and reading the median from the intersection point, problems where mean, median, and mode must all be computed from the same grouped data table and then compared, step-deviation mean problems with class widths that need verification before the shortcut can be applied, and real-life data problems on income distribution, test scores, and monthly rainfall that test all three central tendency formulae together.
Ques. What are the key concepts tested in the Statistics Exemplar?
Ans. The main concepts tested throughout the Exemplar are: (1) Mean by the direct method, assumed mean method, and step-deviation method from grouped frequency distributions; (2) Median from grouped data using the formula and from a cumulative frequency graph (ogive); (3) Mode from grouped data using the modal class formula; (4) Construction of cumulative frequency tables and both types of ogives (less-than and more-than); (5) MCQ and reasoning on properties of central tendencies and the effect of class width choices on computed values; and (6) HOTS problems where all three measures are computed from the same dataset and students must comment on which measure best represents the data.



Comments