




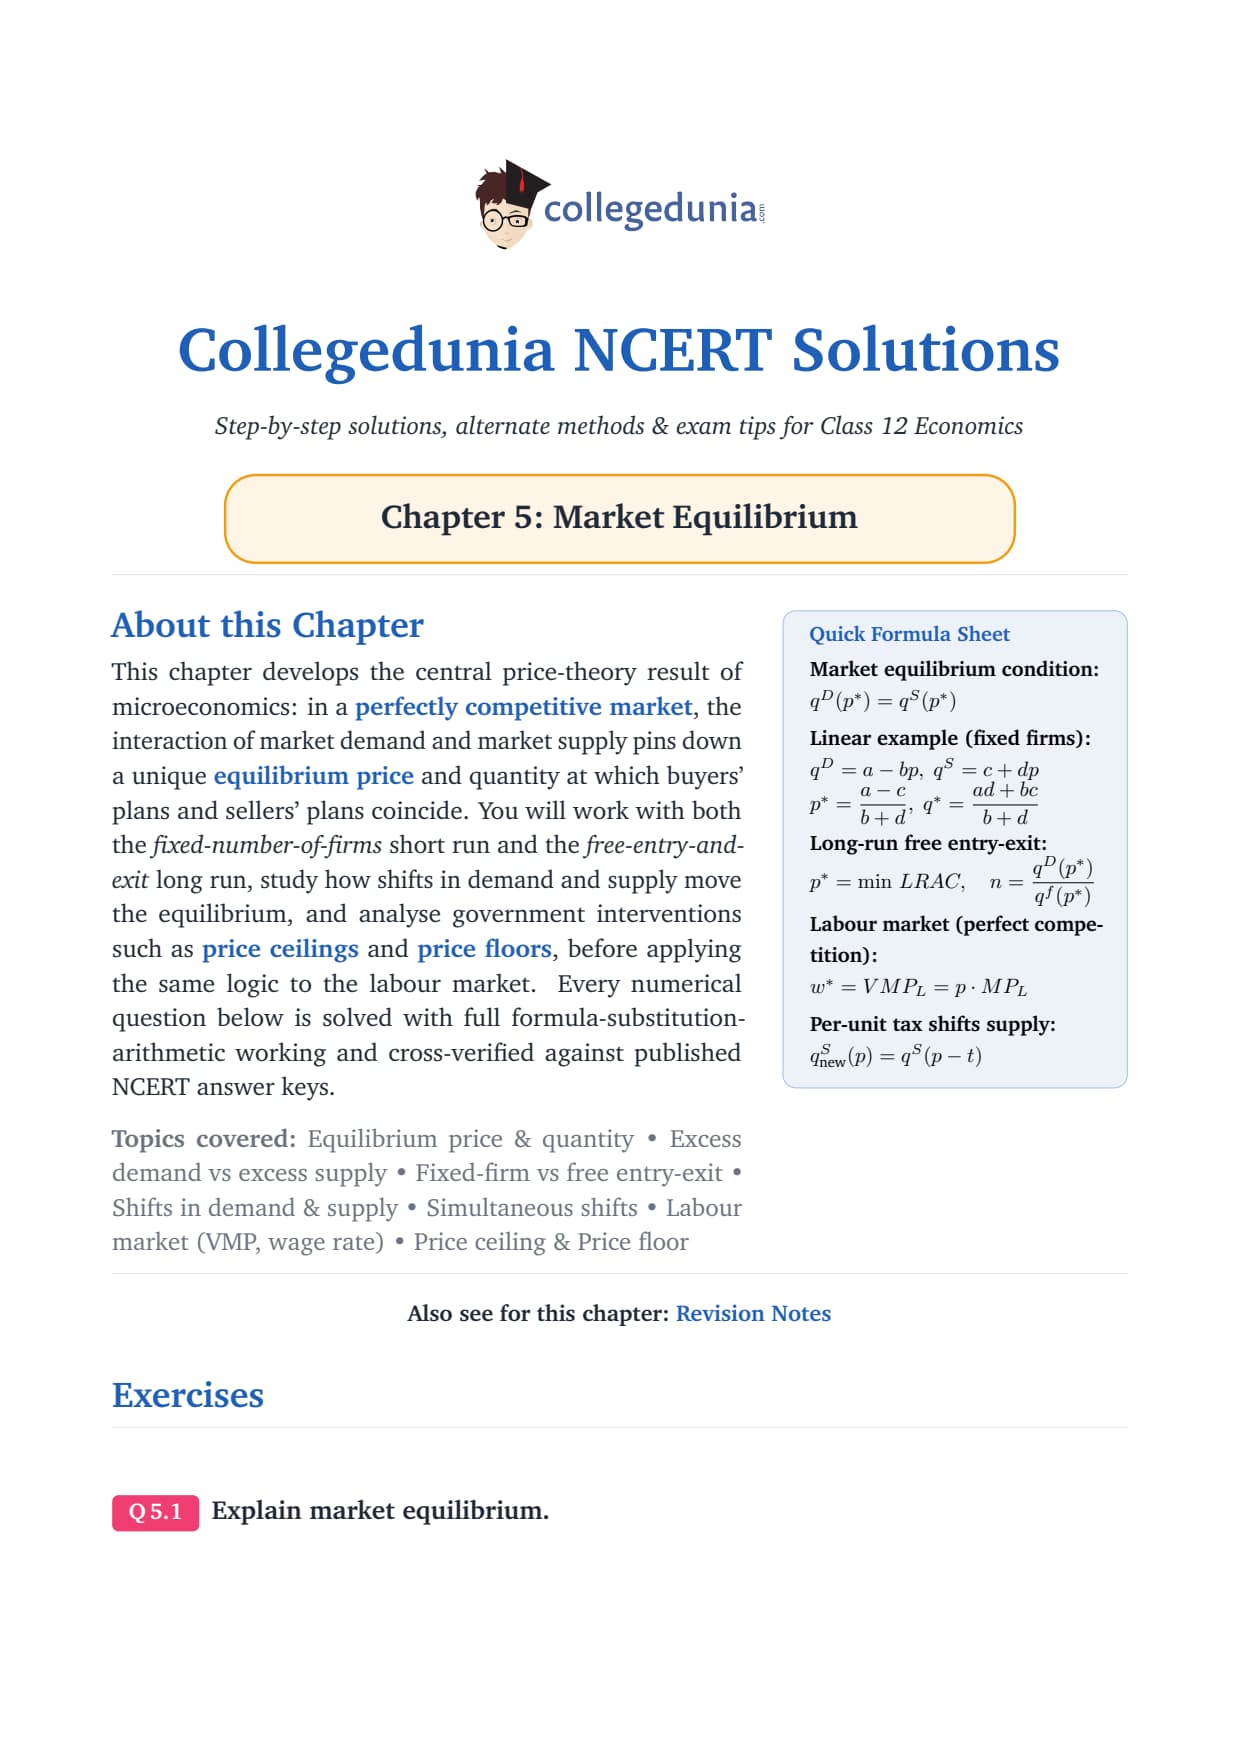
Market Equilibrium is Chapter 5 of CBSE Class 12 Introductory Microeconomics. It is where demand and supply meet to fix a single price and quantity. This page gives step-by-step NCERT Solutions for every exercise question, plus a free PDF to download.
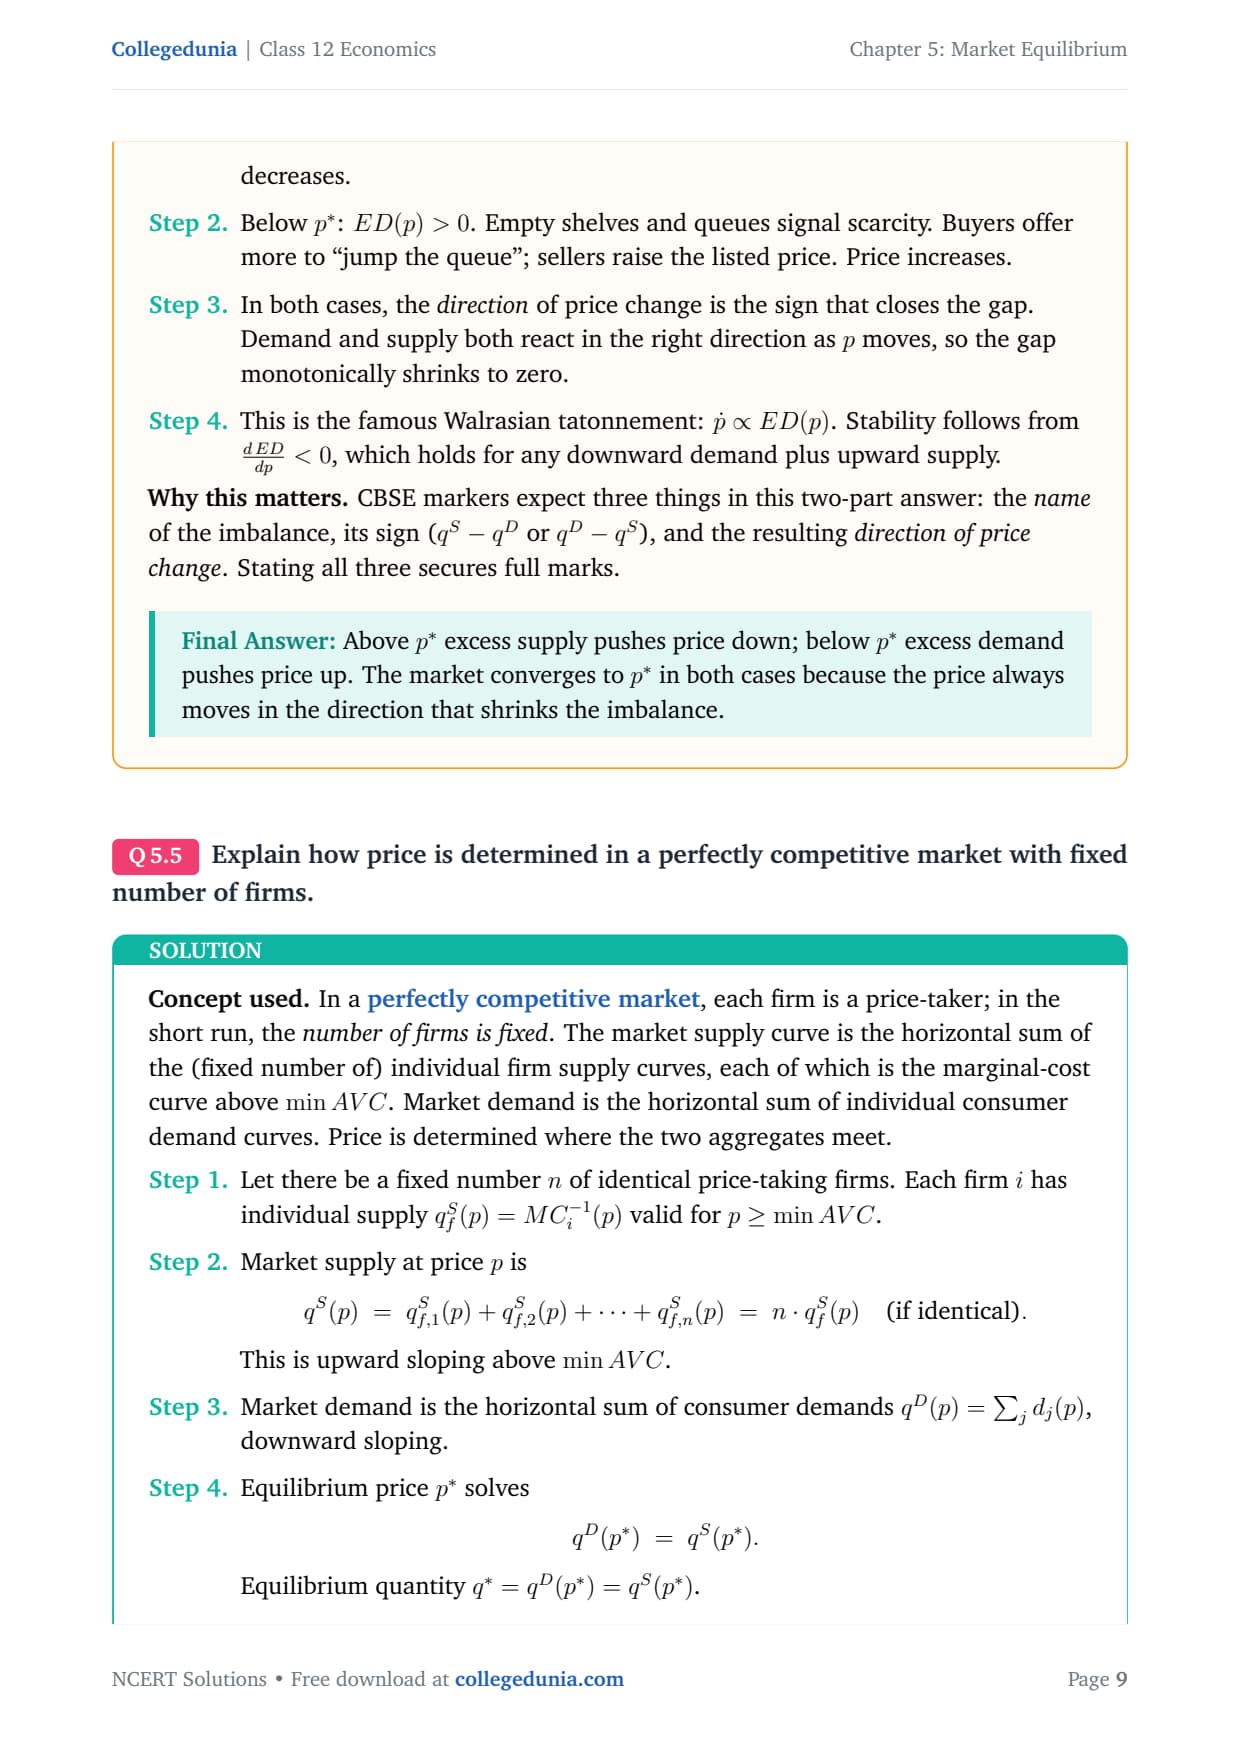
Here is what this chapter is worth in the exam:
- CBSE Boards: about 8 marks, with at least one 4 to 6 mark numerical.
- CUET: 3 to 4 questions every year on equilibrium, shifts and price controls.
- Revision time: about 3 to 4 hours, since the numericals need practice.

What the Class 12 Economics Chapter 5 Market Equilibrium Solutions Cover
These solutions answer one big question: how do demand and supply settle on a single market price and quantity? The chapter has seven small topics, and the solutions work each one in plain steps:
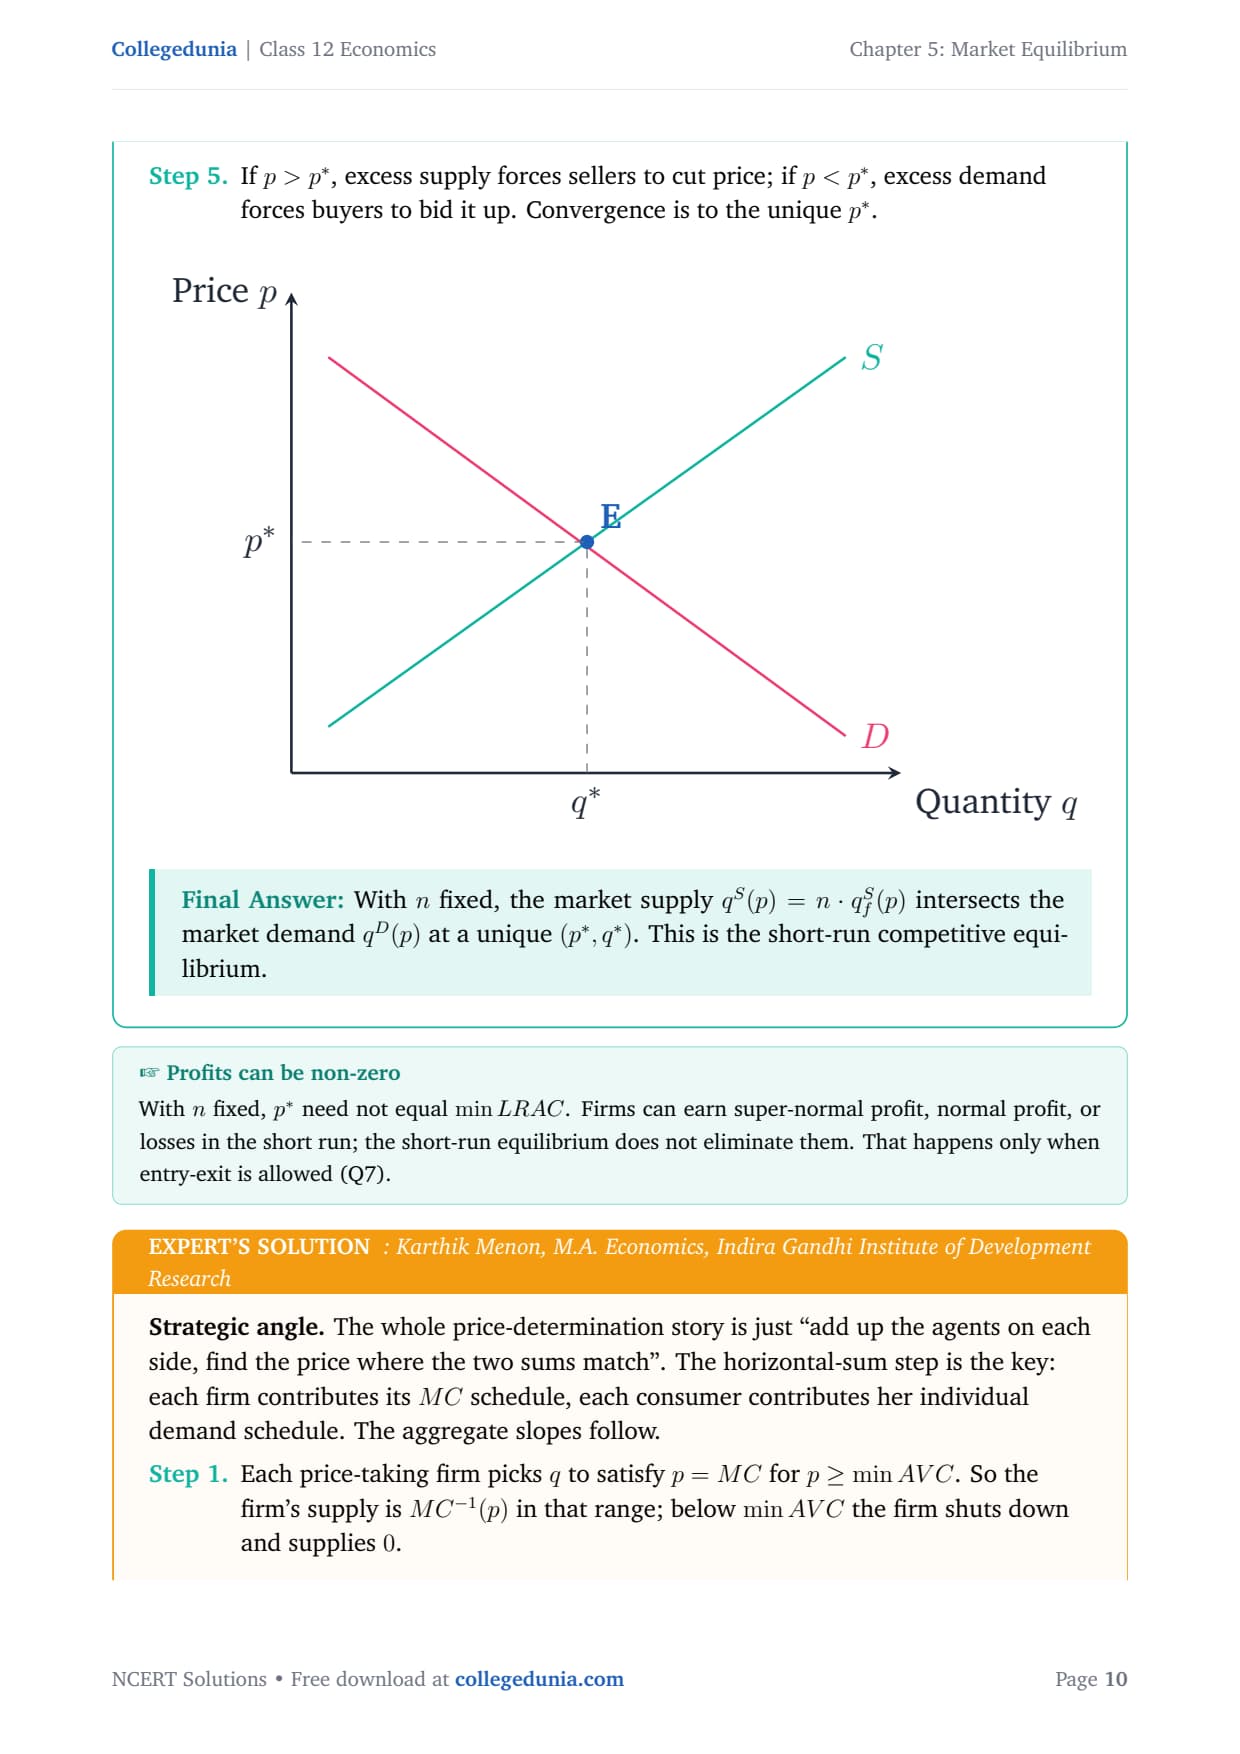
- Equilibrium with fixed firms: the condition qd = qs and how to solve the two equations.
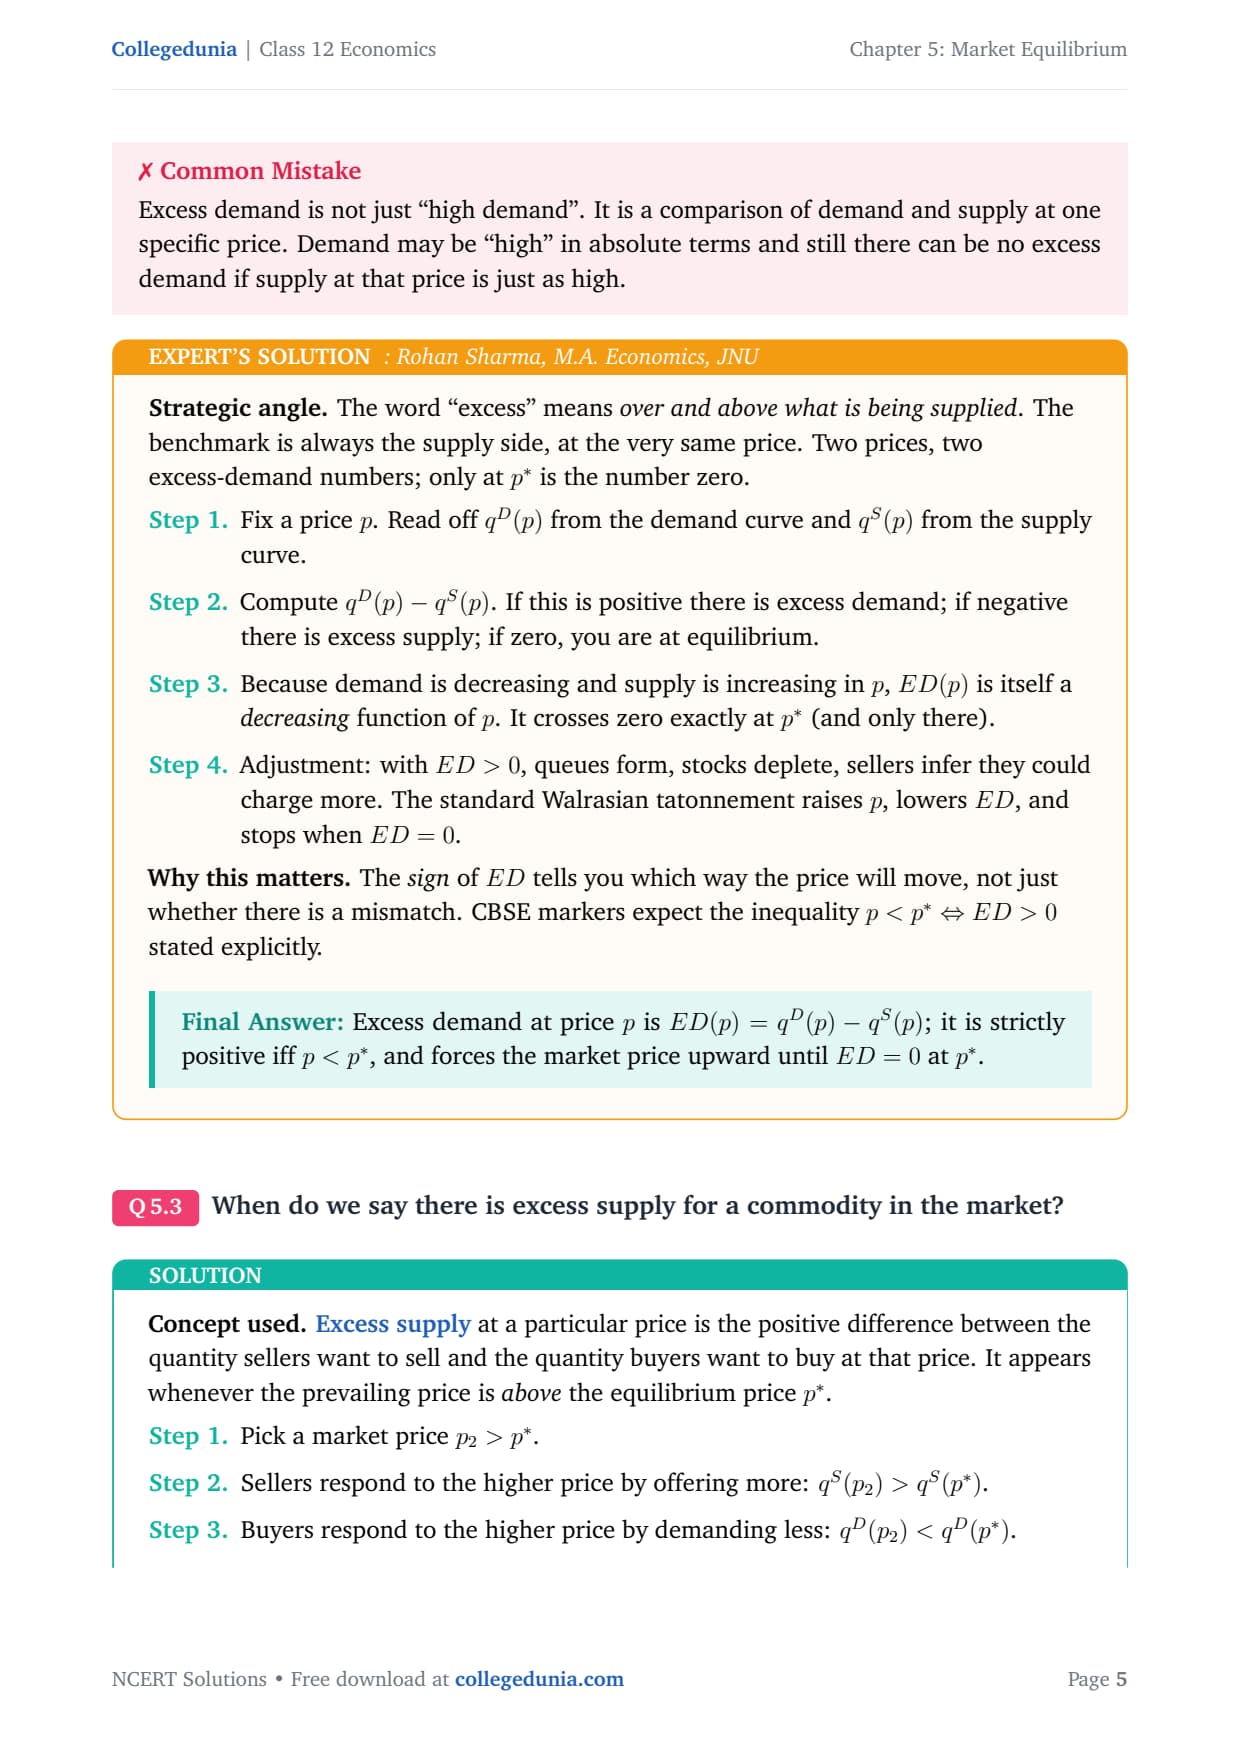
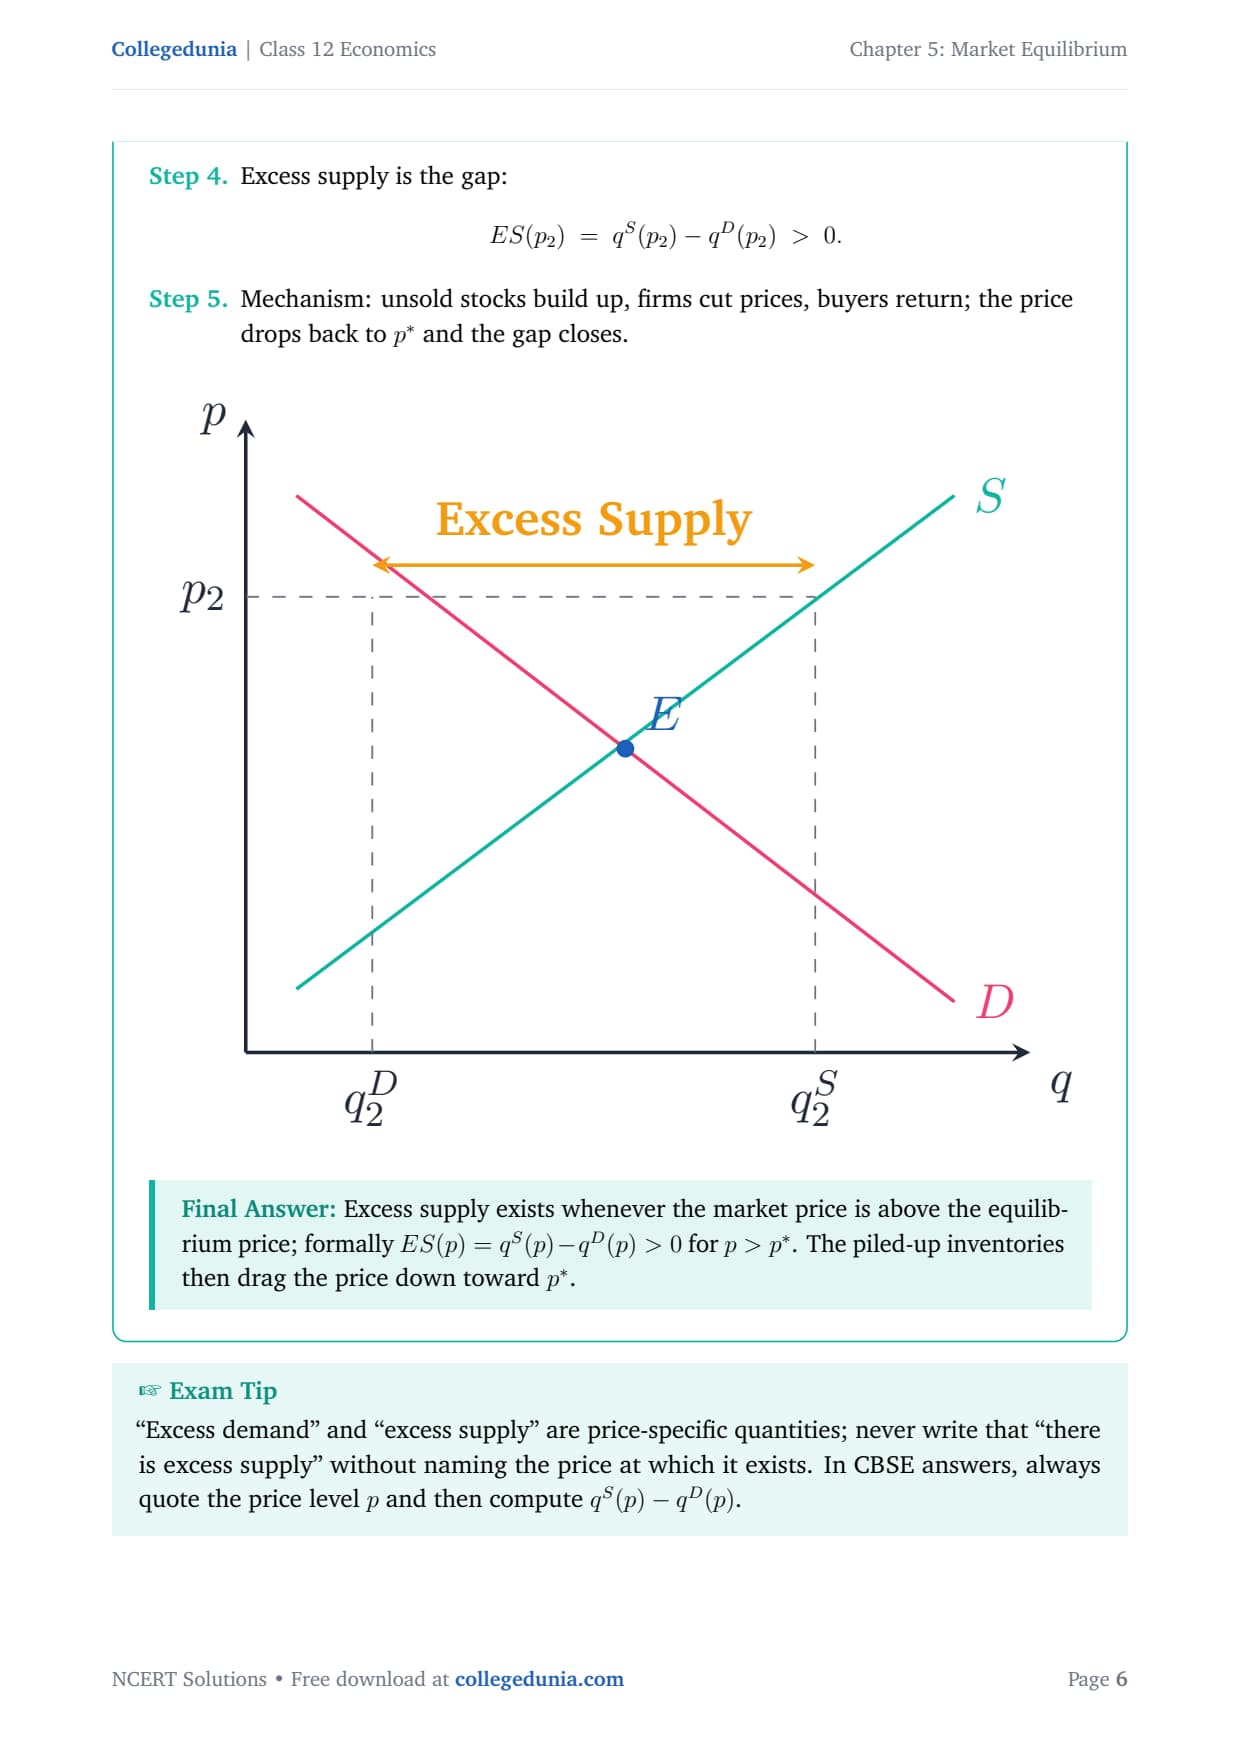
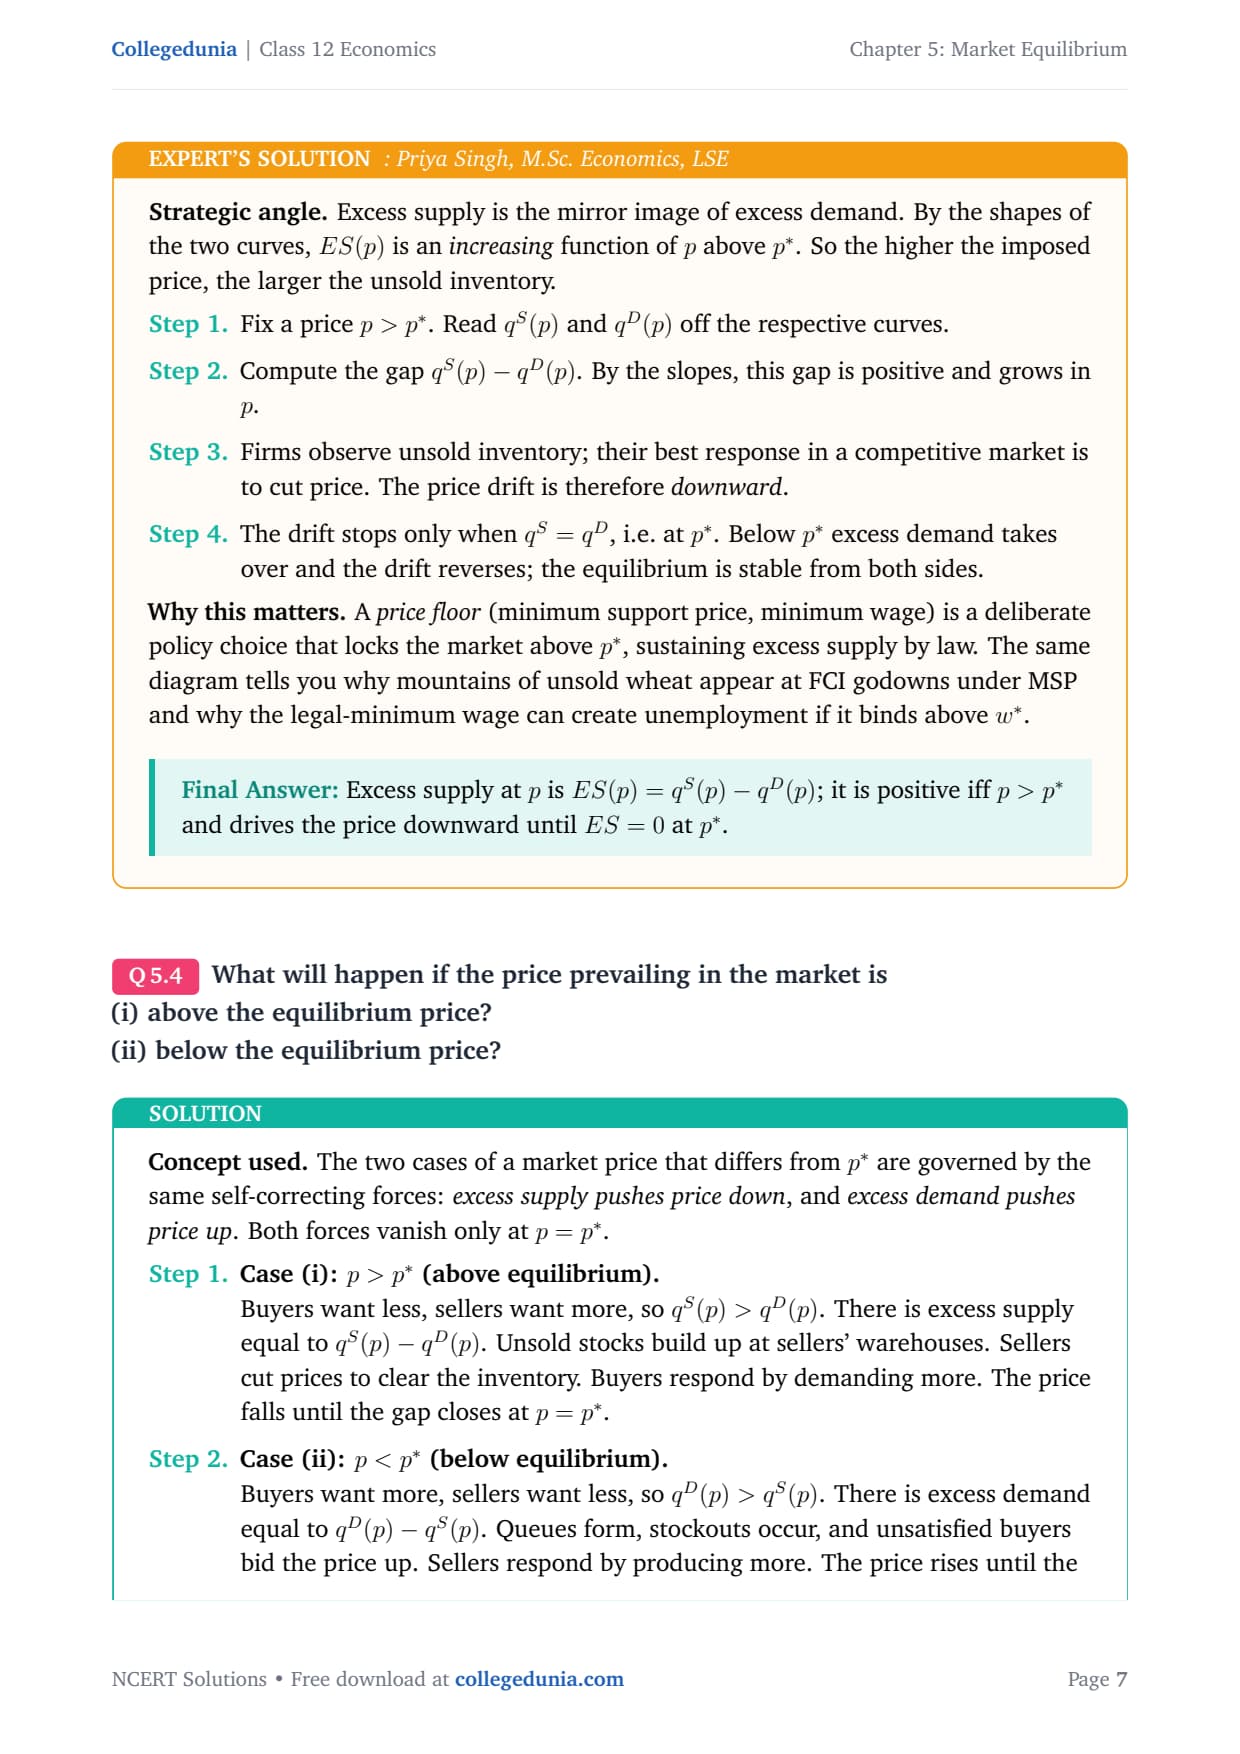
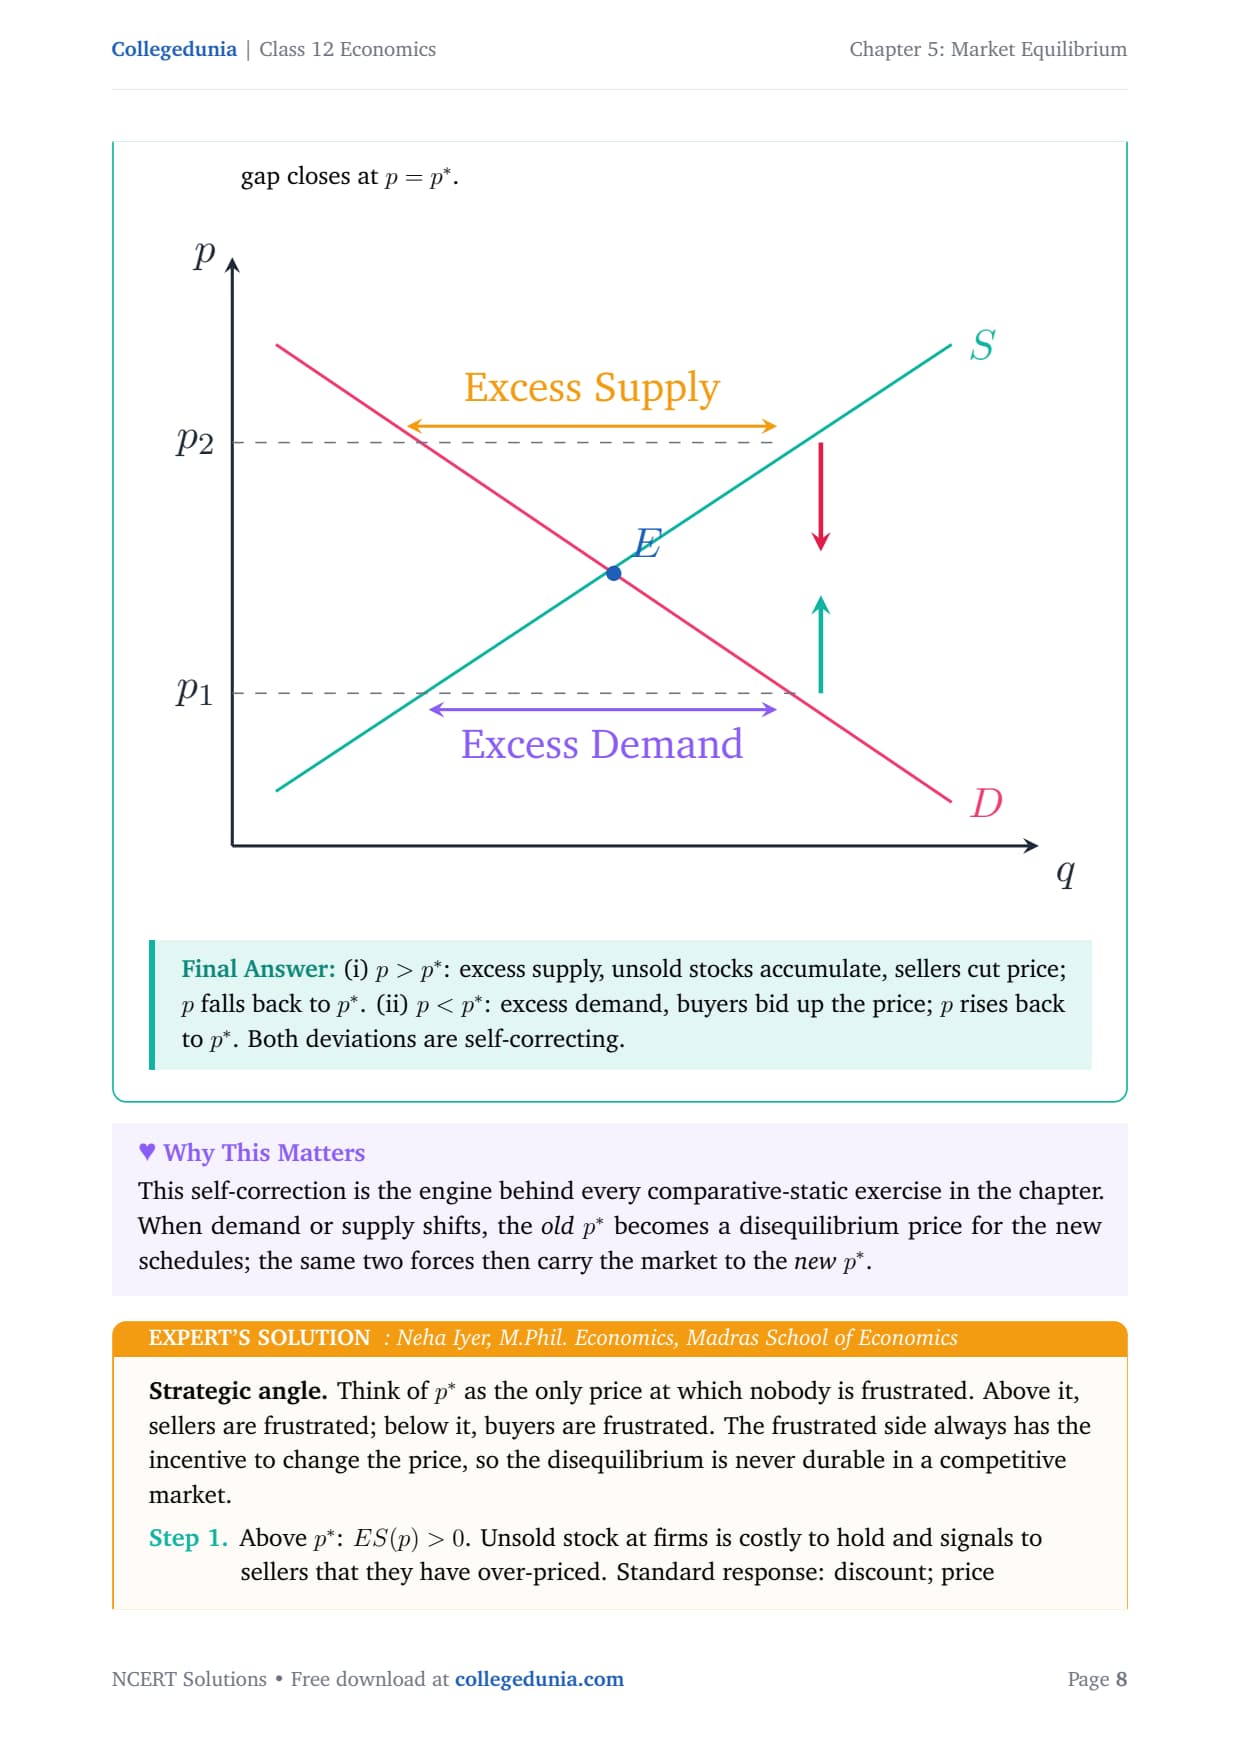
- Excess demand and excess supply: why a wrong price corrects itself back to equilibrium.
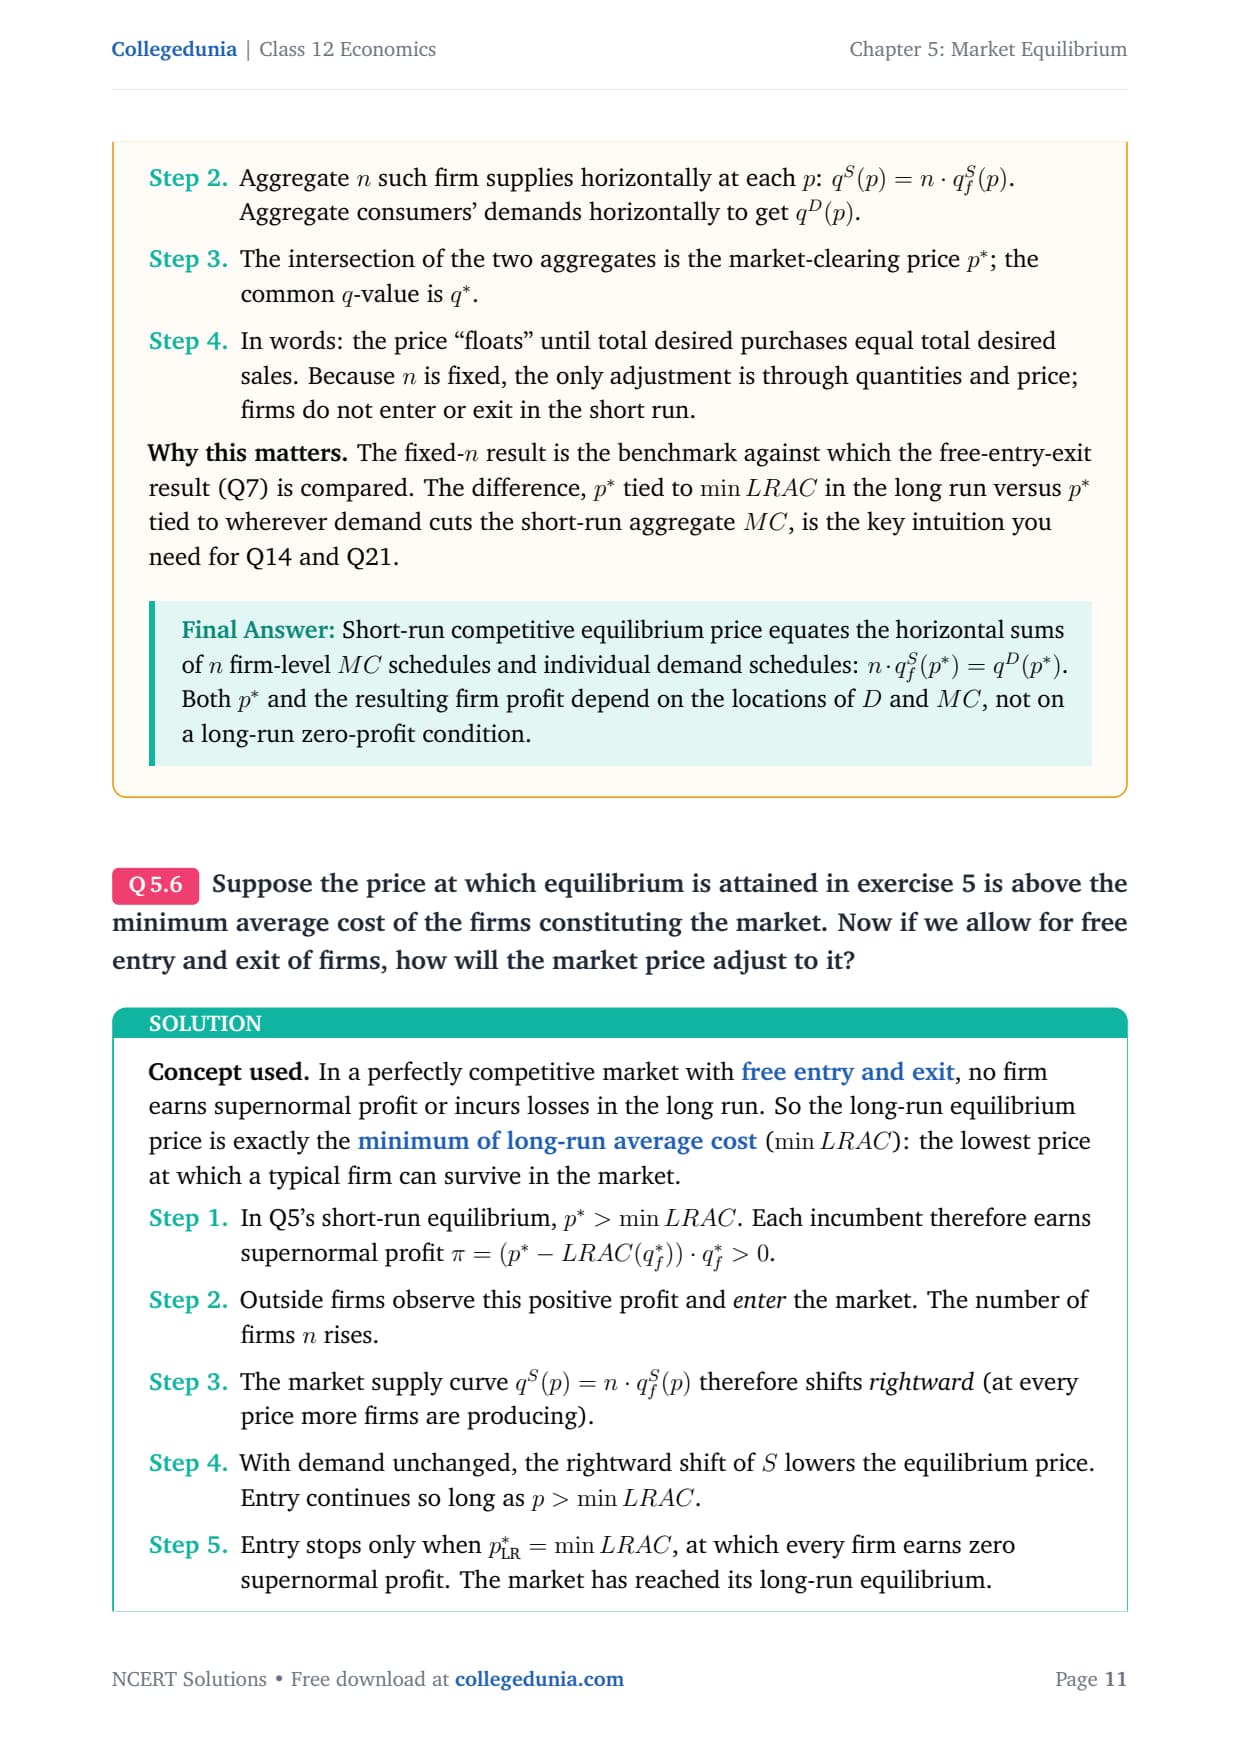
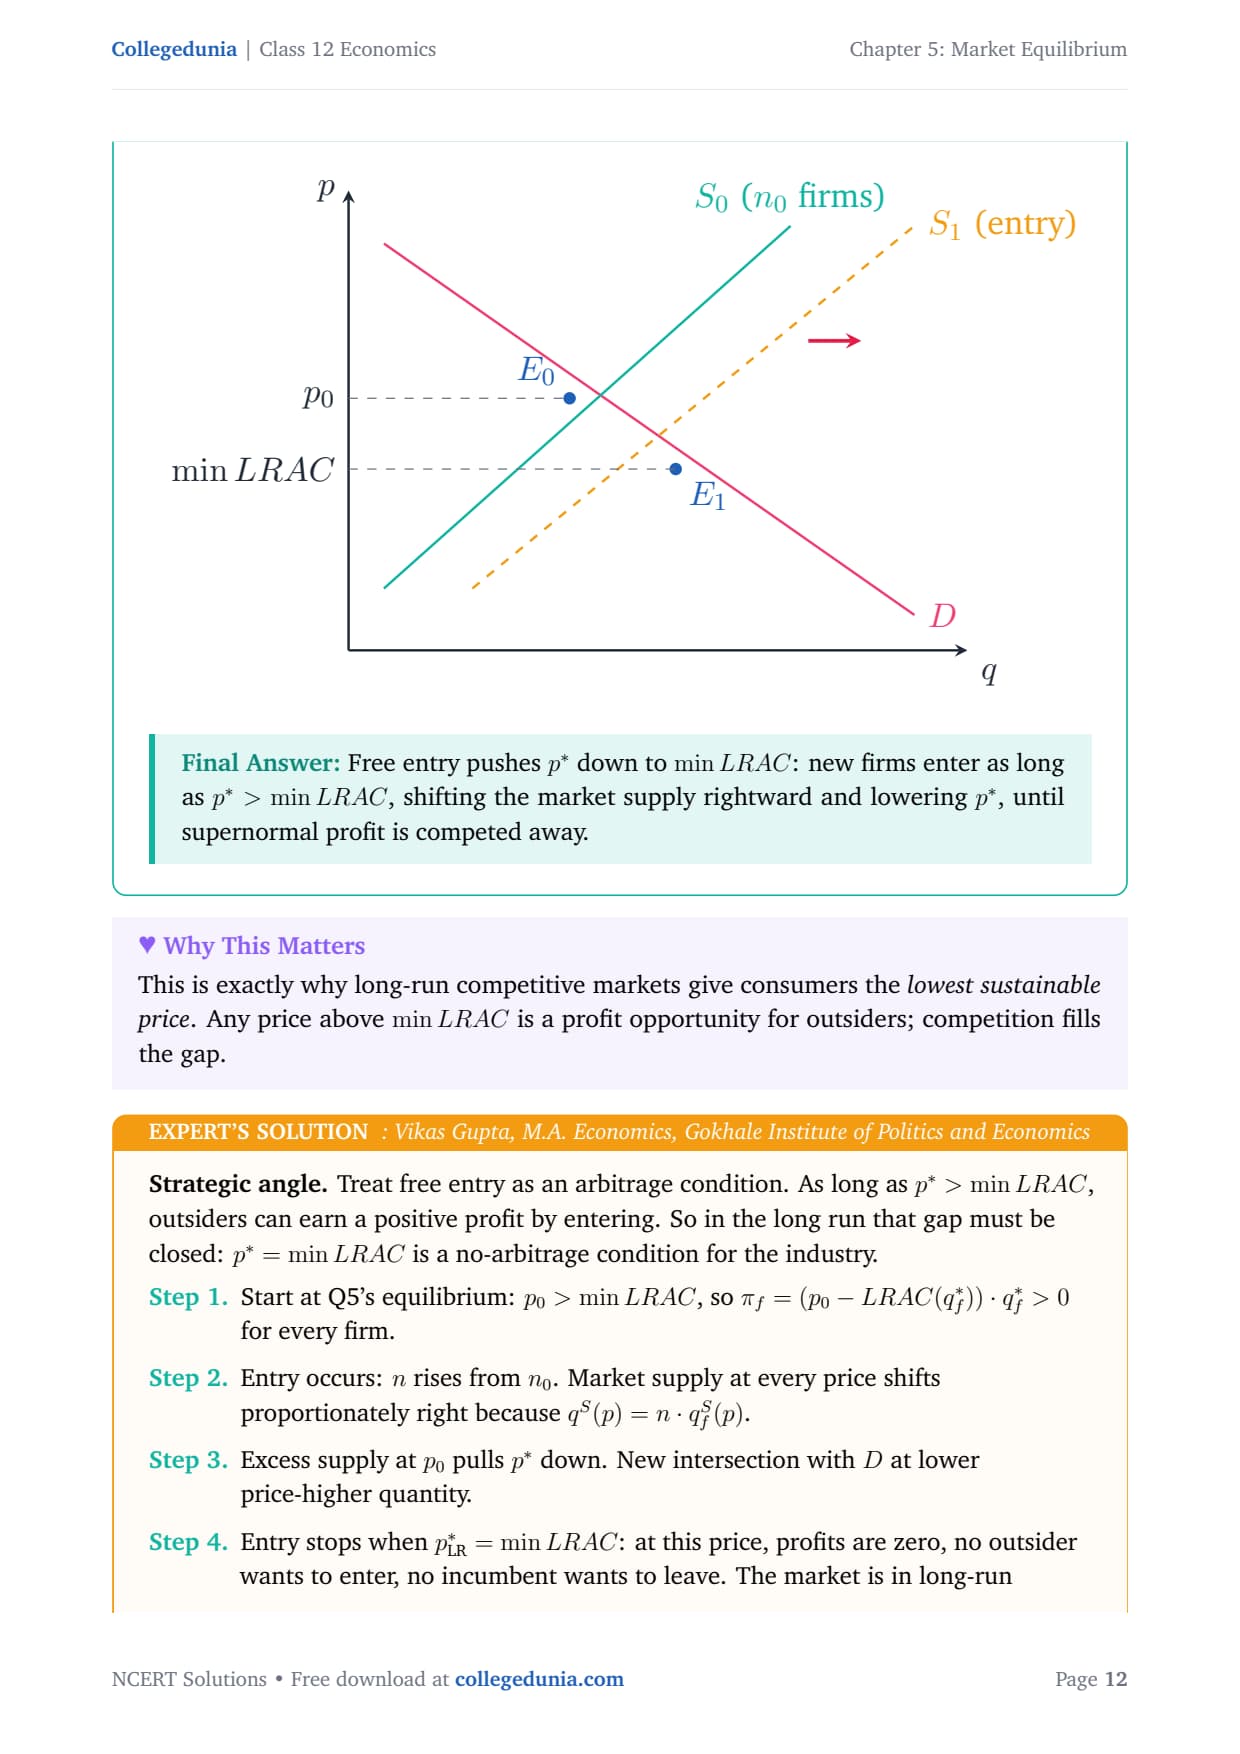
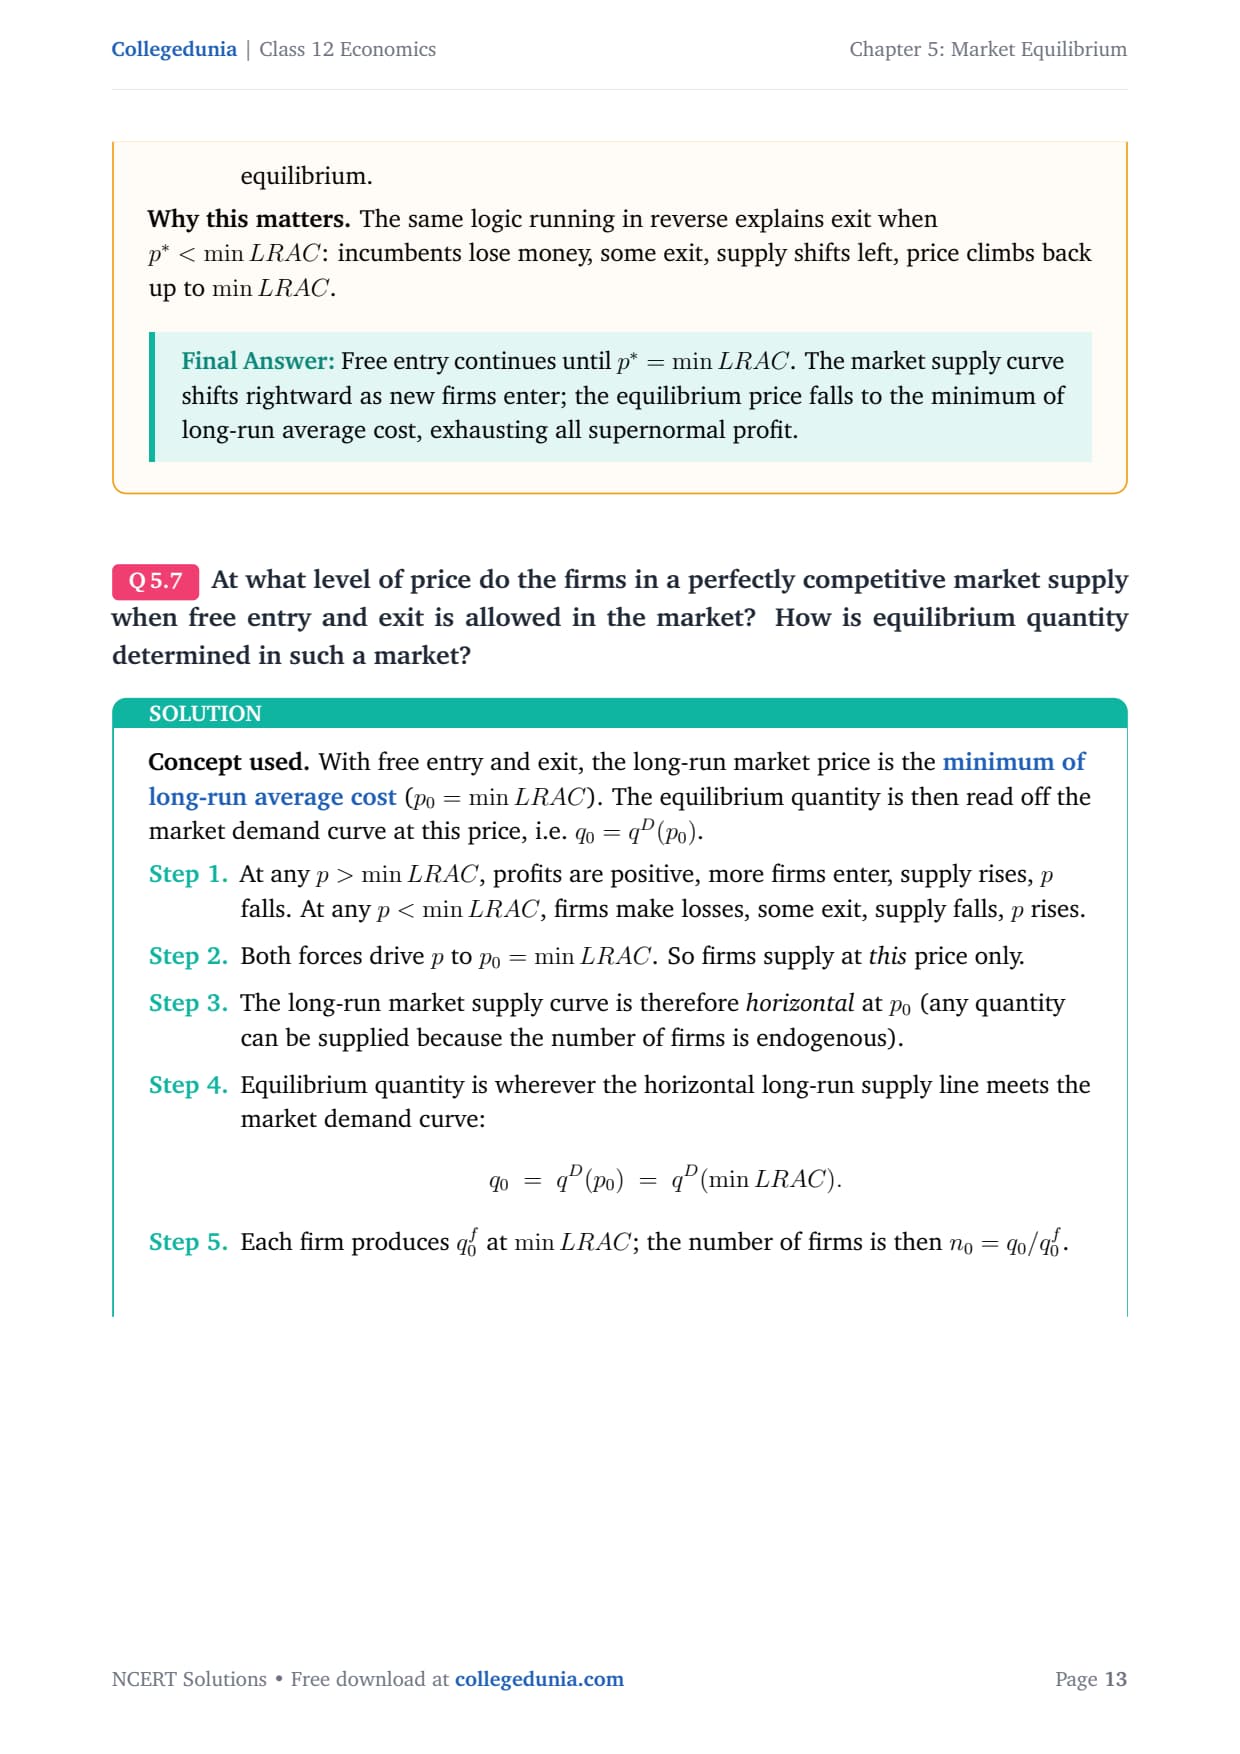
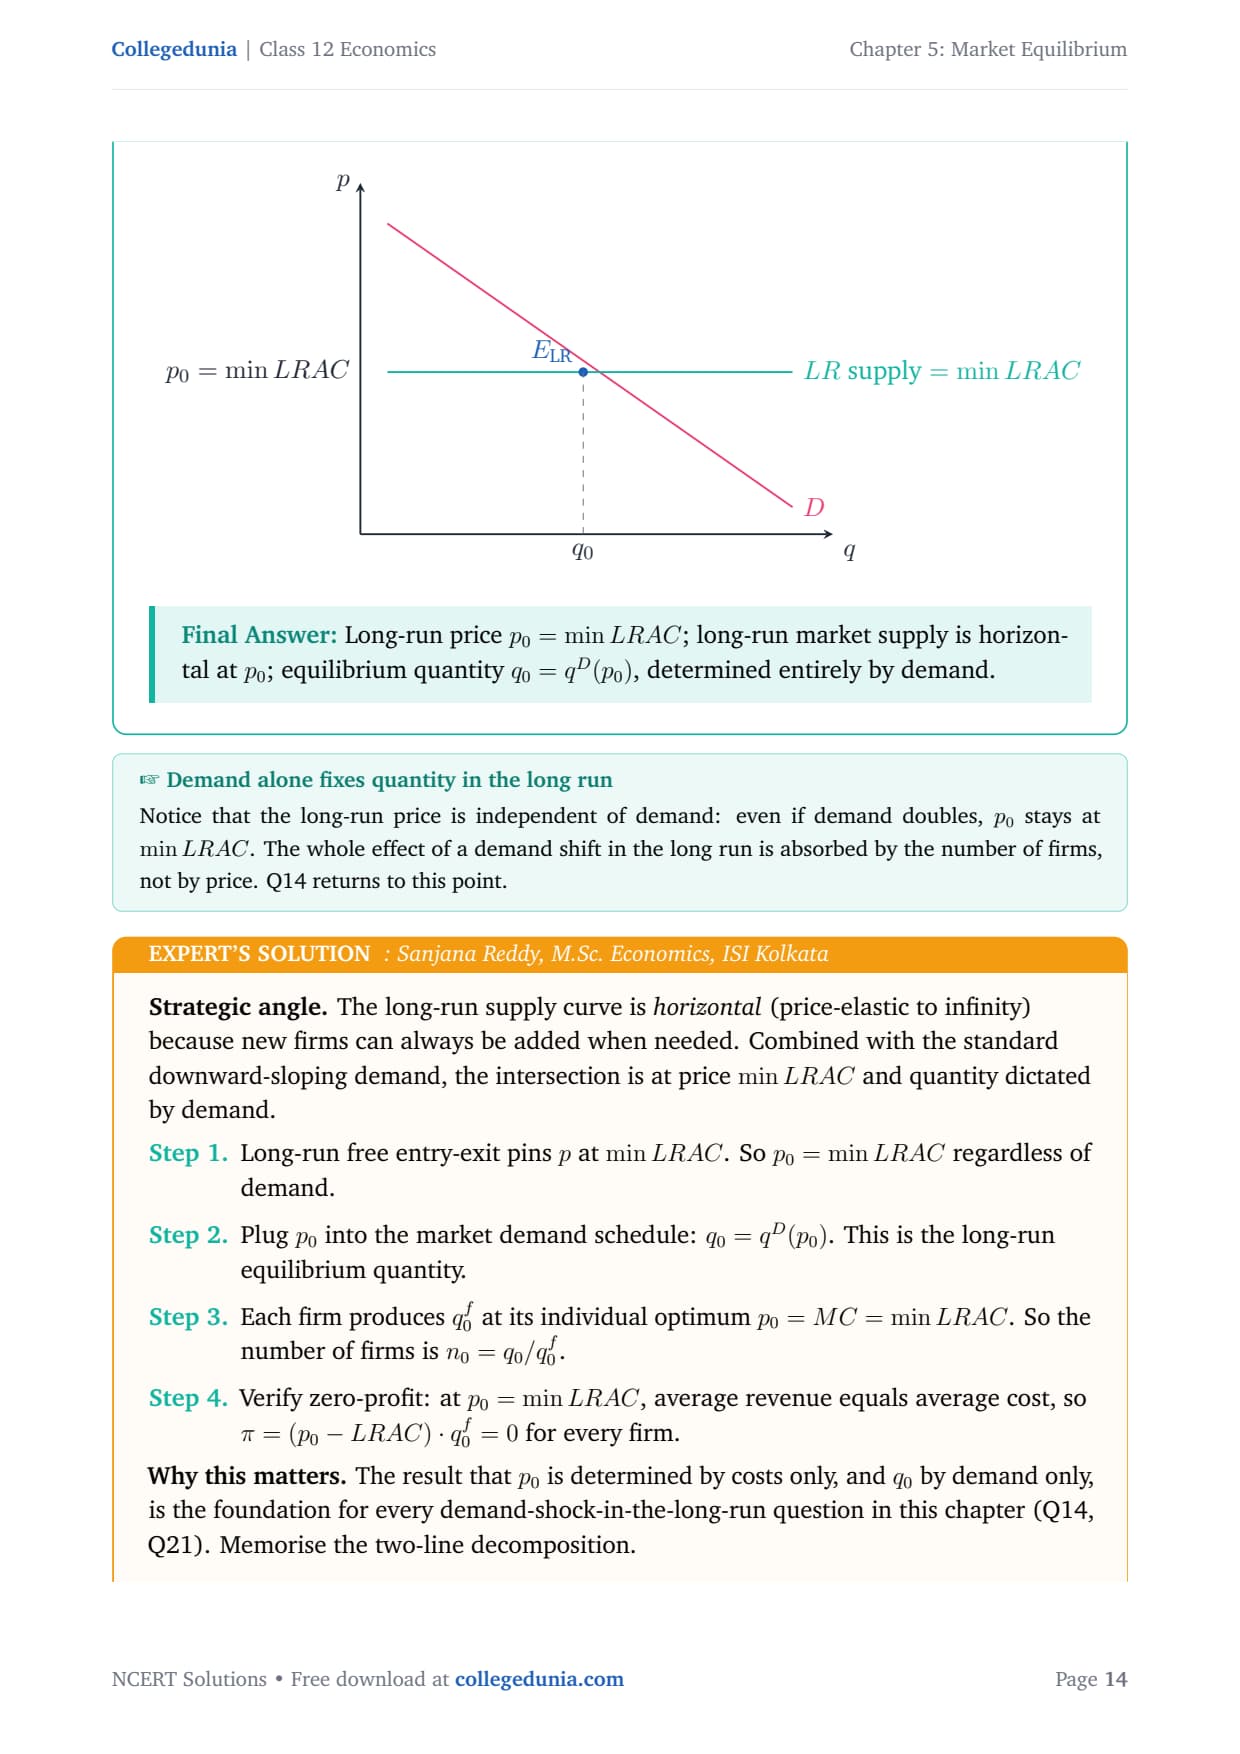
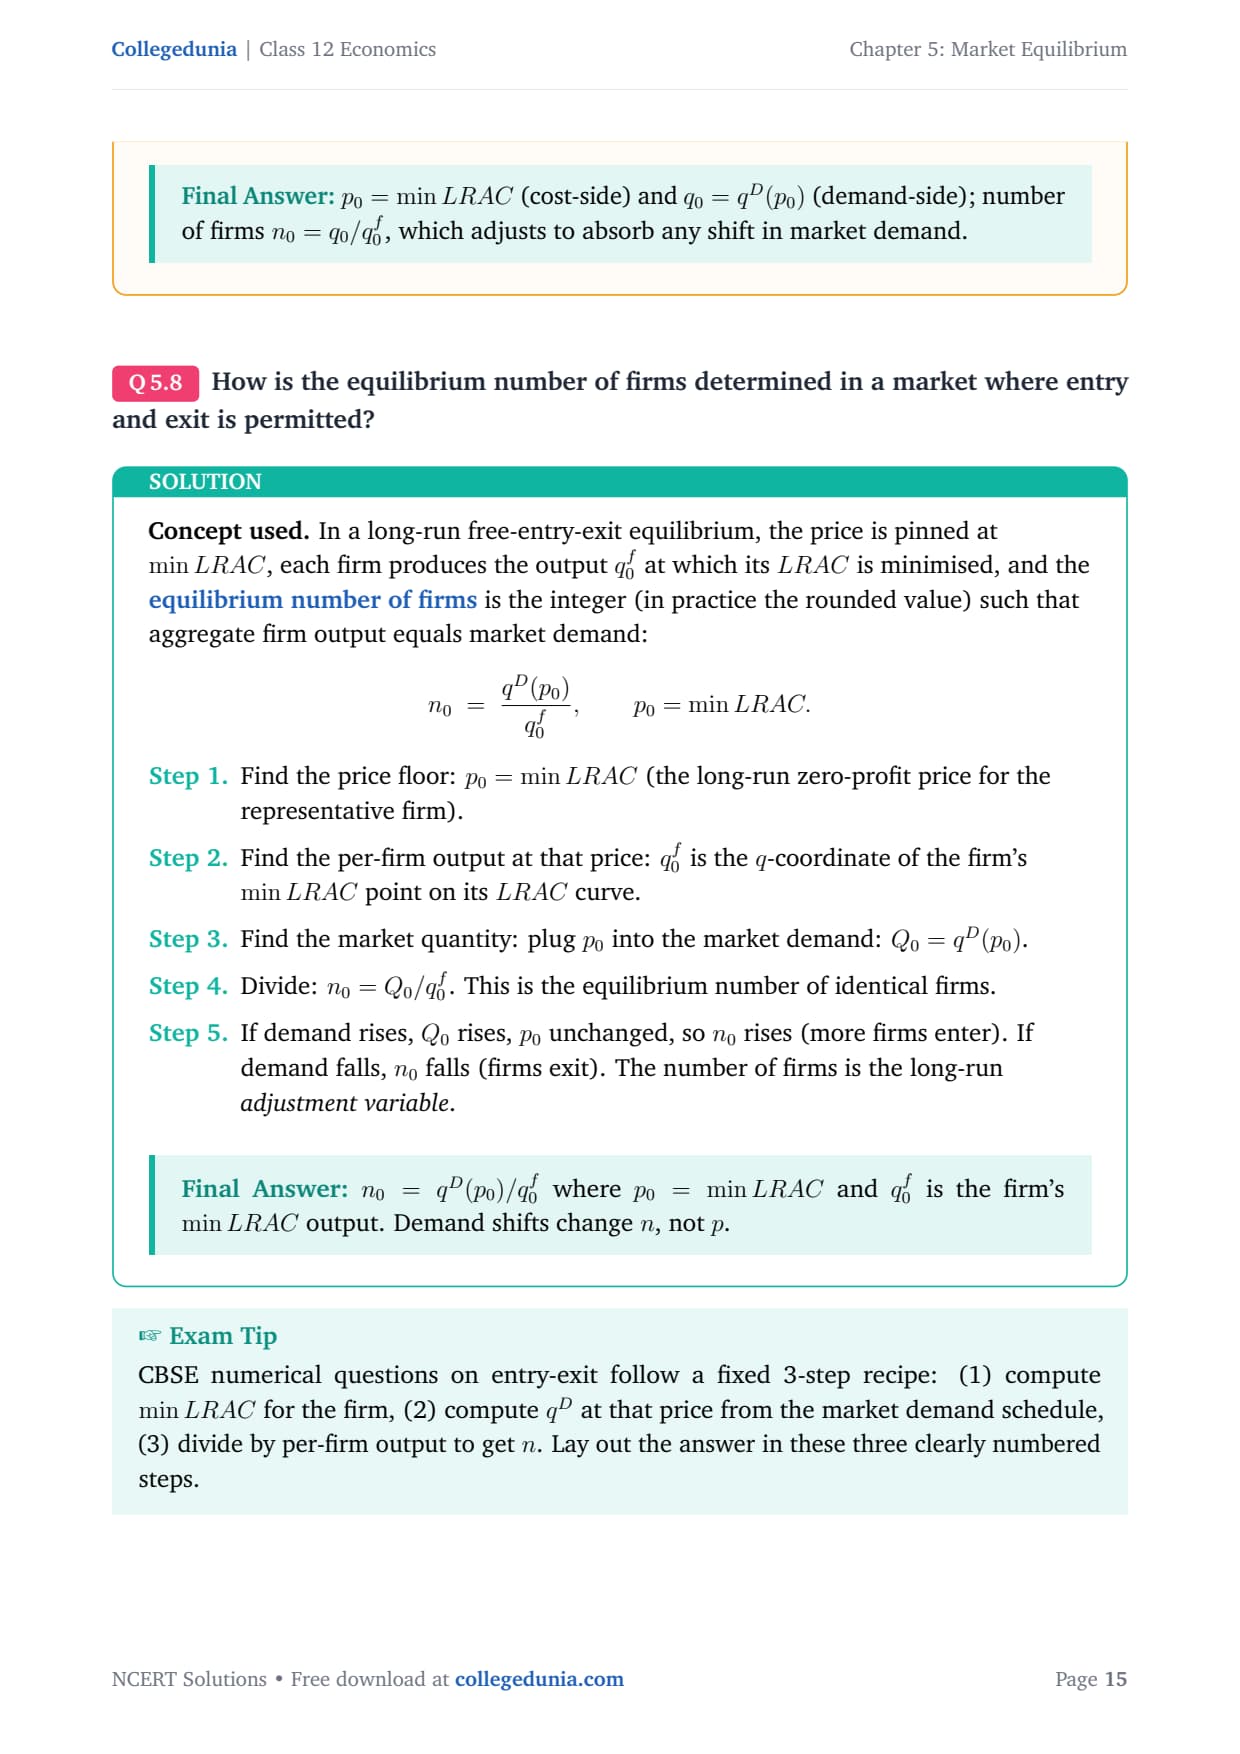
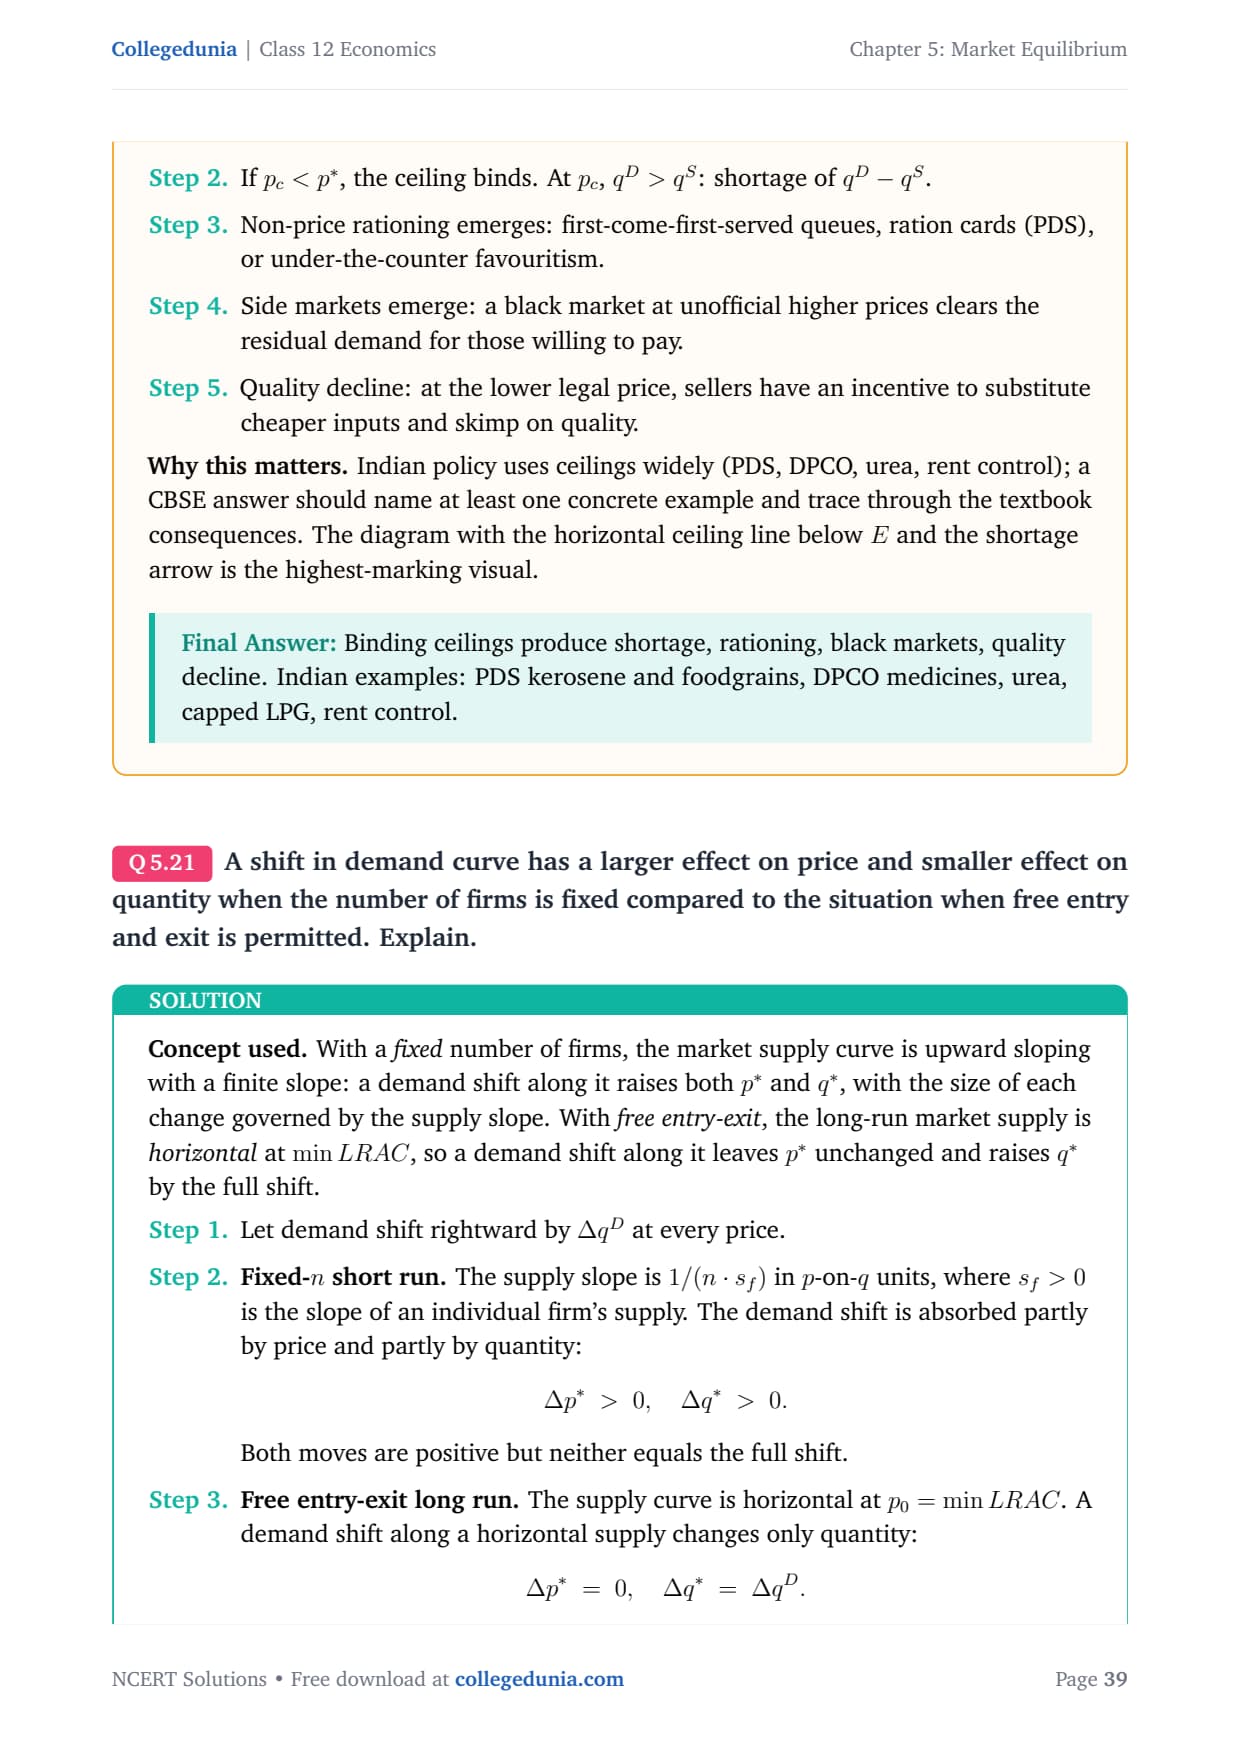
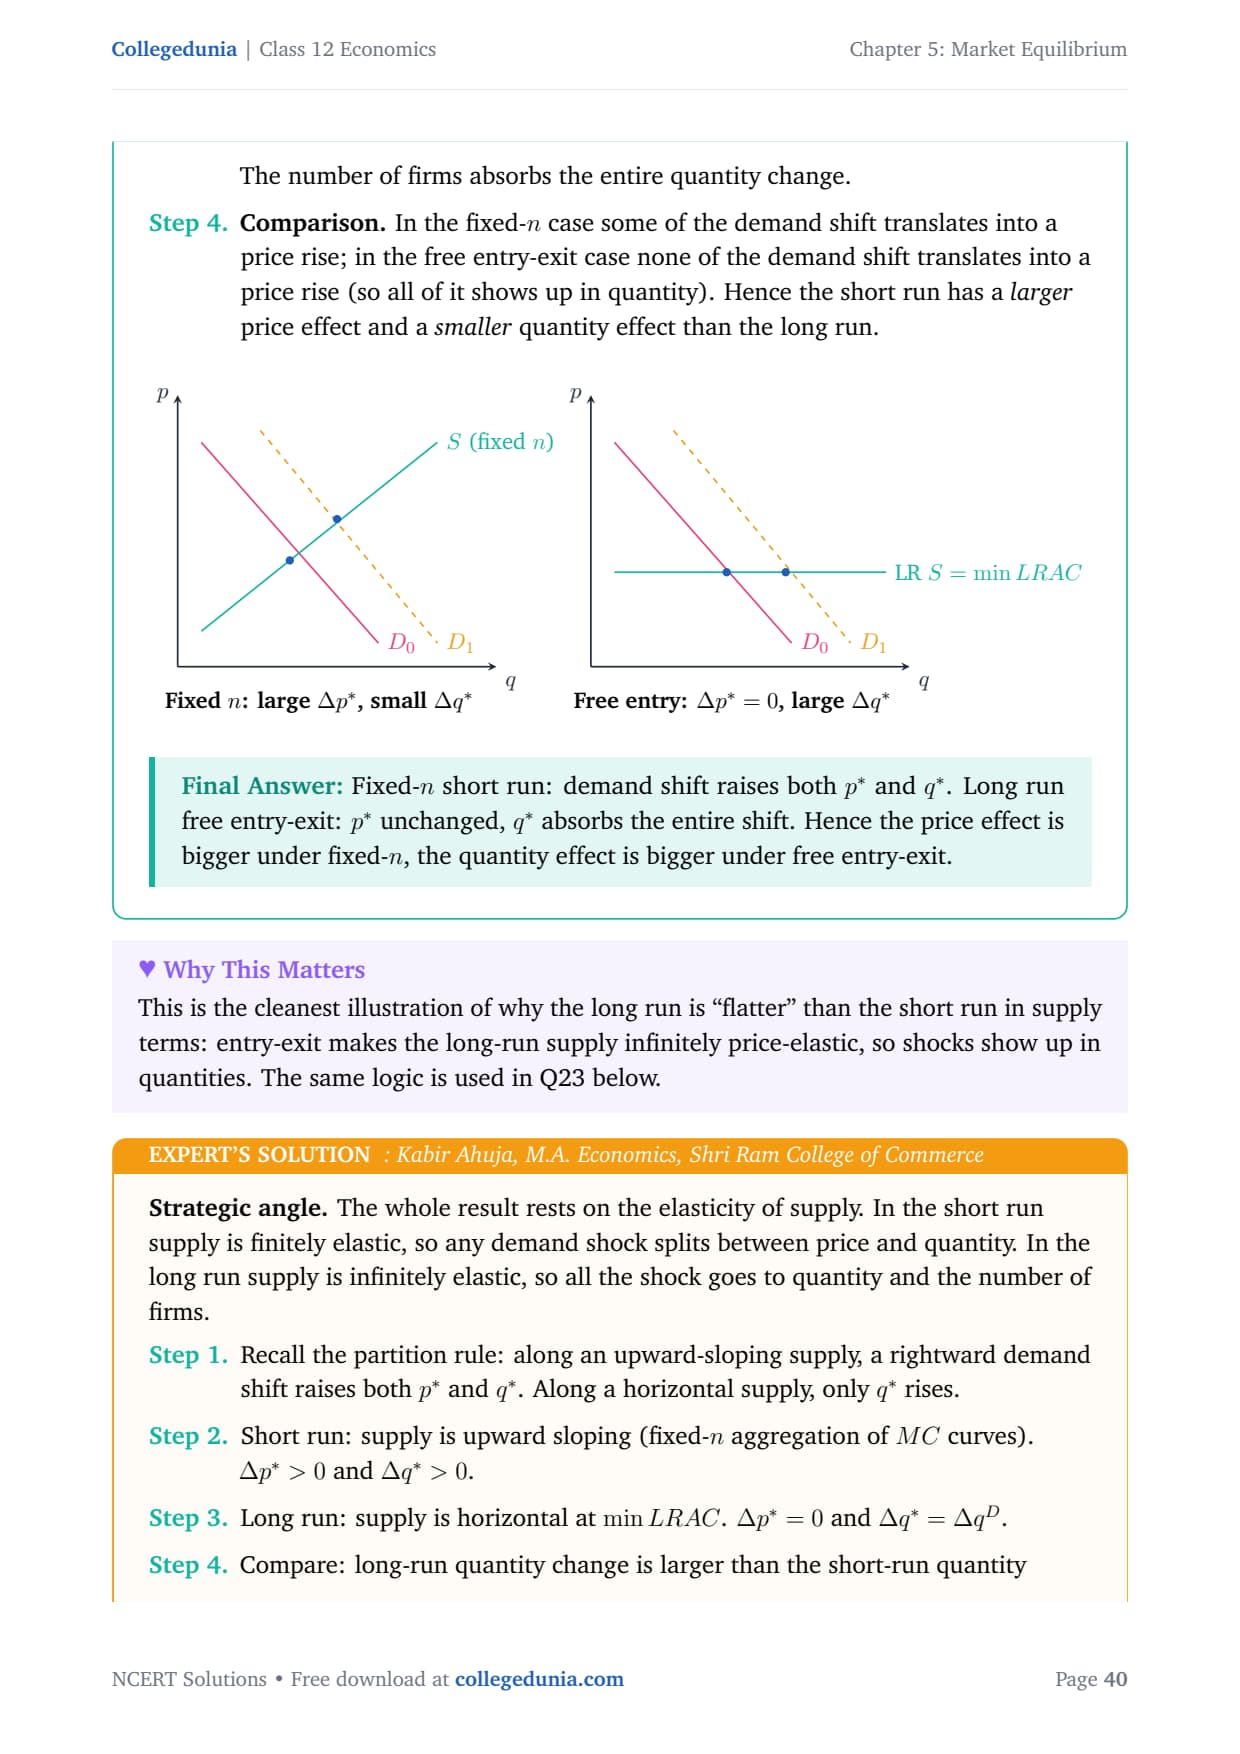
- Free entry and exit: long-run price sits at minimum average cost.
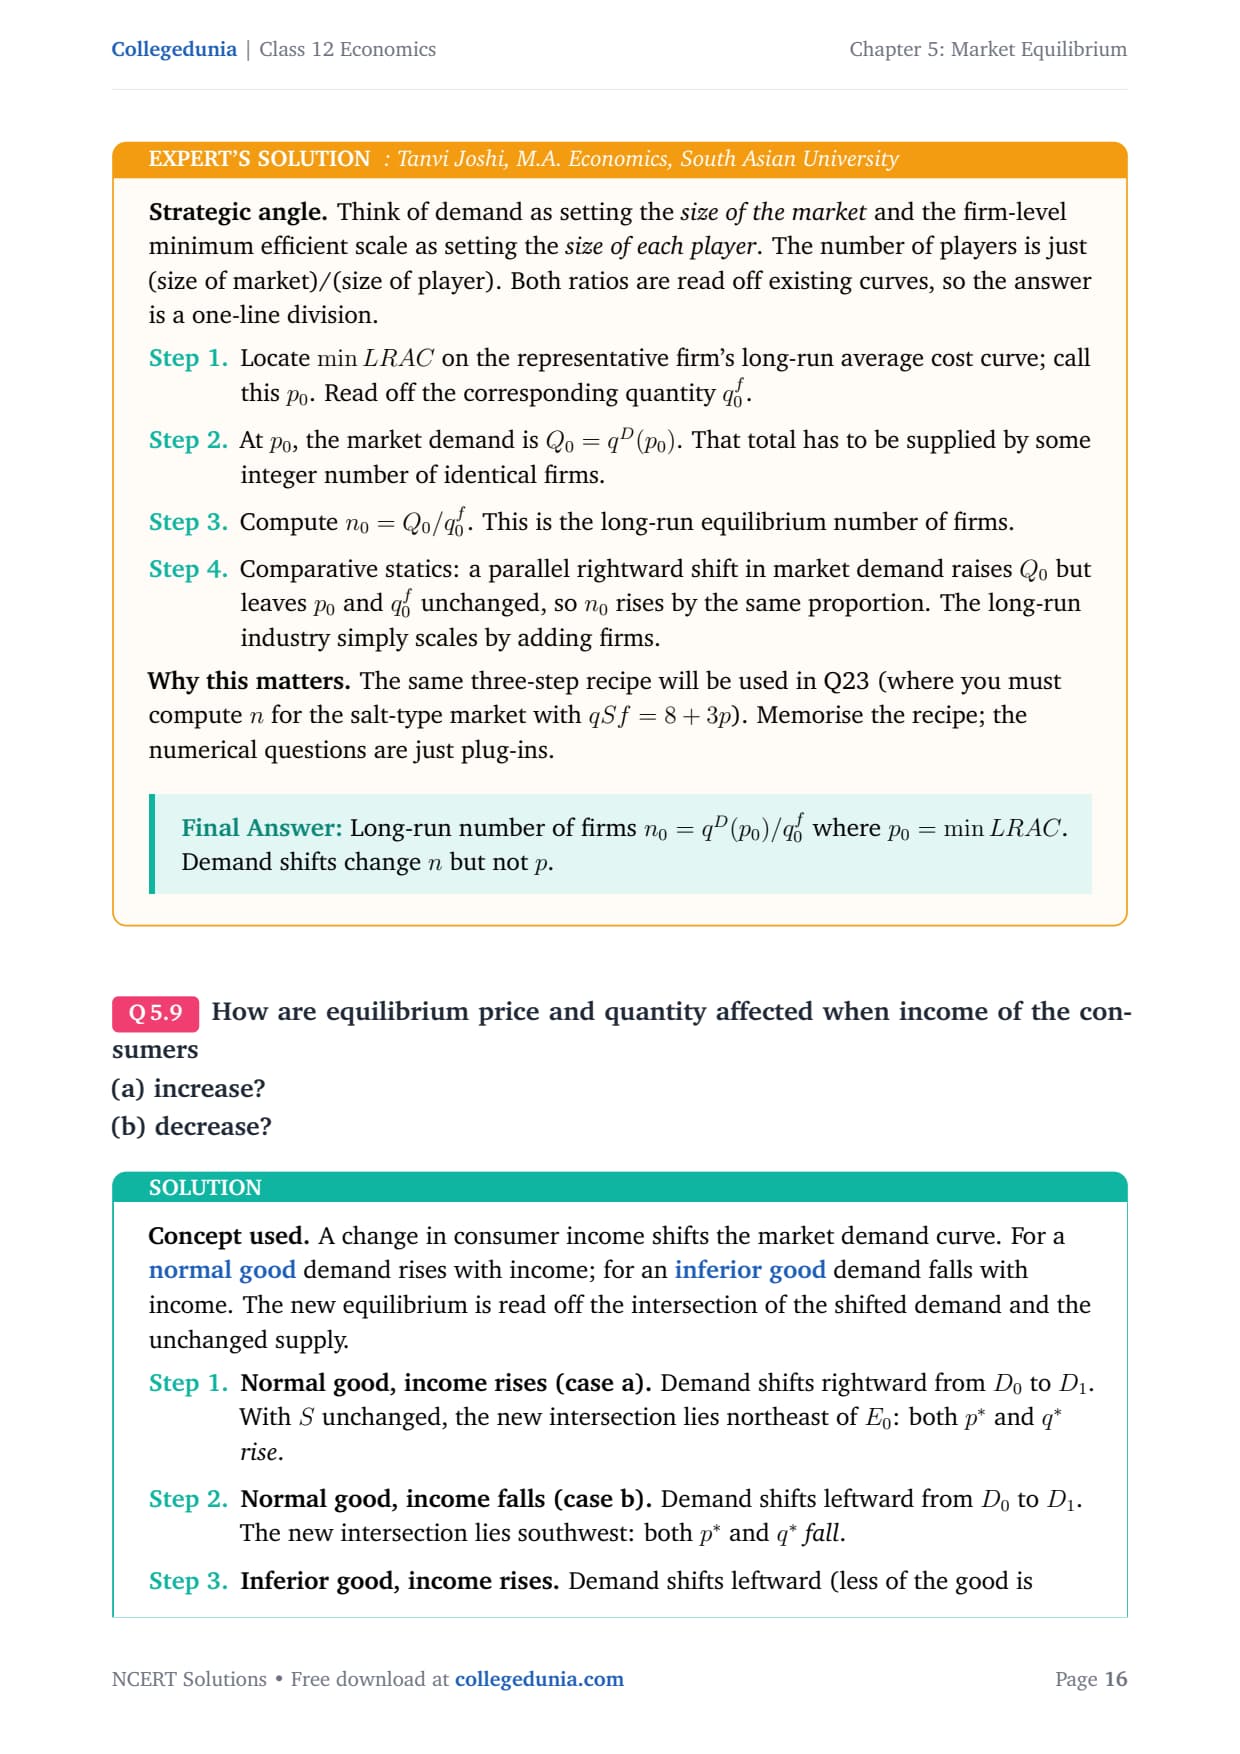
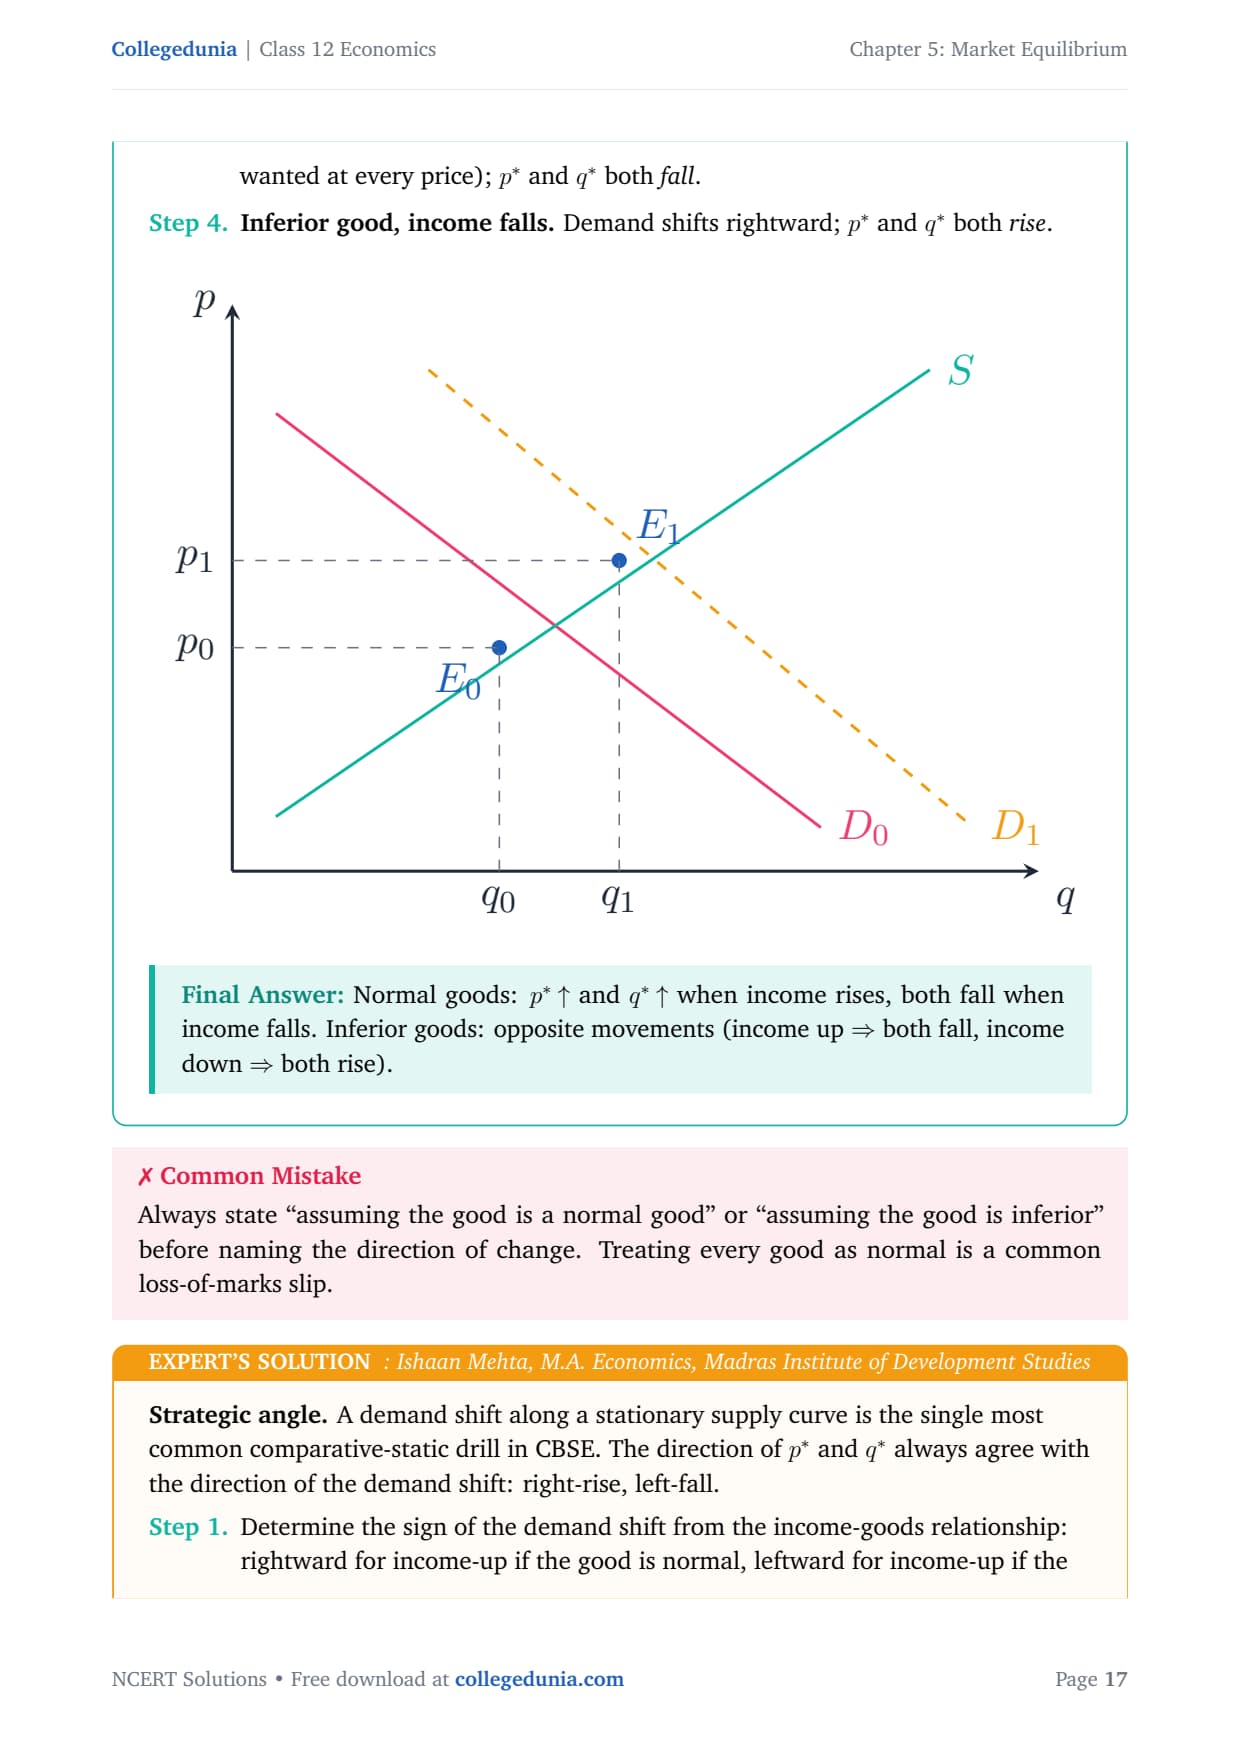
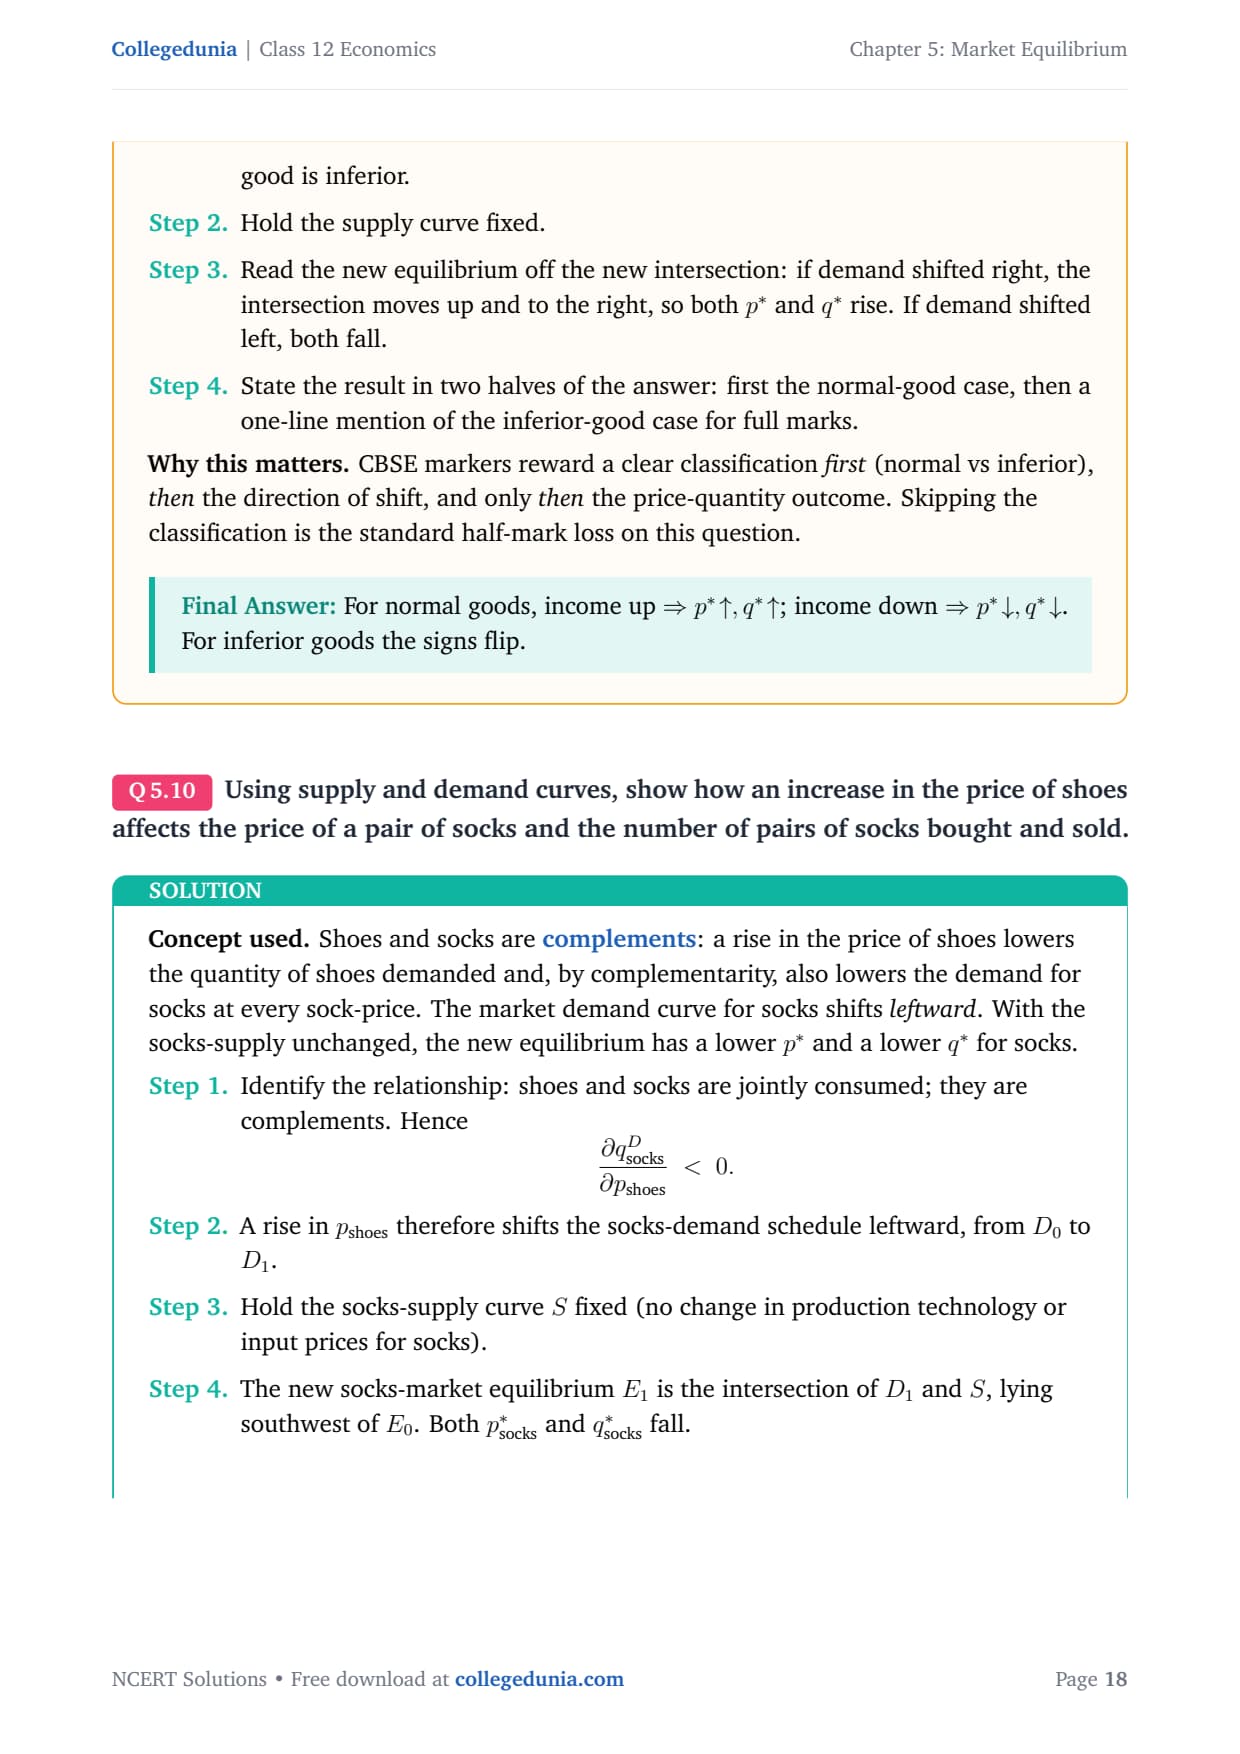
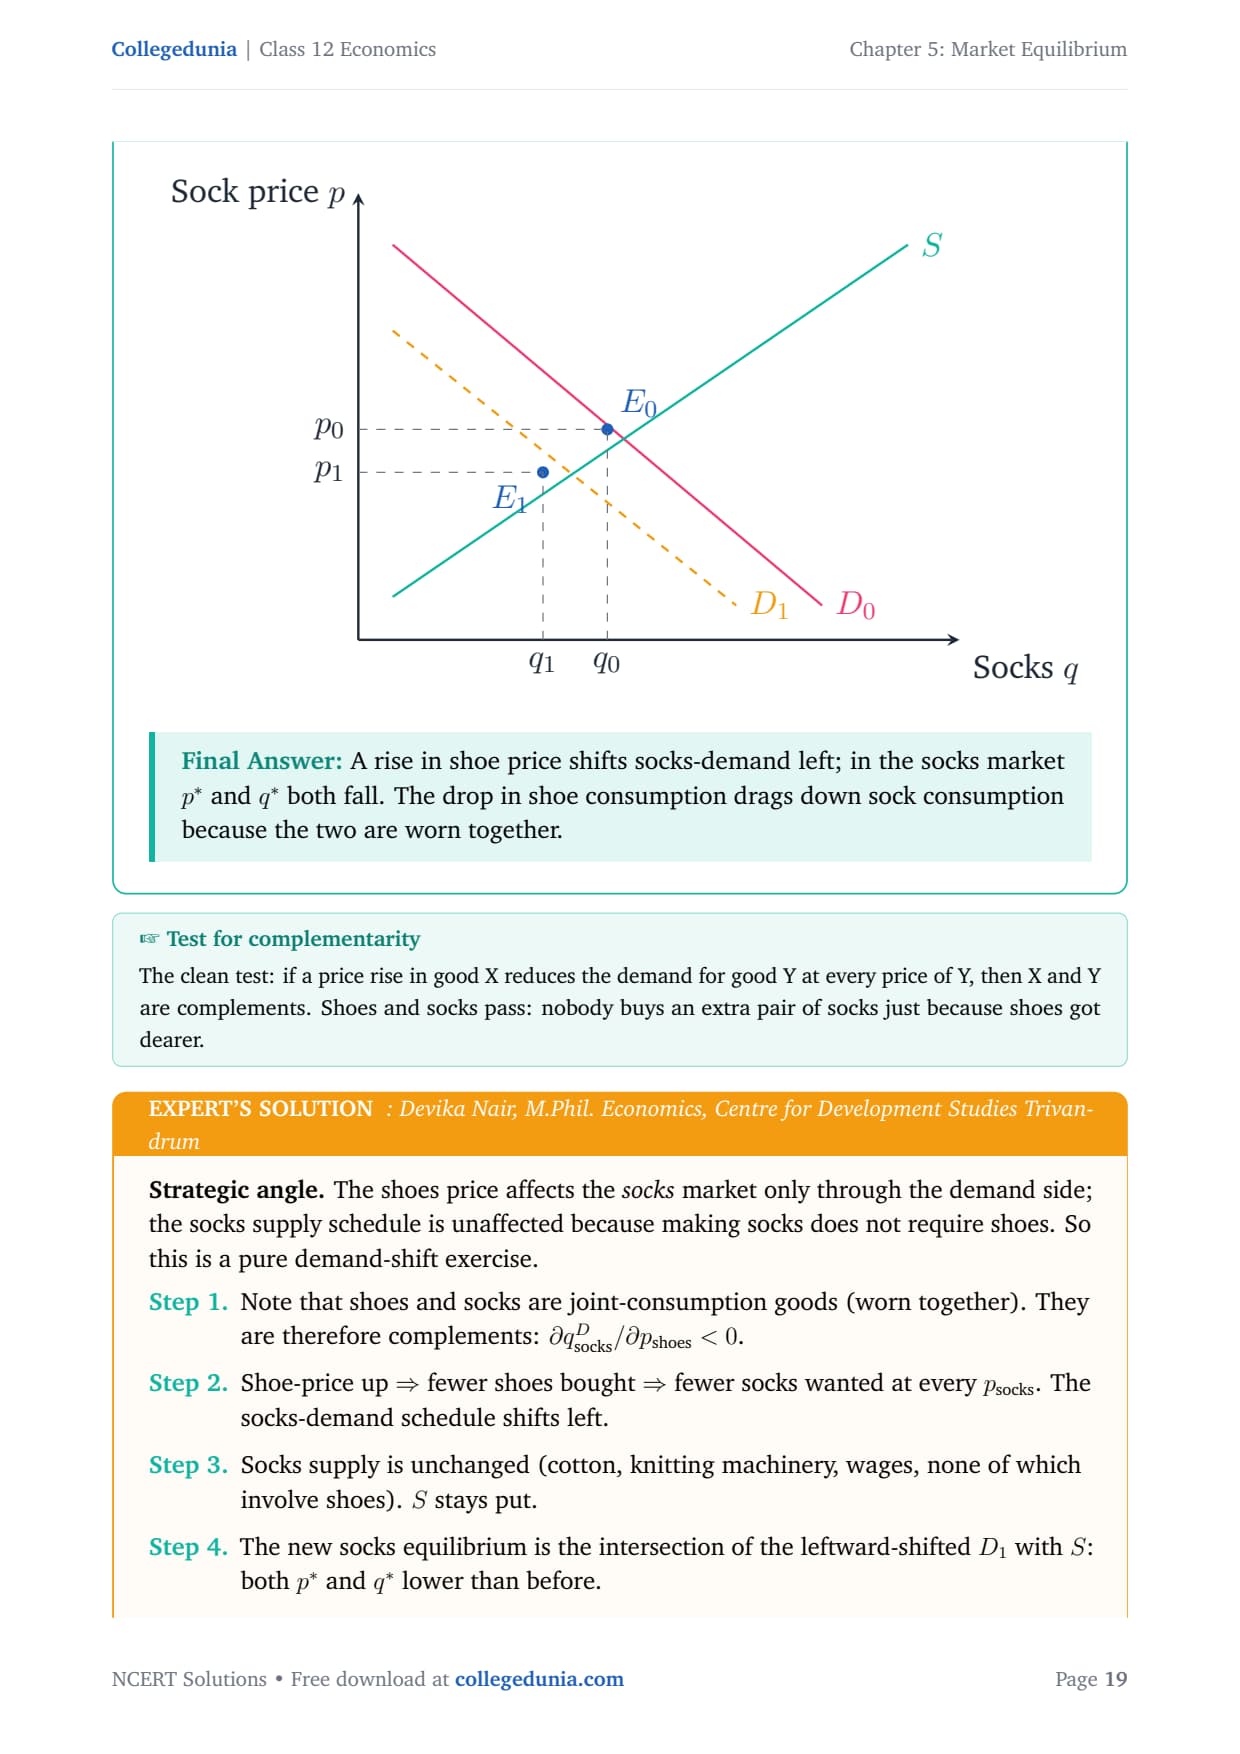
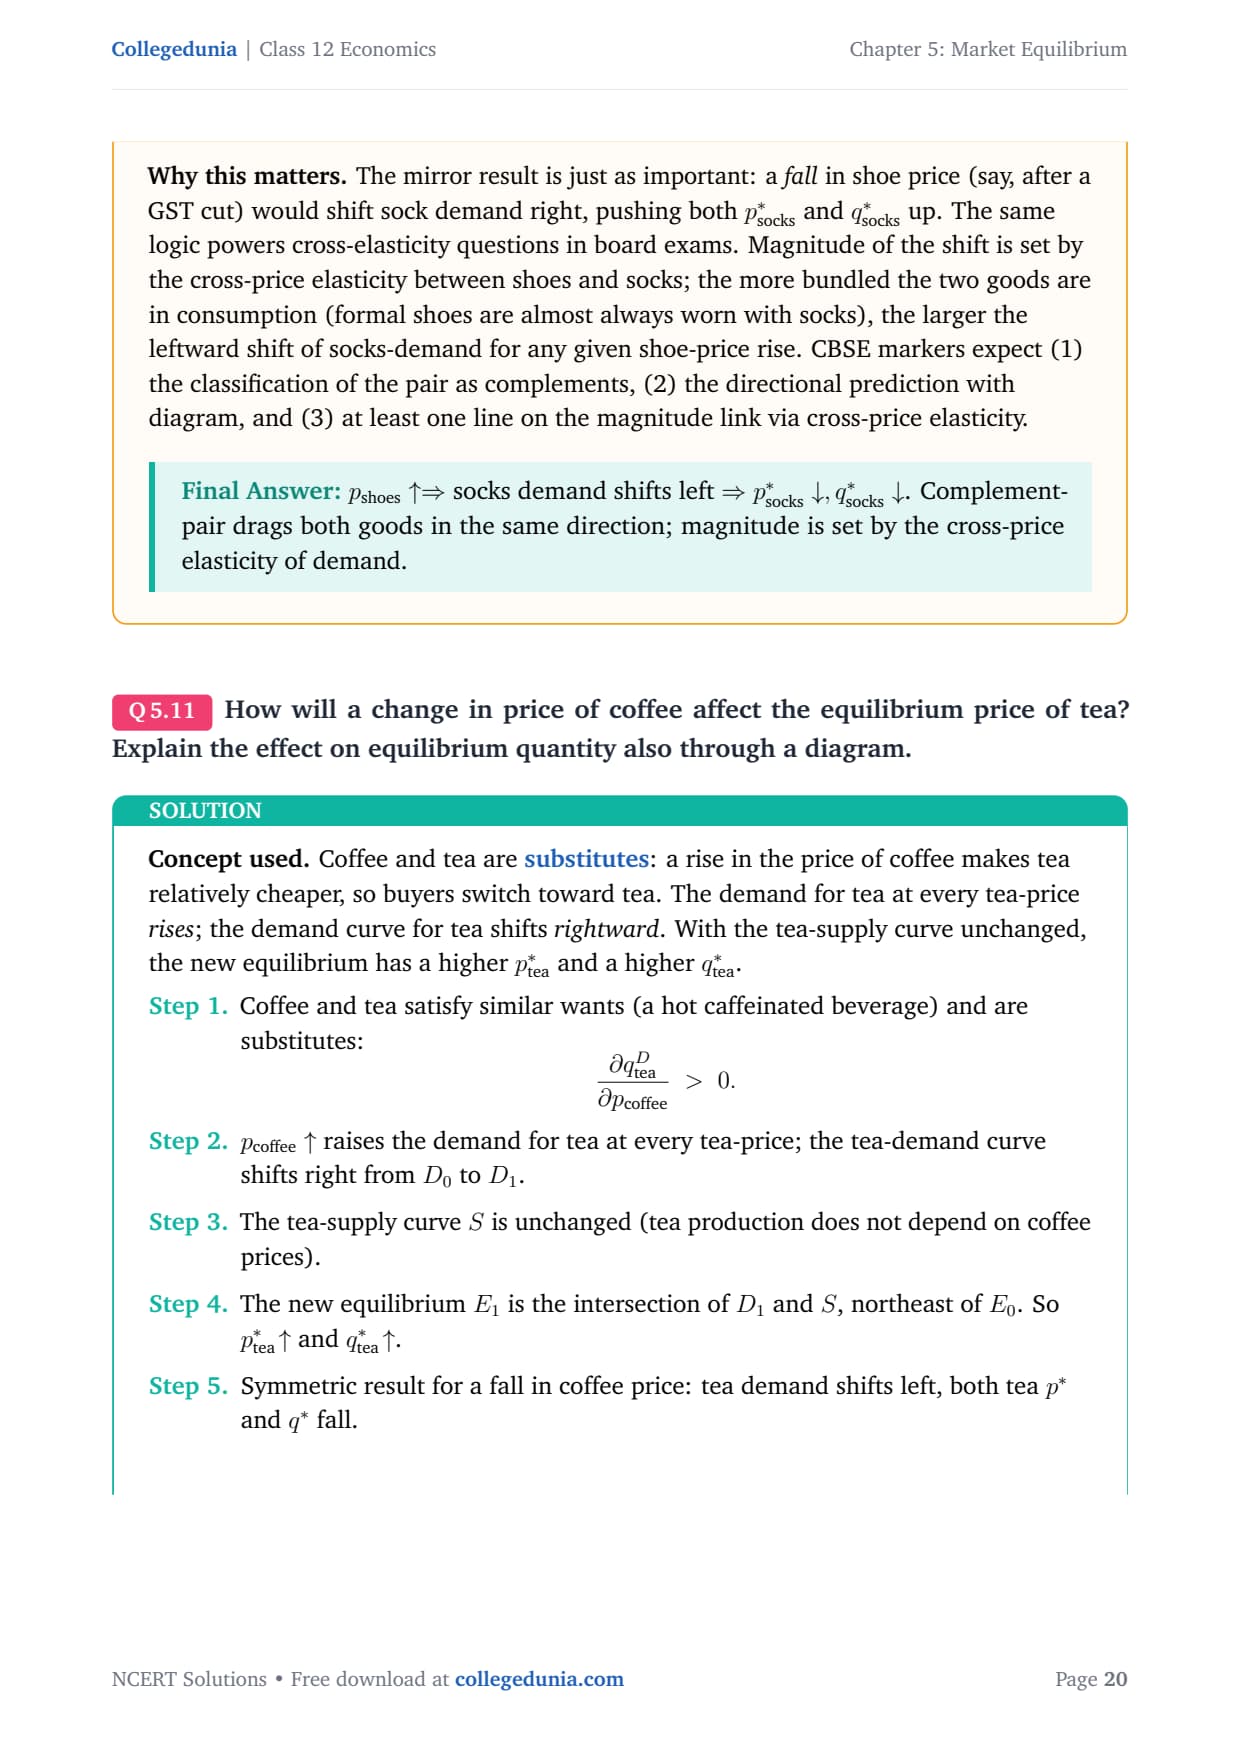
- Shifts in demand and supply: the four cases, plus the tricky both-shift case.
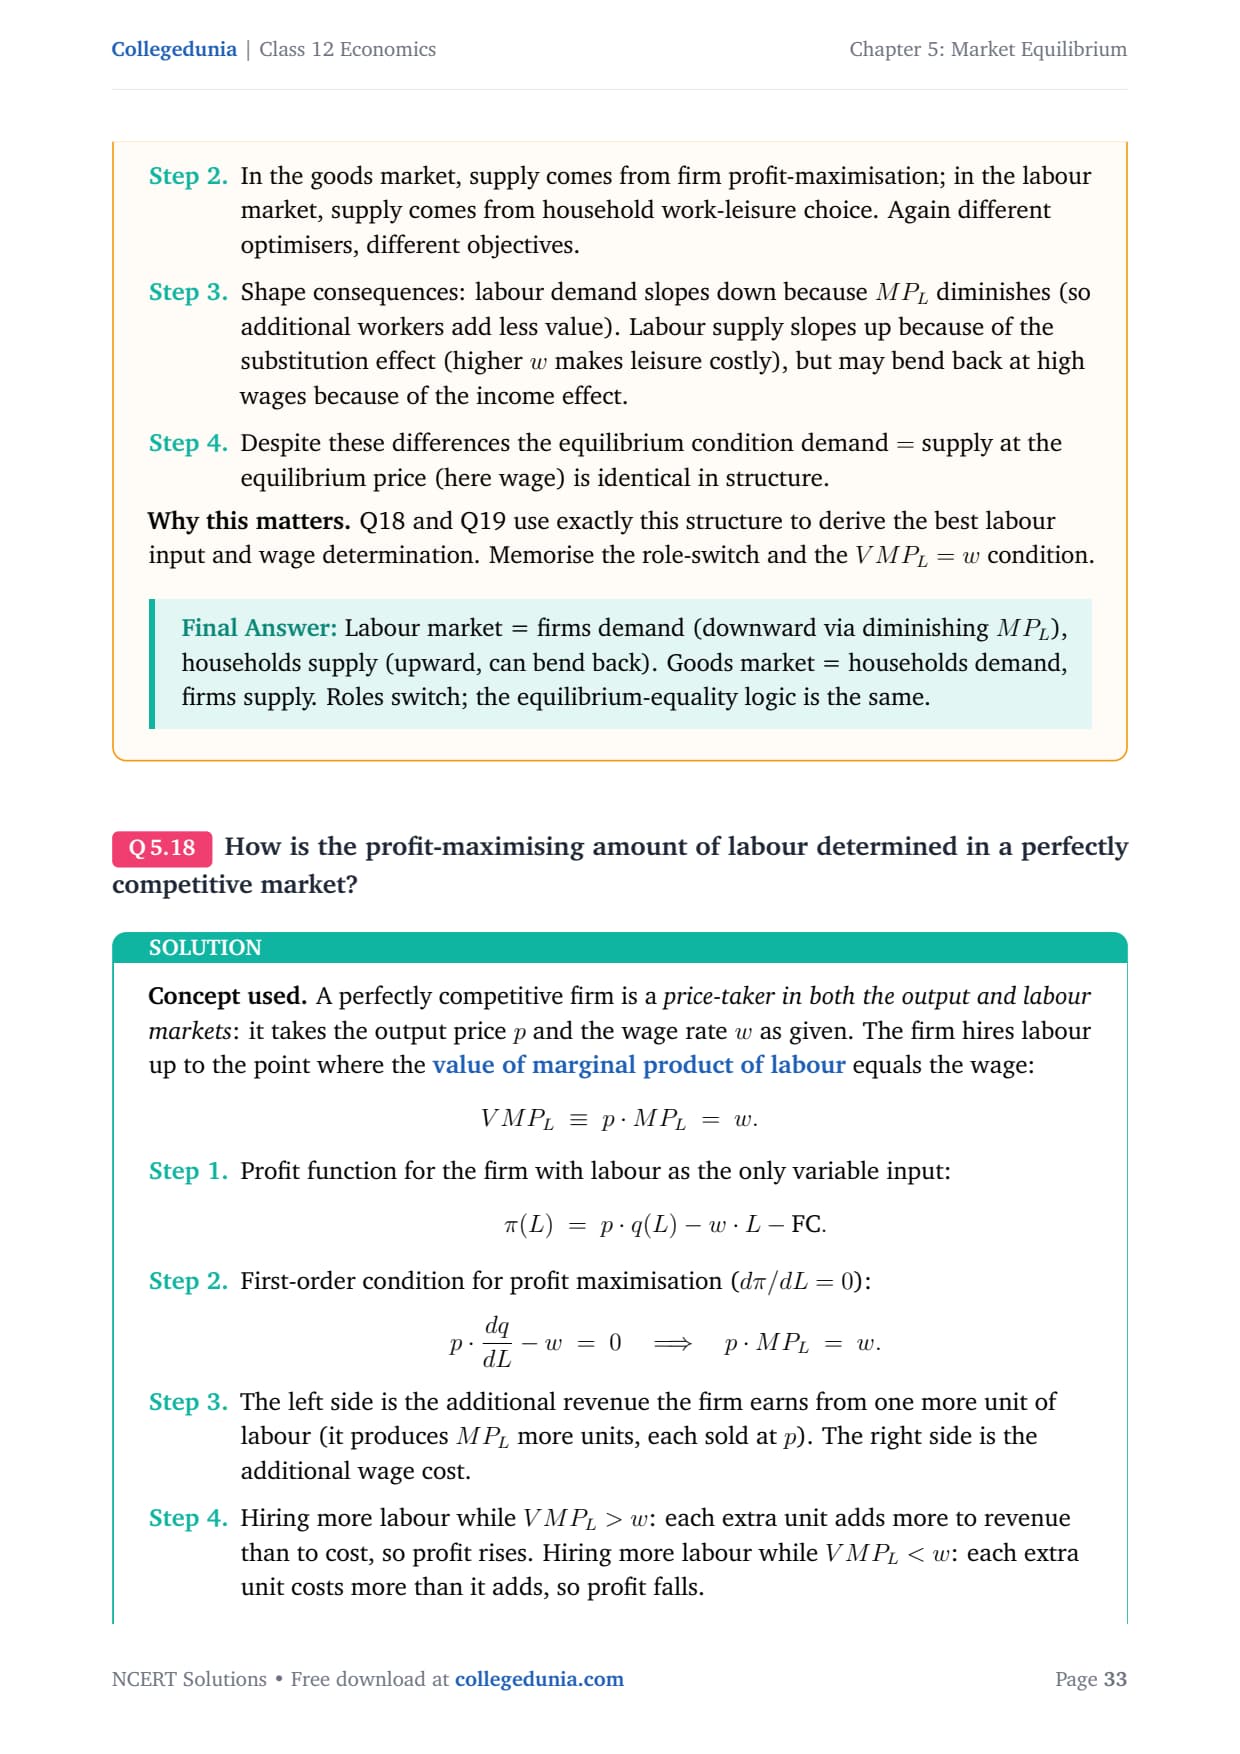
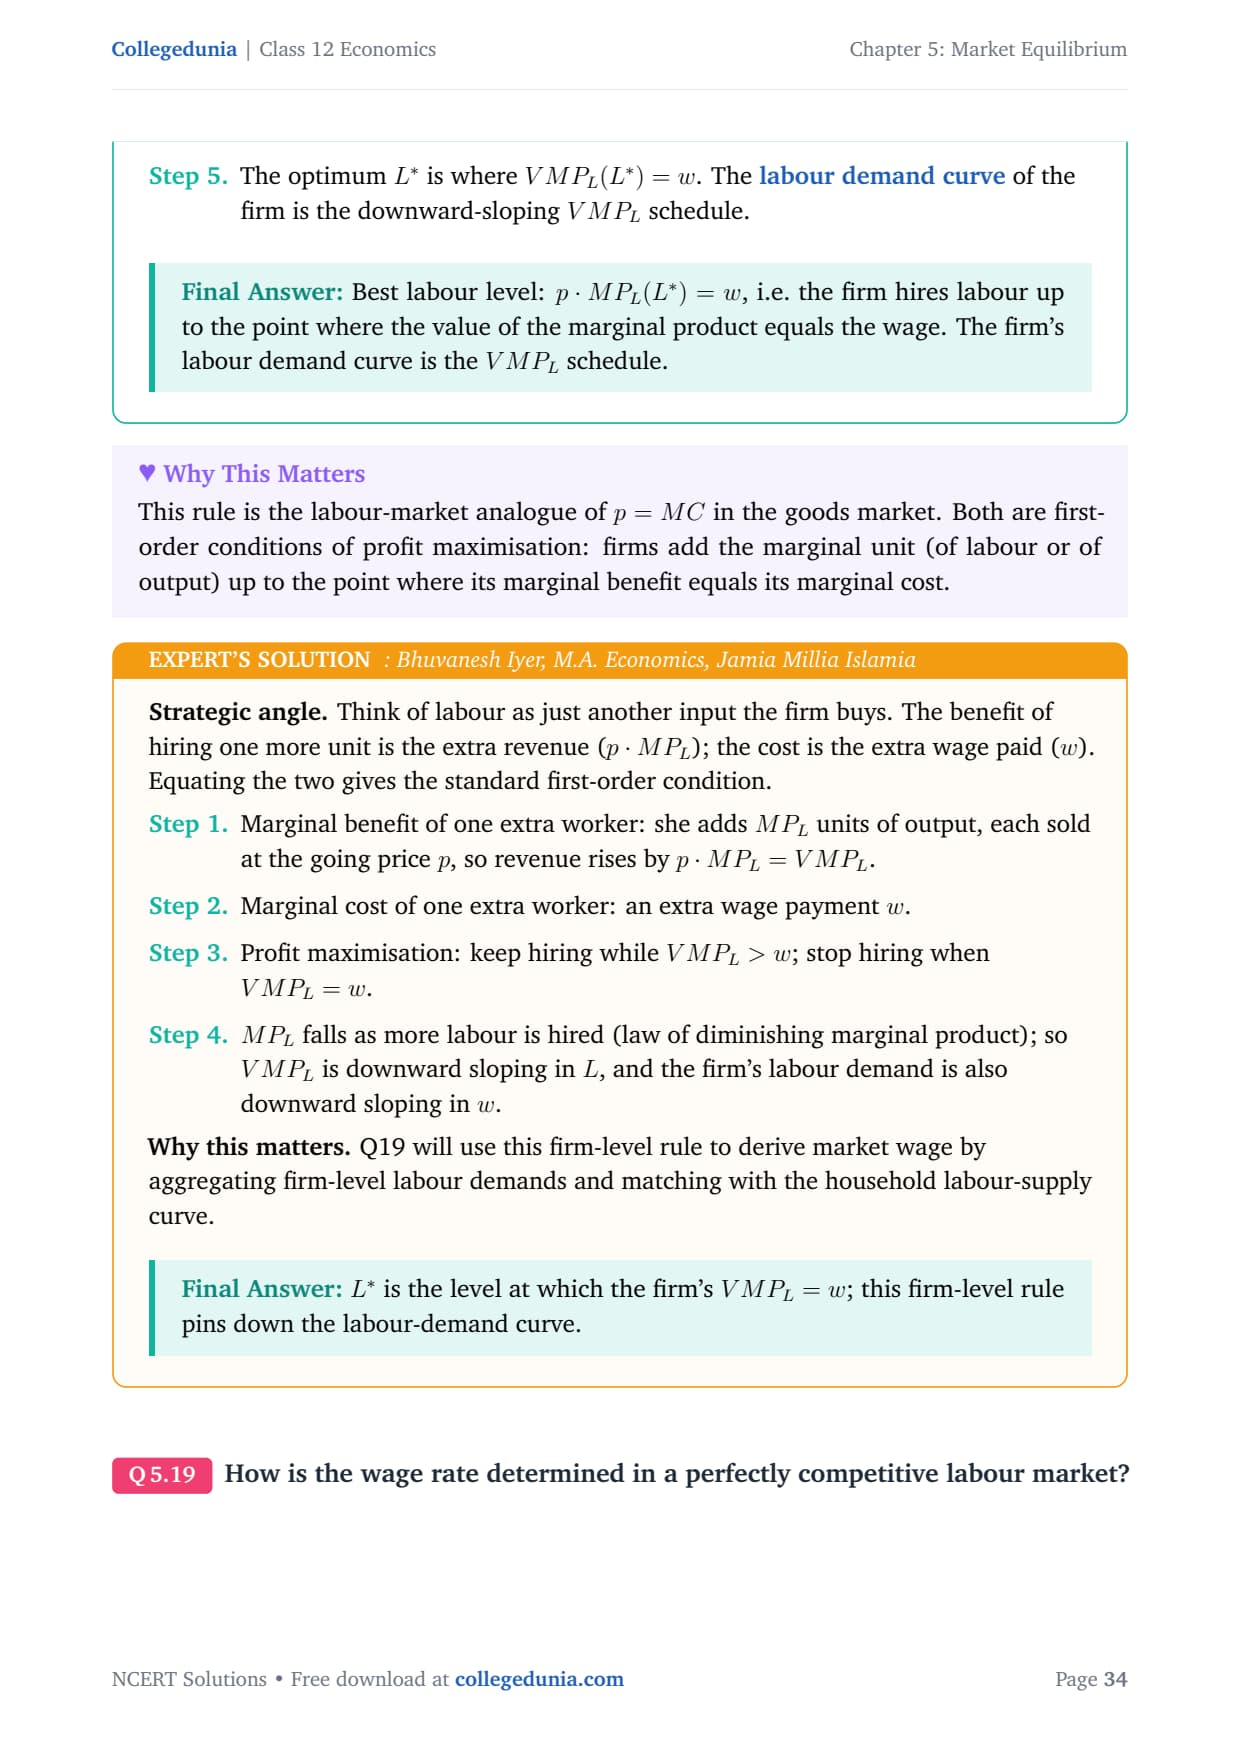
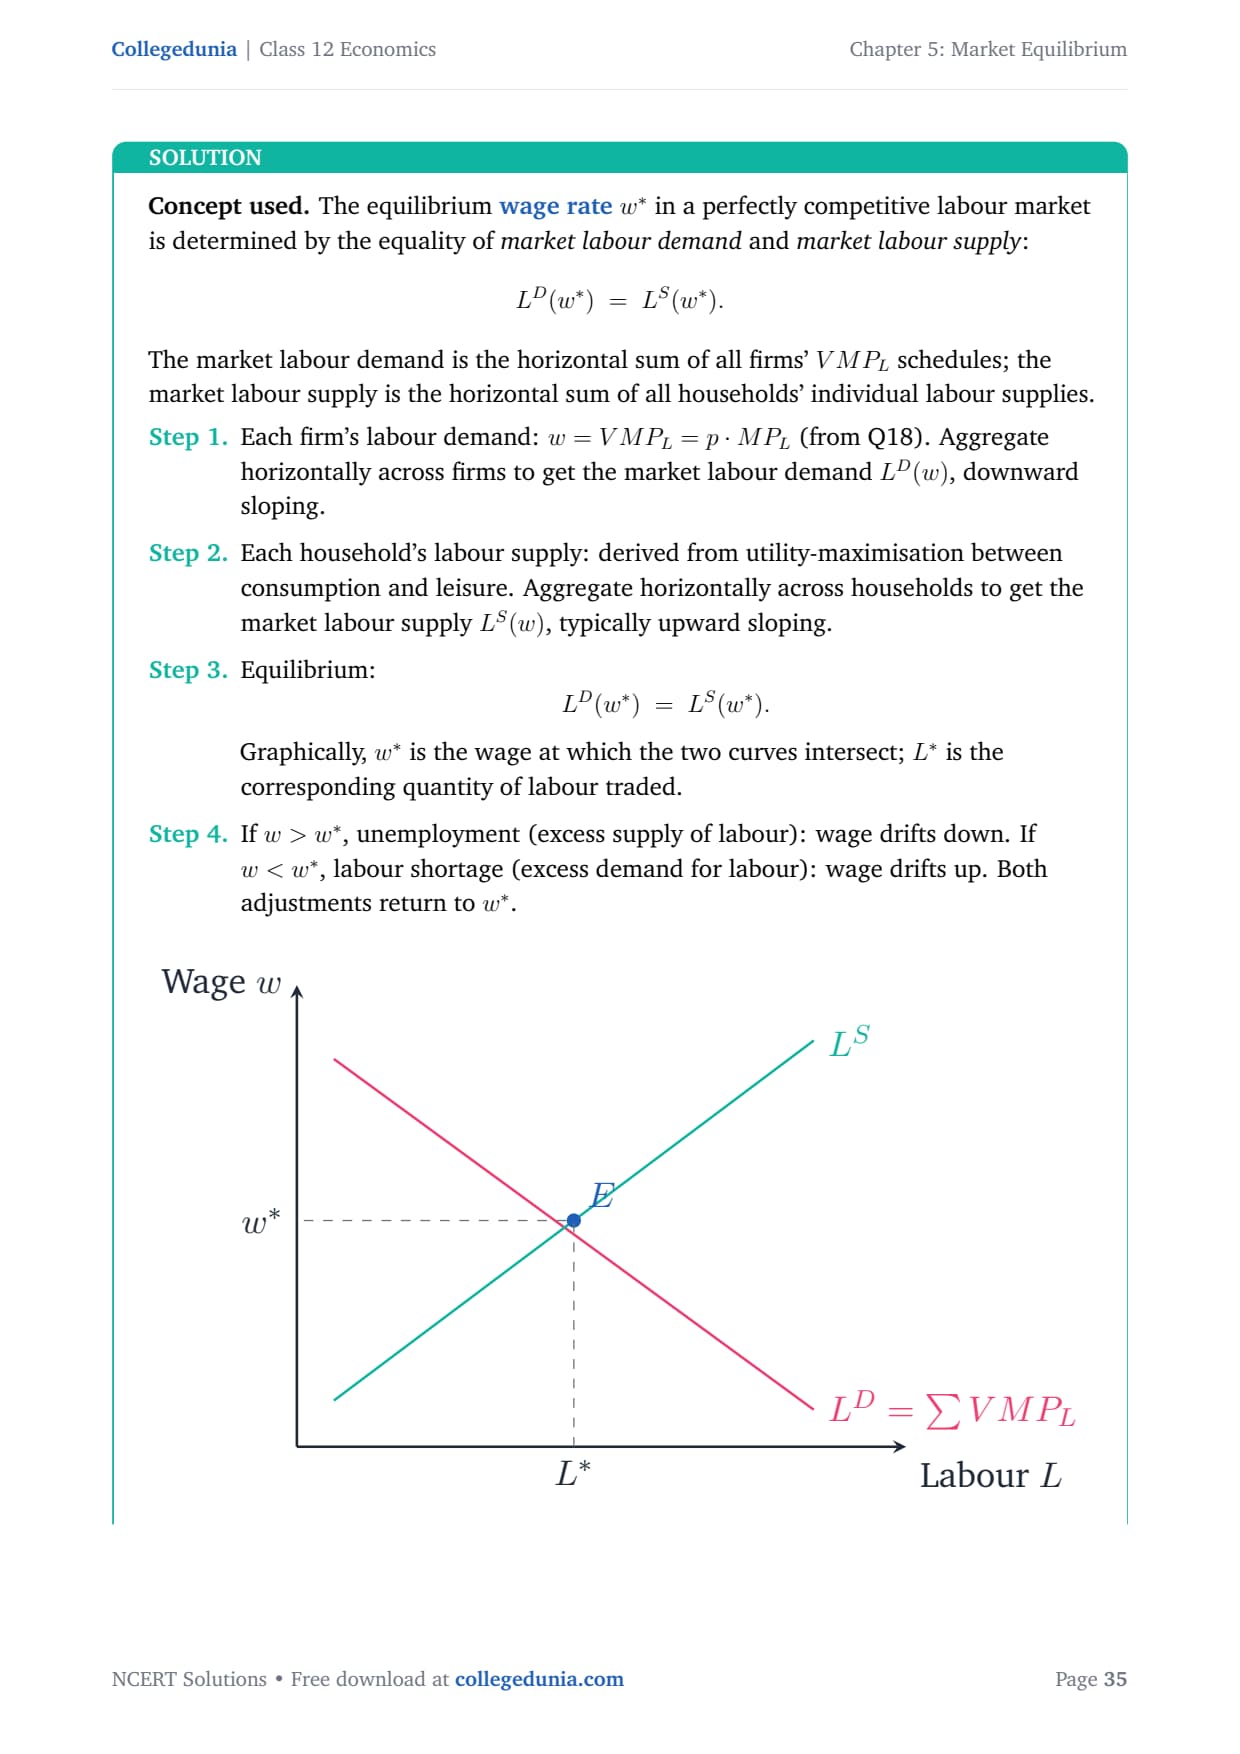
- Wage determination: the labour market clears just like a goods market.
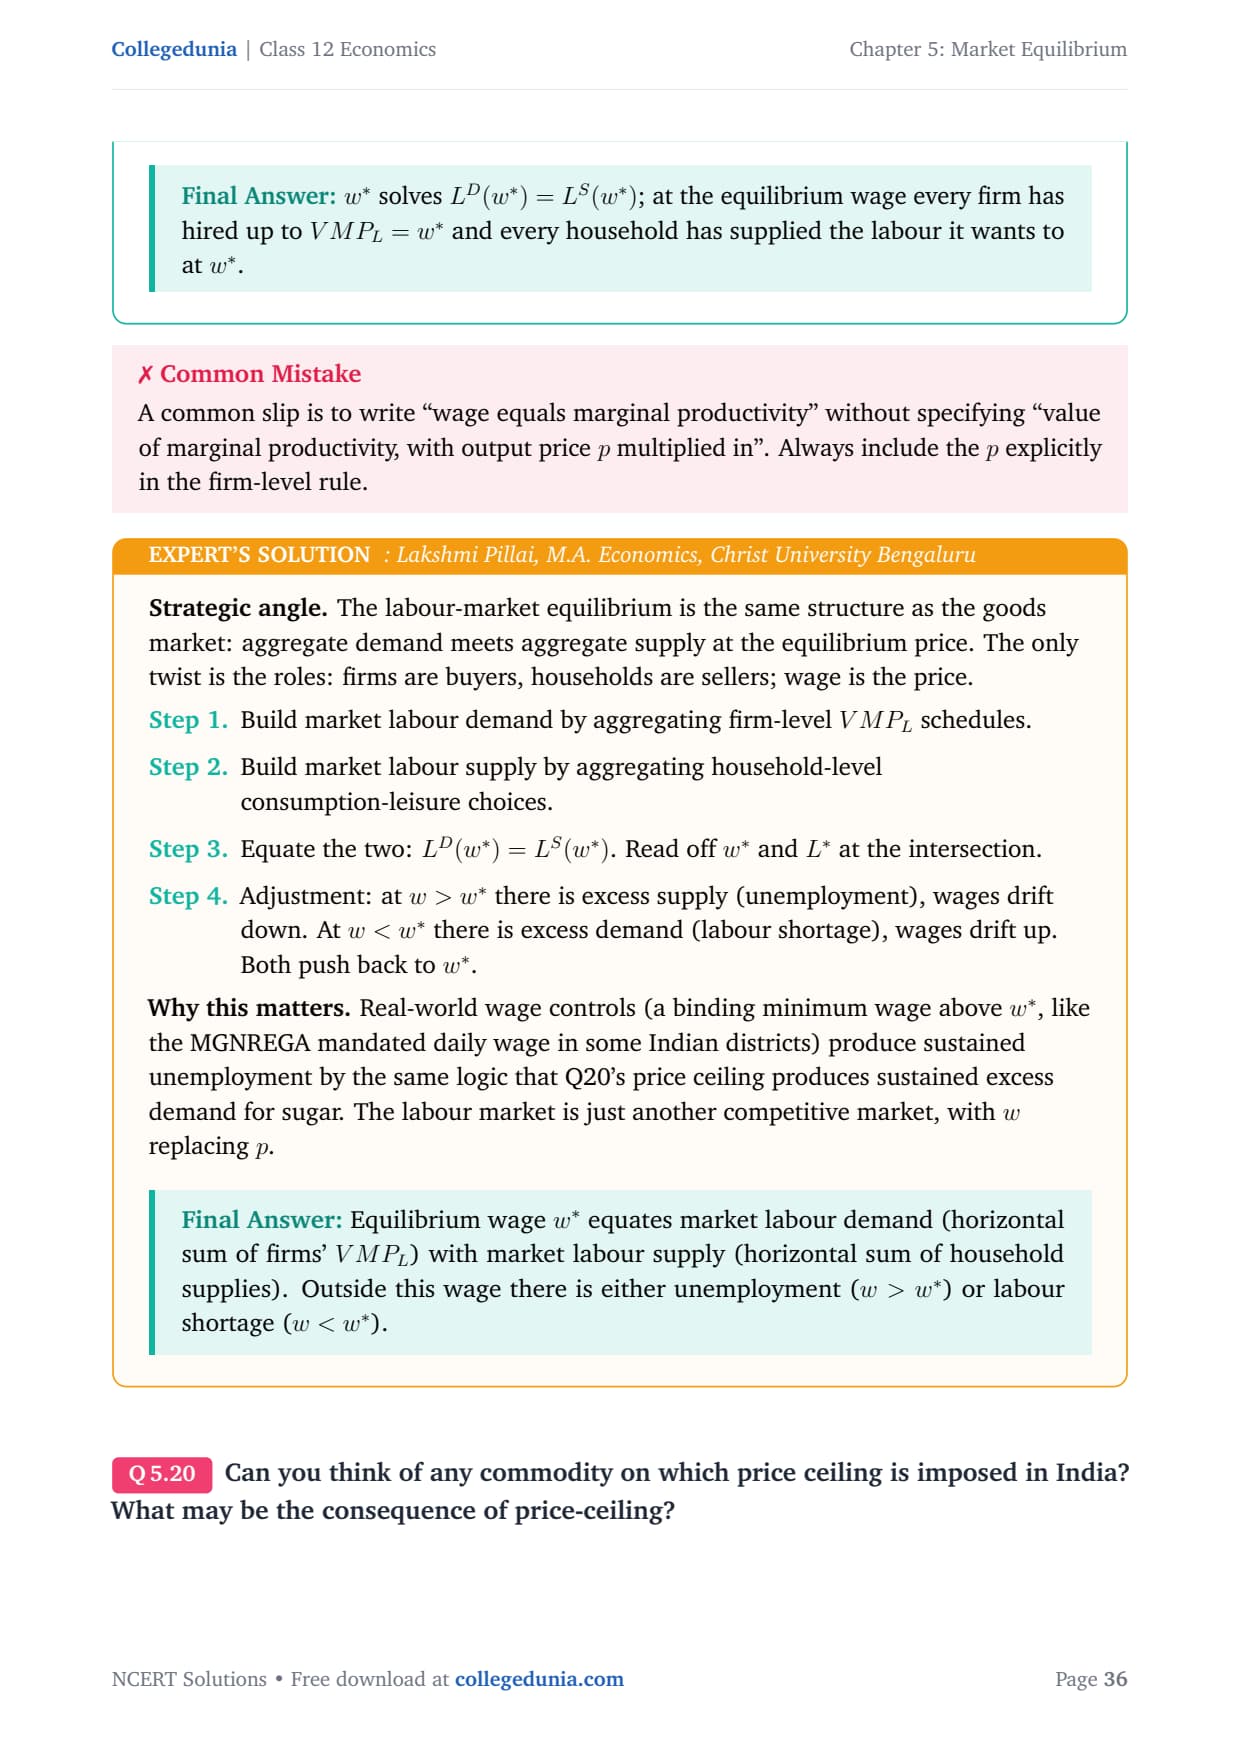
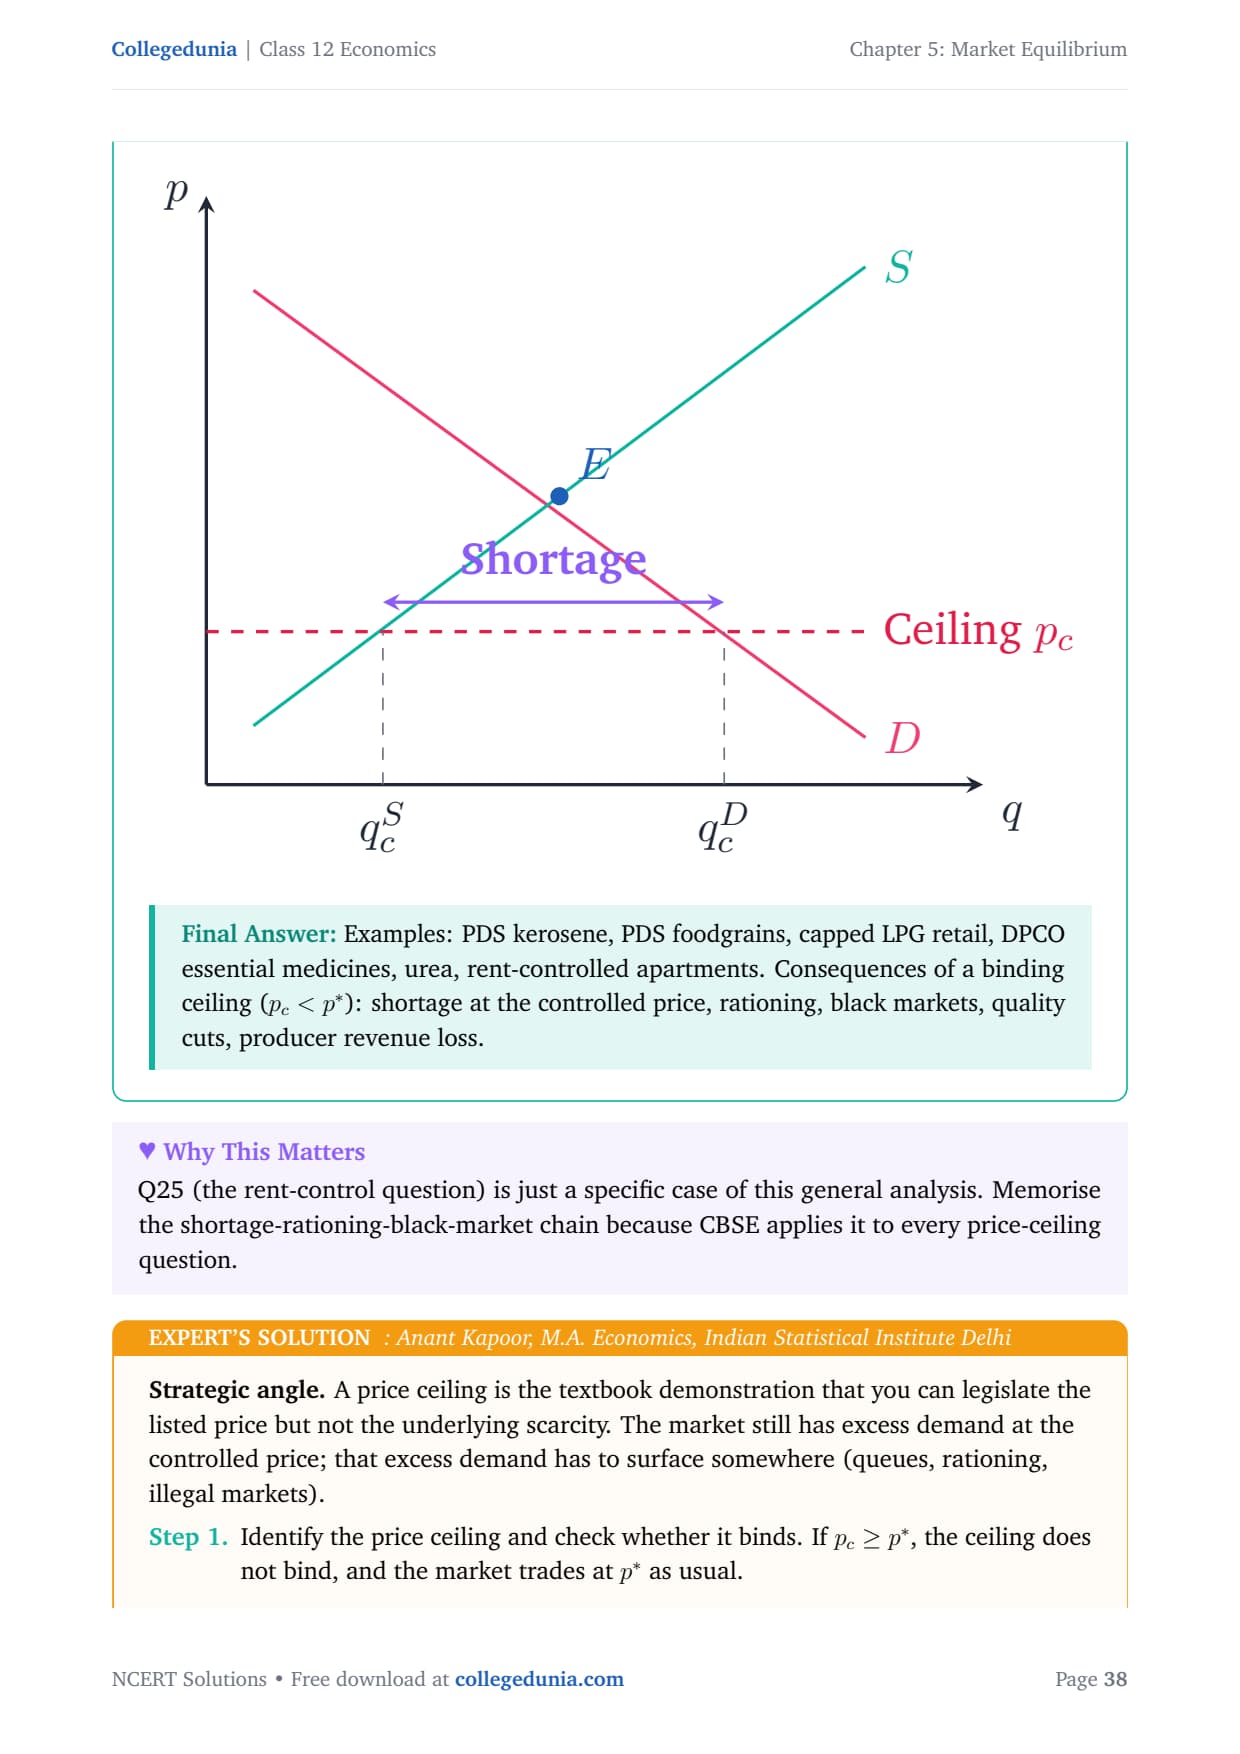
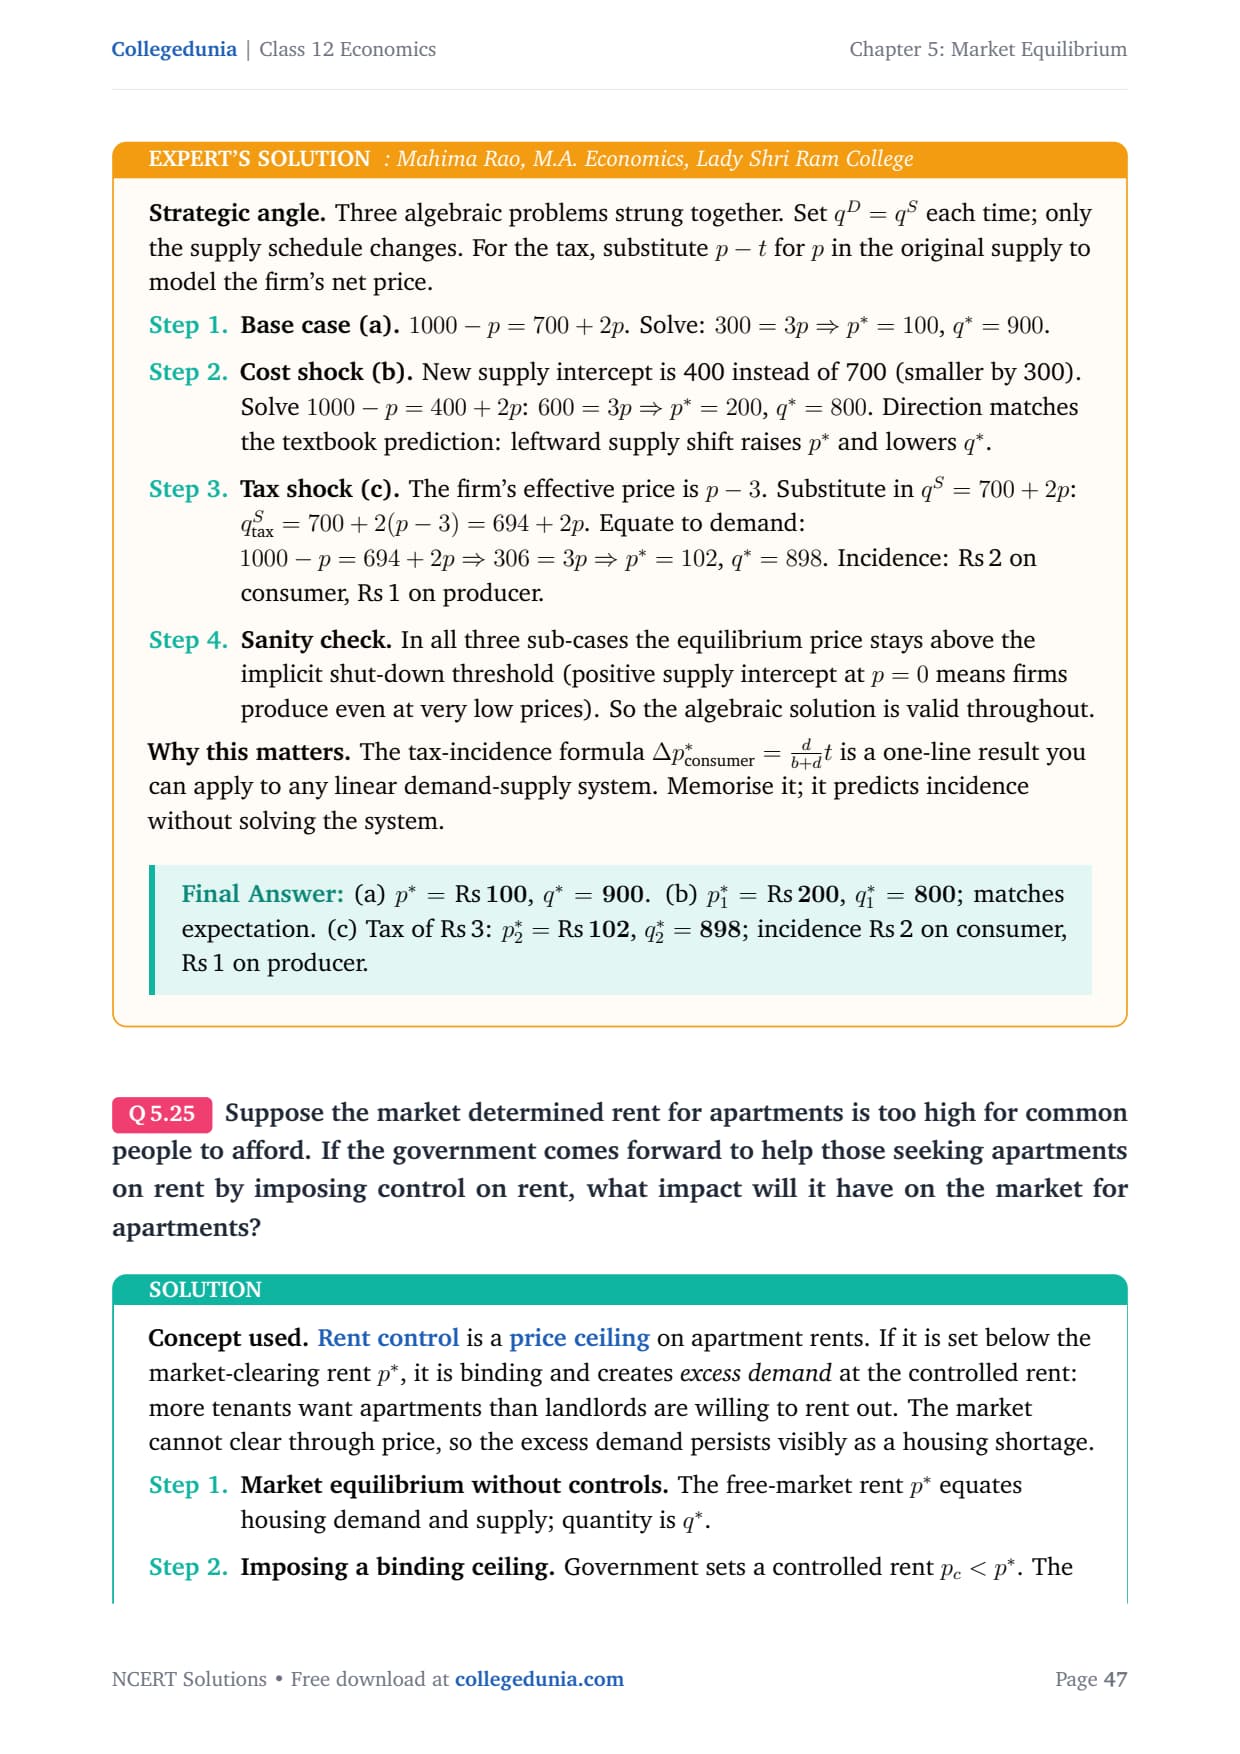
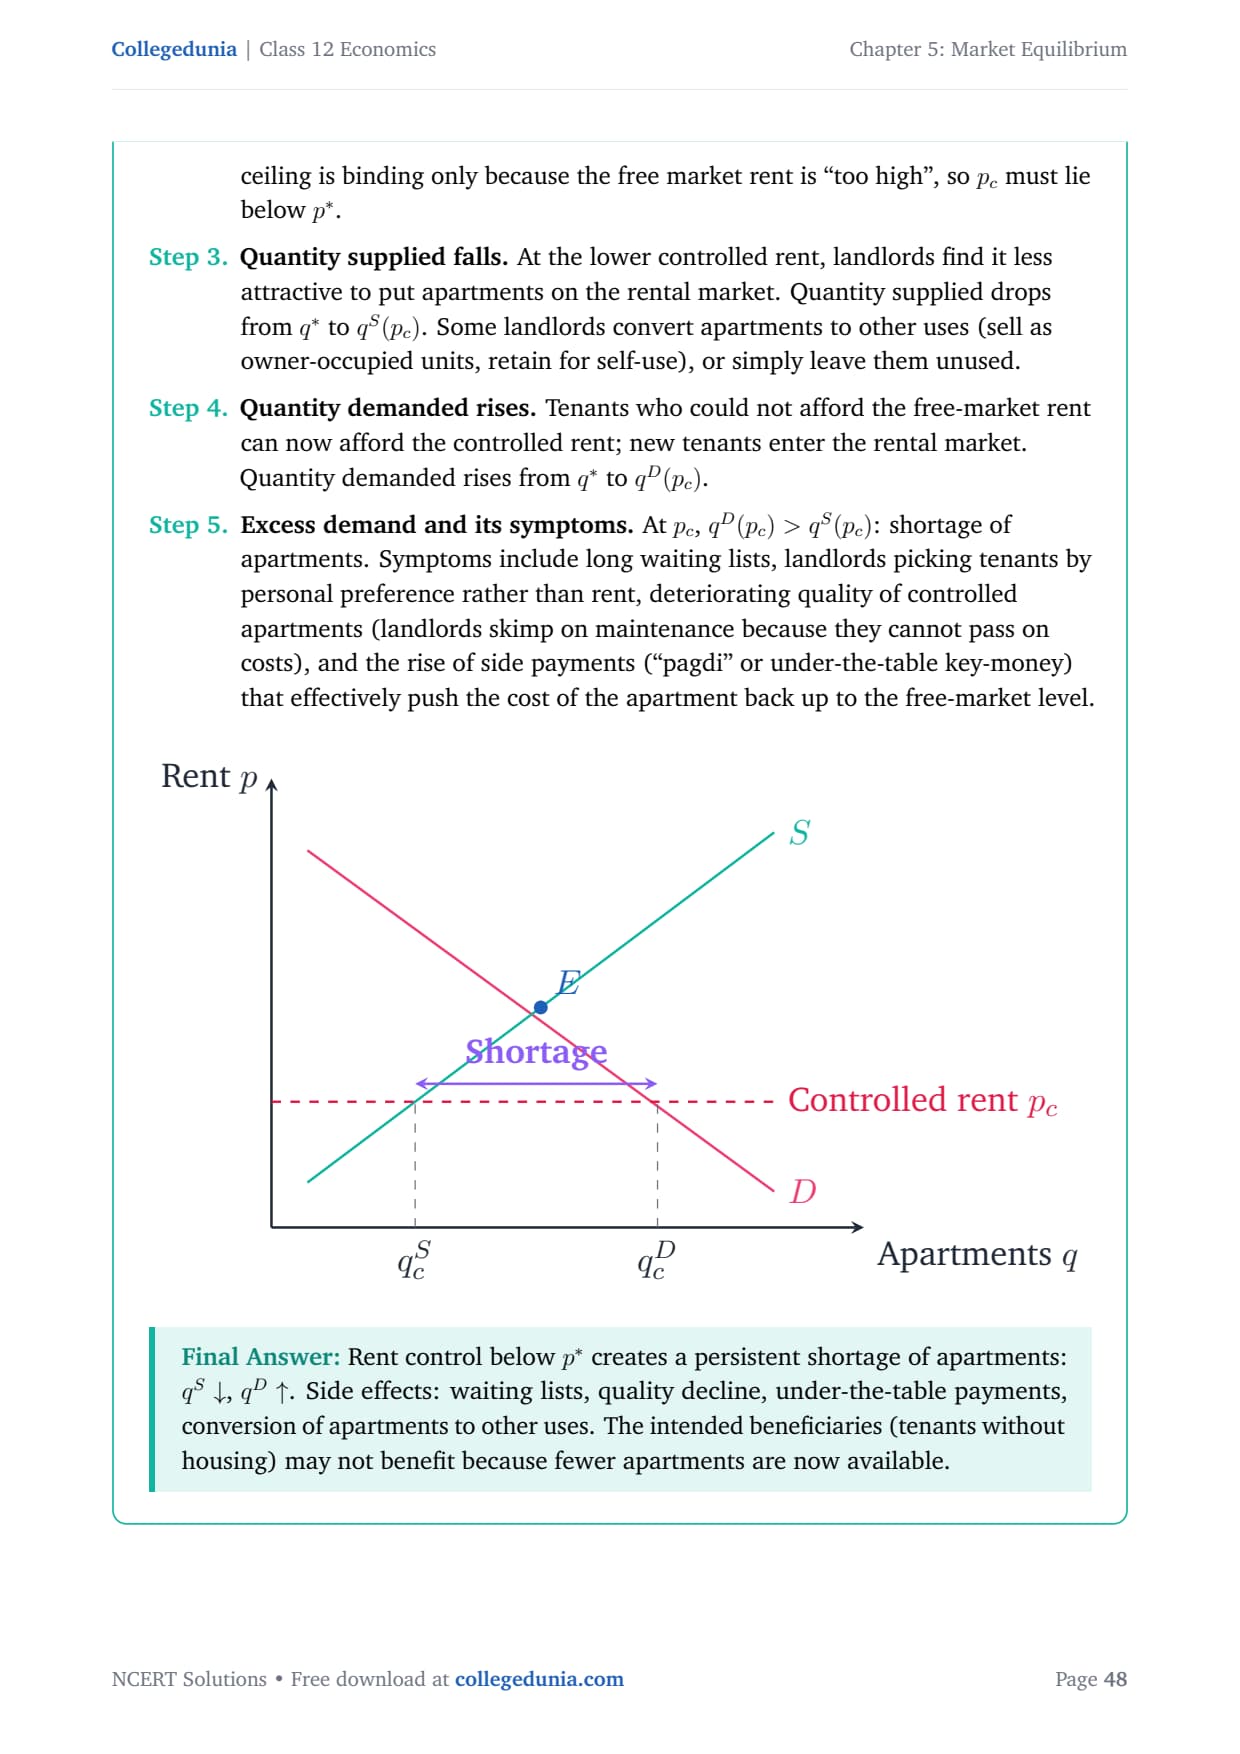
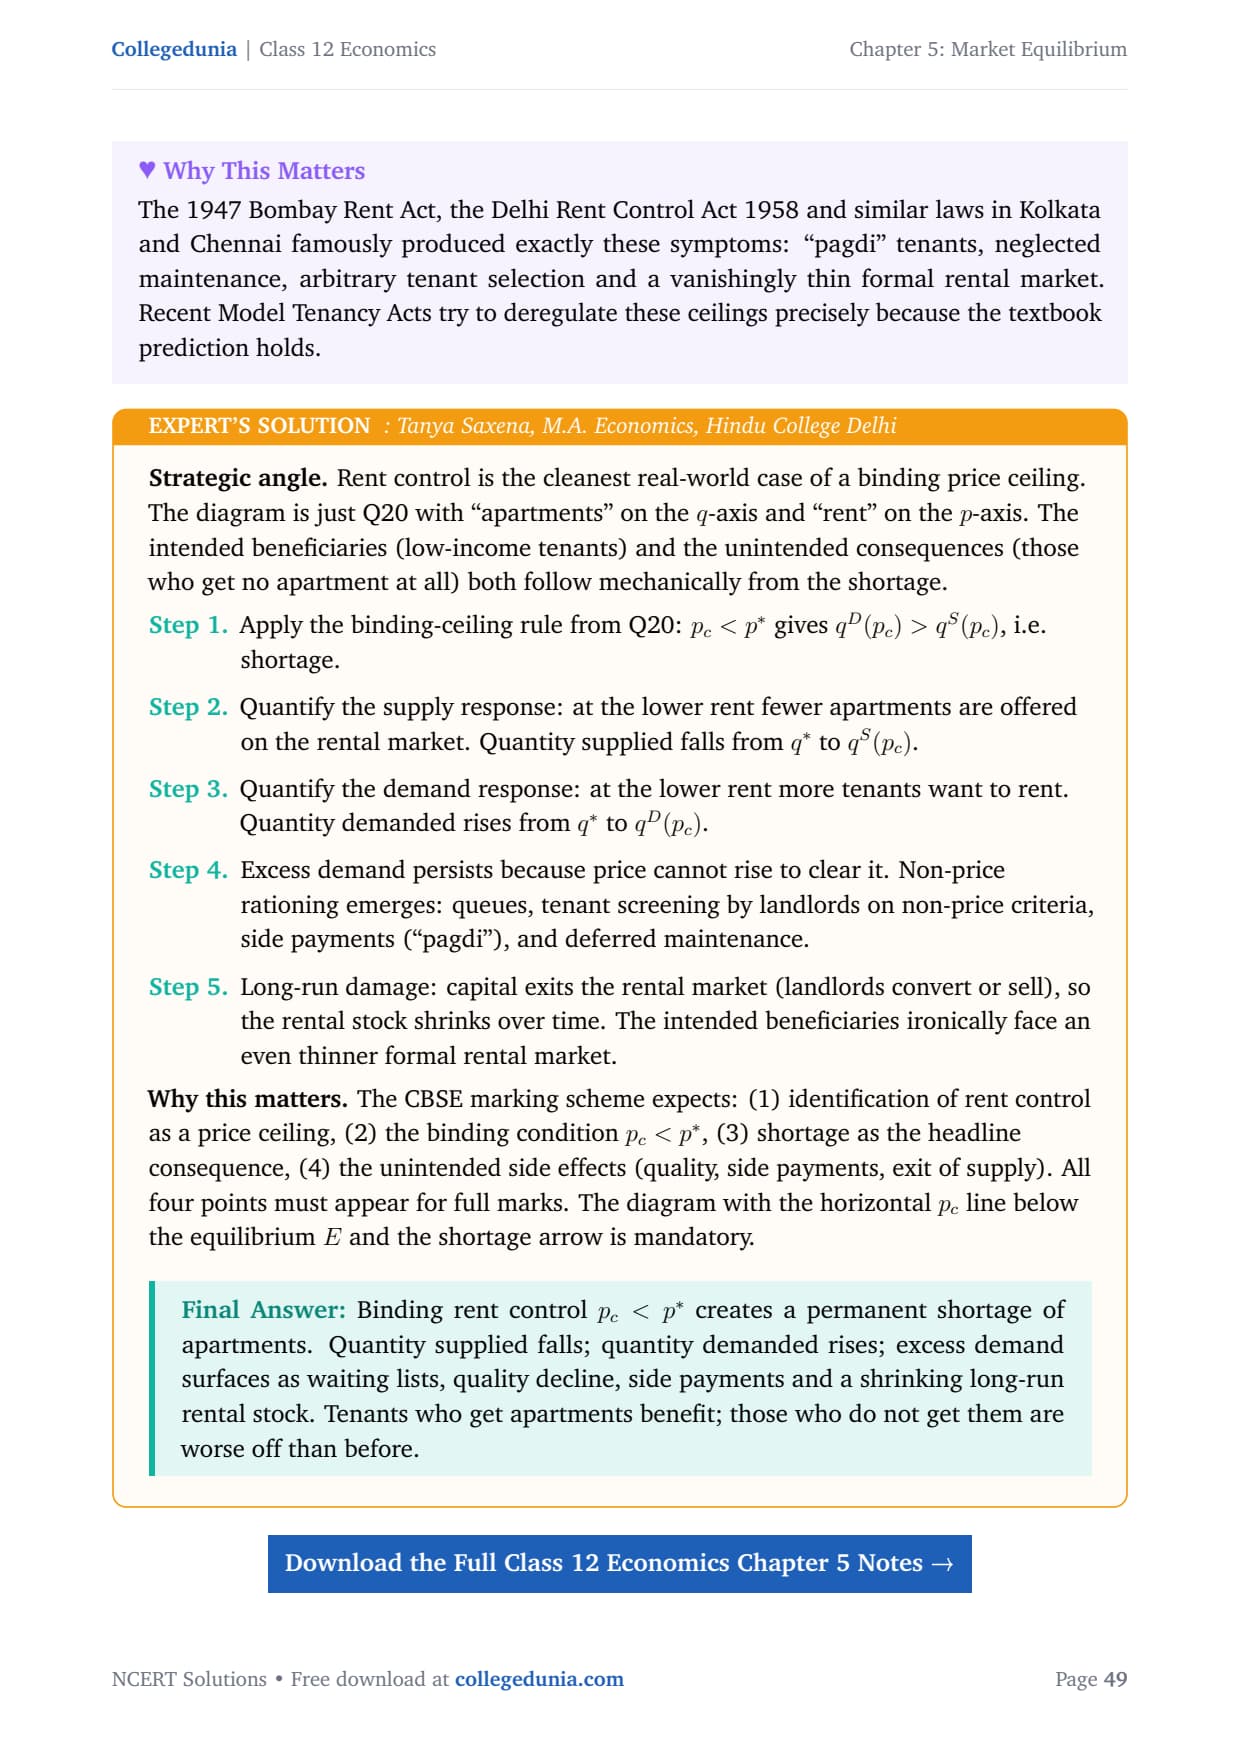
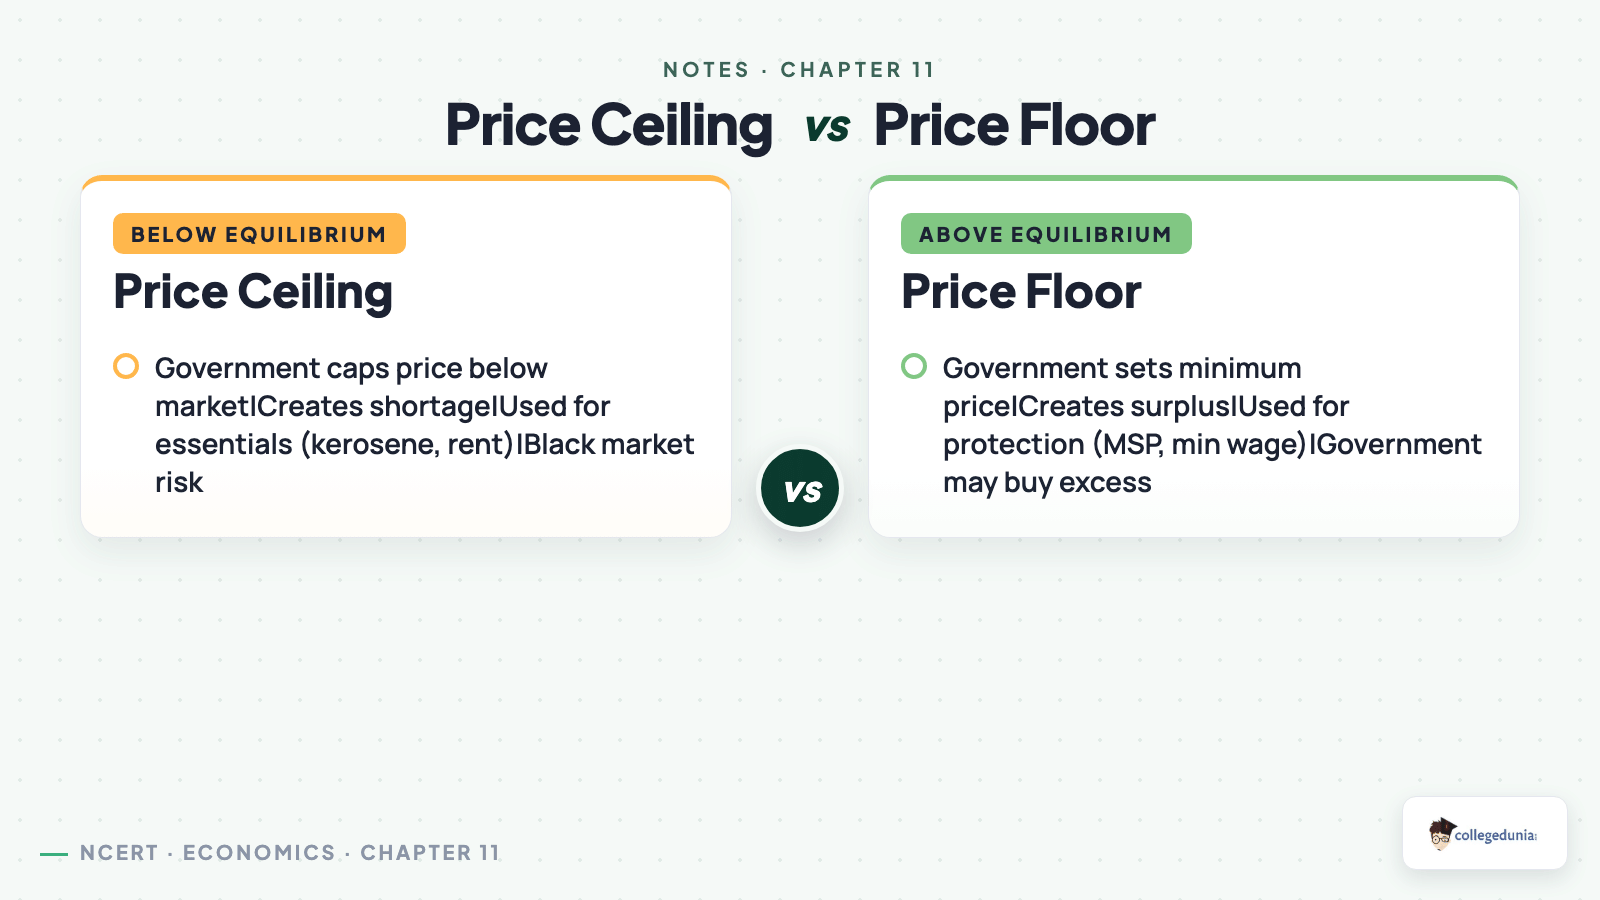
- Price ceiling: a maximum price below equilibrium that causes a shortage.
- Price floor: a minimum price above equilibrium that causes a surplus.
Exercise-wise Breakdown of Market Equilibrium Class 12 NCERT Solutions
The table below maps each NCERT exercise question to its topic and the marks it usually carries in the board paper. Open the full worked set in the question bank.
| Question | Topic | Marks |
|---|---|---|
| Q1 | Equilibrium with a fixed number of firms | 4 |
| Q2 | Meaning of excess demand | 3 |
| Q3 | Meaning of excess supply | 3 |
| Q4 | How price clears excess demand or supply | 4 |
| Q5 | Numerical: qd = 200 − p, qs = 120 + 3p | 4 |
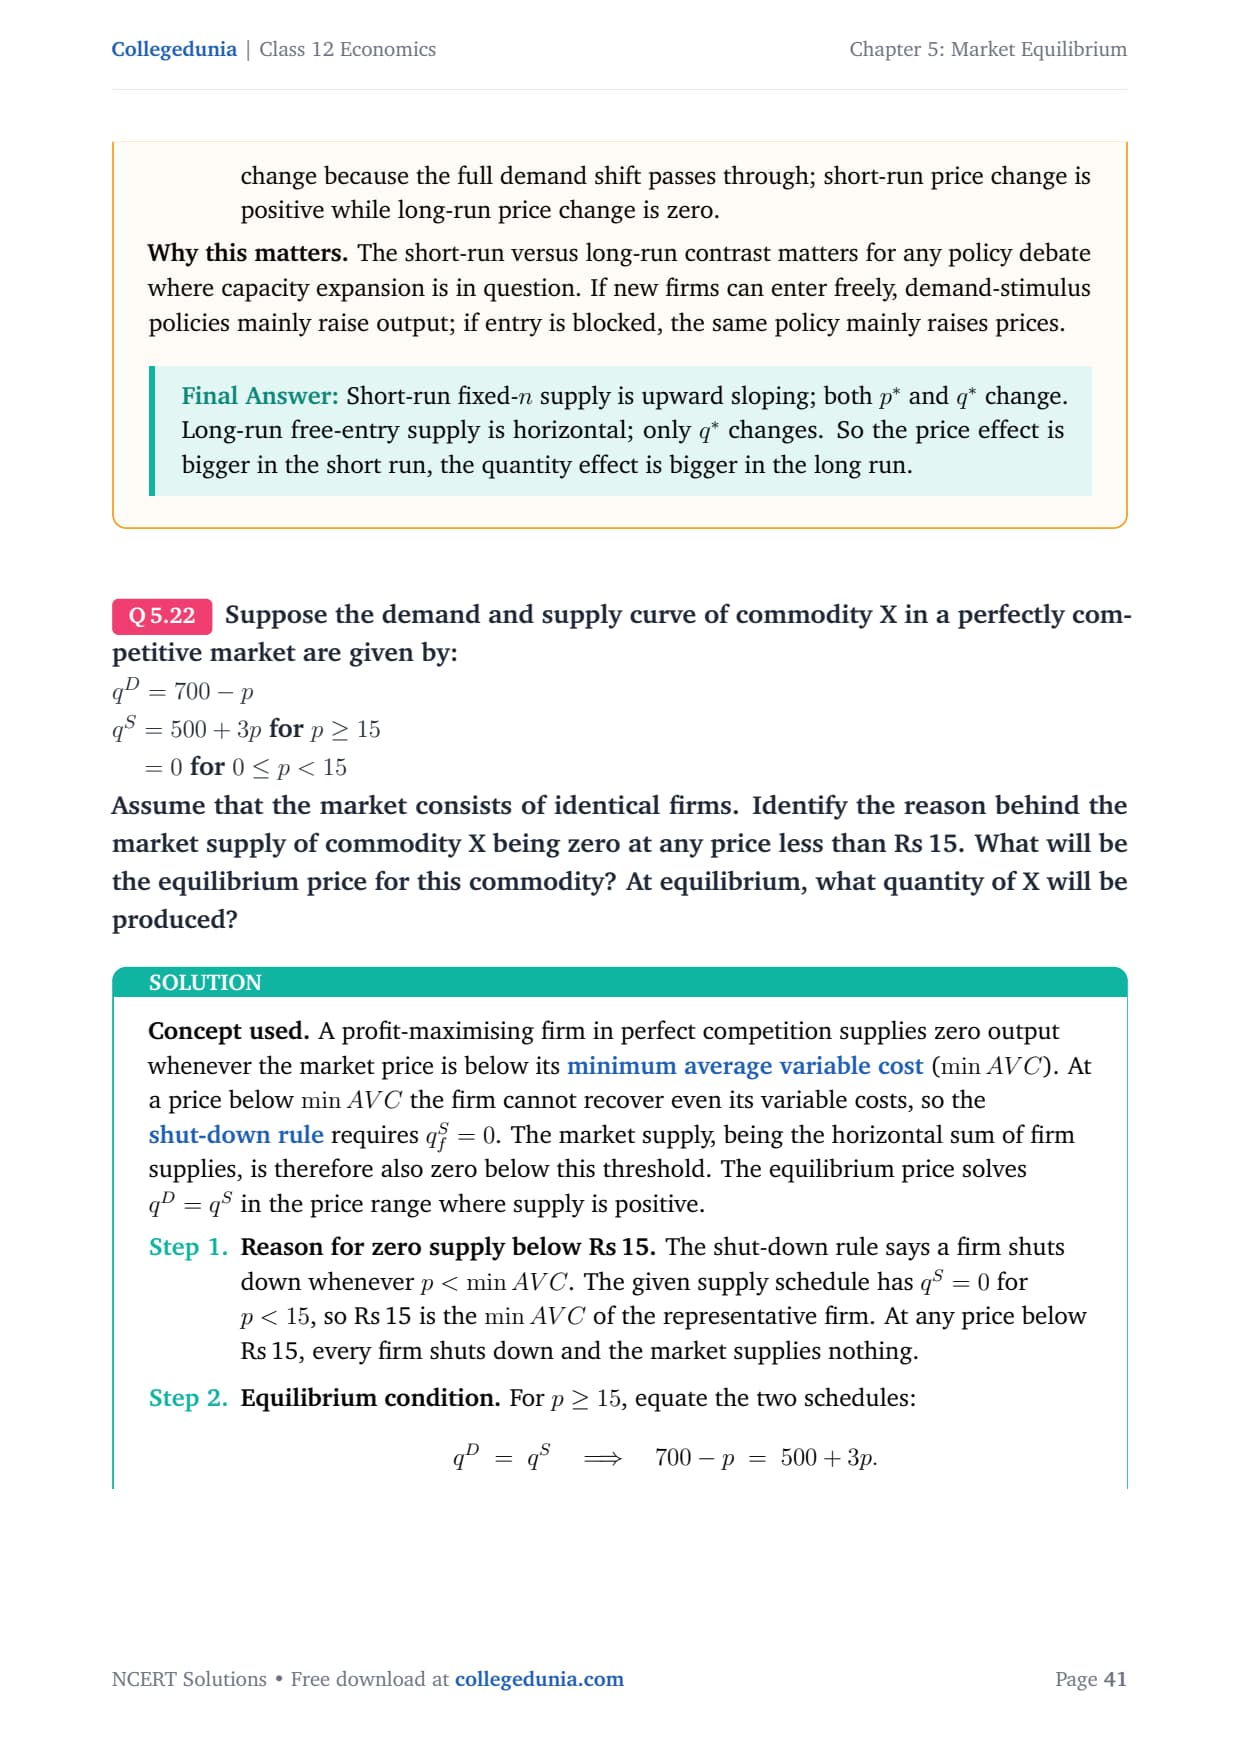
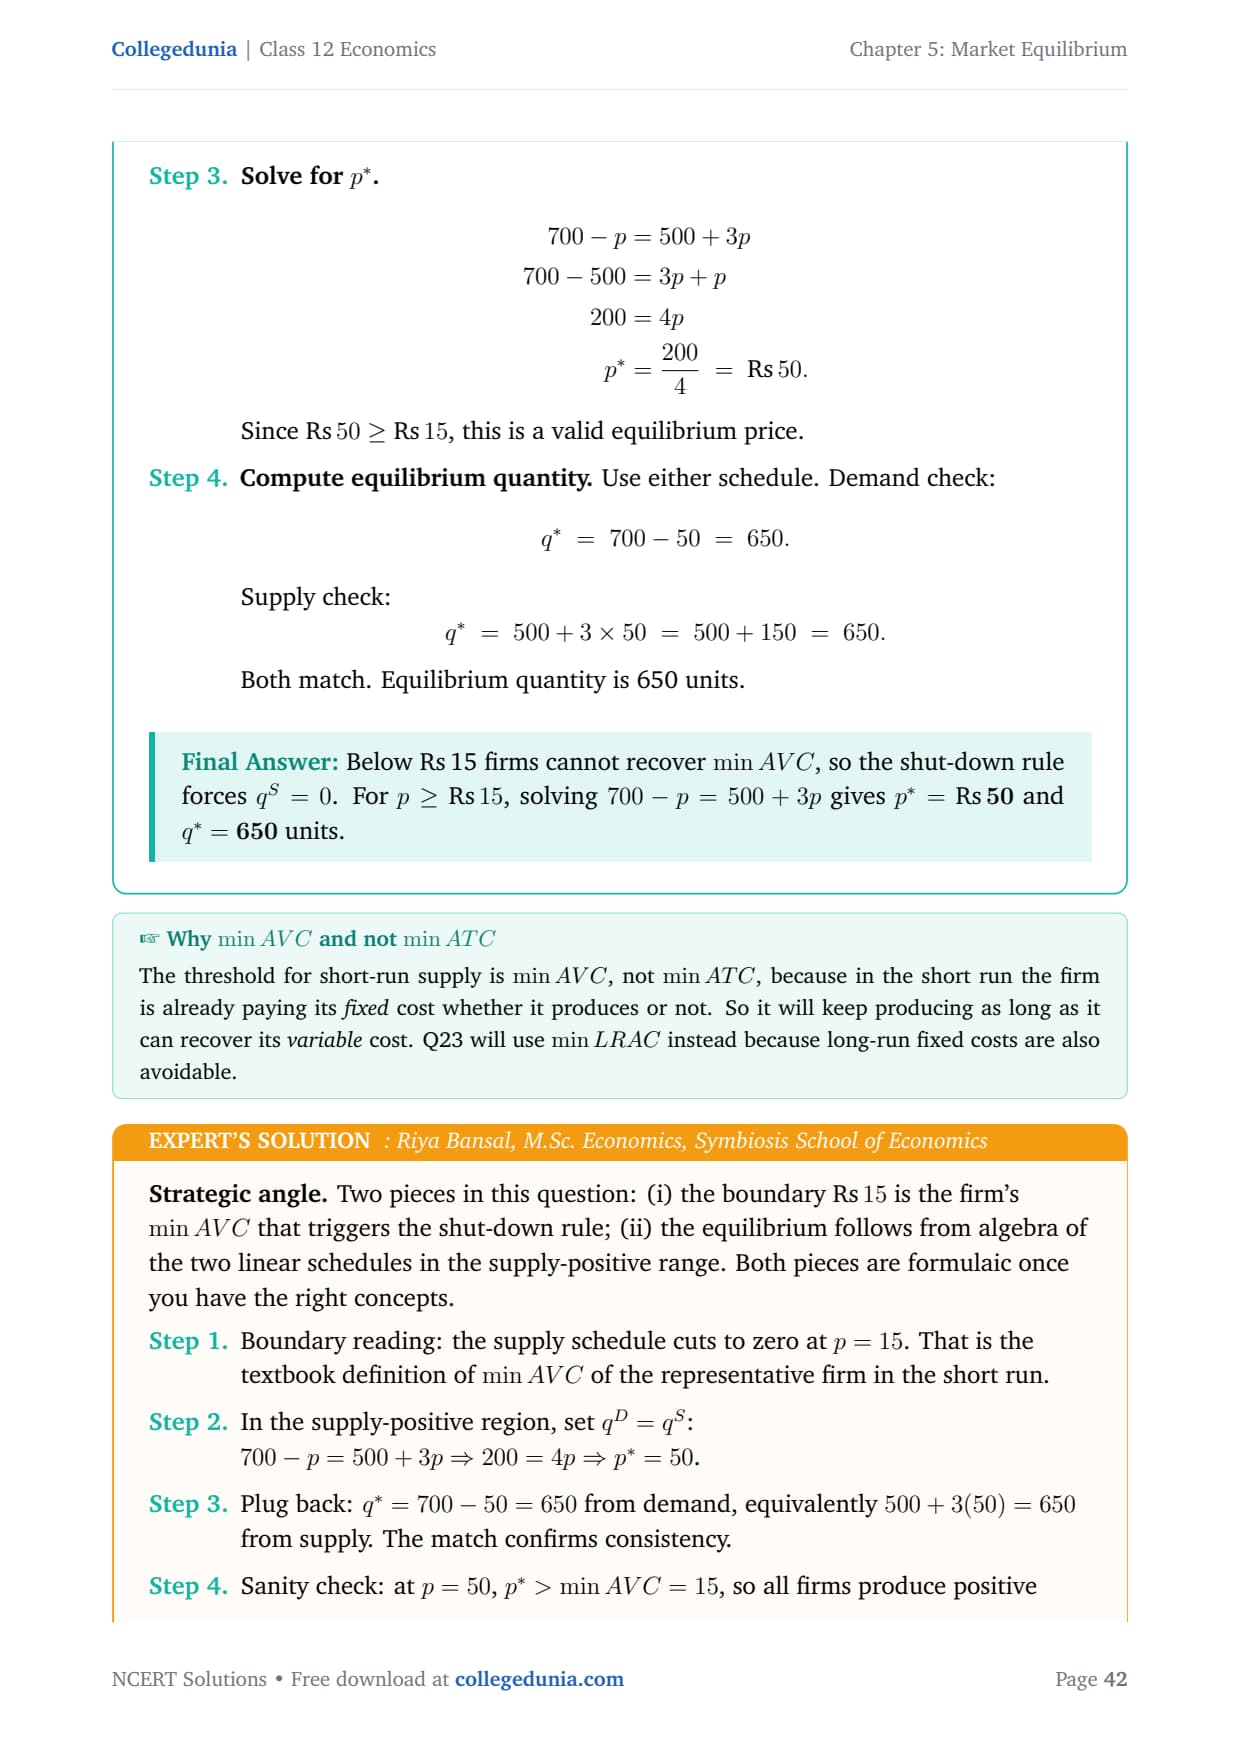
| Q6 | Numerical: qd = 700 − p, qs = 500 + 3p | 4 |
| Q7 | Numerical: qd = 1500 − 3p, qs = 200 + 2p | 4 |
| Q8 | Find the price at which excess demand is 80 units | 4 |
| Q9 | Show excess demand falls to zero at equilibrium | 3 |
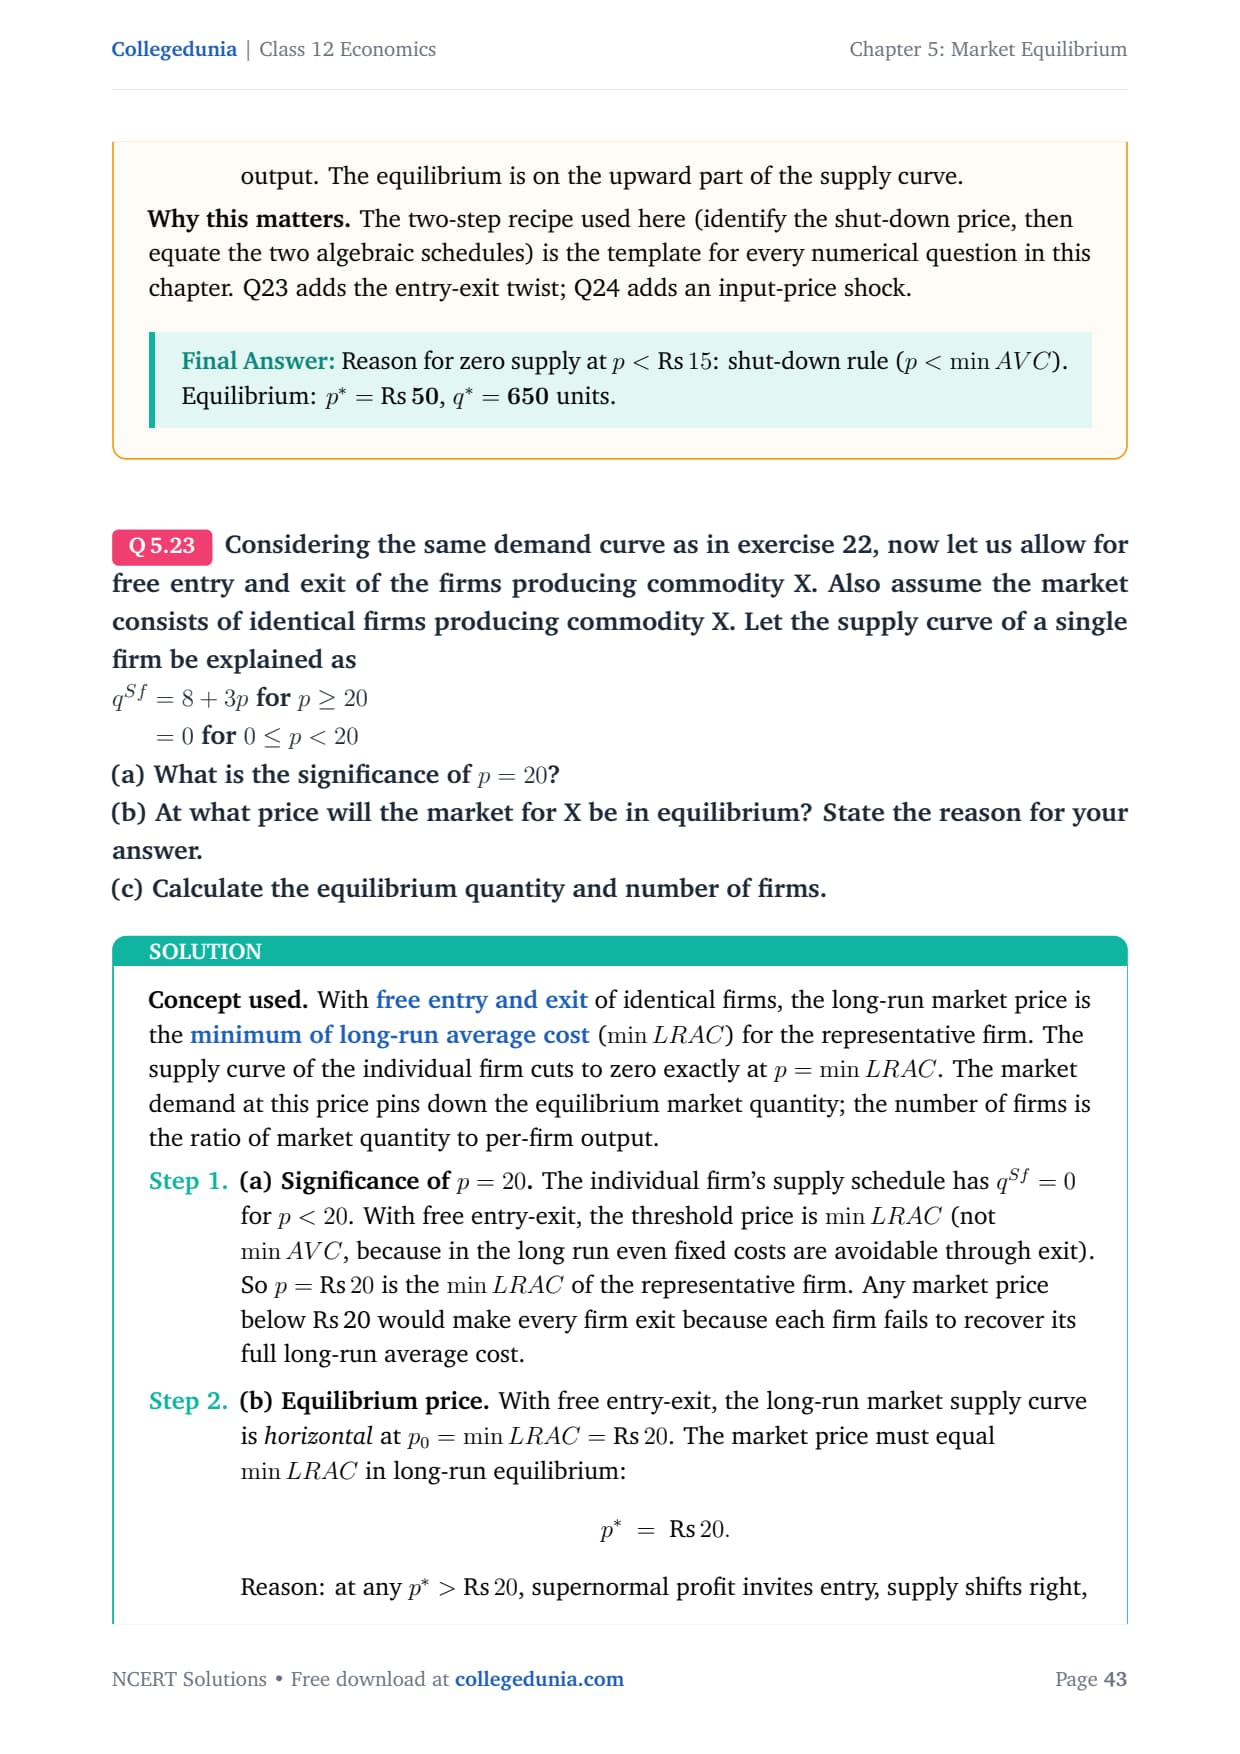
| Q10 | Equilibrium with free entry and exit | 6 |
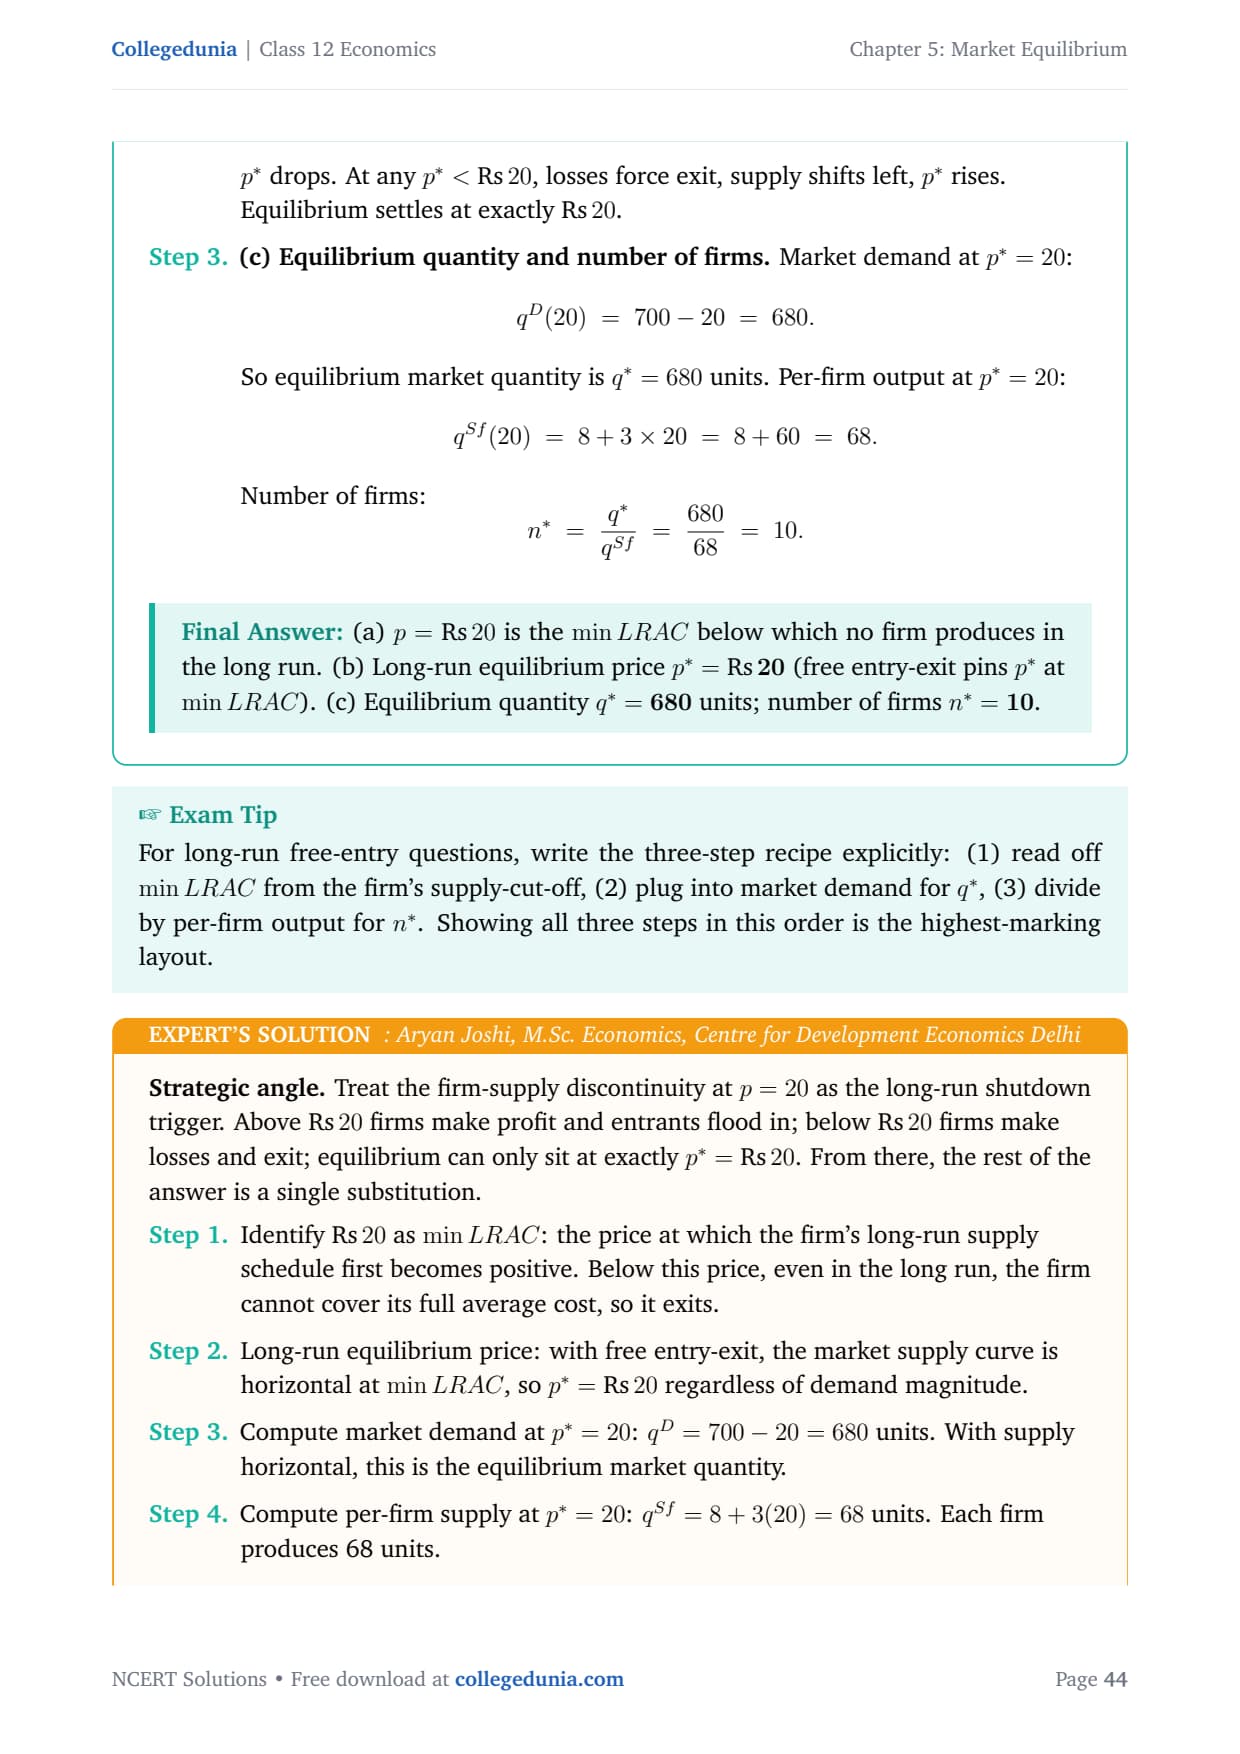
| Q11 | Numerical: free entry, find firms and output | 6 |
| Q12 | How a wage is set in a labour market | 4 |
| Q13 | Numerical on equilibrium wage and employment | 6 |
| Q14 | Effect of a rise in demand on p* and q* | 3 |
| Q15 | Effect of a rise in supply on p* and q* | 3 |
| Q16 | Both demand and supply rise together | 4 |
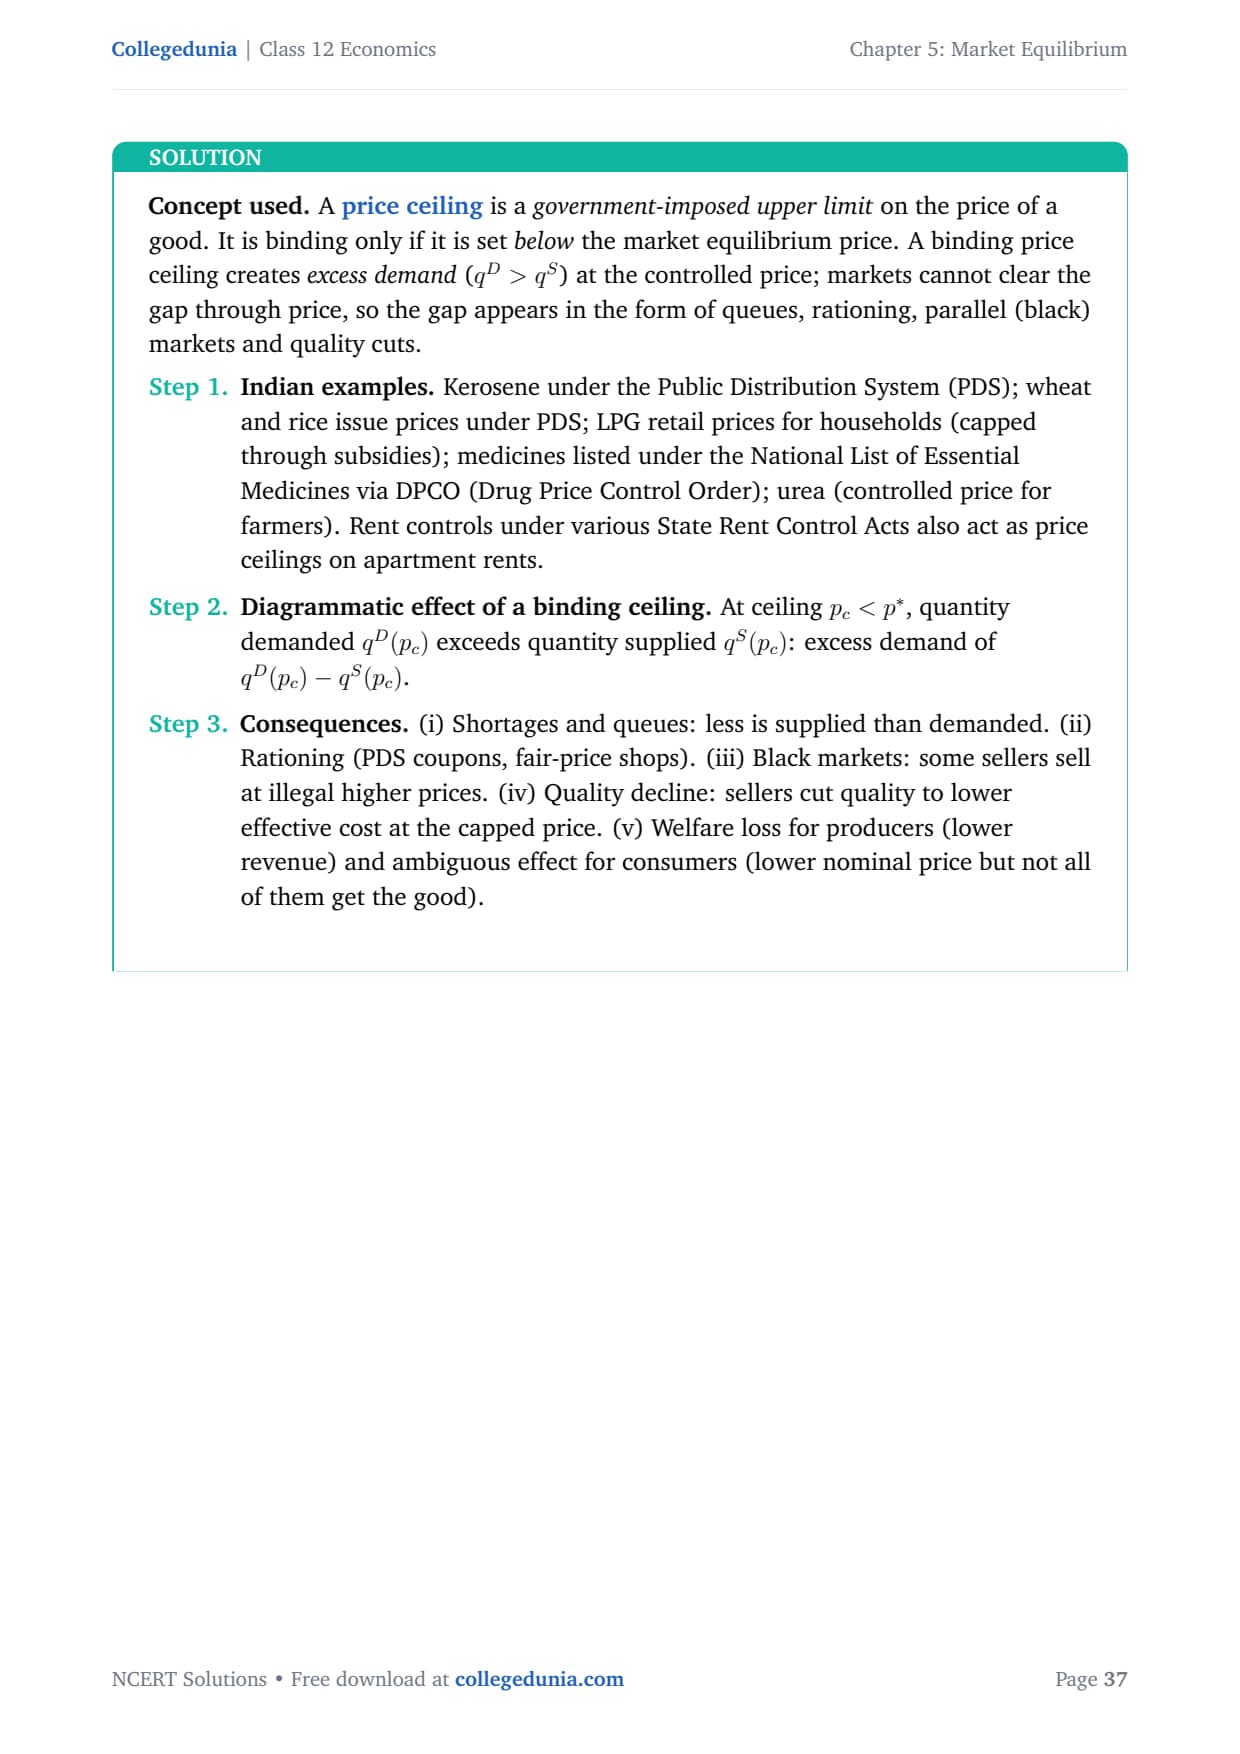
| Q17 | Price ceiling: diagram and effects | 4 |
| Q18 | Price floor: diagram and effects | 4 |
| Q19 | Numerical: shortage under a price ceiling | 4 |
| Q20 | Numerical: surplus under a price floor | 4 |
The numericals Q5, Q6, Q7, Q11 and Q13 carry the most marks, so they are the part to drill first.
Solve Class 12 Economics Chapter 5 Questions
Practice every NCERT exercise question with Check Solution and Expert Solution tabs that show the full working on click.
Open Question BankMarket Equilibrium Class 12 Video Lesson
Source: Magnet Brains on YouTube
Market Equilibrium Class 12: Key Concepts and Formulas
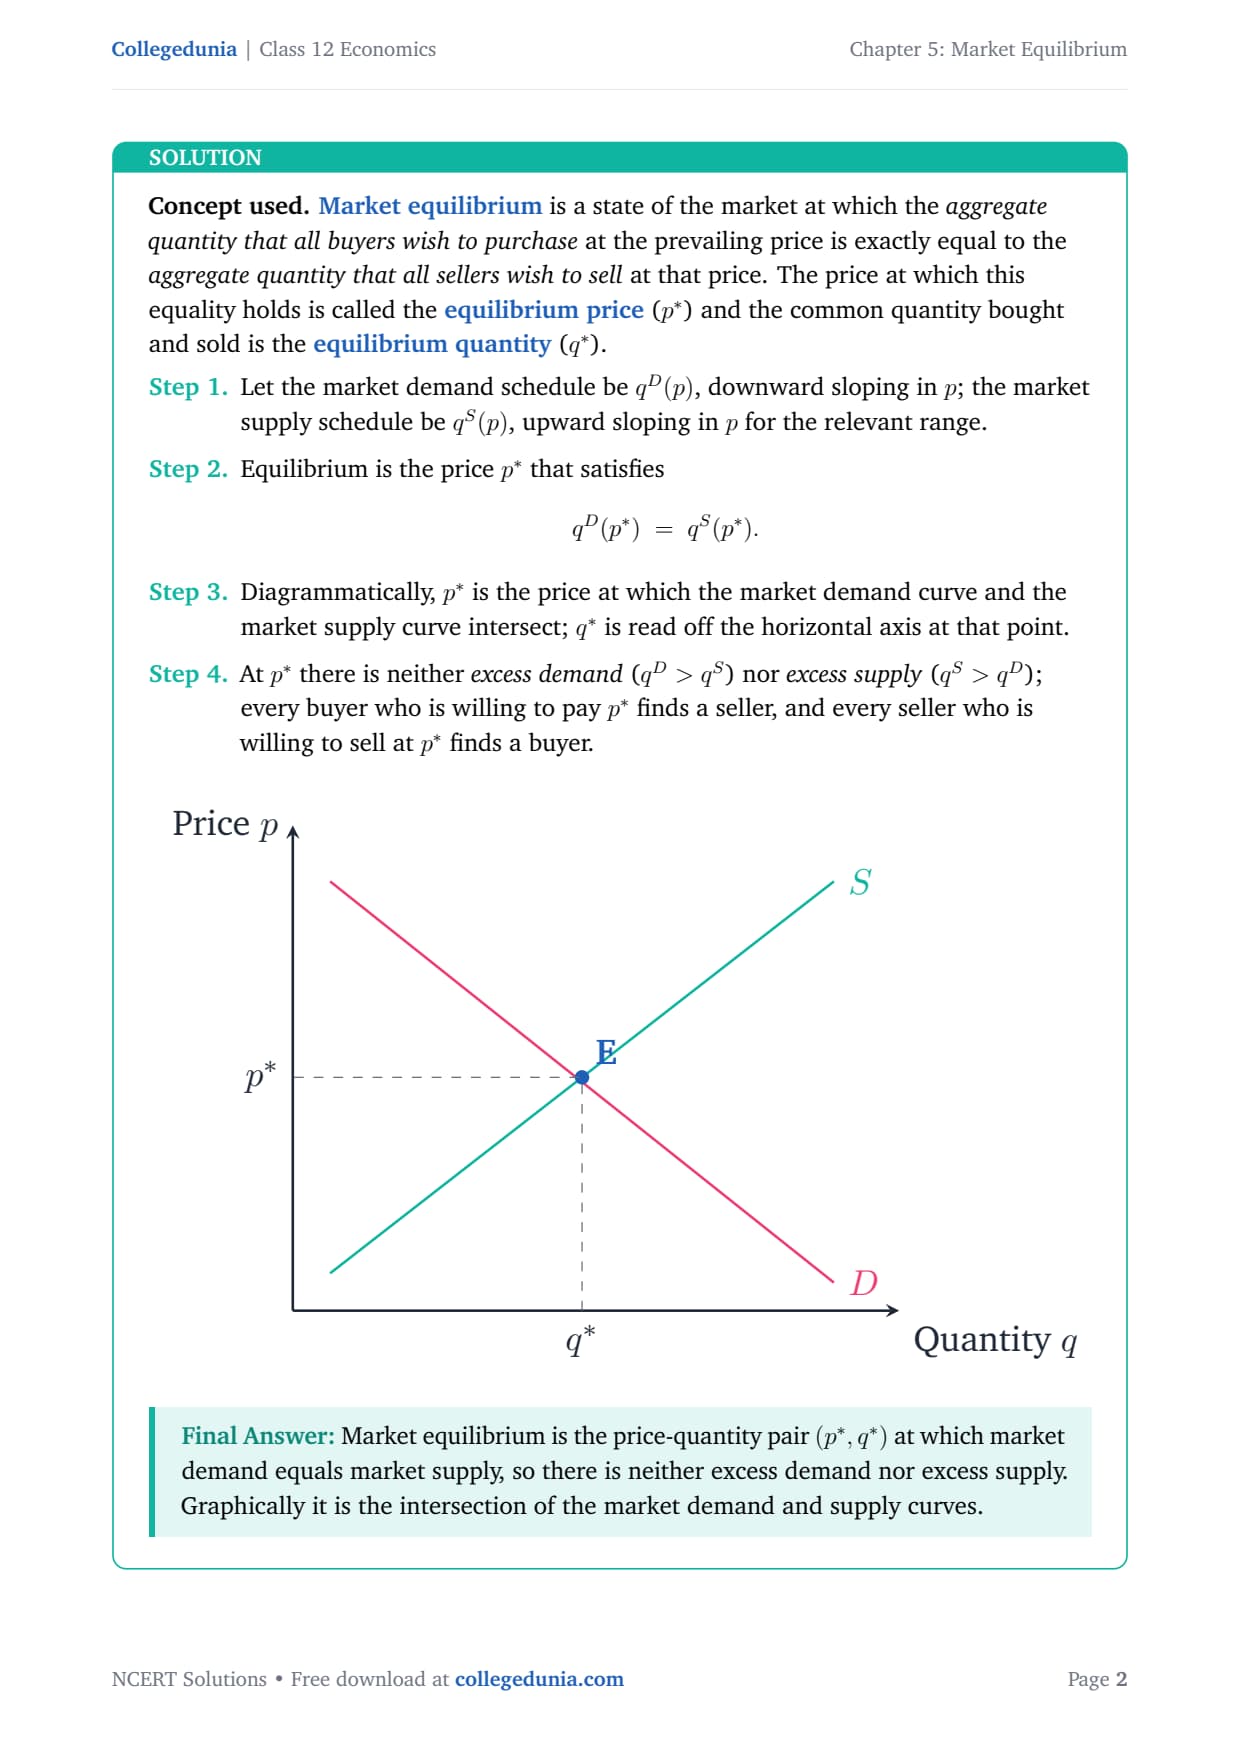
Most questions in this chapter come back to a few simple ideas. Equilibrium is the price-quantity pair (p*, q*) where the quantity demanded equals the quantity supplied:
qd(p*) = qs(p*)
To solve, set the demand and supply equations equal, find p*, then put p* back into either equation to get q*. The table below sums up the five equilibrium cases and what fixes the quantity in each.
| Case | Condition | What sets the quantity |
|---|---|---|
| Fixed firms | qd(p*) = qs(p*) | Where demand meets supply |
| Free entry/exit | p* = min AC; profit = 0 | Demand at p* = min AC |
| Labour market | wd = ws | Where labour demand meets supply |
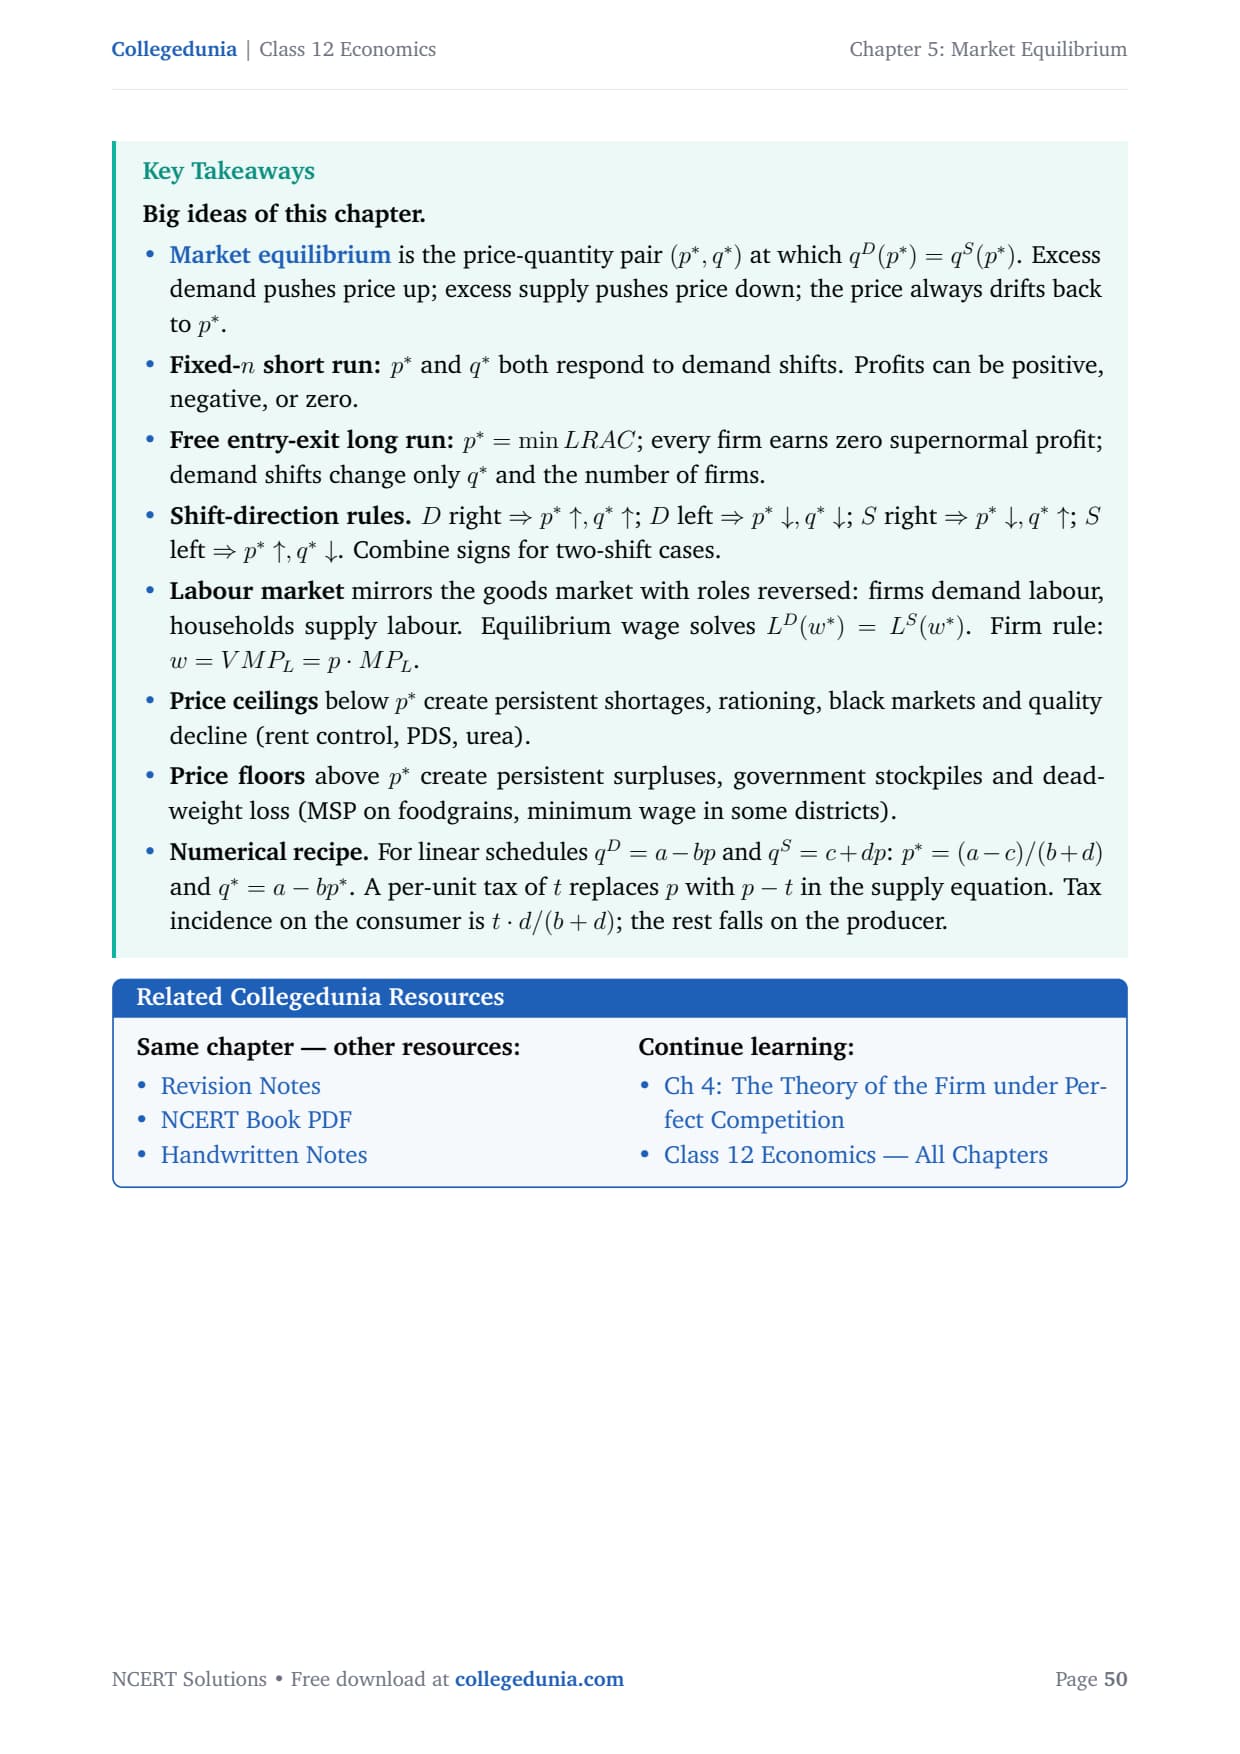
| Price ceiling | pc < p* | Supply at the ceiling price |
| Price floor | pf > p* | Demand at the floor price |
Use this quick formula sheet in the last 30 minutes before the exam:
| Concept | Formula |
|---|---|
| Linear demand and supply | qd = a − bp, qs = c + dp |
| Equilibrium price | p* = (a − c) / (b + d) |
| Equilibrium quantity | q* = (ad + bc) / (b + d) |
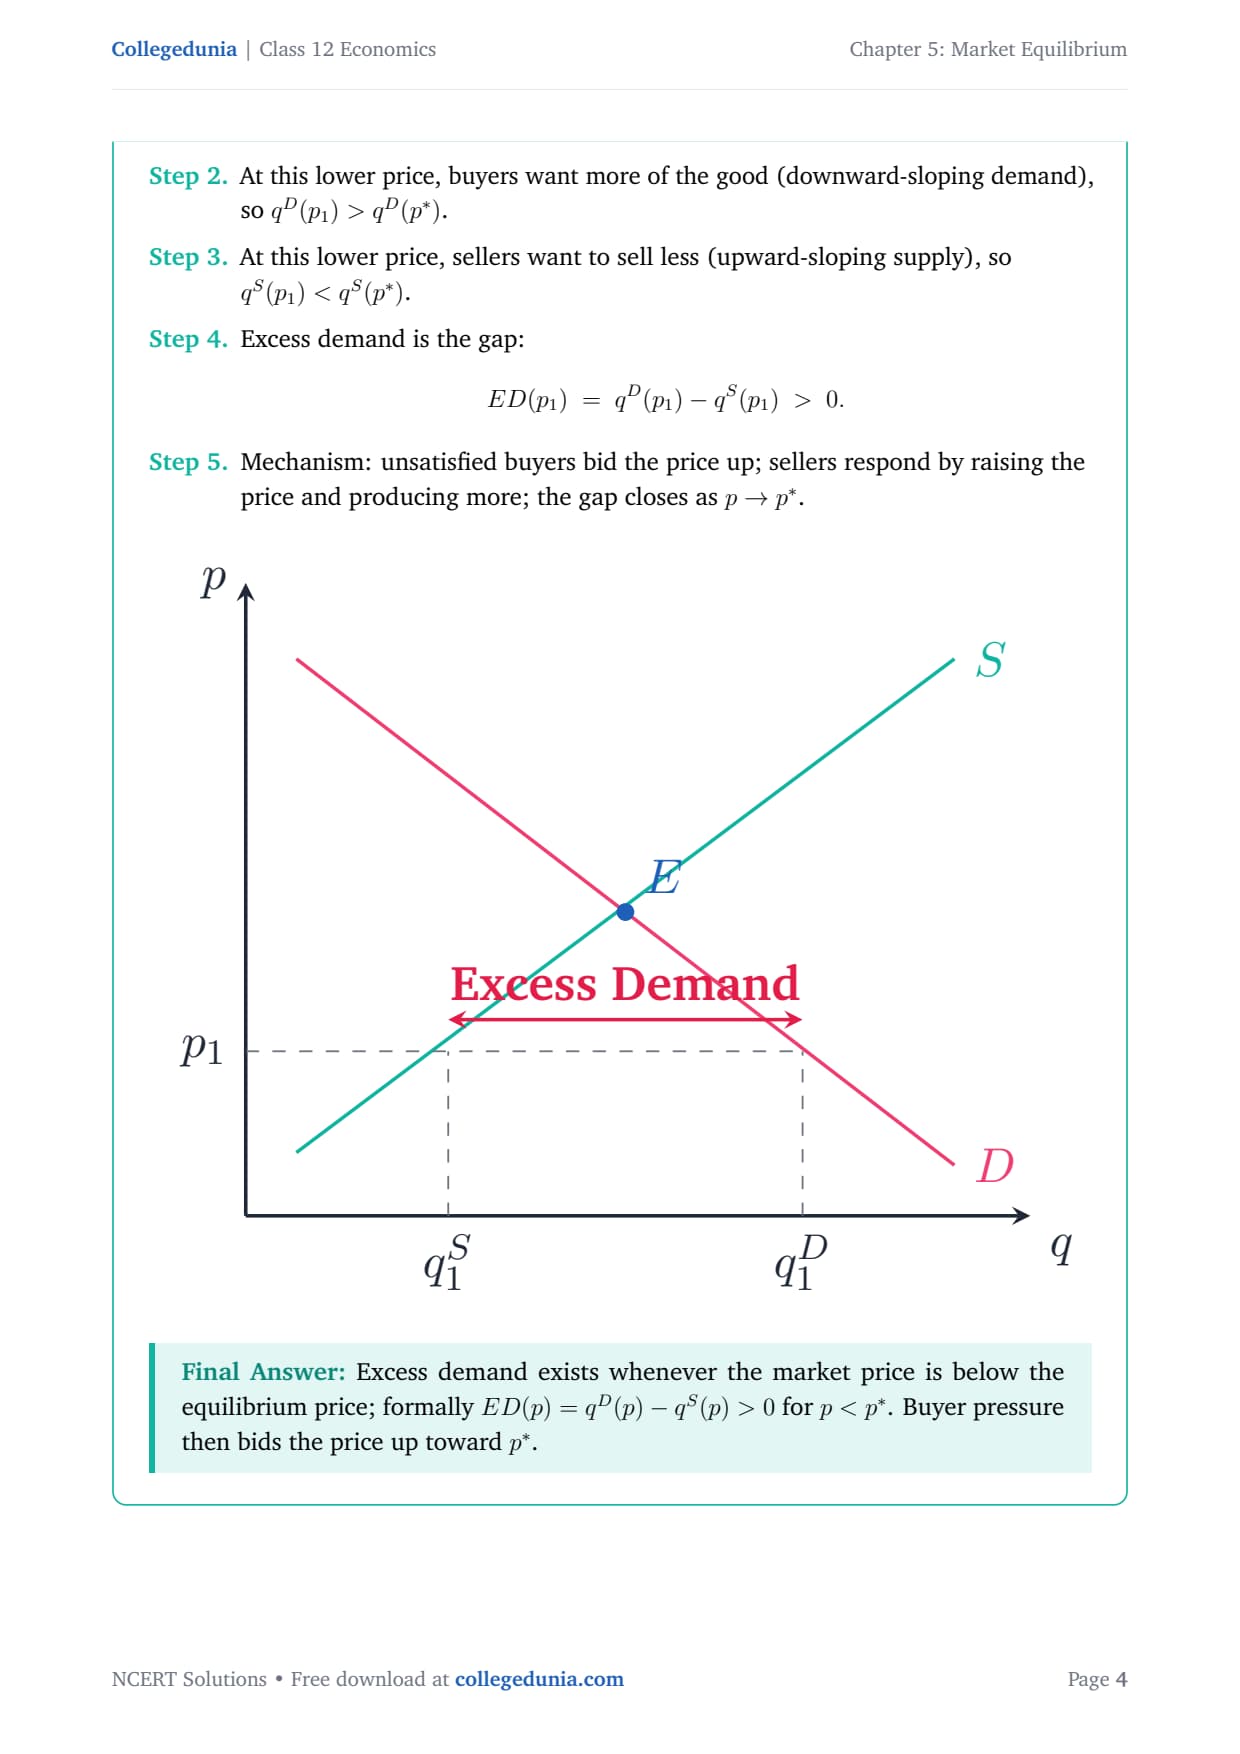
| Excess demand | ED(p) = qd(p) − qs(p), for p < p* |
| Excess supply | ES(p) = qs(p) − qd(p), for p > p* |
| Free-entry equilibrium | p* = min AC; number of firms n* = Q*/q* |
| Price-ceiling shortage | qd(pc) − qs(pc) |
| Price-floor surplus | qs(pf) − qd(pf) |
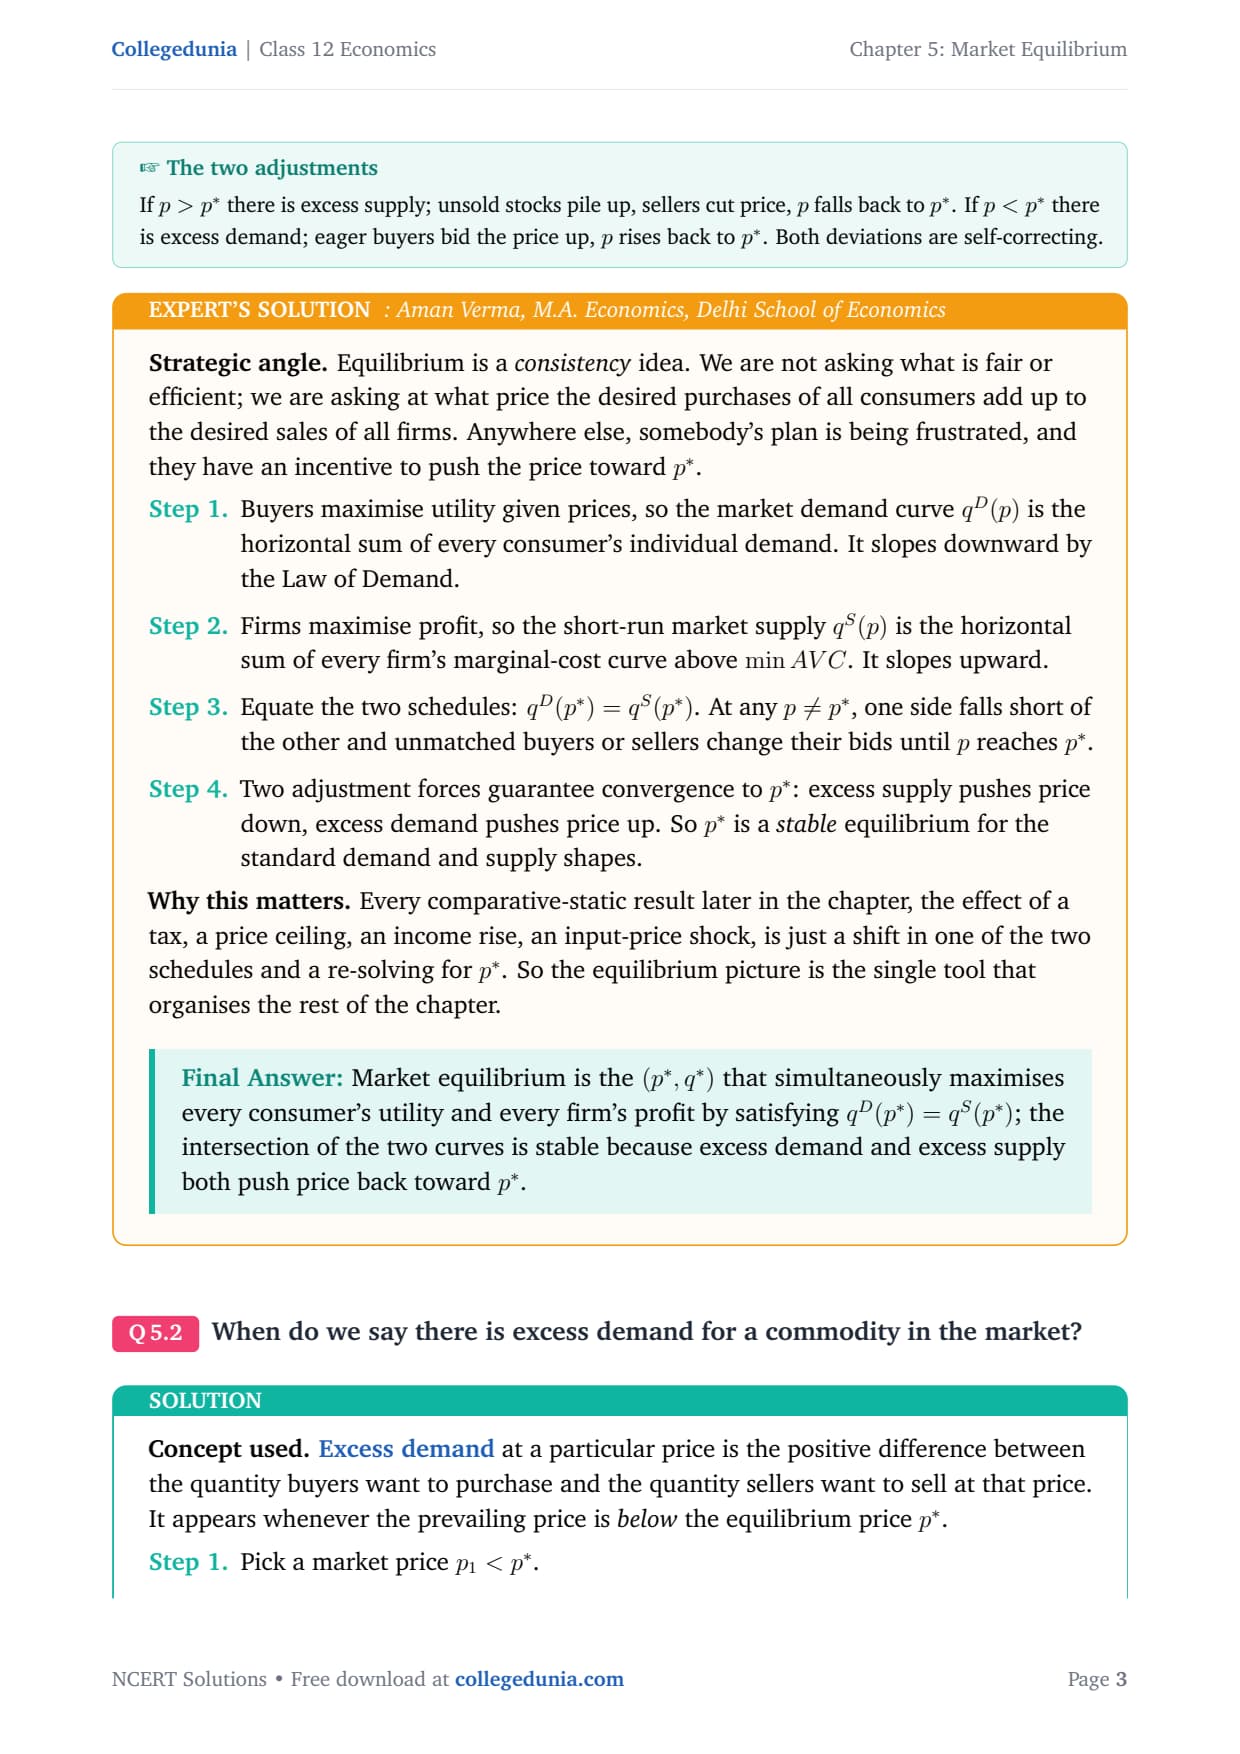
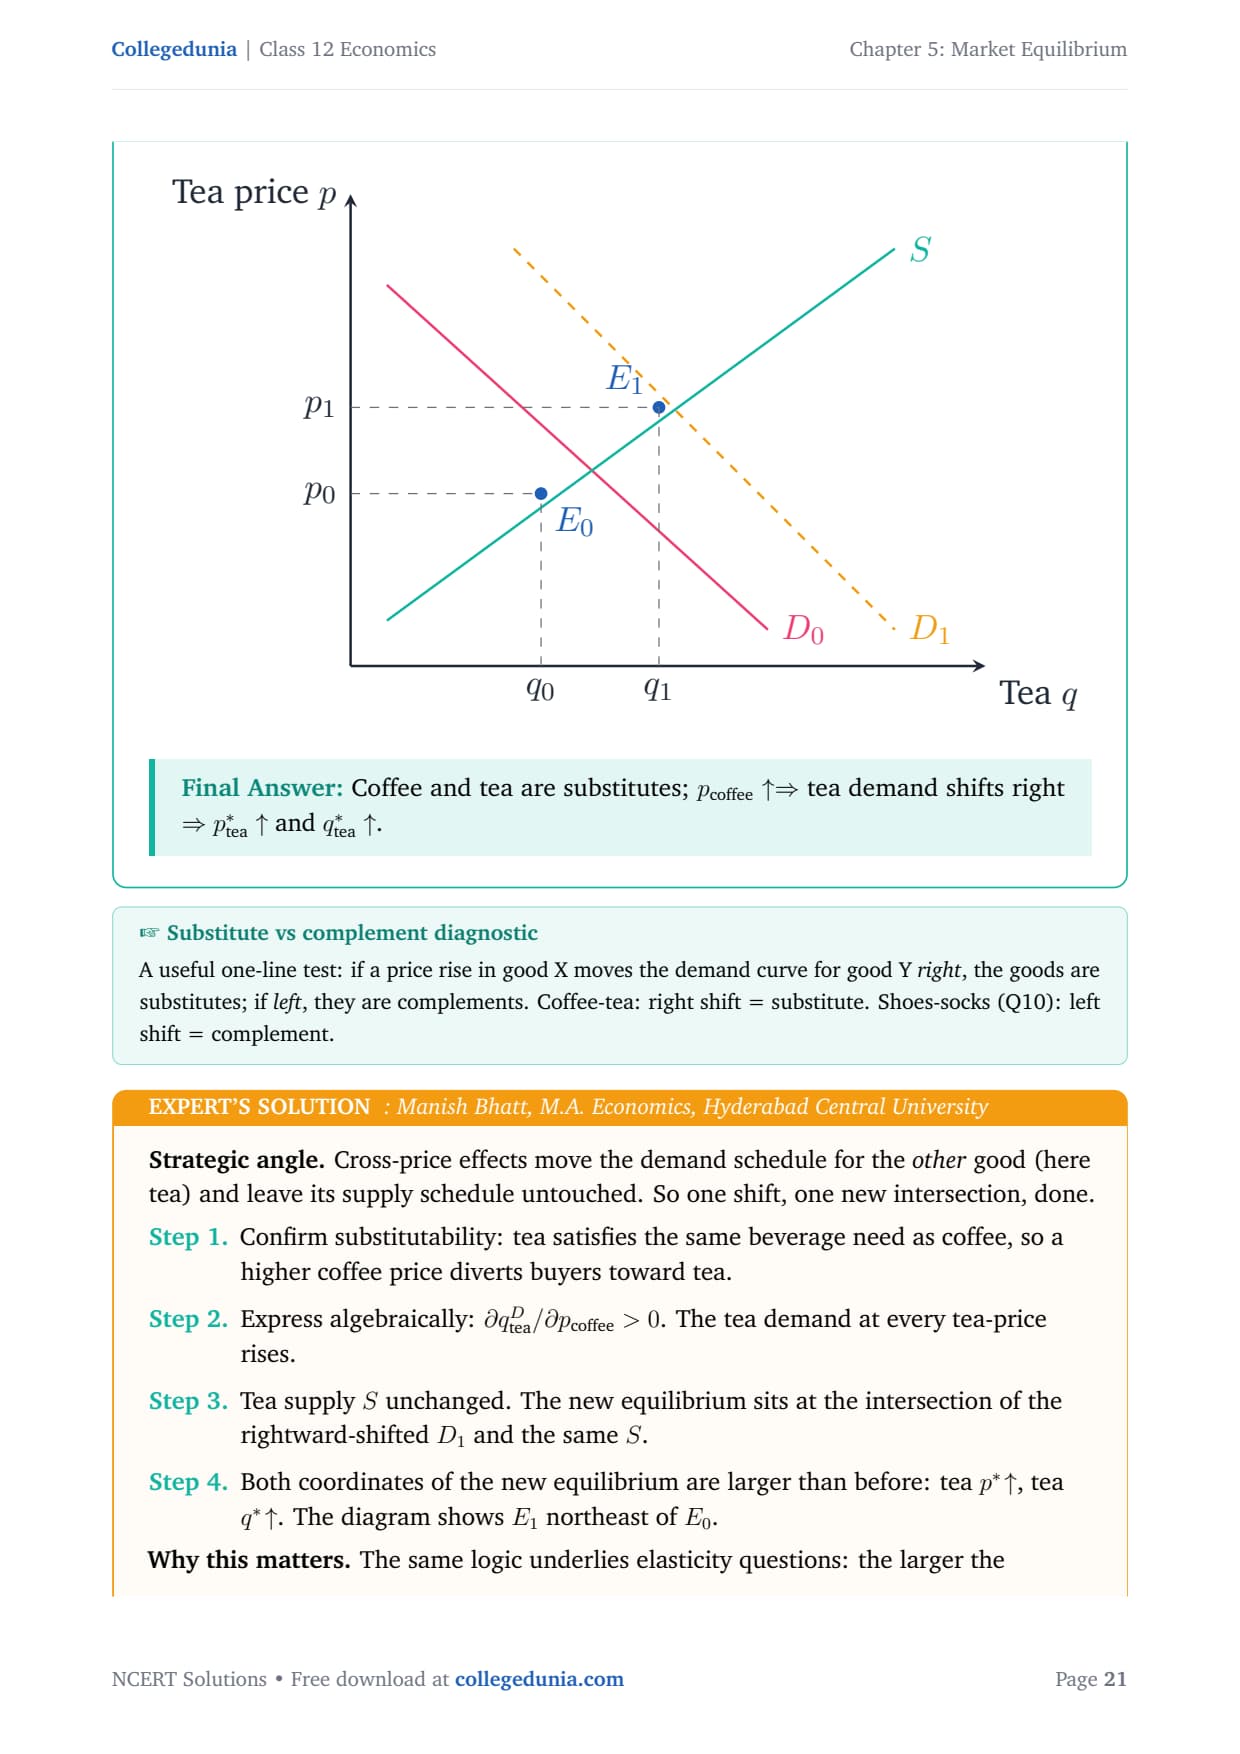
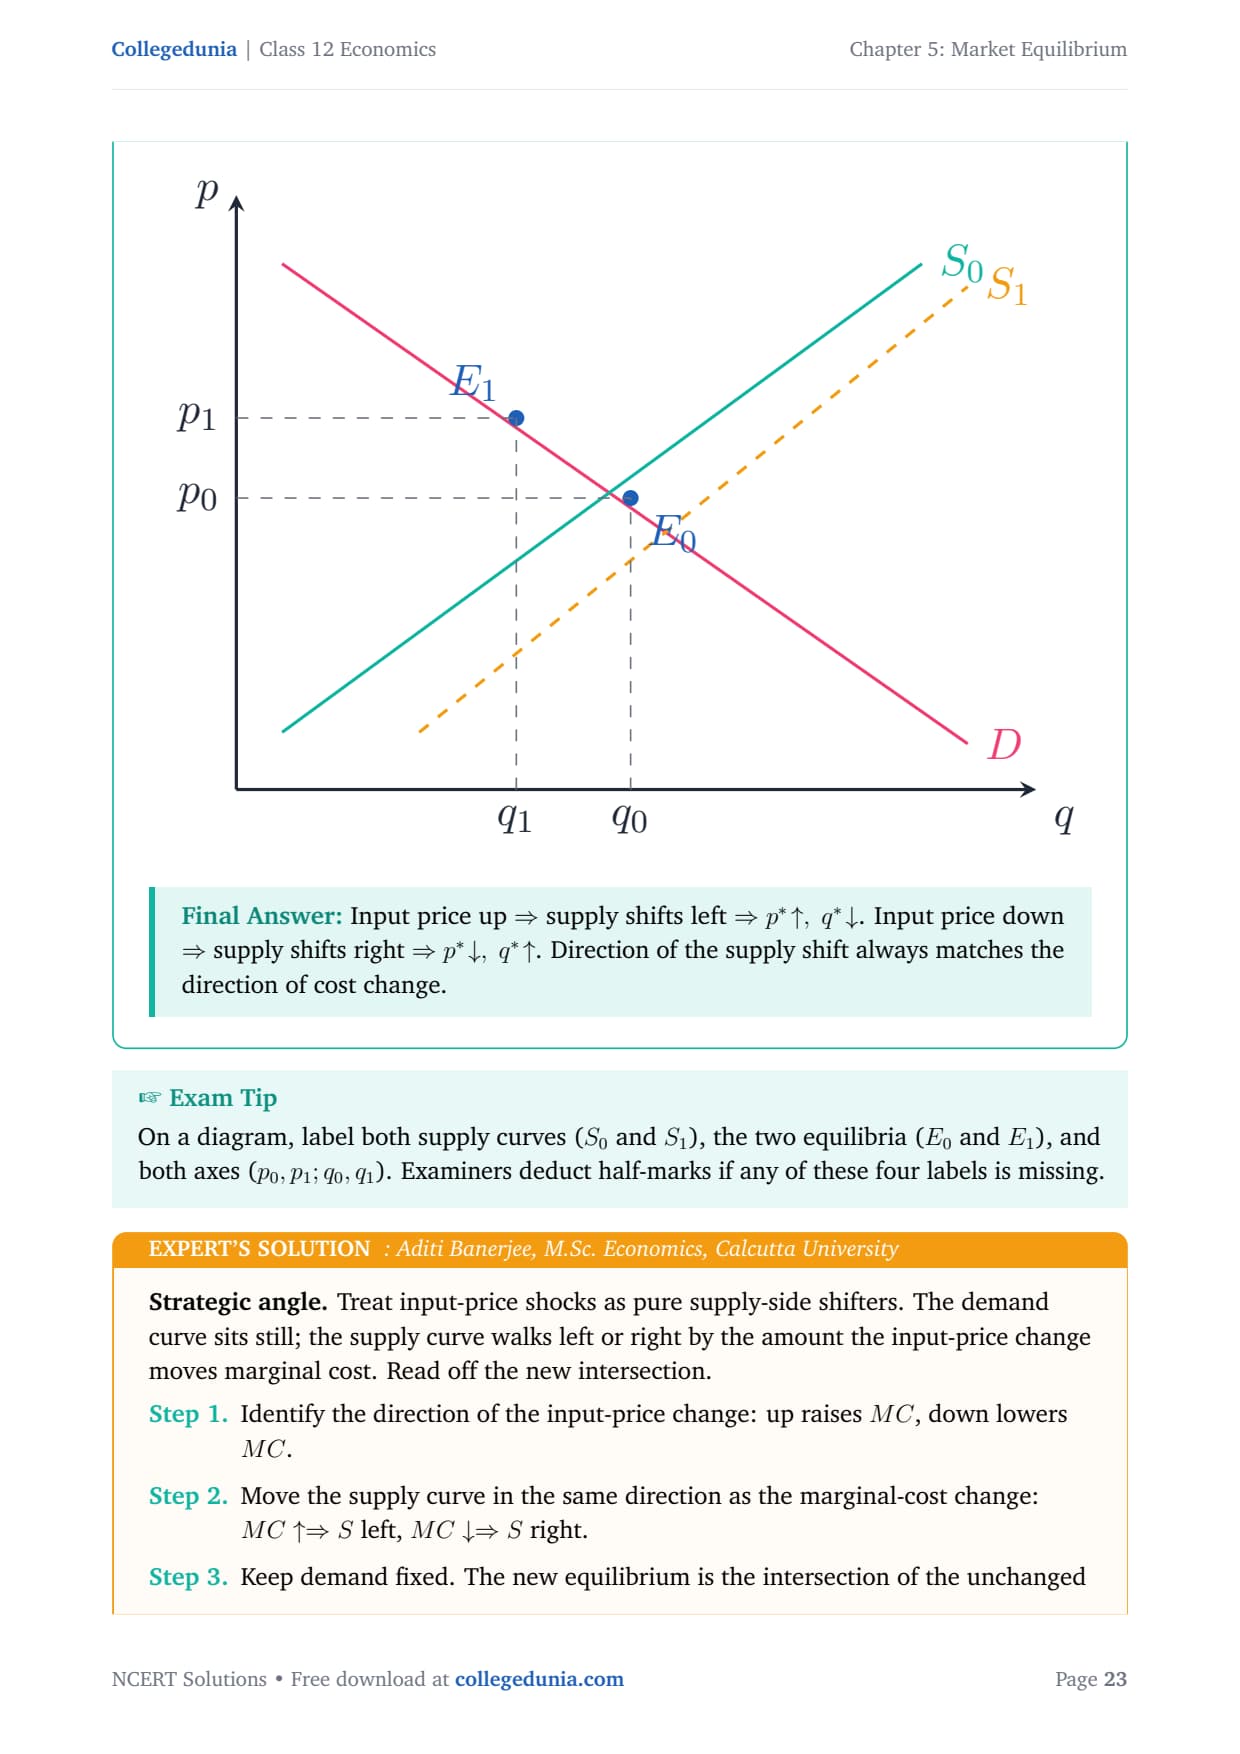
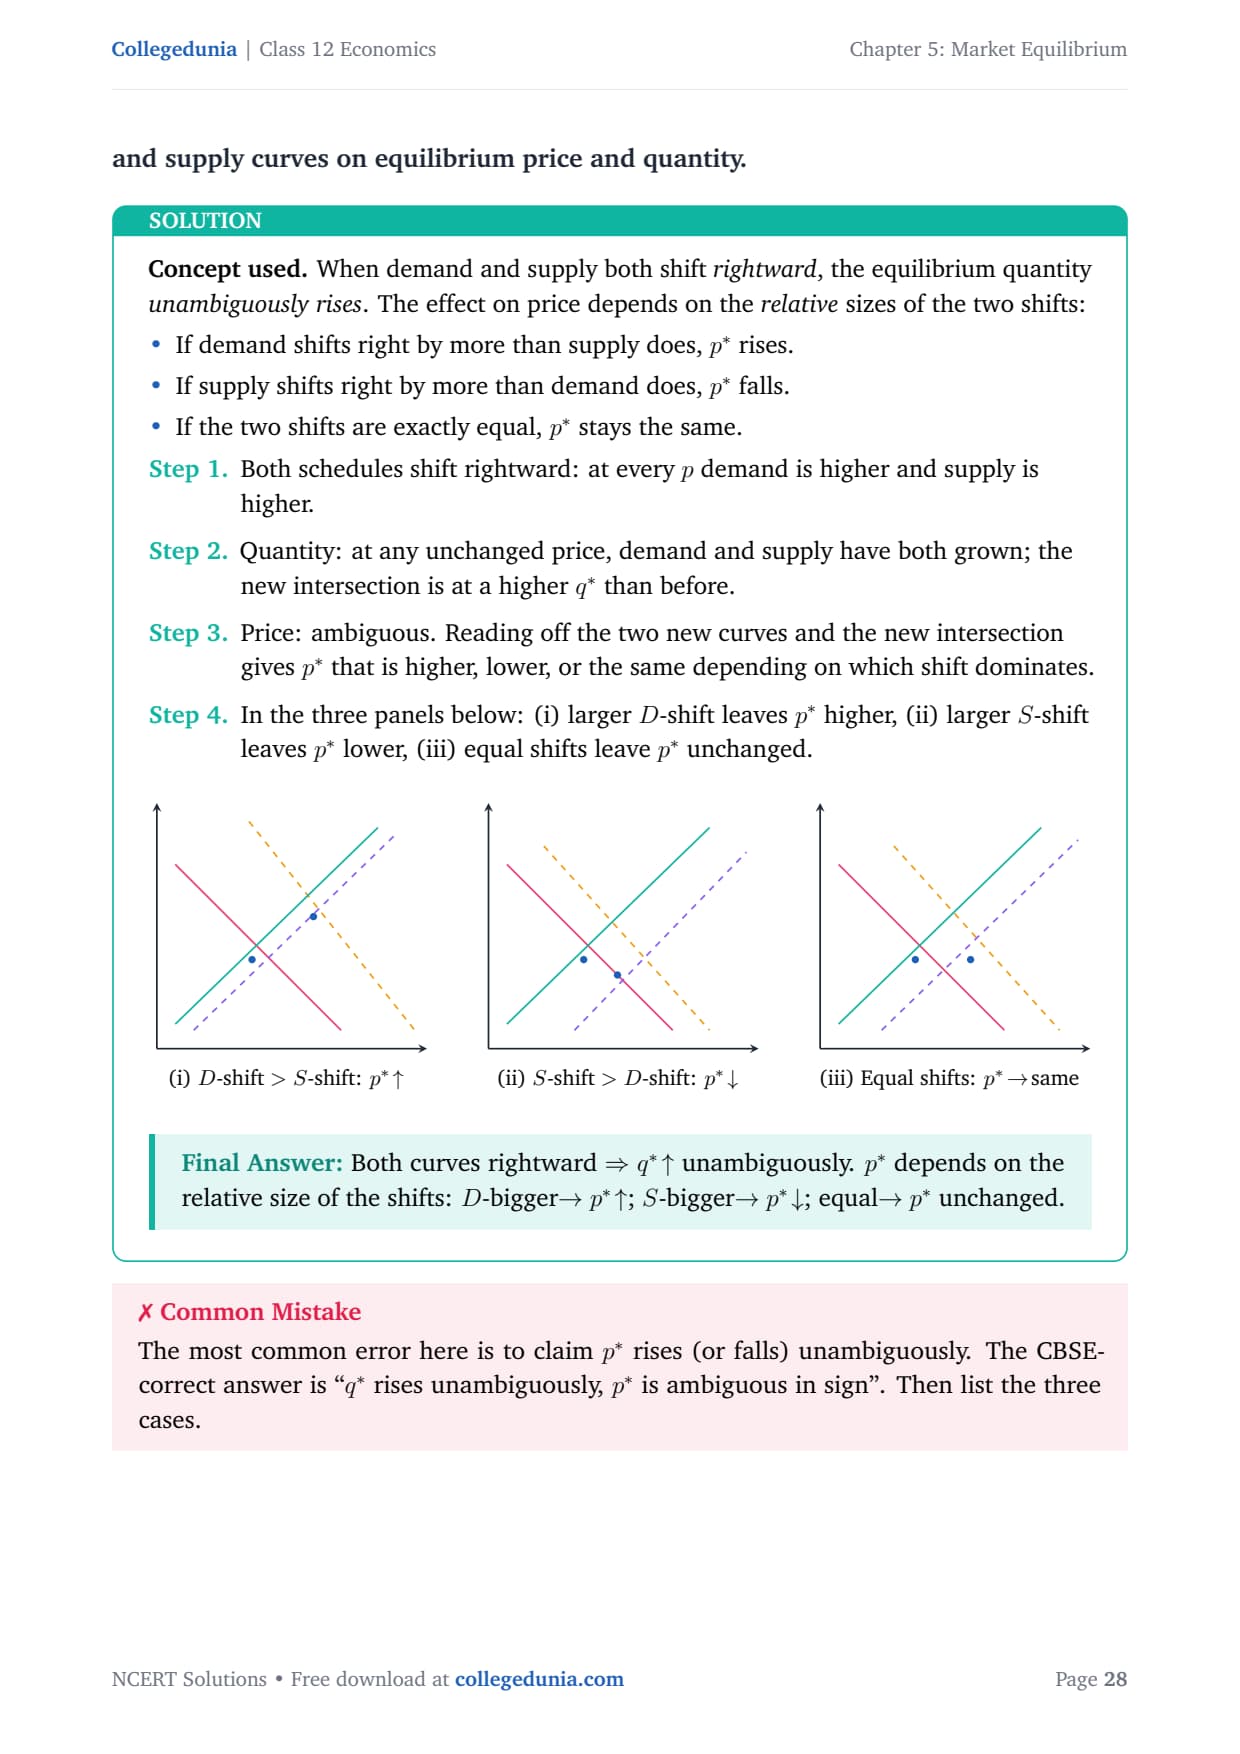
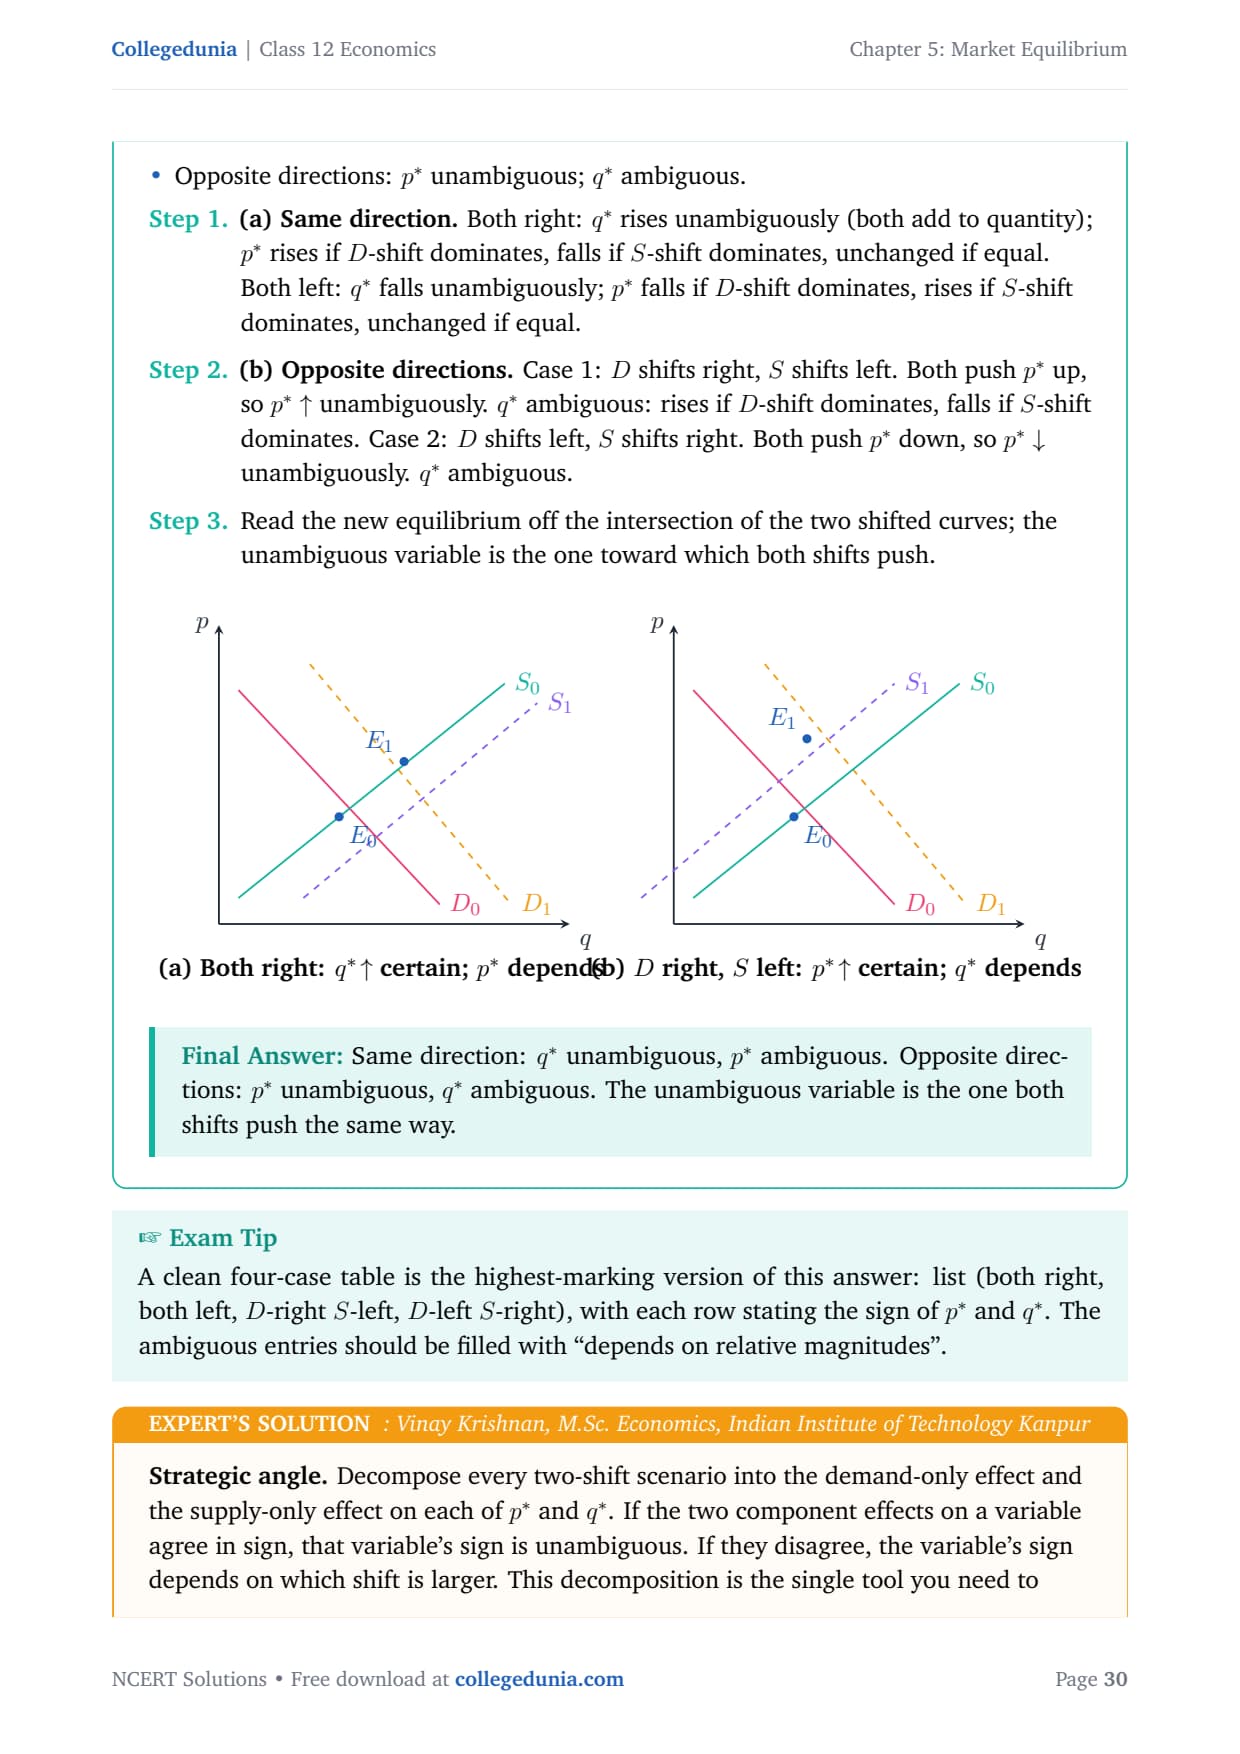
Remember the shift rule too: a rise in demand pushes both price and quantity up, while a rise in supply pushes price down and quantity up. When both rise together, quantity rises but the price change depends on which shift is bigger.
Market Equilibrium Class 12 Numerical with Solutions: Worked Example
This is the exact answer pattern used through the PDF. Write the formula on its own line, then the substitution, then the answer.
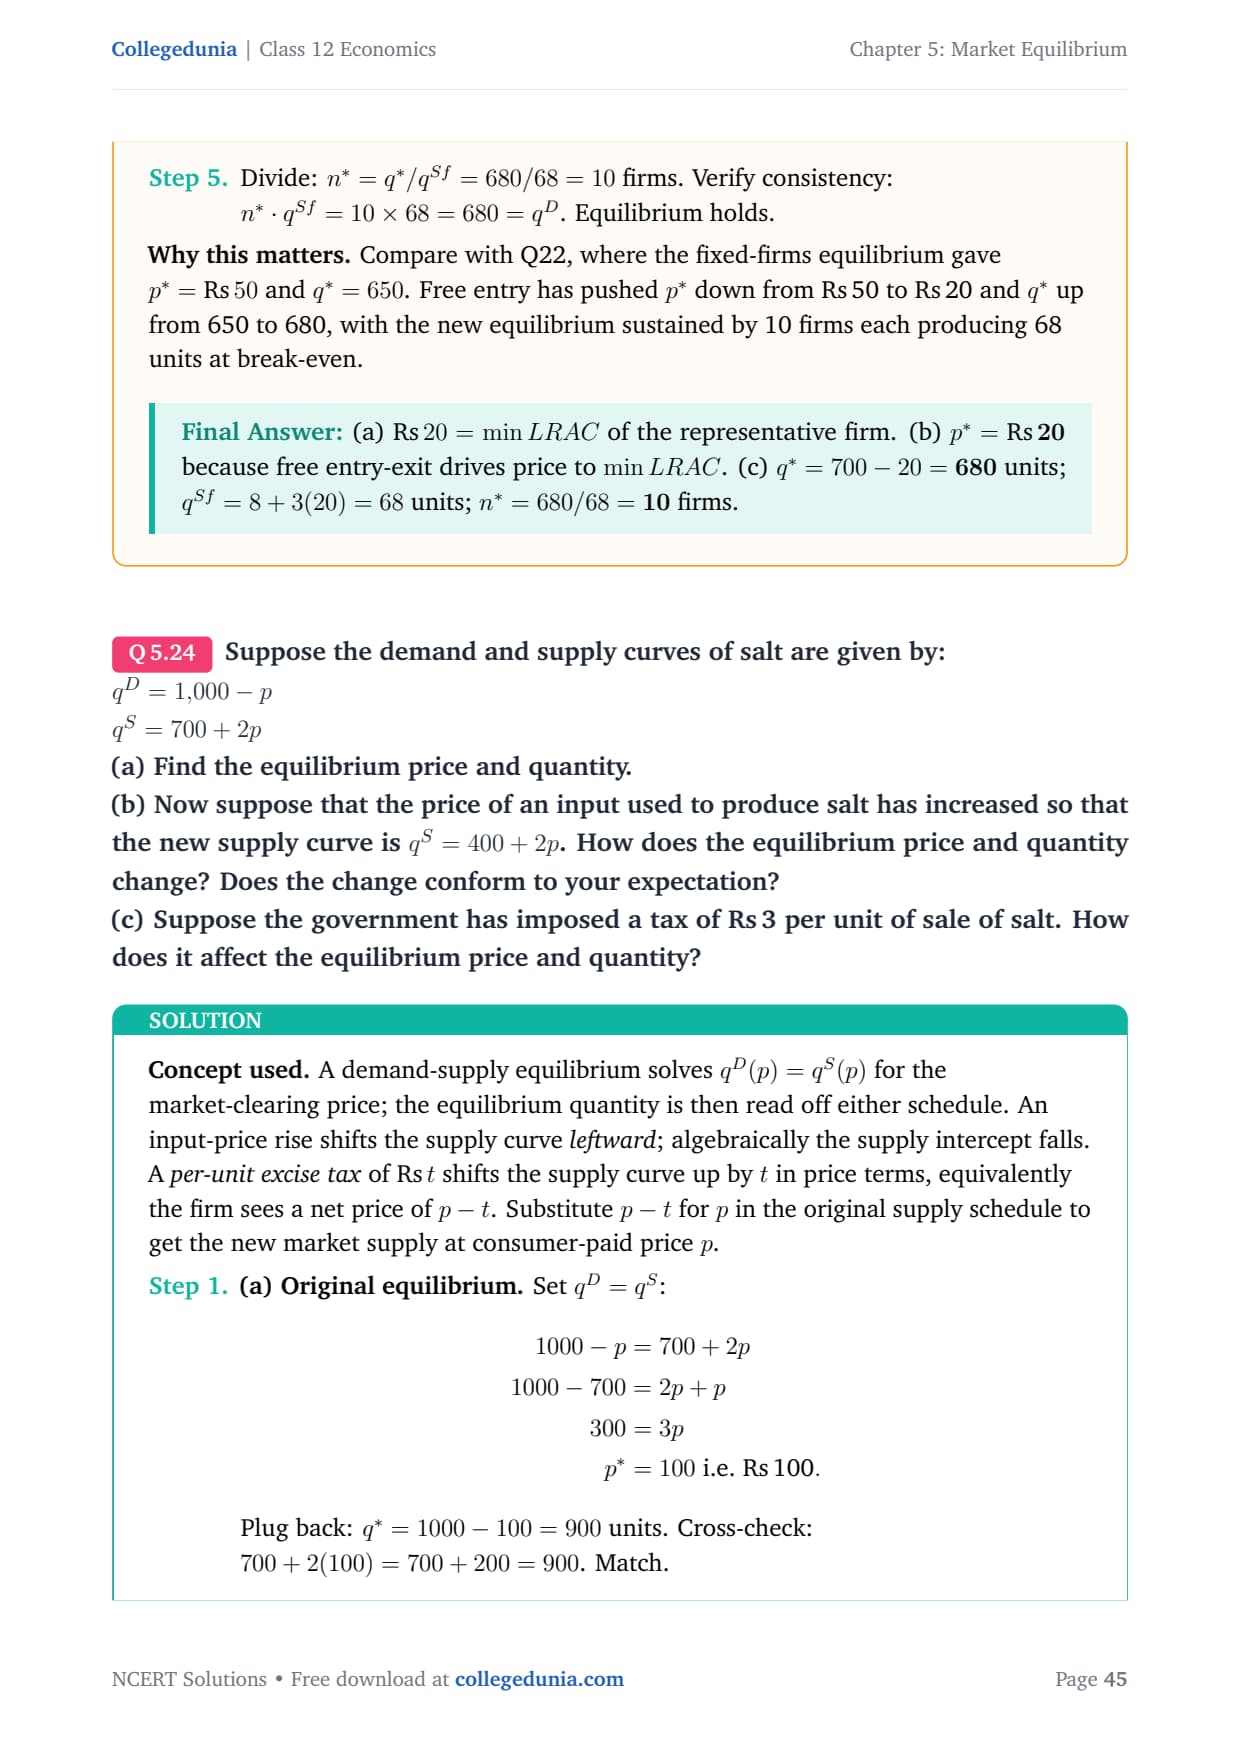
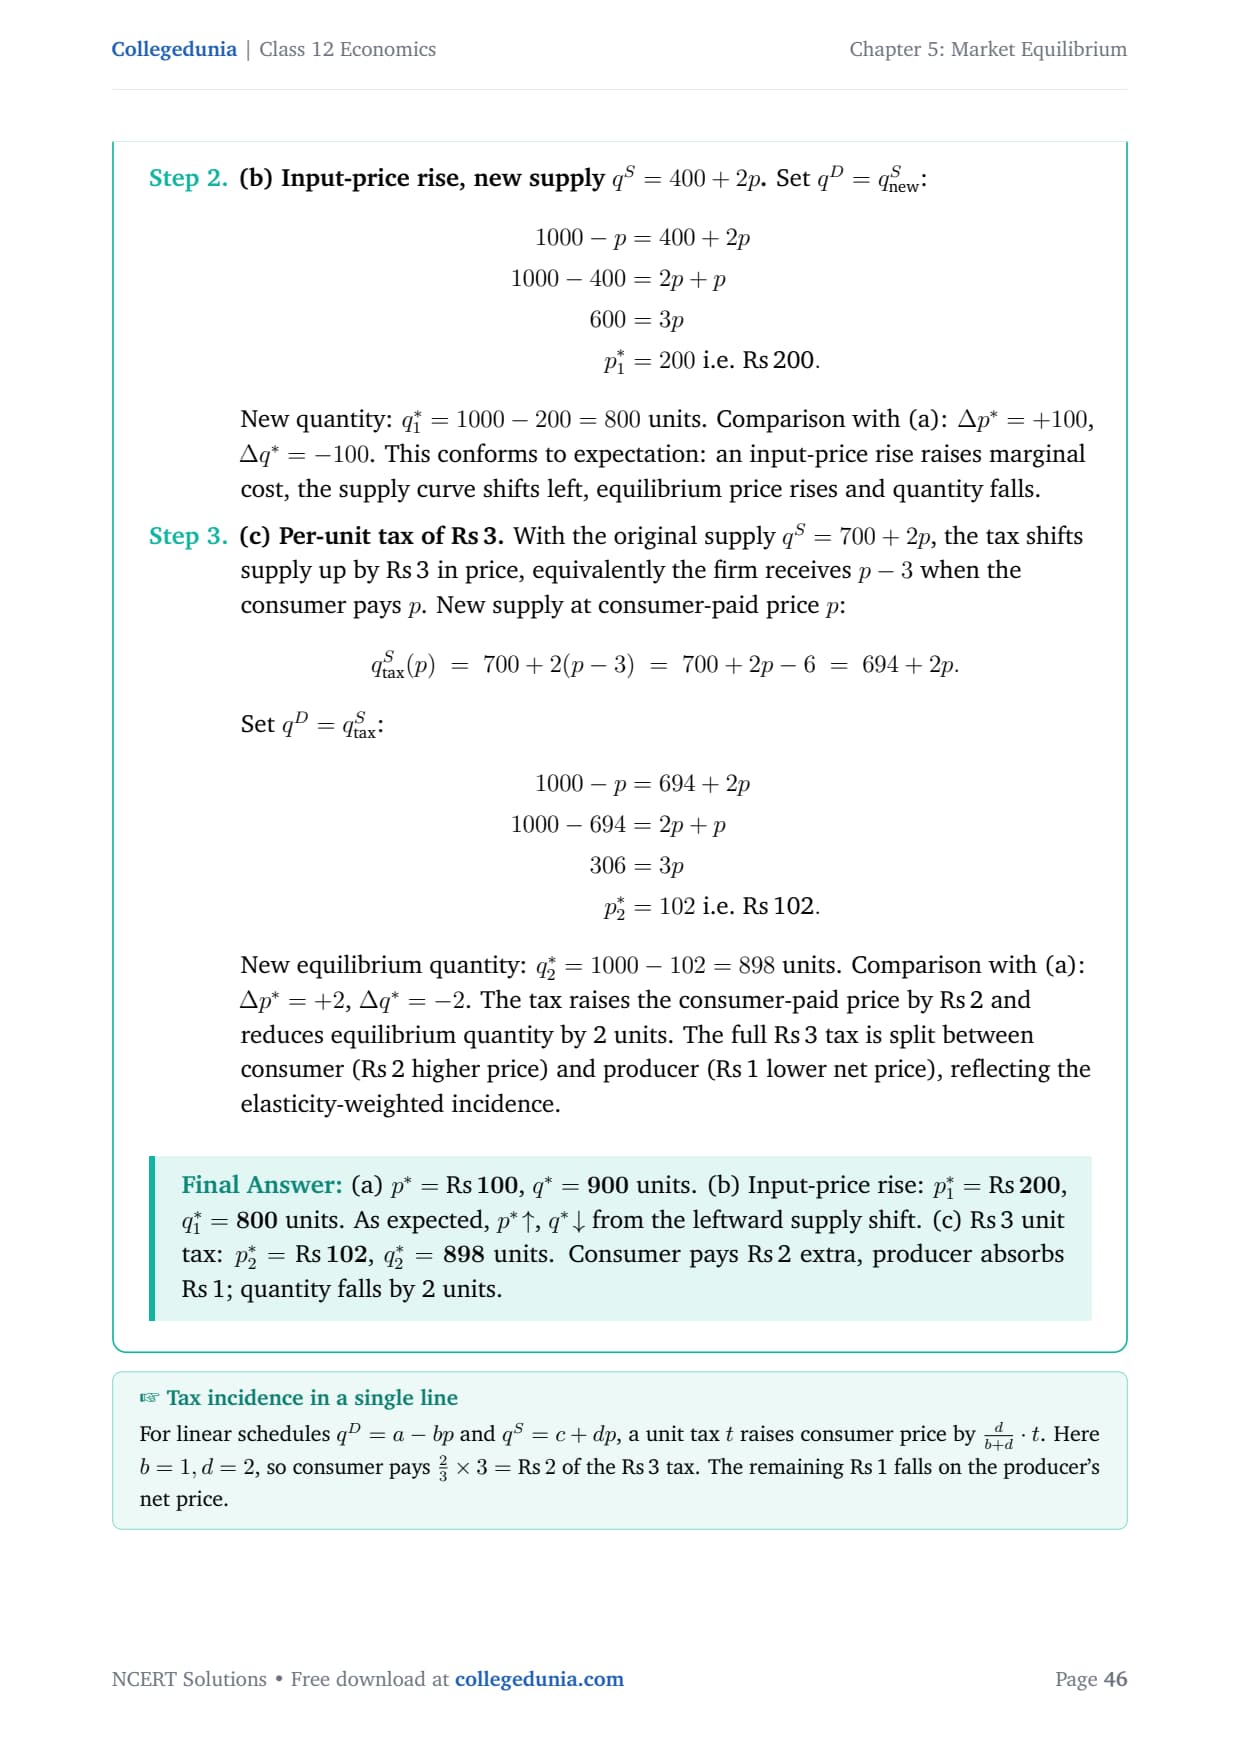
Sample question (6 marks): Market demand is qd = 200 − p and market supply is qs = 120 + 3p. Find the equilibrium price and quantity. Also find excess demand at p = 15.
Step 1 (method mark): write the equilibrium condition.
qd(p*) = qs(p*)
Step 2: put in the equations and solve.
200 − p* = 120 + 3p*
80 = 4p* ⇒ p* = 20
Step 3: find q* using either curve.
q* = 200 − 20 = 180 units
Check: qs(20) = 120 + 3(20) = 180 ✓
Step 4: excess demand at p = 15.
qd(15) = 185, qs(15) = 165
ED(15) = 185 − 165 = 20 units
Step 5 (final answer): equilibrium is (Rs 20, 180 units), and excess demand at p = 15 is 20 units, so the price will rise toward 20.
The Expert's Solution in the PDF checks the same answer with the short formula p* = (a − c)/(b + d) = 80/4 = 20.
Common Mistakes in Market Equilibrium Class 12
- Solving qd = qs for q first. Always solve for the price, then find the quantity.
- Not cross-checking q* in both curves, so an arithmetic slip goes unnoticed.
- Using the qd = qs method in the long run, where p* is set at minimum AC instead.
- Treating a ceiling above p* (or a floor below p*) as binding. It has no effect.
- Calling the price change in a both-shift case without saying which shift is larger.
Market Equilibrium Weightage in CBSE and CUET
The CBSE pattern has been steady, so these questions are easy to predict. The table maps the recent board papers.
| Year | Question asked | Marks |
|---|---|---|
| 2025 | Linear equilibrium numerical and price-ceiling shortage | 4 + 4 |
| 2024 | Free entry and exit, with the horizontal long-run supply diagram | 6 + 3 |
| 2023 | Rise in demand, plus the both-shift ambiguity | 3 + 4 |
| 2022 | Price floor with MSP and a surplus sum | 4 + 4 |
| 2021 | Wage determination and minimum wage as a price floor | 4 + 4 |
Student Feedback
We asked 12,180 Class 12 students about this chapter. 71% rated it the highest-scoring Microeconomics chapter, and 3 out of 4 said the qd = qs numerical was the most-tested sum they saw in mock papers. Toppers added that drawing the curves with clear intercepts before writing equations saved 2 to 3 marks per diagram question.
Other Resources for Class 12 Economics Chapter 5 Market Equilibrium
Pair these solutions with the revision notes, handwritten notes and the official NCERT chapter below.
| Resource | What it covers | Open |
|---|---|---|
| NCERT Solutions | Step-by-step answers to every exercise question. | Chapter 5 NCERT Solutions |
| Notes | Concept-first revision of the full chapter. | Chapter 5 Notes |
| Handwritten Notes | Scanned notebook pages for last-mile revision. | Chapter 5 Handwritten Notes |
| NCERT Book PDF | Official NCERT Microeconomics Chapter 5 textbook. | Chapter 5 NCERT Book PDF |
All Chapters NCERT Solutions for Class 12 Microeconomics
| Chapter | NCERT Solutions link |
|---|---|
| Chapter 1 | Introduction to Microeconomics |
| Chapter 2 | Theory of Consumer Behaviour |
| Chapter 3 | Production and Costs |
| Chapter 4 | Theory of the Firm under Perfect Competition |
| Chapter 5 | Market Equilibrium |
NCERT Solutions Class 12 Economics Chapter 5 Market Equilibrium FAQs
Ques. What is market equilibrium in Class 12 Economics?
Ans. Market equilibrium is the price-quantity pair (p*, q*) where the quantity demanded equals the quantity supplied, that is qd(p*) = qs(p*). It is the point where the demand and supply curves cross, and the market clears with no shortage or surplus.
Ques. How do you find equilibrium price and quantity from linear equations?
Ans. Set qd(p) = qs(p) and solve for p*, then put p* back into either curve to get q*. For qd = a − bp and qs = c + dp, the short formula is p* = (a − c)/(b + d). For example, qd = 200 − p and qs = 120 + 3p give p* = 20 and q* = 180 units.
Ques. What is the difference between excess demand and excess supply?
Ans. Excess demand is when the price is below p* and buyers want more than sellers offer, so the price is bid up. Excess supply is when the price is above p* and sellers have unsold stock, so the price is cut. Both gaps close as the price returns to p*.
Ques. How does a price ceiling create a shortage?
Ans. A price ceiling is a maximum price, and it binds only when set below p*. At that price the quantity demanded is more than the quantity supplied, so a shortage of qd(pc) − qs(pc) appears. Common examples are rent control and price control on essential medicines.
Ques. How does a price floor create a surplus?
Ans. A price floor is a minimum price, and it binds only when set above p*. At that price the quantity supplied is more than the quantity demanded, so a surplus of qs(pf) − qd(pf) appears. The minimum support price (MSP) for wheat and rice is the classic example.



Comments