India is one of only 12 mega-diversity nations, and the 2026-27 NCERT keeps Class 12 Biology Chapter 13 Biodiversity and Conservation intact, with all 10 exercise questions. This page hosts the step-by-step Solutions PDF in the exact CBSE and NEET phrasing.
The PDF gives a full Solution plus an Expert's Solution for every question, mapped to the 2026-27 NCERT and cross-checked against the last five years of CBSE and NEET papers.
Why Biodiversity and Conservation is a Free-Marks Chapter for NEET 2027
Biodiversity and Conservation is fact-driven: fixed numbers, named patterns (latitudinal gradient, species-area relationship), and the four causes of loss (the "Evil Quartet"). NEET frames most questions as one-line MCQs, so a careful NCERT pass converts almost directly into marks.
NEET pulled 3 direct-recall MCQs from this chapter in 2025 and 2 in 2024. All five tested hotspots, the species-area slope, or the in-situ vs ex-situ split.
Biodiversity and Conservation Video Lecture for Class 12 Biology
Diagrams labelled: species pie, species-area curve, hotspot map, in-situ vs ex-situ.
Biodiversity and Conservation NCERT Solutions: Exercise Breakdown
The 10 exercise questions span the chapter's two NCERT sections. This table maps them so you can plan answer-writing in the order CBSE and NEET pull from.
Sub-Topic (NCERT section)
NCERT Q Numbers
Question Count
NEET Yield (last 5 yrs)
Components and levels of biodiversity (13.1)
Q1, Q9
2
2 questions
How many species: estimation methods (13.1.1)
Q2
1
1 question
Patterns: latitudinal gradient and species-area (13.1.2)
Q3, Q4
2
3 to 4 questions
Loss of biodiversity: Evil Quartet (13.1.4)
Q5, Q10
2
2 questions
Importance and ecosystem services (13.1.3, 13.1.5)
Q6, Q8
2
1 to 2 questions
Conservation: hotspots and sacred groves (13.2)
Q7
1
2 to 3 questions
Patterns (13.1.2) is the highest-yield NEET sub-topic, so do Q3 and Q4 first. Sacred groves (Q7) is a near-certain CBSE item.
Biodiversity and Conservation Class 12 Biology PYQ Trend (2021 to 2025)
This table maps the chapter across CBSE Boards and NEET over five cycles, from the 2025 CBSE marking scheme and NEET 2025 / 2024 keys.
Year
CBSE Class 12 Boards
NEET
Most-Asked Topic
2025
5 marks (one 3-marker on hotspots + one 2-marker on the Evil Quartet)
3 questions
Hotspots / species-area slope
2024
6 marks (5-marker on in-situ vs ex-situ + one 1-marker on India's mega-diversity rank)
2 questions
Rivet popper / sacred groves
2023
4 marks
3 questions
Latitudinal gradient
2022
4 marks (term-2)
2 questions
Species-area S = CA^z
2021
3 marks (term-2)
2 questions
Habitat loss / fragmentation
The five-year average is 4.4 marks in CBSE and 2.4 questions in NEET. Patterns plus hotspots are over 60 percent of NEET's pull, so prepare Q3, Q4 and Q7 first.
NEET prep tip: The slope ranges z = 0.1 to 0.2 and 0.6 to 1.2 appeared as direct numericals in NEET 2024 and 2022. Lock both.
Sample Fully-Solved Question: Species-Area Relationship (Q4) for Class 12 Biology
NCERT Q4 asks the significance of the slope of regression in a species-area relationship. The four-mark CBSE-style answer is below.
Steps 1-2 (2 marks) - The relation and small areas. Richness S and area A follow S = C Az, a straight line on log-log axes: log S = log C + z log A, slope = z. For small areas z = 0.1 to 0.2.
Steps 3-4 (2 marks) - Large areas and why it matters. Across continents z is steeper, 0.6 to 1.2 (Whittaker). A steeper z means losing a large tract destroys a disproportionately large fraction of the biota, the basis for protecting big, contiguous parks.
CBSE 2024 gave zero to scripts that wrote "S = CA^z is a curve" without the slope range or Whittaker. The z values are mandatory.
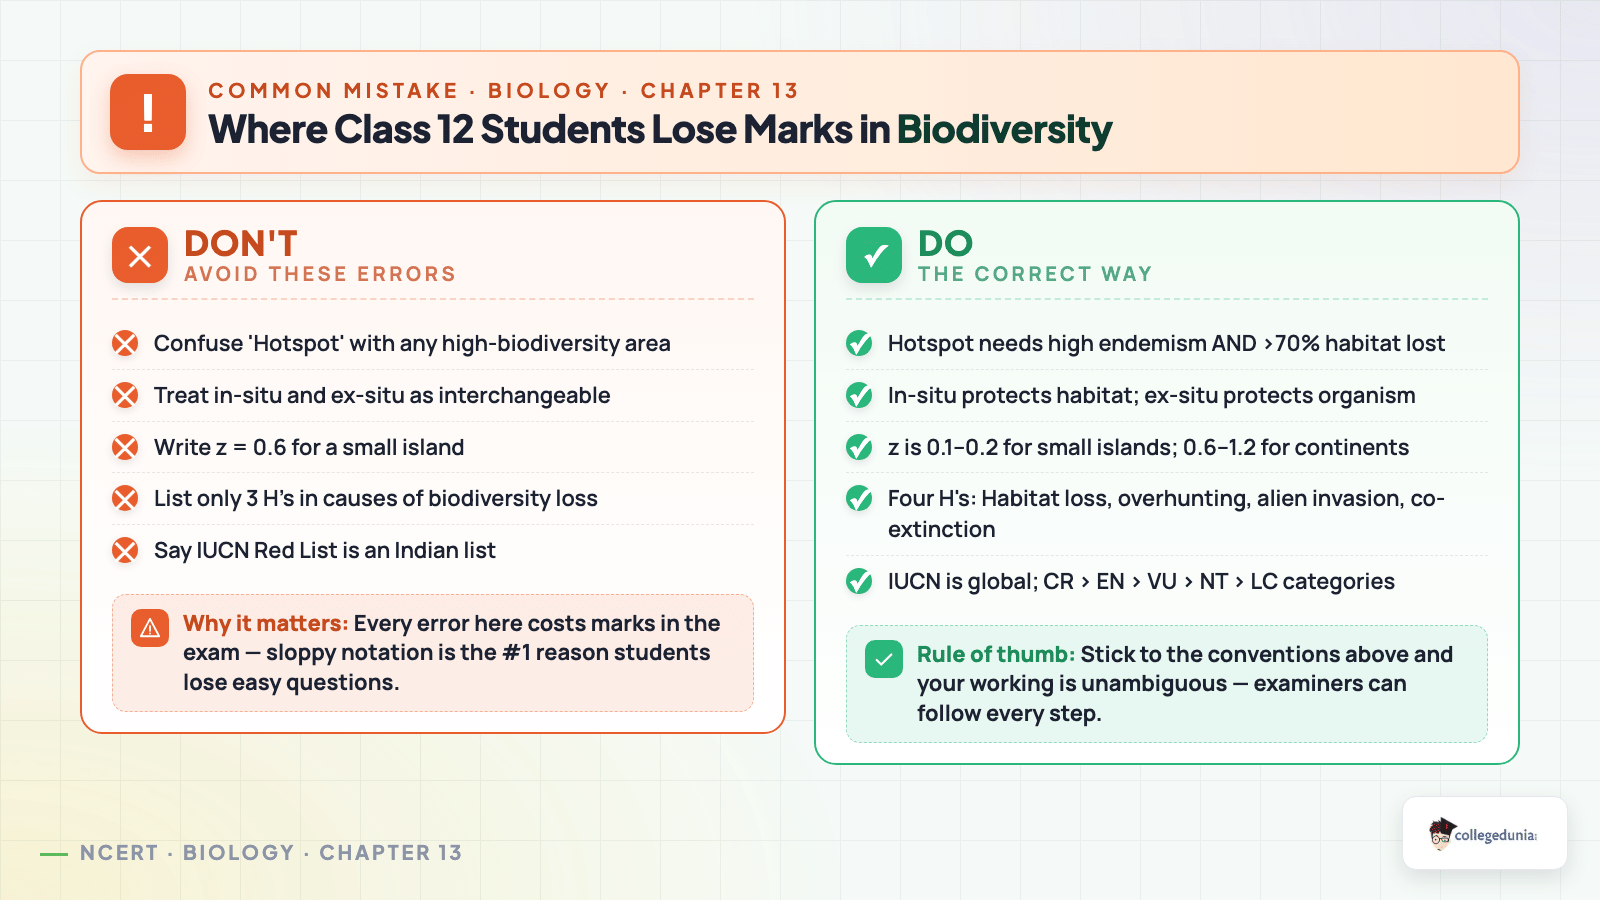
Where Students Lose Marks in Biodiversity and Conservation (Class 12 Biology)
Students often mis-state the numbers or confuse the Evil Quartet. The mistakes below cost the most marks; the solutions correct each one.
Mistake 1. "20 hotspots" instead of 34; "2 in India" instead of 3 (Western Ghats - Sri Lanka, Himalaya, Indo-Burma).
Mistake 2. Skipping Evil Quartet items. CBSE wants all four: habitat loss and fragmentation, over-exploitation, alien species invasion, co-extinctions.
Mistake 3. Swapping the terms. In-situ is the natural habitat; ex-situ is zoos, botanical gardens, seed banks, cryopreservation.
Mistake 4. "1.5 million still to be discovered". 1.5 million is already described; Robert May's 7 million estimate implies about 6 million still unknown.
Top Numerical and Named Facts Recall Table for Class 12 Biology Chapter 13
The highest-ROI table in this chapter. Every entry has appeared in CBSE or NEET in the last five cycles. Memorise each number with its context.
Fact
Value
NCERT Section
Total described species globally (IUCN, 2004)
> 1.5 million
13.1.1
Robert May's global species estimate
~ 7 million
13.1.1
Animals / insects share
> 70 percent / > 70 percent of animals
13.1.1
Mega-diversity countries
12 (India one of them)
13.1.1
Species-area slope z (small / large area)
0.1 to 0.2 / 0.6 to 1.2 (Whittaker)
13.1.2
Present extinction vs background
100 to 1000 times higher
13.1.4
Species facing threat of extinction
> 15,500 (> 650 in India)
13.1.4
Global biodiversity hotspots
34 (3 in India)
13.2
India in-situ network
14 biosphere reserves, 90 national parks, 448 sanctuaries
13.2
Earth Summit (Rio)
1992, 190 nations (Convention on Biological Diversity)
13.2
How to Study Biodiversity and Conservation for Class 12 Biology Boards
Patterns and hotspots are often under-prepared, yet NEET tests both yearly. The three-day plan below splits the 10 questions by frequency.
Day
Focus
NCERT Q to Solve
Time
Day 1
Levels, estimation, patterns (13.1 to 13.1.2)
Q1, Q2, Q3, Q4, Q9
3 hours
Day 2
Loss, importance, ecosystem services (13.1.3 to 13.1.5)
All NCERT Solutions for Biodiversity and Conservation with Step-by-Step Working
Every NCERT question for Class 12 Biology Chapter 13 Biodiversity and Conservation is below with a full Solution and Expert Solution in collapsible tabs. Click Check Solution for the step-by-step working.
Exercise: NCERT Biology Class 12 Chapter 13 Biodiversity and Conservation
Q 13.1
Name the three important components of biodiversity.
Concept used.Biodiversity is a term popularised by
the sociobiologist Edward Wilson to describe the combined diversity at
all levels of biological organisation. NCERT recognises three
hierarchical components (or levels) at which this diversity
is measured: genetic diversity (variation in alleles within
a species), species diversity (variation in species within a
region) and ecological diversity (variation in habitats and
ecosystems within a landscape). All three together describe how
``rich'' nature is in a given place.
Genetic diversity. A single species may show large
variation in its genes across its range. The medicinal plant
Rauwolfia vomitoria in different Himalayan ranges varies
in the potency and concentration of its active chemical
(reserpine). India has more than 50,000 genetically
different strains of rice and 1,000 varieties of mango,
all because of genetic diversity within these species.
Species diversity. This refers to the number and
evenness of different species in a region. For example, the
Western Ghats have a much higher amphibian species diversity
than the Eastern Ghats.
Ecological (ecosystem) diversity. At the
ecosystem scale, India, with deserts, rain forests, mangroves,
coral reefs, wetlands, estuaries and alpine meadows, has far
greater ecosystem diversity than a Scandinavian country like
Norway.
The three components of biodiversity are genetic diversity, species diversity and ecological (ecosystem) diversity.
AI
Aanya Iyer
M.Sc Botany, Delhi University
Verified Expert
Concept used. A clean way to remember the three components is
to scale outward in biological organisation: from the molecules inside
one organism (genes) to the organisms themselves (species) to the
ecosystems they live in. NCERT explicitly lists these as the three
that ``matter most'' for conservation planning, because each is
protected by a different toolkit (seed banks for genes, captive
breeding for species, protected areas for ecosystems).
Genetic level (within a species). Inside one species,
individuals carry different alleles. This shows up as different
strains, varieties or breeds: 50,000 rice strains and
1,000 mango varieties in India, or the variation in
reserpine content across Rauwolfia populations of the
Himalaya. Genetic diversity is the raw material on which
natural selection acts.
Species level (within a community). This is the most
familiar layer: how many species coexist in a region and how
evenly individuals are spread among them. Western Ghats have
more amphibian species than Eastern Ghats; the Amazon has more
bird species than any temperate forest. Both number
(richness) and evenness contribute.
Ecosystem level (within a landscape). A country or
biome that has many distinct ecosystems, mangroves, coral
reefs, deserts, alpine meadows, etc., has higher ecological
diversity. India is a mega-diversity country partly because
its land carries an unusually large variety of habitats.
Why this matters. Conservation only succeeds if all three
levels are protected together. Saving a tiger (species level) is
pointless if the forest it lives in (ecosystem level) is fragmented,
and the population it breeds with (genetic level) is too small to
avoid inbreeding.
Biodiversity has three components, genetic diversity, species diversity and ecological (ecosystem) diversity, ordered from the smallest (gene) to the largest (ecosystem) scale.
Q 13.2
How do ecologists estimate the total number of species present in the world?
Concept used. The total number of species on Earth is unknown
because most species are tiny, microbial or live in poorly explored
habitats (tropical canopies, deep oceans, soil). Ecologists therefore
extrapolate: they take a group whose species count is
well known in temperate regions, measure how many more species
of the same group occur in the tropics, and apply that ratio to the
poorly studied groups. The most influential of these estimates was
made by Robert May, who concluded that the global species total is
about 7 million.
Start with the recorded baseline. According to IUCN (2004), the
total number of plant and animal species described so far is
slightly more than 1.5 million. This number is reasonably
complete for some groups (birds, mammals, flowering plants) and
very incomplete for others (insects, fungi, microbes).
Pick a reference group with an almost-complete inventory in
temperate countries, for example insects in Europe. Count how
many species of this group are known per unit area there.
Measure the same ratio for the same group in a tropical region
where the inventory is also good (say, insects on Barro
Colorado Island, Panama). This gives a
temperate-to-tropical species ratio, typically
1 : 2 to 1 : 5 depending on the taxon.
Apply this ratio to other taxonomic groups whose tropical
inventories are very incomplete (microbes, soil fauna, canopy
insects). Extrapolating in this way, Robert May arrived at the
``conservative and scientifically sound'' estimate of about
∼ 7 million species on Earth. Extreme estimates range from
20 to 50 million.
Ecologists estimate the global species total by counting species in well-surveyed groups and extrapolating, via a temperate-to-tropical richness ratio, to the many poorly known groups; Robert May's extrapolation gives ∼ 7 million species.
PS
Pranav Sharma
M.Sc Zoology, Banaras Hindu University
Verified Expert
Concept used. The method is a classic ratio
extrapolation, the same logic a wildlife biologist uses to estimate a
tiger population from a tagged-recapture sample. ``Known here, unknown
there, use the ratio to guess the unknown.''
Pick a well-studied indicator group. Insects in
temperate Europe and North America have been catalogued for
more than a century, so their species list is nearly complete.
Measure their tropical inflation factor. The same
kind of survey done in well-explored tropical pockets (the
Smithsonian's Barro Colorado plots, for instance) shows
roughly 2–5 times as many insect species per equivalent
sampling effort. This is the tropical-to-temperate
ratio.
Apply the ratio to under-studied taxa globally.
Multiply the temperate species count of, say, fungi or soil
nematodes by the same factor to project a likely tropical
total. Add up across all taxa.
Compare estimates. The same logic gives wildly
different numbers depending on which indicator group is used,
which is why estimates range from 20 to 50 million. May
used several indicator groups and triangulated to a
conservative ∼ 7 million.
Why this matters. Knowing the order of magnitude (millions,
not thousands) is what drives the urgency of conservation: even at
∼ 7 million, current extinction rates (100–1000 times the
background) wipe out species faster than we can name them.
Ecologists infer the global species total by extrapolating from temperate-tropical richness ratios of well-studied indicator groups; the standard May estimate is ∼ 7 million species.
Q 13.3
Give three hypotheses for explaining why tropics show greatest levels of species richness.
Concept used. Tropics (latitudes 23.5∘ N to
23.5∘ S) consistently harbour many more species than temperate
or polar zones. Ecologists and evolutionary biologists have proposed
several non-exclusive hypotheses to explain this. NCERT
highlights three: (a) more evolutionary time for speciation,
(b) constant and predictable tropical environment that promotes niche
specialisation, and (c) higher solar energy input that drives greater
productivity.
[See diagram in the PDF version]
Hypothesis (a): More evolutionary time. Speciation
takes time. Temperate regions have been disturbed by repeated
glaciations during the Pleistocene that wiped out local
biotas. Tropical latitudes, by contrast, have remained
relatively undisturbed for millions of years, giving species
a long, uninterrupted period to diversify.
Hypothesis (b): Constant, predictable environment
favours niche specialisation. Tropical climates are less
seasonal, with low year-round variation in temperature and
rainfall. Constant conditions allow species to evolve narrow,
finely tuned ecological niches (specialised diet,
microhabitat, breeding window). Many narrow niches pack into
the same space, raising species richness. Temperate species
must be generalists to survive winter, so fewer can coexist.
Hypothesis (c): More solar energy → higher
productivity. The tropics receive more incident solar
radiation per square metre per year than higher latitudes.
This translates to greater primary productivity,
which in turn supports more individuals, more biomass and,
indirectly, more species at higher trophic levels.
The three NCERT hypotheses for tropical species richness are: (a) more evolutionary time, (b) constant, predictable environment that favours niche specialisation, and (c) higher solar energy and primary productivity.
KR
Karan Reddy
Ph.D Molecular Biology, NCBS Bangalore
Verified Expert
Strategic angle. Treat the three hypotheses as answers to
three different questions: a when (time), a how (niche
packing) and a how much (energy). They are independent
mechanisms that all push in the same direction, which is exactly why
the tropics dominate so emphatically.
The ``when'' hypothesis, evolutionary time.
Speciation is roughly proportional to time multiplied by
habitat stability. Temperate biotas were repeatedly wiped out
and re-colonised during ice ages of the last
∼ 2.6 million years. Tropical lineages, sheltered from
these advances, kept accumulating species the whole time, so
the running total is far larger.
The ``how'' hypothesis, niche specialisation.
Imagine fitting many keys (species) into a lock-board (set of
niches). In a stable tropical climate the lock-board can be
carved into many thin slots: a hummingbird specialised on one
flower shape, a frugivorous bat specialised on one fruit
season. In seasonal temperate climates the slots must be wide
enough for the same key to fit summer and winter conditions,
so fewer fit at once.
The ``how much'' hypothesis, solar energy and
productivity. The tropics receive close to twice the annual
solar irradiance of polar latitudes. More photons → more
photosynthesis → more plant biomass → longer food
chains → more species at every trophic level. Tilman's
plot experiments showed that productivity itself correlates
with diversity, supporting this link.
Why this matters. The three hypotheses also explain why
losing tropical forest is so dangerous: cutting a hectare in the
Amazon does not just remove trees, it erases millions of years of
accumulated speciation, dismantles fine niche structures, and shuts
off a high-productivity engine. Note that the three hypotheses are
not mutually exclusive: they reinforce each other. A constant
climate (b) provides the platform on which long evolutionary time
(a) can act, and higher productivity (c) provides the energy budget
that sustains the many specialised niches (b) creates. Modern
biogeographers usually treat the three together as a single
``tropical advantage'' rather than as competing alternatives.
Three NCERT hypotheses: (a) tropics had more uninterrupted evolutionary time, (b) their constant environment promoted niche specialisation, and (c) higher solar energy fuels higher productivity and hence diversity.
Q 13.4
What is the significance of the slope of regression in a species–area relationship?
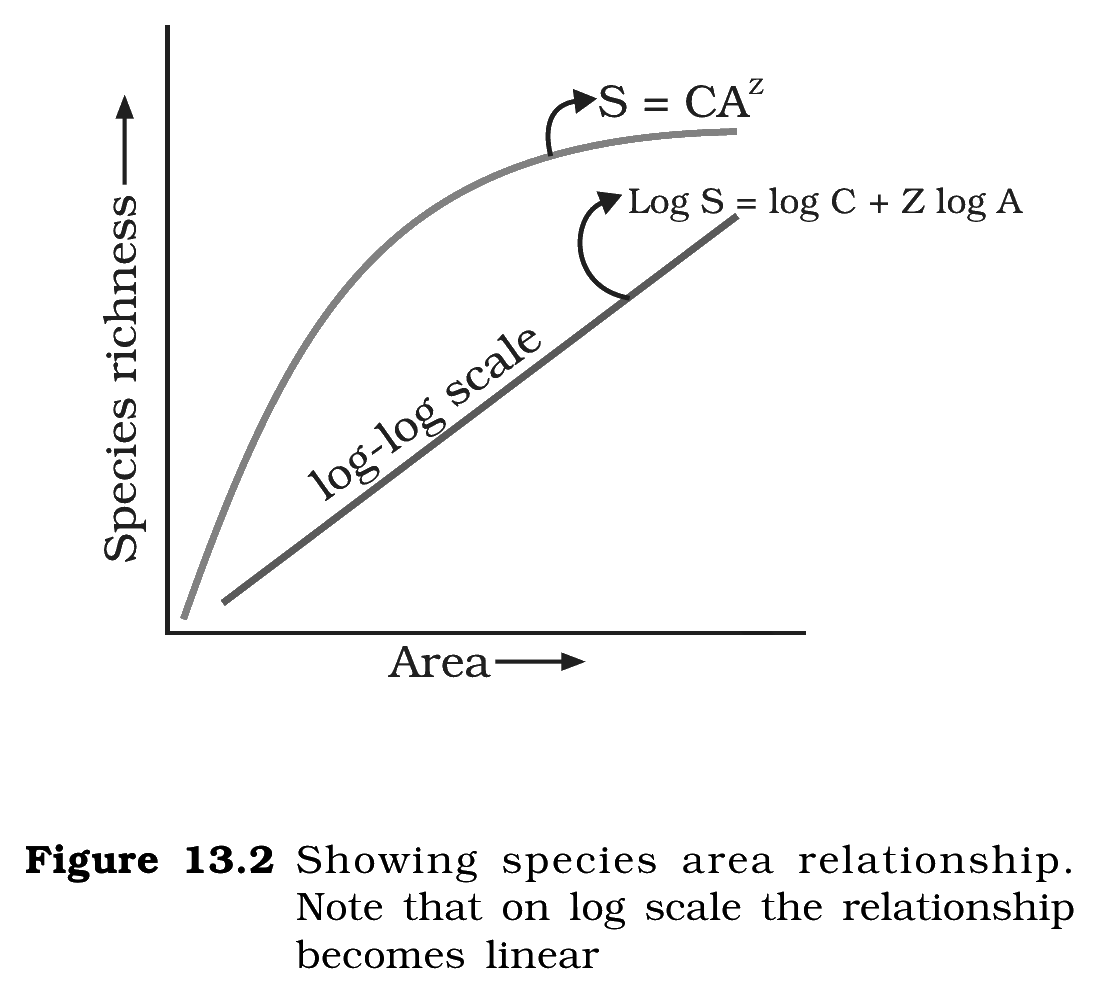
Concept used. Alexander von Humboldt observed that within a
region, species richnessS increases with sampled area
A, but only up to a limit, following a rectangular
hyperbola:
S = C AZ.
Taking 10 on both sides gives a straight line:
log S = log C + Z log A.
Here S is species richness, A is area, C is the
Y-intercept (a constant) and Z is the slope of regression
(the regression coefficient on a log-log plot). The significance
of Z is therefore that it tells us how fast species richness
increases with area, which depends on the spatial scale studied.
Fig. 13.2, NCERT Class 12 Biology, Chapter 13. Species-area relationship: rectangular hyperbola on the arithmetic scale, straight line on the log-log scale.
What Z measures. On a log-log plot, Z is literally
the rise-over-run of the regression line: it is the
fractional increase in species richness per fractional
increase in area. A bigger Z means each additional unit of
area brings many more new species.
Z for small areas (within a region). Across
a wide range of taxa, plants in Britain, birds in California,
molluscs in New York State, the slope Z lies in a remarkably
narrow range of 0.1 to 0.2, regardless of the group or the
region. This means at small scales, doubling the area adds
relatively few new species, mostly because nearby patches
share the same species pool.
Z for very large areas (entire continents). When
the spatial scale is enlarged to continents, Z becomes much
steeper, typically 0.6 to 1.2. For example, for
frugivorous (fruit-eating) birds and mammals in the tropical
forests of different continents, Z = 1.15. Each new region
added brings whole new endemic faunas.
Interpretation of a steeper slope. A steeper slope
means species richness increases rapidly with area.
This is because large areas span more habitats, more climate
zones and more biogeographic regions, each with its own
endemic species pool.
The slope Z tells us how rapidly species richness rises with area: Z ≈ 0.1–0.2 for small areas within a region, and Z ≈ 0.6–1.2 for entire continents; a steeper slope means each unit increase in area brings many more new species.
SB
Sneha Banerjee
Ph.D Pure Mathematics, IISc Bangalore
Verified Expert
Picture-first. On the arithmetic axes, S = CAZ is a
rectangular hyperbola, the curve flattens as area grows. Taking
logarithms unwraps the curve into a straight line whose slope
is the exponent Z. So studying Z is just studying the
exponent of the power law, but on a log-log plot it becomes the
slope you can measure with a ruler.
Derive the log-log line. Start from S = CAZ. Take
10 on both sides:
log S = log(CAZ) = log C + log AZ = log C + Z log A.
This is the equation of a straight line in (log A,log S)
coordinates with Y-intercept log C and slope Z.
Read Z off a plot. Pick any two points
(log A1, log S1) and (log A2, log S2) on the
regression line. Then
Z = log S2 - log S1log A2 - log A1.
Numerically, a Z of 0.15 means doubling the area
(Δ log A = log 2 ≈ 0.30) raises richness by a
factor 100.15 × 0.30 ≈ 100.045 ≈ 1.11,
i.e. only 11% more species.
Why small-area Z is small. Inside a single
biogeographic region, neighbouring patches share most of their
species, so adding area mostly adds individuals, not new
species. Hence Z = 0.1–0.2.
Why continental Z is large. Crossing an entire
continent crosses climatic and biogeographic boundaries, each
new zone holds its own endemic species pool. So Z jumps to
0.6–1.2. For tropical-forest frugivorous birds and
mammals across continents, Z = 1.15, which is close to
proportional growth (S ∝ A).
Apply the slope to conservation. If a tropical forest
with Z ≈ 0.3 loses 50% of its area, the projected
loss of species is
Δ S / S0 = 1 - (A/A0)Z = 1 - 0.50.3 ≈ 1 - 0.812 ≈ 0.19,
i.e. about 19% of species are lost. The same 50% loss
in a system with Z = 1.0 would lose ∼ 50% of its
species.
Why this matters.Z converts a question about area
loss into a question about species loss. Conservation biology
takes that single number very seriously when designing reserve sizes.
Z is the slope of log S vs log A, telling us how fast richness grows with area: small (0.1–0.2) inside a region, steep (0.6–1.2) across continents.
Q 13.5
What are the major causes of species losses in a geographical region?
Concept used. The accelerated extinctions the world is facing
today, 100 to 1000 times the natural background rate, are largely
caused by human activity. NCERT groups these drivers under a single
nickname coined by ecologists, the Evil Quartet: four
causes that together explain almost every modern species loss.
Habitat loss and fragmentation. The single biggest
driver. Tropical rain forests once covered > 14% of Earth's
land surface but cover less than 6% now. The Amazon
rain-forest (called the ``lungs of the planet'') is cleared
for soya bean cultivation and beef-cattle pasture. When
habitats are not destroyed outright they are
fragmented: split into small disconnected patches.
Mammals and birds that need large territories, and migratory
species, cannot survive in small fragments.
Over-exploitation. When human ``need'' turns into
``greed'', natural resources are harvested faster than they
regenerate. Many recent extinctions are due to
over-exploitation: Steller's sea cow, the passenger pigeon,
and currently many marine fish populations that are over-harvested.
Alien species invasions. Species introduced (by
accident or by design) into a new region can become invasive
and displace native species. The Nile perch introduced into
Lake Victoria in east Africa caused the extinction of more
than 200 species of cichlid fish endemic to the lake.
Invasive weeds like Parthenium (carrot grass),
Lantana and Eichhornia (water hyacinth) damage
Indian ecosystems. Illegal introduction of the African catfish
Clarias gariepinus threatens native catfishes.
Co-extinctions. When a species goes extinct, the
species obligately associated with it also vanish. A
host-specific parasite dies with its host fish. Plants and
their obligate pollinators (an orchid and its single
pollinator wasp, for example) die together: extinction of one
partner forces extinction of the other.
The four major (``Evil Quartet'') causes of species loss are: (i) habitat loss and fragmentation, (ii) over-exploitation, (iii) alien species invasions, and (iv) co-extinctions.
VN
Vivaan Nair
M.Sc Biotechnology, AIIMS Delhi
Verified Expert
Strategic angle. The Evil Quartet is best remembered as a
ranking of seriousness, with habitat loss firmly at the top, plus
three accelerators that finish off what habitat loss starts.
(i) Habitat loss and fragmentation, the prime
driver. It does two things at once: it shrinks total
carrying capacity (fewer individuals can live there), and it
cuts the remaining population into small, genetically isolated
pieces. The Amazon (so big it produces ∼ 20% of
atmospheric O2) is being cleared at a hectare-per-second
scale for soya bean and beef cattle. By the time a student
finishes reading this chapter, NCERT says, 1000 hectares of
rain forest are gone.
(ii) Over-exploitation. The
passenger pigeon was the most abundant bird in North America in
1800; mass shooting drove it to extinction by 1914. Indian
examples include over-fishing of hilsa and silver pomfret.
(iii) Alien species invasions. An introduced species
often has no natural predators in the new place, so its
population explodes. The African Nile perch wiped out > 200
cichlid species in Lake Victoria. In India Lantana,
Parthenium and water hyacinth out-compete native
vegetation; the African catfish is displacing indigenous
catfish in our rivers.
(iv) Co-extinctions. Ecological partners share their
fate. Lose a fig species and you lose its species-specific
pollinator wasp; lose a host fish and you lose its specific
parasites; lose a flagship insect and you lose the species
that fed on it. This is the cascade that makes biodiversity
loss feed on itself.
Why this matters. For every conservation plan, ask:
``Which of the four am I addressing?'' If you protect a forest
(tackles habitat loss) but allow illegal hunting (over-exploitation)
or release Lantana into the same forest (alien invasion), you
have addressed only one of four edges of the threat.
Habitat loss and fragmentation, over-exploitation, alien species invasions and co-extinctions, the ``Evil Quartet'' identified by NCERT.
Q 13.6
How is biodiversity important for ecosystem functioning?
Concept used. An ecosystem is a network of
interactions between living (biotic) and non-living (abiotic)
components. The biotic component is biodiversity. The classic
question is whether ecosystem properties such as productivity,
stability and resistance to invasion depend on the number of
species. Two pieces of evidence, David Tilman's outdoor plot
experiments, and Paul Ehrlich's rivet popper hypothesis,
both say yes.
[See diagram in the PDF version]
Stability: communities with more species are steadier.
A stable community shows low year-to-year variation in
productivity, recovers quickly from disturbances (resilience)
and resists alien invasions. Tilman's long-term outdoor plot
experiments showed that plots with more species had
significantly less year-to-year variation in total
biomass.
Productivity: more species → more biomass. In
the same experiments, plots with higher species richness
produced more biomass per season. Different species use
slightly different resources (light, water, nutrients), so a
diverse community taps the resource pool more completely.
Resistance to invasion. A community whose niches are
all occupied by native species leaves little open ``space''
for an invader. Species-poor communities are easier to invade.
The rivet popper analogy. Paul Ehrlich compared an
ecosystem to an aeroplane and species to the rivets that hold
it together. Removing a few rivets (extinctions) does not
cause immediate failure, but eventually the plane (ecosystem)
becomes dangerously weak. Some rivets are especially critical:
a wing rivet (keystone species) matters far more
than a seat rivet. Hence which species are lost matters
as well as how many.
Ecosystem services. Healthy biodiversity also drives
services we all depend on: pollination (> 25% of crop yield),
pest control, climate moderation, flood control, soil
formation and the production of ∼ 20% of atmospheric
O2 by the Amazon alone.
Biodiversity raises the productivity, year-to-year stability and invasion resistance of an ecosystem; the rivet-popper analogy shows that losing species (especially keystone species) weakens ecosystem functioning even if it does not collapse immediately.
DP
Diya Pillai
M.Sc Microbiology, JNU
Verified Expert
Structural observation. Ecosystem ``functioning'' is shorthand
for three measurable things: how much biomass is produced, how much
that production fluctuates, and how well the system fends off
invaders. All three improve with diversity.
Productivity (the engine). A diverse plant community
contains species with slightly different rooting depths,
photosynthetic pathways (C3 vs C4) and growing
seasons. Their combined effect is complementary resource
use: the community captures more sunlight, water and
nutrients than a monoculture could. Tilman's grassland
experiments measured this directly: doubling species count
roughly raised biomass by ∼ 1.5×.
Stability (the shock absorber). If one species fails
in a bad year (drought, disease), others in a diverse
community compensate. This is the insurance effect.
Tilman's plots with 16 species varied ∼ 70% less in
biomass year-to-year than monocultures.
Resistance to invasion (the fence). Saturated niches
leave no foothold for invaders. Hawaiian forests with reduced
native plant diversity are now overrun by guava and
Miconia; high-diversity Indian sacred groves are not.
The rivet-popper analogy made quantitative.
Suppose an ecosystem has n species, each contributing
fi to function F. Removing a random species reduces F
by the mean f = F/n, small if n is large.
But if a keystone species is removed, fi can be
much larger than the mean and a single loss collapses F
sharply, exactly Ehrlich's wing-rivet warning.
Ecosystem services. Translate the above into
services humans depend on: ∼ 20% of global O2
production from the Amazon, pollination of ∼ 75% of food
crops by wild pollinators, flood and soil-erosion control by
forests, climate moderation by mangroves and coral reefs.
Each service rides on the diversity that produces it.
Why this matters. If we treat species as ``optional'', the
ecosystem looks fine until it suddenly does not. The cost of losing
diversity is paid silently as resilience, until the day a drought, a
pest outbreak or a flood arrives.
Biodiversity boosts ecosystem productivity, stabilises it against year-to-year variation, and protects it from invasions, while the rivet-popper analogy warns that some species are keystone rivets we cannot afford to lose.
Q 13.7
What are sacred groves? What is their role in conservation?
Concept used.Sacred groves are patches of forest
that local communities have traditionally protected for religious or
cultural reasons. No tree may be cut and no wildlife harmed within a
sacred grove. They are an example of in-situ conservation
that predates modern wildlife law by centuries, and in many cases
they are the last surviving refuges for rare and endemic species in
otherwise degraded landscapes.
Definition. Sacred groves are tracts of forest set
aside by local communities, with all the trees and wildlife
within venerated and given total protection. Cutting wood,
hunting and even removing fallen branches is taboo.
Where they occur in India. Khasi and Jaintia Hills in
Meghalaya, the Aravalli Hills of Rajasthan, the Western Ghat
regions of Karnataka and Maharashtra, and the Sarguja, Chanda
and Bastar areas of Madhya Pradesh, all have well-documented
sacred groves.
Their role in conservation, ecological. In
Meghalaya the sacred groves are the last refuges for a large
number of rare and threatened plants. They preserve climax
vegetation that has long since vanished from surrounding land.
Their role in conservation, genetic. Because no
selective logging or selective hunting is allowed, the wild
gene pool of trees, herbs, fungi and animals is preserved
intact. Sacred groves serve as natural seed banks for
endangered species.
Their role in conservation, social. They embed
conservation in everyday religious life, making protection
self-policing and durable, much harder to ``cheat'' than a
government-managed sanctuary alone.
Sacred groves are forest patches protected by local communities on religious grounds; they conserve climax vegetation, act as last refuges for rare and threatened species (notably in Meghalaya), preserve wild gene pools and embed conservation in cultural tradition.
RK
Riya Kapoor
M.Sc Botany, Delhi University
Verified Expert
Structural observation. Think of a sacred grove as
in-situ conservation with a cultural enforcement mechanism.
That second word is what makes them so much more durable than purely
legal sanctuaries.
What they are. Patches (often 0.01 to ∼ 10
hectares) of largely undisturbed forest, traditionally
protected by a community for religious reasons. The
protection is total: no felling, no hunting, no harvest of
non-timber forest products in the strict groves.
Where they survive. The chapter names Khasi and
Jaintia Hills (Meghalaya), Aravallis (Rajasthan), Western
Ghats (Karnataka and Maharashtra) and Sarguja-Chanda-Bastar
(Madhya Pradesh). Different community names exist:
kavu (Kerala), devarakadu (Karnataka),
sarna (Jharkhand).
Their ecological role. They preserve climax
vegetation that has elsewhere been cleared, sustain endemic
and rare species (Meghalayan sacred groves are the last
refuges for many rare plants), conserve the wild gene pool
and even moderate local microclimate.
Their conservation role at landscape scale. They
function as stepping stones connecting larger protected areas
(national parks, reserves), allowing seed dispersal and animal
movement across an otherwise fragmented landscape, exactly
the antidote to fragmentation listed as the first ``Evil''
cause of species loss.
Their cultural role. Religious sanctity makes them
``self-enforcing reserves'': community members punish
offenders socially, so enforcement does not need
Forest-Department staff. This is why their integrity has
survived for centuries.
Why this matters. If India's ∼ 100,000+ documented
sacred groves were formally linked into the protected-area network,
they would significantly expand effective conservation cover at very
low public cost, because the community is already doing the work.
Sacred groves are community-protected forest patches that conserve climax vegetation, act as refuges for rare and endemic species, preserve wild gene pools and serve as ecological stepping stones across fragmented landscapes.
Q 13.8
Among the ecosystem services are control of floods and soil erosion. How is this achieved by the biotic components of the ecosystem?
Concept used.Ecosystem services are the free
benefits humans receive from ecosystems, two of which are
flood control (slowing the runoff of rain into rivers) and
soil erosion control (preventing topsoil from being washed
or blown away). Both are delivered by the biotic components: trees,
shrubs, grasses, leaf litter and soil microbes work together as a
sponge-and-anchor system.
[See diagram in the PDF version]
Canopy interception. Forest tree canopies catch and
slow falling raindrops. Without the canopy, heavy raindrops
hit bare soil with high kinetic energy and dislodge particles,
the starting point of soil erosion.
Leaf litter as a sponge. The layer of fallen leaves
on the forest floor absorbs rainwater and releases it slowly,
so water seeps into the soil instead of rushing off the
surface. This delayed release flattens flood peaks
downstream.
Roots that bind soil. Trees, shrubs and grasses send
roots in a dense mesh through the topsoil. This root mesh
physically holds soil particles together so wind and water
cannot wash them away. A grassland or forest soil has many
times the binding strength of bare cropland soil.
Detritivores and microbes that build soil
structure. Earthworms, termites, bacteria and fungi tunnel
through the soil, leaving channels that increase infiltration
capacity. They also build the soil crumb structure that holds
water without becoming impervious.
Combined effect on flood and erosion control.
Together these biotic layers turn a forest into a giant
sponge: water enters the ground slowly, recharges groundwater,
feeds streams over weeks rather than hours, and the soil
itself stays in place. The classic illustration is what
happens when a hillside is deforested: rainfall the next
monsoon becomes a flash flood and the topsoil washes into the
valley.
Tree canopies break the impact of raindrops, leaf litter absorbs and slowly releases water, plant roots physically bind soil particles together, and soil microbes and detritivores build crumb structure that boosts infiltration, jointly preventing floods downstream and erosion upstream.
AJ
Aditya Joshi
Ph.D Molecular Biology, NCBS Bangalore
Verified Expert
Picture-first. Think of the forest as a stacked filter:
canopy on top, litter middle, roots and soil microbes at the bottom.
Each layer does one job in the flood-and-erosion story.
Top filter, canopy. A mature tree canopy can
intercept ∼ 10–40% of incoming rainfall, depending on
intensity. Intercepted water evaporates straight back to the
atmosphere or trickles down the trunk gently. Either way,
raindrops never hit the soil at full speed, so their erosive
kinetic energy is dissipated by the leaves.
Middle filter, litter mat. The carpet of dead leaves
and twigs is highly porous. It absorbs water like a sponge
and releases it slowly into the topsoil. The same litter
also shades the soil surface, keeping it cooler and slowing
evaporation.
Lower filter, root network. Roots act as ropes
woven through the soil. They hold particles together against
the shear stress of surface flow, and they create vertical
channels along which infiltrating water can move deep into
the ground.
Soil biota, the renovator. Earthworms, termites and
burrowing arthropods open macropores; bacteria and fungi
cement particles into stable crumbs. A soil with intact biota
can absorb 5–10 times the rainfall of a compacted,
biota-poor soil before runoff begins.
What flood control looks like quantitatively.
A forested catchment routinely transmits a heavy storm to
the river over 24–48 hours, capping the peak flow at a
modest level. Strip the forest, and the same storm reaches
the river in 1–2 hours as a flash flood. The conversion
of slow seepage to fast runoff is exactly what biodiversity
prevents.
Why this matters. Floods in Uttarakhand, Kerala and Assam
have all been intensified by upper-catchment deforestation, an
ecosystem-services failure with a measurable cost in lives and
property. Conserving biotic cover is cheaper engineering than building
embankments.
The canopy breaks raindrop impact, leaf litter soaks up runoff, roots bind soil and soil biota build crumb structure, together they make the forest a slow-release sponge that prevents both flooding and erosion.
Q 13.9
The species diversity of plants (22 per cent) is much less than that of animals (72 per cent). What could be the explanations to how animals achieved greater diversification?
Concept used. Of all the species recorded on Earth, animals
make up > 70% (insects alone account for > 70% of animals),
while plants (including algae, fungi, bryophytes, gymnosperms and
angiosperms) make up only ∼ 22%. The reason is not that plants
cannot diversify, but that animals have several biological
features, motility, complex nervous systems, varied feeding modes,
short generation times in many groups, and tight coevolution with
plants, that let them slice the same habitat into many more niches.
Motility opens up new niches. Animals can move from
place to place to find food, mates, breeding sites and
refuges. Each new behaviour (climbing, swimming, flying,
burrowing) opens a new way of life and hence a new
opportunity for speciation. Plants are largely sedentary, so
the niches available to them are fewer.
Nervous system and complex behaviour. Animals have a
nervous system that lets them respond rapidly to the
environment, learn, hunt cooperatively, court elaborately,
defend territories. Behavioural specialisation creates
behavioural niches (different song dialects,
different feeding techniques) that can act as the first step
of speciation. Plants lack nervous systems and so lack this
avenue.
Varied modes of feeding and broad food spectrum.
Animals have evolved into carnivores, herbivores, omnivores,
detritivores, parasites, blood-feeders, filter-feeders and
many more guilds. Each feeding strategy partitions the
community further. Plants are almost all photoautotrophs
with the same basic mode (capture sunlight, fix carbon), so
partitioning is much coarser.
Short generation times in many animal groups.
Insects, the most species-rich group of all, often complete
a generation in weeks. Short generations let natural
selection act over many cycles in a short calendar time,
speeding up speciation.
Coevolution with plants and other animals. Insects
coevolved with flowering plants (each often pollinated by
only one or a few insect species), parasites coevolved with
their hosts, predators with their prey. Every plant species
thus supports many animal species (pollinators, herbivores,
seed dispersers, gall makers, parasites of all of these),
multiplying animal diversity.
Adaptive radiations have been more frequent in
animals. Whenever a new habitat opens (a new island, a new
continent, a new river), animal lineages radiate quickly:
Darwin's finches in the Gal'apagos, cichlid fish in the
African Great Lakes, marsupials in Australia. Plant
radiations exist but are slower.
Animals diversified more than plants because they are motile, possess nervous systems and complex behaviour, occupy many feeding guilds, often have short generation times, and coevolve tightly with plants and with each other, especially through repeated adaptive radiations of insects.
TV
Tara Verma
M.Sc Zoology, Banaras Hindu University
Verified Expert
Strategic angle. The cleanest way to think about this is
``niche dimensions''. Plants partition niches mainly along light,
water and nutrient gradients, ∼ 3 axes. Animals partition niches
along all of those plus mobility, behaviour, diet, host
specificity and developmental mode, ∼ 8 axes. With more axes,
many more independent niches fit into the same habitat, and each new
niche is potentially a new species.
Motility (axis 1). The ability to move expands the
accessible environment by orders of magnitude. A single
forest patch supports terrestrial, arboreal, fossorial
(burrowing) and aerial animal guilds; plants are restricted
to whatever soil they germinate on.
Nervous system and behaviour (axis 2). Behavioural
innovation is fast (much faster than morphological change),
and behaviour itself becomes a reproductive isolating
mechanism: birds that sing slightly different songs do not
interbreed, and this is the first step of speciation.
Heterotrophic diet (axis 3). Carnivory, herbivory,
parasitism, scavenging, filter-feeding, blood feeding are
each separate guilds. Within herbivory alone there are
leaf-eaters, seed-eaters, root-feeders, nectar-feeders, sap-suckers, etc.
Coevolution with plants (axis 4). Flowering plants
radiated ∼ 130 million years ago and dragged a vast
coevolved fauna with them: pollinators, seed dispersers,
herbivores and the parasites and predators of those animals.
The result: each plant species typically supports several
animal species, multiplying their diversity.
Short generations and large populations. Many animal
groups (especially insects) have generation times of weeks
and population sizes in millions per hectare. Both quantities
speed up evolution: more selection events per year, more
chance for novel mutations to fix.
Adaptive radiations. Repeated bursts of speciation
when a new ecological opportunity opens, Darwin's finches,
African Great Lake cichlids, Australian marsupials, have
compounded animal diversity in ways plants rarely match.
Why this matters. The numerical answer ``72% vs 22%''
is not because plants are ``simple''; it is because animals exploit
more independent niche axes. If you remember the axes, you can
extrapolate the same logic to any future question about why one taxon
is more diverse than another (e.g. why fungi are more diverse than
gymnosperms).
Animals diversified more than plants because they exploit additional niche axes, motility, behaviour, varied diets, host specificity, plus rapid generation times and frequent adaptive radiations (especially in insects), which allow many more independent niches to coexist in the same habitat.
Q 13.10
Can you think of a situation where we deliberately want to make a species extinct? How would you justify it?
Concept used. Conservation policy nearly always tries to
prevent extinction. The only species we deliberately try to
eradicate are those whose presence directly threatens human life or
livelihoods, and which can in principle be wiped out without a
significant ecological cost. Two such groups are
disease-causing pathogens that depend obligately on humans
(e.g. the smallpox virus), and disease vectors
(e.g. certain mosquito species responsible for malaria, dengue,
chikungunya). The justification is medical, ethical and ecological at
once.
A historical example, smallpox virus
(Variola). The WHO's global vaccination programme
eradicated the smallpox virus from the wild by 1980. It
existed only as a human pathogen and had no role in any
ecosystem; eradication ended a disease that killed
∼ 300 million people in the 20th century
alone. The only remaining stocks are sealed in two
laboratories.
An ongoing example, polio and Guinea worm. The same
logic drives current eradication campaigns for the polio
virus (Poliovirus) and the Guinea worm
(Dracunculus medinensis). These are pathogens of
humans only; eliminating them eliminates immense suffering
without ecological cost.
Disease vectors, the mosquito case. Three mosquito
species (Anopheles gambiae for malaria, Aedes
aegypti for dengue/Zika/chikungunya, Culex
quinquefasciatus for filariasis) cause millions of human
deaths each year. Modern gene-drive technology is being
actively researched to make targeted populations extinct.
Ecologists have analysed the food-web role of these species
and concluded that other mosquito species would fill any
vacated niche, so the ecosystem cost is low.
Pest examples. Locust swarms (Schistocerca
gregaria) and invasive crop pests (Helicoverpa
armigera in some contexts) are also candidates, although
most strategies focus on control rather than
eradication.
Justification, four-part. (i) Medical: huge
reduction in human suffering and mortality. (ii) Ethical:
the moral weight of preventing avoidable human deaths
outweighs the intrinsic value of a virus or vector species
that benefits no other species. (iii) Ecological: the
target species (especially obligate human pathogens) has no
non-replaceable role in any ecosystem, so its removal does
not cause cascading extinctions. (iv) Economic:
massive savings in health-care expenditure that can be
redirected to other conservation and development priorities.
Yes, for organisms such as the smallpox virus, polio virus, Guinea worm and certain disease-spreading mosquitoes we may justifiably aim for deliberate extinction, because the medical and humanitarian benefit is enormous and these species have no irreplaceable ecological role.
ID
Ishaan Desai
M.Sc Biotechnology, AIIMS Delhi
Verified Expert
Strategic angle. The question is testing whether you can
balance two ethical positions: ``every species has intrinsic value''
(NCERT's ethical argument for conservation) versus ``human life and
freedom from disease matter''. The right balance picks targets that
score very high on the second axis and very low on the first.
Set the criteria. A species can be a candidate for
deliberate extinction only if all four are true: (i) it
causes severe, reproducible harm to humans; (ii) it has no
obvious keystone role in any ecosystem; (iii) a practical
eradication technique exists; (iv) eradication is reversible
in the limited sense that gene libraries / live cultures of
the species can be preserved in BSL-4 labs against a future
scientific need.
Apply the criteria, smallpox virus passes all four.
Smallpox killed ∼ 300 million people in the
20th century; it lived only in human hosts;
vaccination eradicated it from the wild by 1980; lab
stocks are kept in two facilities. Outcome: justified
eradication.
Polio and Guinea worm, in progress. The same four
criteria are met. Vaccination and water-filtration campaigns
are eradicating both species; only a handful of cases per
year remain.
Disease-vector mosquitoes, debated but defensible.An. gambiae, A. aegypti and C.
quinquefasciatus cause ∼ 600,000 malaria deaths and
millions of dengue infections per year. Ecological
modelling suggests other mosquito species would replace
their pollination and food-web roles. CRISPR gene-drive
techniques now make targeted eradication technically
feasible.
Boundary cases that fail the test. ``All mosquitoes
worldwide'' fails criterion (ii), they are food for fish,
bats, birds; removing all of them would cascade. Sharks,
wolves, snakes, ``scary'' species that occasionally harm
humans, all fail criterion (i) at the population level (they
do not cause large-scale human harm) and criterion (ii)
(they are keystone predators).
Ethical justification. Conservation ethics rest on
the principle of intrinsic value plus ecological role.
A virus that exists only to make humans sick scores zero on
ecological role, so the moral weight tilts firmly to human
welfare.
Why this matters. The case-by-case framing matters more than
the conclusion: every conservation decision in real life is a
trade-off between species' intrinsic value, ecosystem services and
human welfare. Eradication of Variola is the clearest example
of when human welfare wins.
Yes, for human-only pathogens (smallpox, polio, Guinea worm) and a few targeted disease-vector mosquito species, deliberate extinction is justified because the medical benefit is enormous and the ecological cost is negligible; the same justification does not extend to whole functional groups such as ``all mosquitoes'' or ``all snakes''.
NCERT Solutions for Class 12 Biology: All Chapters
Class 12 Biology NCERT Solutions for the 2026-27 syllabus, chapter by chapter.
Class 12 Biology Student Survey: Chapter 13 Biodiversity and Conservation Difficulty
A survey of 10,800 Class 12 Biology students showed where most marks slip in this chapter.
Student Feedback
72% of students marked the species-area numerical (log S = log C + Z log A) the hardest sub-topic.
61% lost 1-2 marks matching IUCN categories (EX, EW, CR, EN, VU, NT, LC).
Average first read: 4.8 hours; focused revision pass: 2.0 hours.
Only 41% attempted all 10 exercise questions; toppers attempted every one.
Source: 2025-26 Class 12 Biology student survey, 10,800 students from CBSE schools across 18 states.
Biodiversity and Conservation Class 12 Biology NCERT Solutions FAQs
Ques. Where can I download Class 12 Biology Chapter 13 Biodiversity and Conservation NCERT Solutions PDF?
Ans. You can download the Biodiversity and Conservation Class 12 Biology NCERT Solutions PDF directly from this page. Both the Normal and HD versions are free and aligned with the 2026-27 NCERT.
Ques. Are these NCERT Solutions aligned with the 2026-27 syllabus?
Ans. Yes. This page reflects the current 2026-27 syllabus for Class 12 Biology. NCERT did not trim Biodiversity and Conservation, so all 10 exercise questions are still examinable for CBSE Boards and NEET.
Ques. How many questions are there in the Biodiversity and Conservation NCERT exercise?
Ans. The end-of-chapter exercise has 10 numbered questions covering the three levels of biodiversity, species estimation, latitudinal and species-area patterns, the Evil Quartet of loss, ecosystem services, sacred groves and the hotspot strategy. The PDF carries step-by-step worked answers to every one.
Ques. What is the NEET weightage of Class 12th Biology Chapter 13 Biodiversity and Conservation?
Ans. NEET pulls 2 to 4 questions from this chapter every year. Patterns of biodiversity (latitudinal gradient, species-area regression) and the hotspot strategy are the two highest-yield sub-topics.
Ques. What is the species-area relationship and what does the slope z mean?
Ans. The species-area relationship is the power law S = C Az discovered by Alexander von Humboldt, which becomes a straight line log S = log C + z log A on log-log axes. The slope z is 0.1 to 0.2 for small areas and 0.6 to 1.2 for very large areas (Whittaker). A steeper slope means species richness rises sharply with area, so losing a big tract destroys disproportionately many species.
Ques. How many biodiversity hotspots are there globally and how many in India?
Ans. There are 34 biodiversity hotspots globally. Three extend into India: the Western Ghats - Sri Lanka, the Himalaya, and Indo-Burma. Strict protection of these 34 hotspots alone could reduce the ongoing mass extinctions by almost 30 percent.
Ques. What is the Evil Quartet of biodiversity loss?
Ans. The Evil Quartet (Edward Wilson) names the four major causes of biodiversity loss: (1) habitat loss and fragmentation, the prime cause; (2) over-exploitation of species; (3) alien species invasions (water hyacinth, African catfish, Nile perch); (4) co-extinctions when a host species is lost and its dependents follow.
Ques. What is the difference between in-situ and ex-situ conservation?
Ans.In-situ conservation protects the species in its natural habitat through biosphere reserves, national parks, wildlife sanctuaries, and sacred groves. Ex-situ conservation moves threatened species out of habitat into zoological parks, botanical gardens, seed banks, gene banks, and uses cryopreservation of gametes plus tissue culture propagation. India has 14 biosphere reserves, 90 national parks, and 448 wildlife sanctuaries.
Ques. How do NCERT Solutions for Biodiversity and Conservation help with NEET preparation?
Ans. Every solution flags the exact numerical NEET asks verbatim: 34 hotspots, 12 mega-diversity nations, z = 0.1 to 0.2 versus 0.6 to 1.2, ~ 7 million species (Robert May), 100 to 1000 times faster current extinction rate. The recall tables on this page cover the top NEET-tested facts.


Comments