Biology Editor, NEET Mentor | Updated 3+ months ago
An ecosystem is a self-regulating unit of living organisms interacting with their abiotic environment. Class 12 Biology Chapter 12 Ecosystem covers productivity, decomposition, energy flow, ecological pyramids, succession and nutrient cycles. This page hosts the worked Solutions PDF for all 16 questions.
Each answer is graded in the four-step CBSE marking pattern. A parallel Expert's Solution adds the exact phrasing NEET lifts on energy flow and pyramids.
Written by NEET-rank-holder mentors at Collegedunia, mapped to the 2026-27 NCERT and cross-checked against the last five years of CBSE and NEET papers.
Why Ecosystem is a High-Yield Chapter for NEET 2027 and CBSE Boards
Ecosystem is a diagram-and-definition chapter, which is how CBSE and NEET frame the marks. Energy-flow pyramids, GPP-NPP-R links and the nutrient cycles give four predictable question shapes every year.
NEET 2025 pulled 3 direct-recall questions here; CBSE 2025 set a 5-marker on energy flow and a 2-marker on pyramids.
Five high-yield ecosystem facts NEET tests on repeat:
1. NPP = GPP − R. 2. Only 10% energy transfers to the next trophic level (Lindeman's law). 3. Pyramid of energy is always upright. 4. Detritivores fragment; saprotrophs mineralise. 5. Carbon reservoir = oceans (71%); phosphorus = rocks.
How Collegedunia's Ecosystem NCERT Solutions Help You Score
This Ecosystem NCERT Solutions PDF uses the exact terms CBSE awards full marks on. Every answer has a stepwise breakdown plus an Expert's Solution in the NEET angle.
Worked answers for all 16 questions in the CBSE four-step pattern: definition, mechanism, diagram, example.
Cross-checked against 5 NEET keys and the 2025 CBSE marking scheme.
Ecosystem NCERT Solutions: Exercise Breakdown by Sub-Topic
The 16 questions span six NCERT sub-topics. The table maps each question to its sub-topic and past NEET yield, so students can answer-plan in examiner order.
Sub-Topic (NCERT section)
NCERT Q Numbers
Question Count
NEET Yield (last 5 yrs)
Ecosystem Structure & Function (14.1)
Q1, Q2, Q3
3
1-2 questions
Productivity: GPP, NPP, R (14.2)
Q4, Q14
2
3-4 questions
Decomposition (14.3)
Q6, Q7
2
2 questions
Energy Flow & Trophic Levels (14.4)
Q5, Q8, Q13, Q15
4
4-5 questions
Ecological Pyramids (14.5) & Succession (14.6)
Q9, Q10, Q16
3
2-3 questions
Nutrient Cycling & Ecosystem Services (14.7-14.8)
Q11, Q12
2
2 questions
Energy flow and trophic levels (14.4) is the highest-yield NEET segment, about 35% of the chapter's pull. Productivity numerics (Q4, Q14) are CBSE 3-markers.
Ecosystem Class 12 Biology PYQ Trend (2025 to 2021)
This is the chapter's year-wise footprint across CBSE Boards and NEET, from the 2025 marking scheme and NEET keys.
Year
CBSE Class 12 Boards
NEET
Most-Asked Topic
2025
7 marks (5-marker on energy flow + 2-marker on pyramids)
3 questions
10% law / NPP
2024
5 marks (3-marker on carbon cycle + 2-marker on decomposition)
2 questions
Carbon cycle / detritivores
2023
6 marks
3 questions
Pyramid of biomass / GPP-NPP
2022
5 marks (term-2)
2 questions
Succession / phosphorus cycle
2021
5 marks (term-2)
2 questions
Productivity / standing crop
The five-year average is 5.6 marks in CBSE and 2.4 questions in NEET. Energy flow plus the nutrient cycles drive over 60% of NEET's pull, so prepare Q5, Q8, Q11 and Q12 first.
NEET prep tip: The pyramid of numbers (parasitic chain) and the pyramid of biomass (pond) can invert; the pyramid of energy is never inverted. NEET 2023 trapped 38% of candidates here.
Sample Fully-Solved Question: Energy Flow and the 10% Law (Q5 / Q13)
NCERT Q5 asks students to explain the single-channel energy flow model with a labelled diagram. The four-mark CBSE pattern follows.
Step 1 (1 mark) - Source. The sun is the only energy source. Producers capture <1% of incident PAR and fix it as GPP.
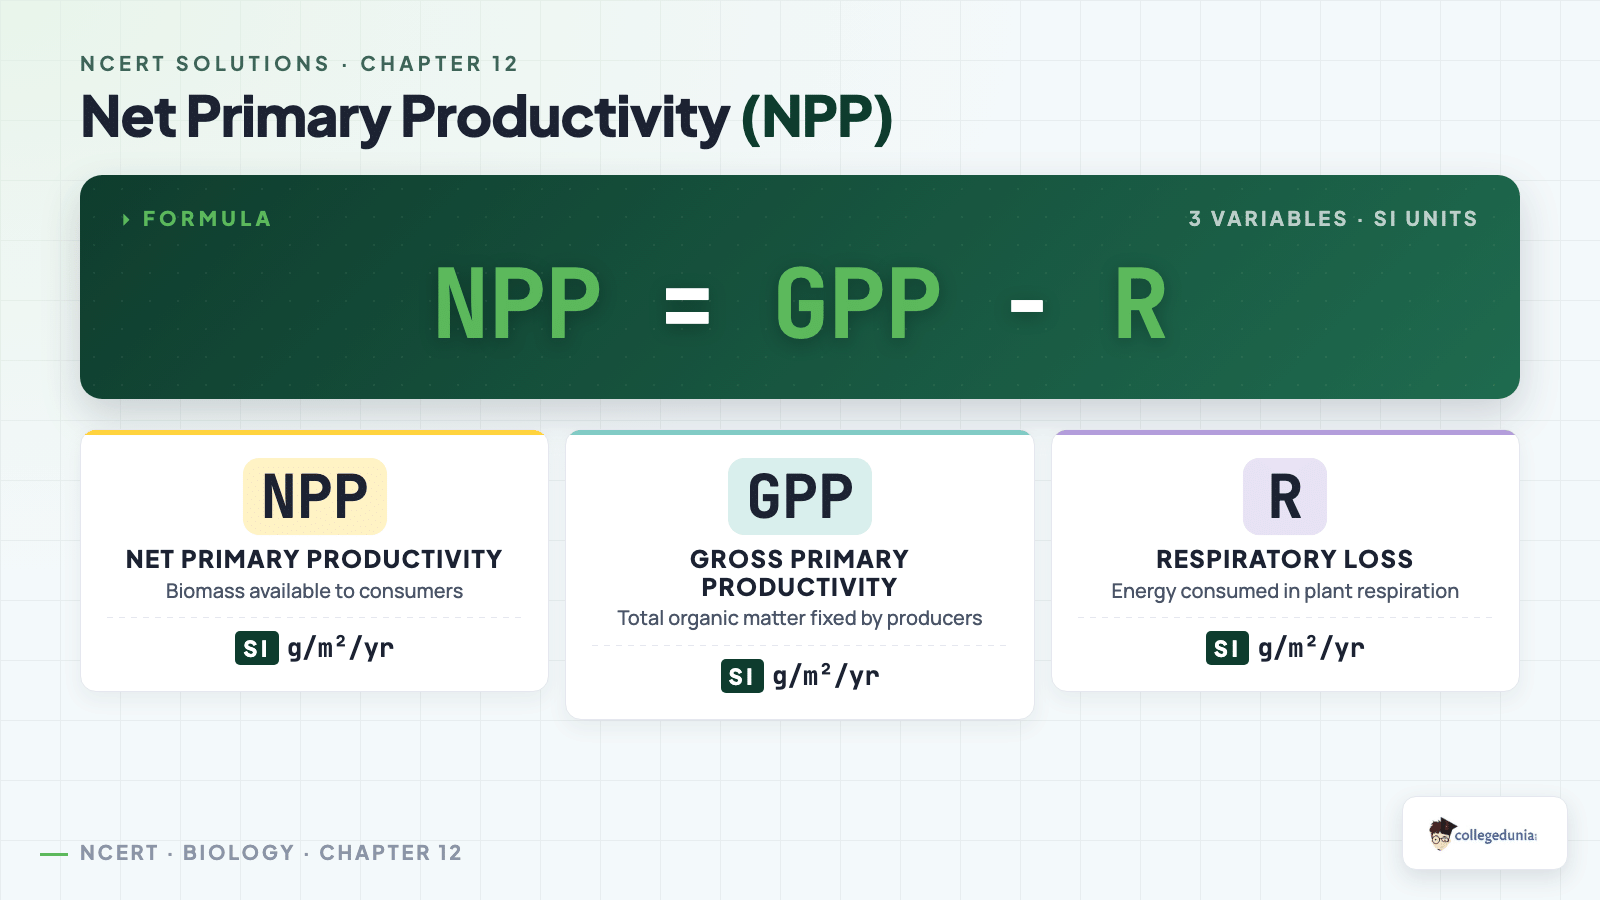
Step 2 (1 mark) - NPP equation. NPP = GPP − R, where R is the producer's respiratory loss. NPP is the energy available to herbivores.
Step 3 (1 mark) - 10% law. Only 10% of one level's energy passes to the next. The rest is lost as heat and un-assimilated matter.
Step 4 (1 mark) - Single-channel flow. Energy moves uni-directionally: Sun → Producer → Herbivore → Carnivore. It is never recycled.
CBSE 2024 gave zero marks to scripts that wrote "10% transfers" without naming Lindeman or the unidirectional flow.
Where Students Lose Marks in Ecosystem (Class 12 Biology)
Students rote-learn definitions but mis-state the pyramid type or reverse the productivity equation. The mistakes below cost the most.
Mistake 1. Writing GPP = NPP + Decomposition. The correct relation is NPP = GPP − R (R = producer respiration, not decomposition).
Mistake 2. Saying the pyramid of energy can invert. It is always upright; only numbers and biomass can invert.
How to Study Ecosystem for Class 12 Biology Boards in 3 Days
Energy flow and nutrient cycles are the most under-prepared sub-topics, yet NEET tests both yearly. The plan below splits the 16 questions by exam frequency.
Day
Focus
NCERT Q to Solve
Time
Day 1
Structure, productivity, decomposition (14.1 to 14.3)
Q1, Q2, Q3, Q4, Q6, Q7, Q14
3 hours
Day 2
Energy flow + pyramids + succession (14.4 to 14.6): major CBSE LA
Q5, Q8, Q9, Q10, Q13, Q15, Q16
3 hours
Day 3
Nutrient cycles + ecosystem services (14.7 to 14.8) + full revision + 1 PYP
Q11, Q12
2 hours
About 8 hours over 3 days, ending with one NEET-pattern PYP. Keep the productivity table on one A4 for night-before revision.
All NCERT Solutions for Ecosystem with Step-by-Step Working
Every NCERT textbook question for Class 12 Biology Chapter 12 Ecosystem is listed below with its full Solution and Expert Solution hidden inside collapsible tabs. Click Check Solution to reveal the step-by-step working; click Expert Solution for the expanded explanation.
Exercise: NCERT Biology Class 12 Chapter 12 Ecosystem
Q 12.1
Fill in the blanks.
(a) Plants are called as 2.5cm0.4pt because they fix carbon dioxide.
(b) In an ecosystem dominated by trees, the pyramid (of numbers) is 2.5cm0.4pt type.
(c) In aquatic ecosystems, the limiting factor for the productivity is 2.5cm0.4pt.
(d) Common detritivores in our ecosystem are 2.5cm0.4pt.
(e) The major reservoir of carbon on earth is 2.5cm0.4pt.
Concept used. A producer is an autotrophic organism
that fixes inorganic carbon (CO2) into organic matter through
photosynthesis. The shape of a pyramid of numbers
depends on how many individuals occupy each trophic level: it is
upright when producers outnumber consumers, but inverted
when a single large producer (like a tree) supports many small
consumers. Primary productivity in water is limited mainly by
sunlight penetration, since light dies out rapidly with depth.
Detritivores are organisms that feed on dead organic matter
(detritus), and the carbon reservoirs of the Earth are the
oceans (dissolved CO2 and carbonates), the atmosphere, and fossil
fuels.
(a) Plants take in atmospheric CO2 and build
sugars during photosynthesis; they are called
producers (or autotrophs).
(b) A single tree supports many herbivorous insects,
which in turn feed birds. So one producer supports many
primary consumers, making the pyramid of numbers
inverted (or spindle-shaped).
(c) In ponds, lakes and oceans, photosynthesising
algae and phytoplankton can only grow where light reaches.
Light intensity falls steeply with depth, so the limiting
factor for productivity is light (sunlight).
(d) Earthworms, dung beetles, millipedes, woodlice
and termites all break up dead leaves and faecal matter into
smaller pieces. The common detritivore in Indian ecosystems is
the earthworm (along with similar soil
invertebrates).
(e) About 71% of the global carbon is dissolved
in the oceans as carbonates and bicarbonates;
the oceans are therefore the largest active reservoir of
carbon on Earth.
Quick reading. Treat each blank as a flag for one core
ecosystem concept. The five blanks together cover trophic role
(autotrophy), pyramid geometry, abiotic limiting factor, detritus food
chain and biogeochemical cycling. Answering them well means naming
the concept first, then giving the textbook word.
Autotrophy (a). CO2 + H2O ->[light][chlorophyll] (CH2O) + O2.
Only organisms that can run this reaction fix carbon, so they
sit at the base of every food chain: producers.
Tree-based pyramid (b). One mango tree may host
∼ 104 caterpillars, which feed ∼ 102 birds, which
feed ∼ 10 hawks. Number of individuals increases
for two levels before falling, giving an
inverted (spindle) pyramid of numbers.
Aquatic limiting factor (c). On land, water often limits
productivity; in water, water is everywhere, so what's scarce
is light. Below the photic zone (often ∼ 200 m)
photosynthesis stops.
Detritivores (d). Detritus = dead leaves, faeces and remains.
Fragmenting agents include termites, mites, millipedes and the
all-purpose earthworm, which is called the
``farmer's friend'' for this very reason.
Carbon reservoir (e). Carbon distribution by mass:
oceans ≈ 71%, fossil fuels ≈ 22%,
soils + living biota ≈ 6%, atmosphere ≈ 1%.
The clear winner is the oceans.
Why this matters. Each blank links to a downstream chapter
question (Q2–Q11), so memorising these one-word answers also unlocks
the conceptual MCQs and the long-answer essay parts.
Which one of the following has the largest population in a food chain?
(a) Producers (b) Primary consumers (c) Secondary consumers (d) Decomposers
Concept used. In any standard grazing food chain,
energy passes from one trophic level to the next with heavy losses
(see Lindeman's 10% law). Because energy thins out as we move up,
each higher level can support fewer mouths than the one below it. So
the number of individuals generally falls from producers to top
carnivores in an upright pyramid of numbers.
Producers (plants, phytoplankton) capture solar energy
directly and use it to make biomass: they form the broadest
base of the food chain.
Primary consumers (herbivores) feed on producers. Because
energy transfer is only ∼ 10% efficient, herbivores must
be fewer in number than the producers that feed them.
Secondary consumers (small carnivores) and tertiary consumers
(top carnivores) keep losing energy at every step, so their
populations shrink further at each level.
Decomposers can be locally abundant, but in a food
chain (which traces energy flow from sun → producer →
consumer) producers always outnumber any single consumer
category. Hence the largest population is at the producer
level.
(a) Producers
KR
Karan Reddy
Ph.D Molecular Biology, NCBS Bangalore
Verified Expert
Strategic angle. Read this MCQ as a test of two ideas at
once: the energy-pyramid concept, and the discipline of staying
within the question's frame (``in a food chain'').
The pyramid of numbers in a typical grassland or pond is
upright, with producers at the broad base.
Energy lost as heat at every transfer (per Lindeman's 10%
rule) limits how many organisms a higher level can carry.
Decomposers act on detritus from every trophic level, so they
are not part of the linear grazing food chain implied here;
the question is about the chain, not the whole web.
Producers therefore hold the largest standing population.
Why this matters. This MCQ shows up in NEET almost every
year. The trap option is decomposers, which can be numerous in soil
but are off-chain.
(a) Producers
Q 12.3
The second trophic level in a lake is
(a) Phytoplankton (b) Zooplankton (c) Benthos (d) Fishes
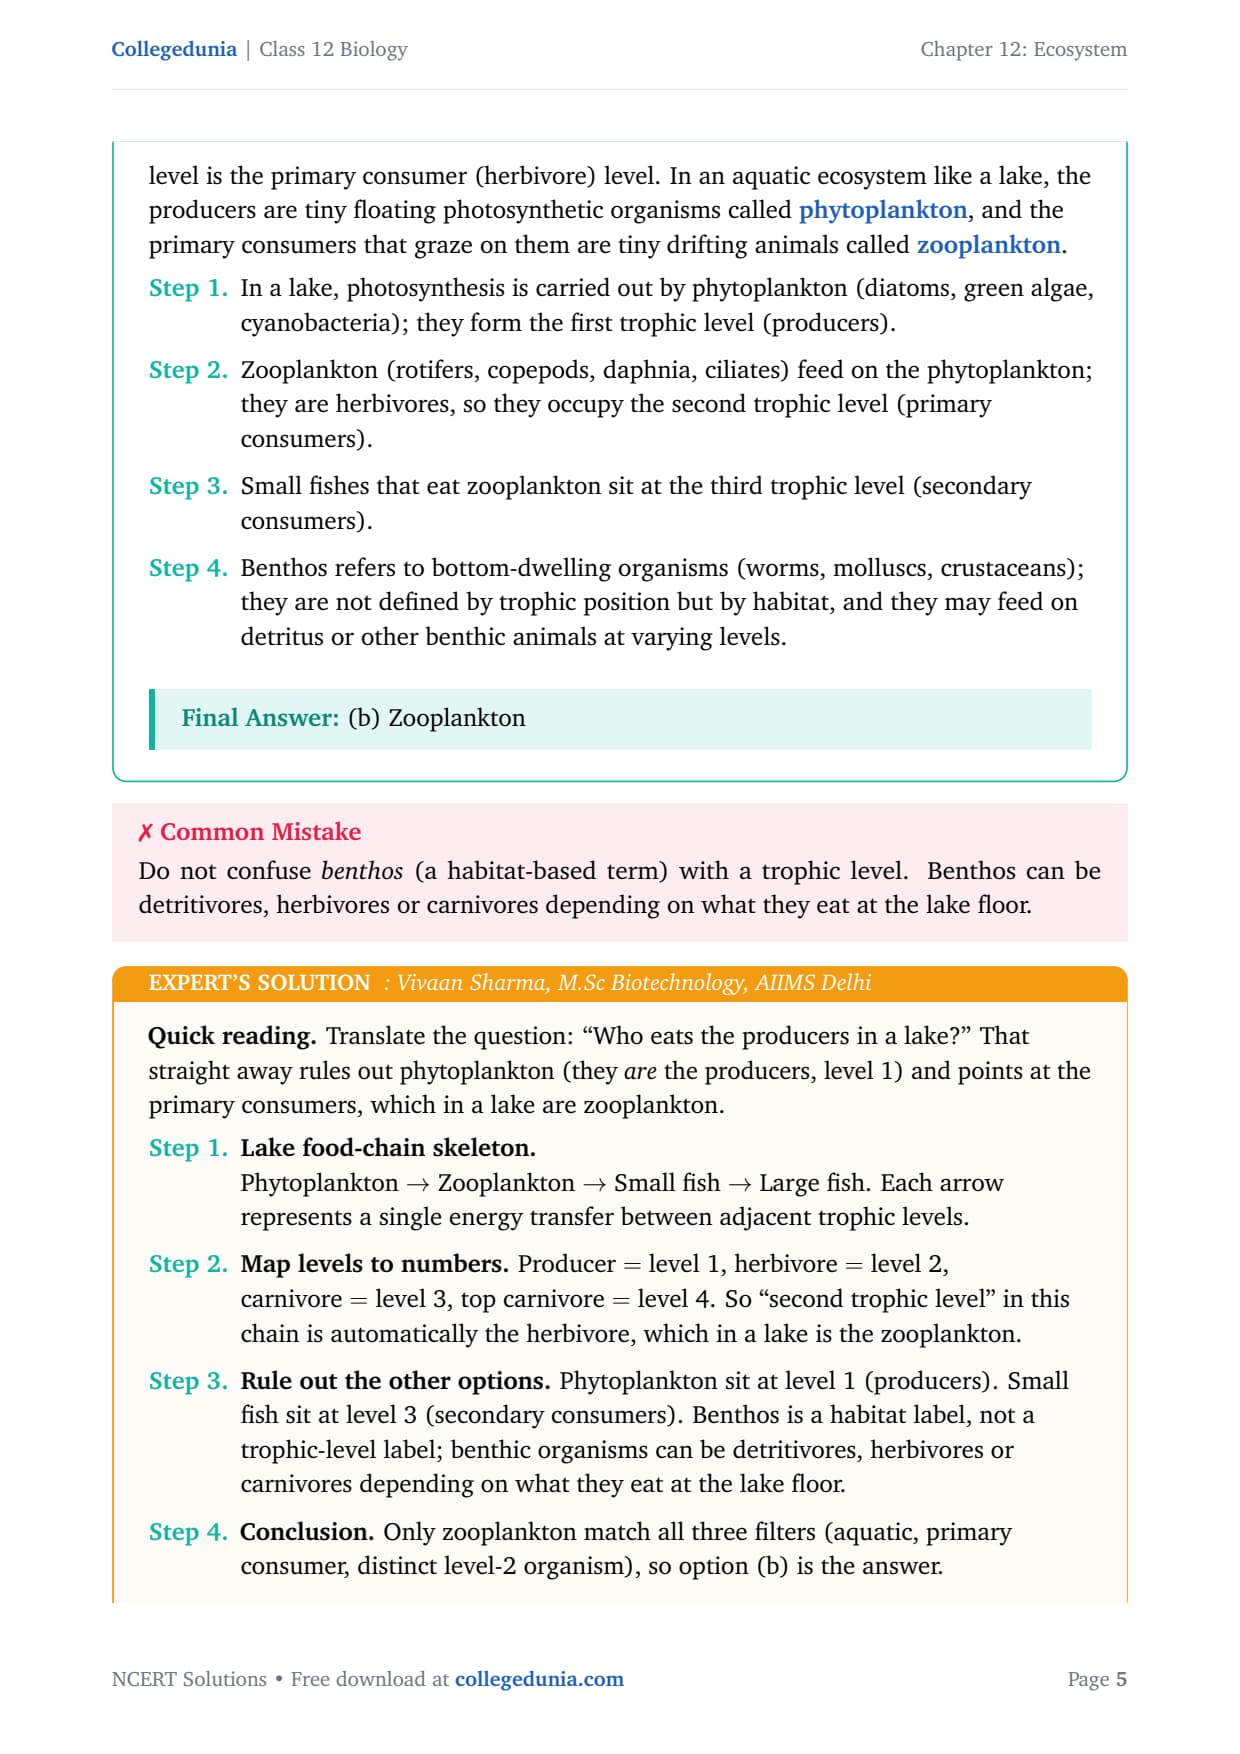
Concept used. A trophic level is the position an
organism occupies in a food chain based on its feeding role. The
first trophic level is the producer level. The second
trophic level is the primary consumer (herbivore) level. In an aquatic
ecosystem like a lake, the producers are tiny floating photosynthetic
organisms called phytoplankton, and the primary consumers
that graze on them are tiny drifting animals called
zooplankton.
In a lake, photosynthesis is carried out by phytoplankton
(diatoms, green algae, cyanobacteria); they form the first
trophic level (producers).
Zooplankton (rotifers, copepods, daphnia, ciliates) feed on
the phytoplankton; they are herbivores, so they occupy the
second trophic level (primary consumers).
Small fishes that eat zooplankton sit at the third trophic
level (secondary consumers).
Benthos refers to bottom-dwelling organisms (worms, molluscs,
crustaceans); they are not defined by trophic position but by
habitat, and they may feed on detritus or other benthic
animals at varying levels.
(b) Zooplankton
VS
Vivaan Sharma
M.Sc Biotechnology, AIIMS Delhi
Verified Expert
Quick reading. Translate the question: ``Who eats the
producers in a lake?'' That straight away rules out phytoplankton
(they are the producers, level 1) and points at the primary
consumers, which in a lake are zooplankton.
Lake food-chain skeleton.Phytoplankton → Zooplankton → Small fish → Large fish.
Each arrow represents a single energy transfer between
adjacent trophic levels.
Map levels to numbers. Producer = level 1,
herbivore = level 2, carnivore = level 3, top
carnivore = level 4. So ``second trophic level'' in this
chain is automatically the herbivore, which in a lake is the
zooplankton.
Rule out the other options. Phytoplankton sit at
level 1 (producers). Small fish sit at level 3 (secondary
consumers). Benthos is a habitat label, not a trophic-level
label; benthic organisms can be detritivores, herbivores or
carnivores depending on what they eat at the lake floor.
Conclusion. Only zooplankton match all three filters
(aquatic, primary consumer, distinct level-2 organism), so
option (b) is the answer.
Why this matters. The same lake food-chain is the textbook
example of an inverted biomass pyramid in Q8: phytoplankton standing
crop is small but supports a far larger zooplankton standing crop at
any instant because phytoplankton turn over every few days.
(b) Zooplankton
Q 12.4
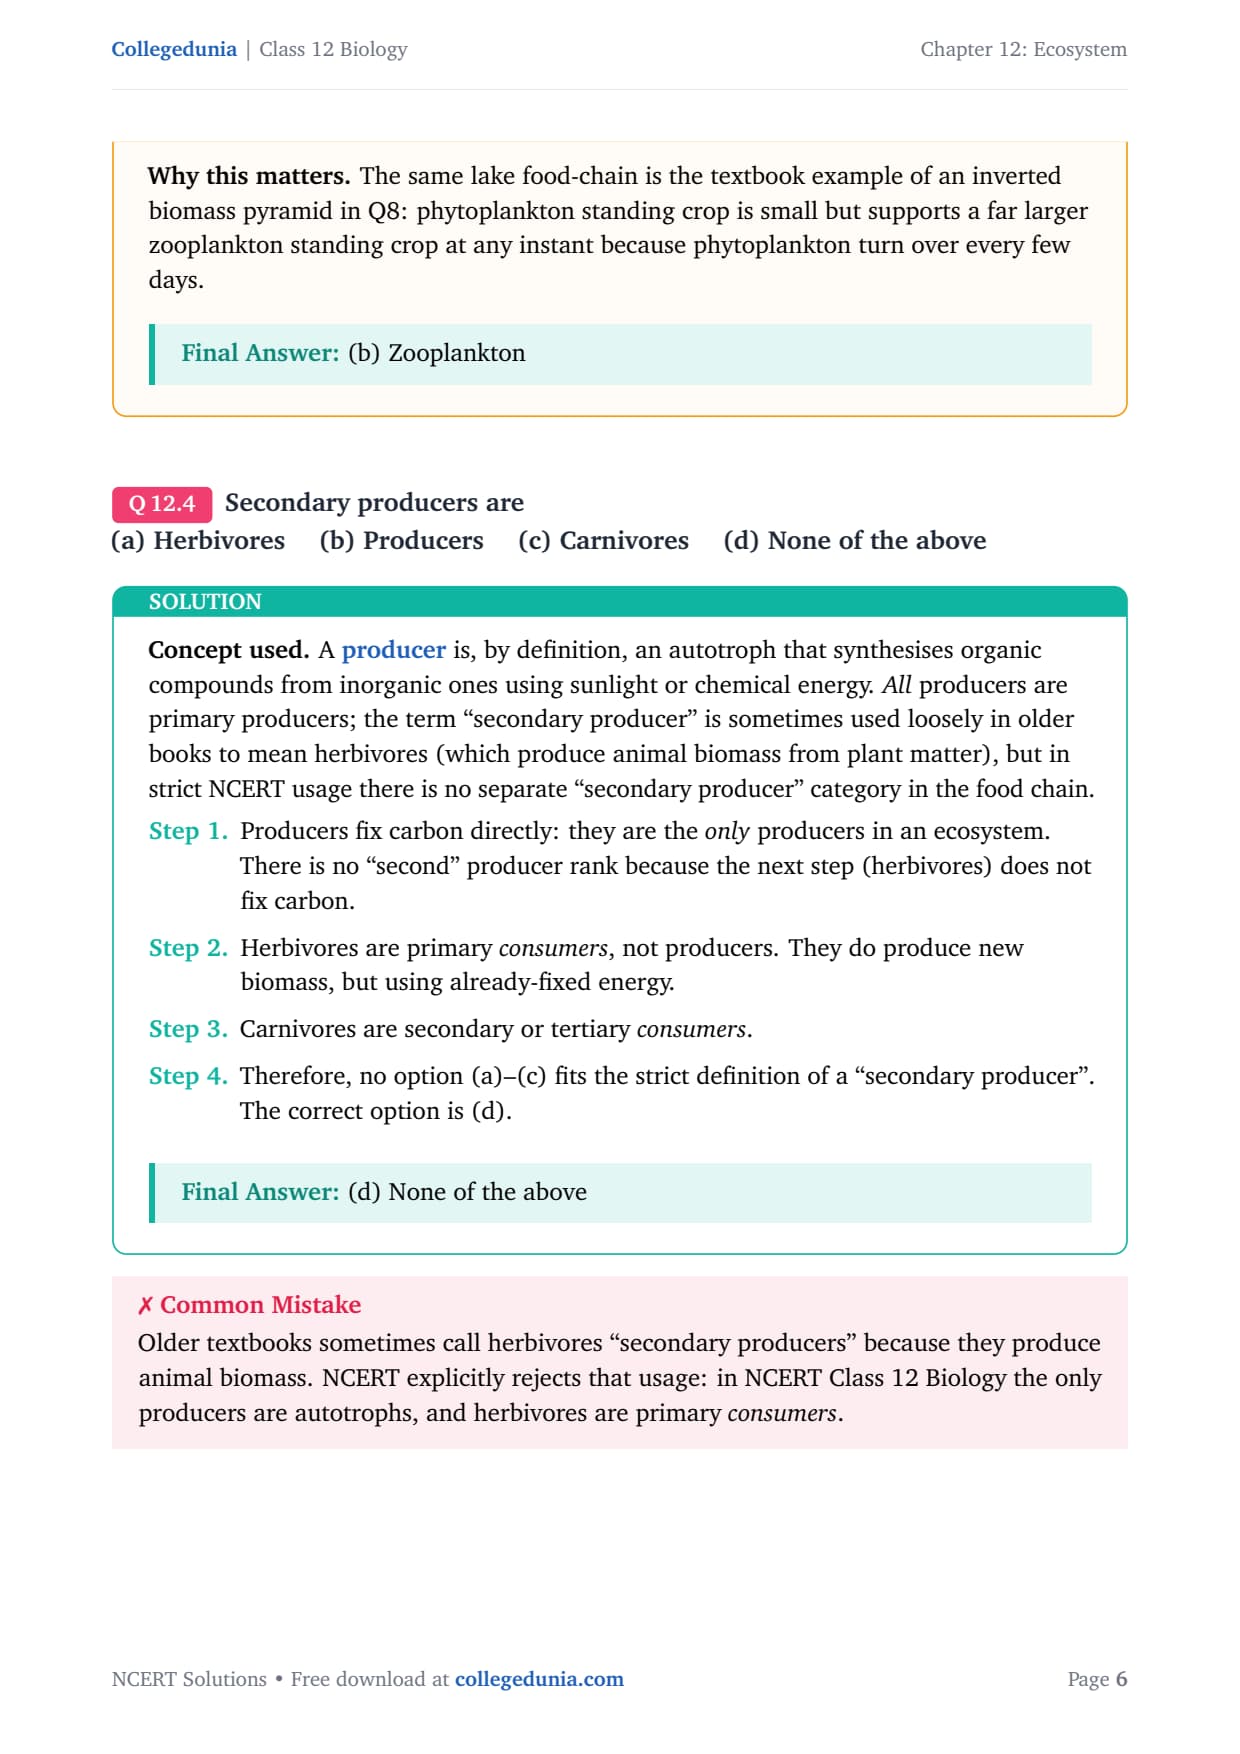
Secondary producers are
(a) Herbivores (b) Producers (c) Carnivores (d) None of the above
Concept used. A producer is, by definition, an
autotroph that synthesises organic compounds from inorganic ones
using sunlight or chemical energy. All producers are primary
producers; the term ``secondary producer'' is sometimes used loosely
in older books to mean herbivores (which produce animal biomass from
plant matter), but in strict NCERT usage there is no separate
``secondary producer'' category in the food chain.
Producers fix carbon directly: they are the only
producers in an ecosystem. There is no ``second'' producer
rank because the next step (herbivores) does not fix carbon.
Herbivores are primary consumers, not producers. They
do produce new biomass, but using already-fixed energy.
Carnivores are secondary or tertiary consumers.
Therefore, no option (a)–(c) fits the strict definition of a
``secondary producer''. The correct option is (d).
(d) None of the above
AB
Aditi Banerjee
Ph.D Molecular Biology, NCBS Bangalore
Verified Expert
Strategic angle. The trap option here is (a), because some
older textbooks call herbivores ``secondary producers''. NCERT
deliberately rejects that vocabulary, so the answer must be (d).
Producers in NCERT = autotrophs only (plants, algae,
cyanobacteria, chemosynthetic bacteria).
Consumers in NCERT = heterotrophs (herbivores, carnivores,
omnivores, detritivores).
There is no ``secondary producer'' category in NCERT's food
chain. Energy in animal biomass is secondary
productivity, but the animals themselves are consumers.
All of (a), (b), (c) fail, so (d) wins.
Why this matters. Read every MCQ option against the NCERT
glossary, not your general impression. A small word like ``producer''
has a tight, defended meaning.
(d) None of the above
Q 12.5
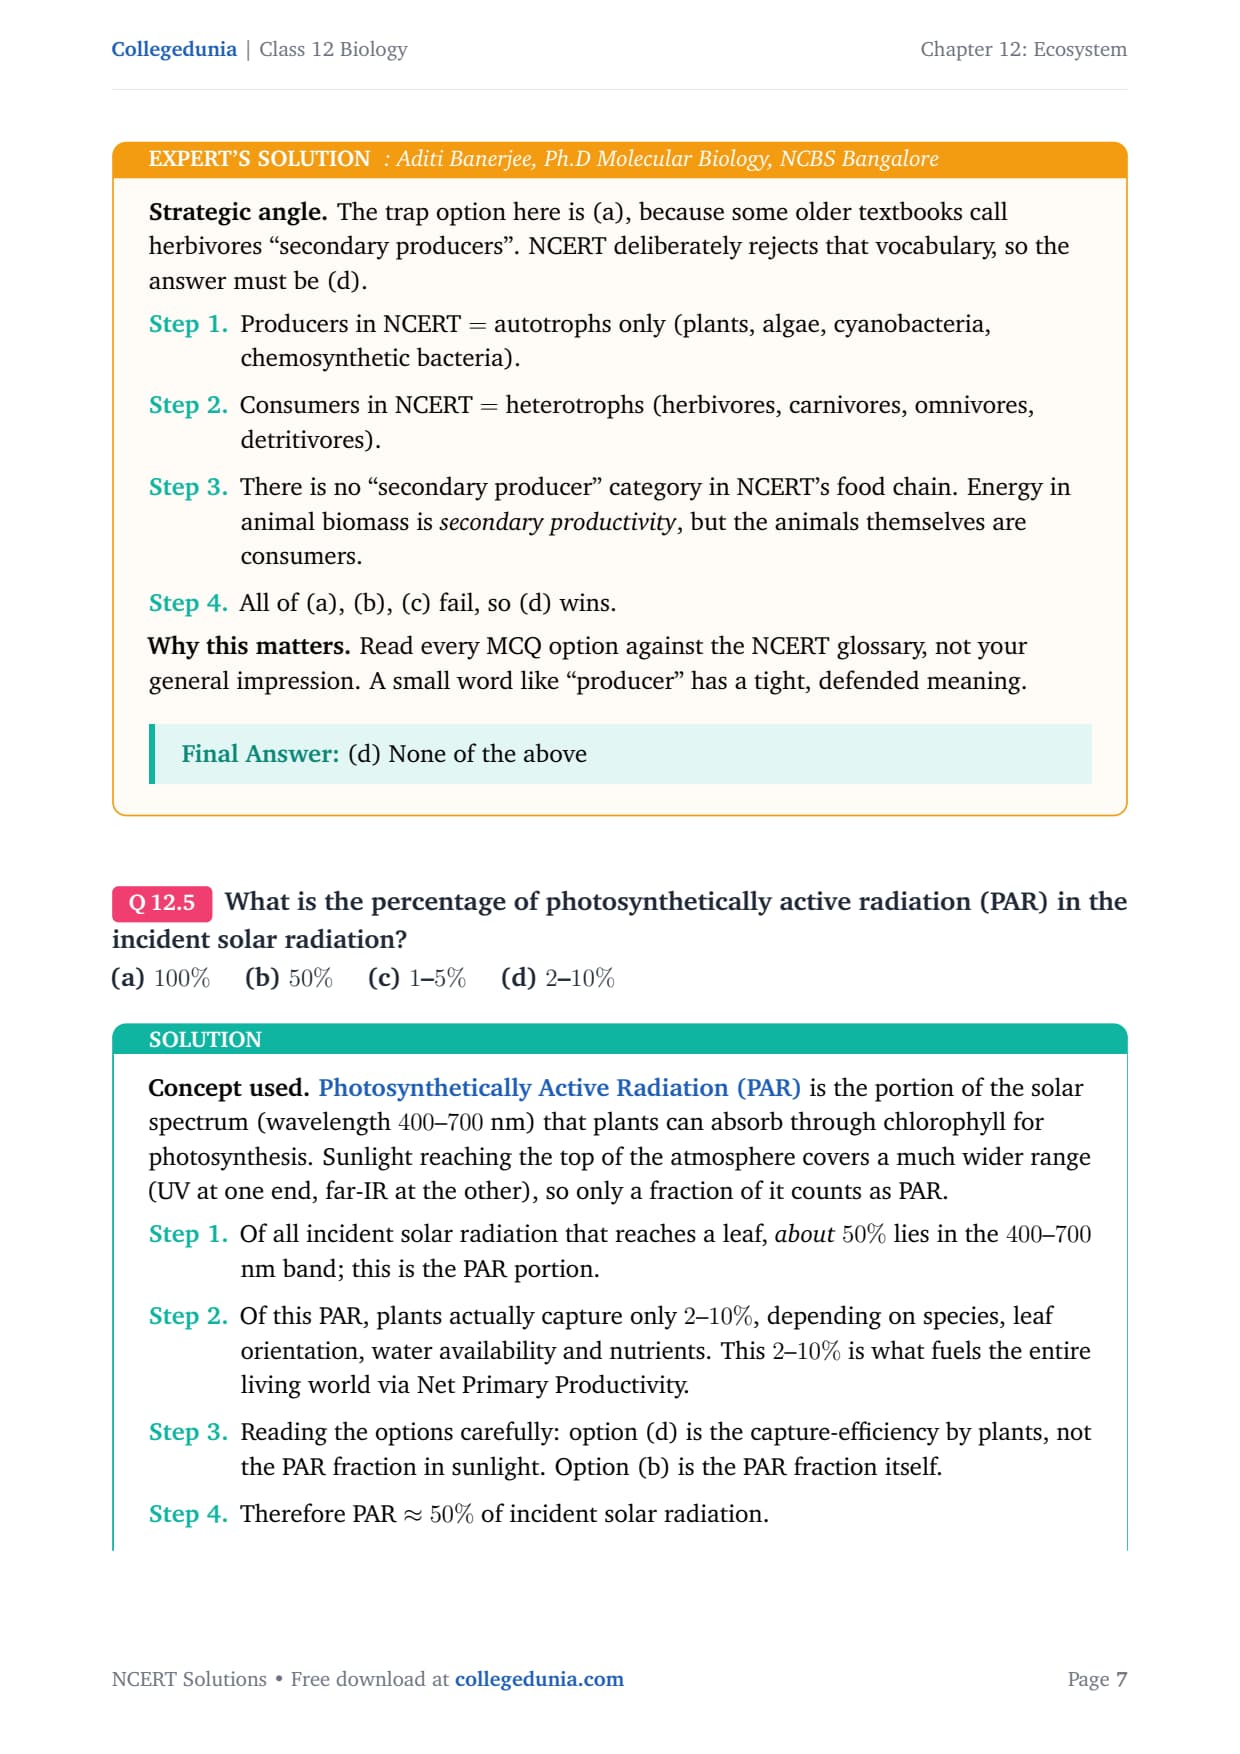
What is the percentage of photosynthetically active radiation (PAR) in the incident solar radiation?
(a) 100% (b) 50% (c) 1–5% (d) 2–10%
Concept used.Photosynthetically Active Radiation
(PAR) is the portion of the solar spectrum (wavelength 400–700 nm)
that plants can absorb through chlorophyll for photosynthesis.
Sunlight reaching the top of the atmosphere covers a much wider range
(UV at one end, far-IR at the other), so only a fraction of it counts
as PAR.
Of all incident solar radiation that reaches a leaf,
about 50% lies in the 400–700 nm band; this is
the PAR portion.
Of this PAR, plants actually capture only 2–10%,
depending on species, leaf orientation, water availability and
nutrients. This 2–10% is what fuels the entire living
world via Net Primary Productivity.
Reading the options carefully: option (d) is the
capture-efficiency by plants, not the PAR fraction in
sunlight. Option (b) is the PAR fraction itself.
Therefore PAR ≈ 50% of incident solar radiation.
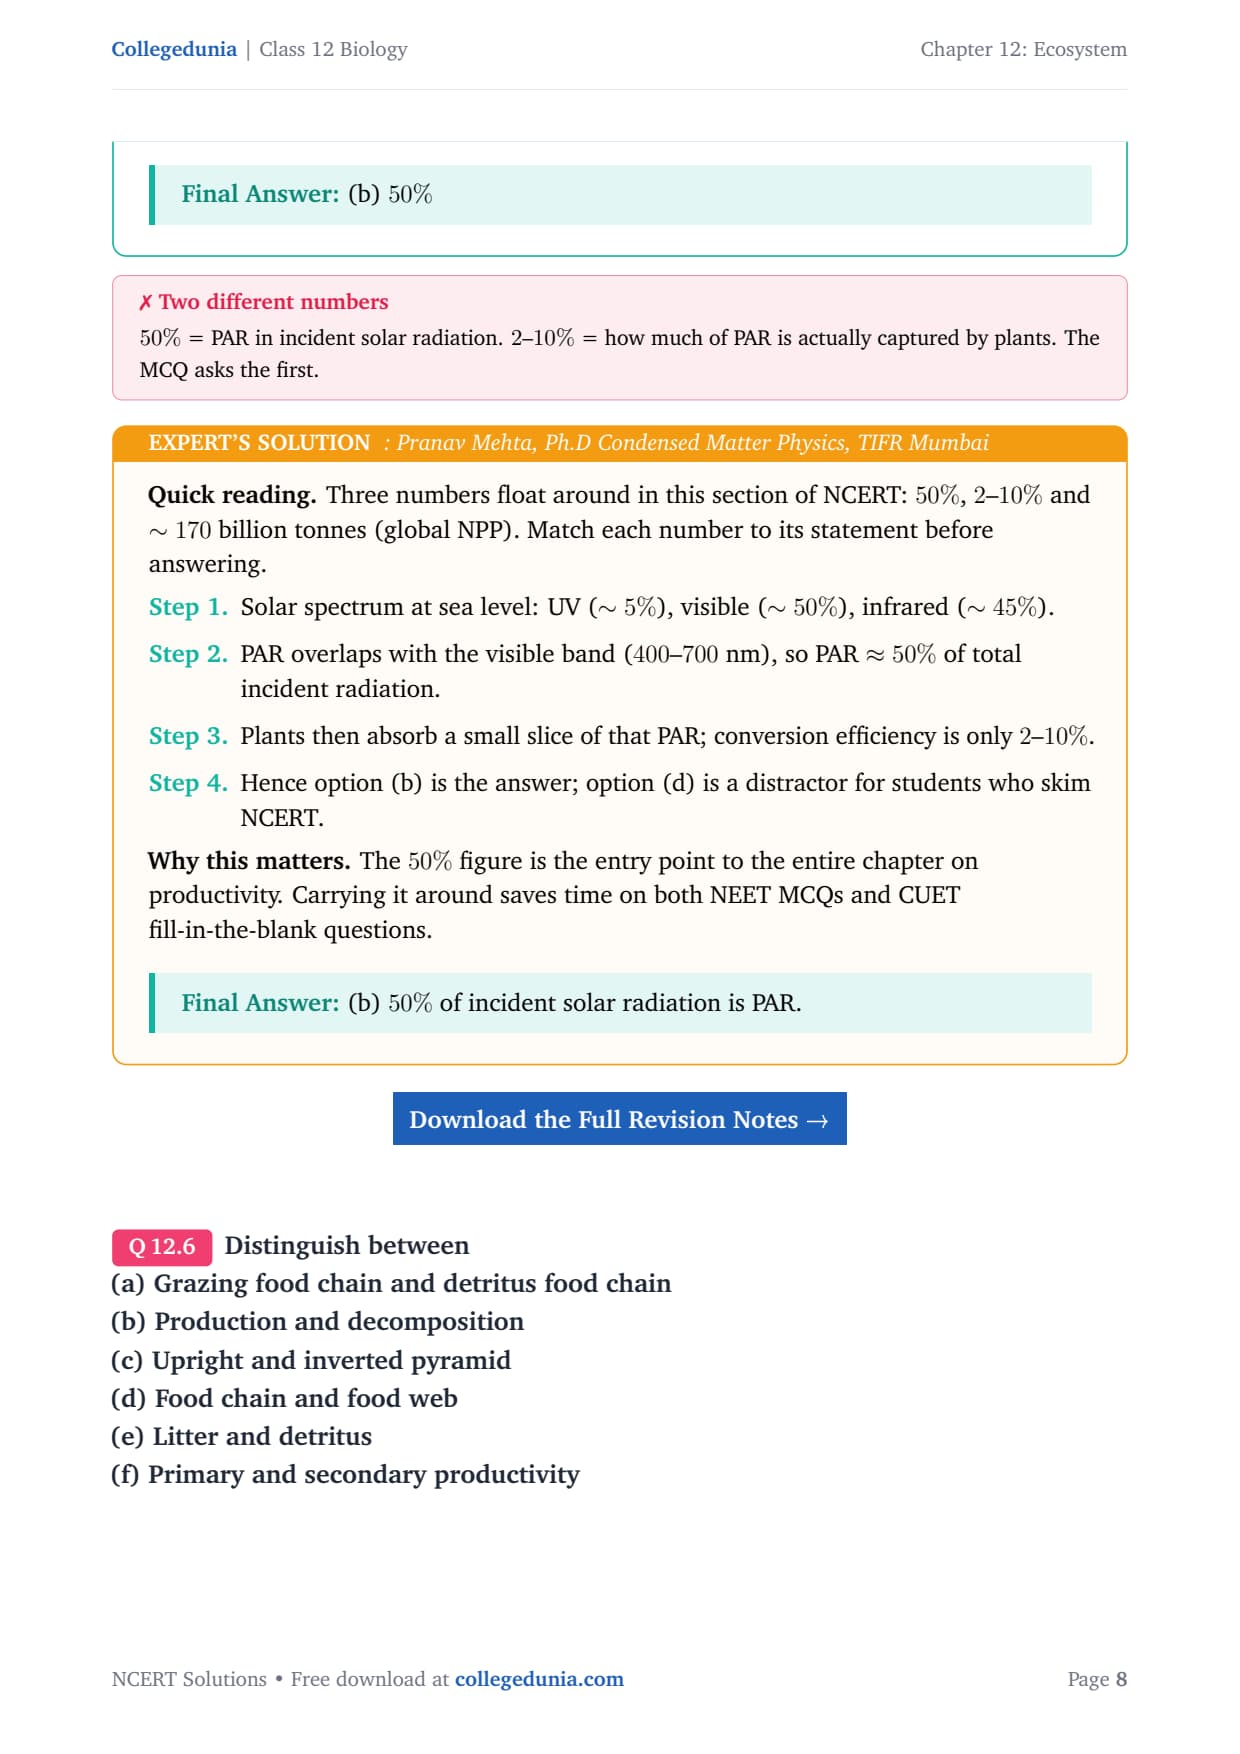
(b) 50%
PM
Pranav Mehta
Ph.D Condensed Matter Physics, TIFR Mumbai
Verified Expert
Quick reading. Three numbers float around in this section of
NCERT: 50%, 2–10% and ∼ 170 billion tonnes (global NPP).
Match each number to its statement before answering.
Solar spectrum at sea level: UV (∼ 5%), visible
(∼ 50%), infrared (∼ 45%).
PAR overlaps with the visible band (400–700 nm), so
PAR ≈ 50% of total incident radiation.
Plants then absorb a small slice of that PAR; conversion
efficiency is only 2–10%.
Hence option (b) is the answer; option (d) is a distractor
for students who skim NCERT.
Why this matters. The 50% figure is the entry point to
the entire chapter on productivity. Carrying it around saves time on
both NEET MCQs and CUET fill-in-the-blank questions.
(b) 50% of incident solar radiation is PAR.
Q 12.6
Distinguish between
(a) Grazing food chain and detritus food chain
(b) Production and decomposition
(c) Upright and inverted pyramid
(d) Food chain and food web
(e) Litter and detritus
(f) Primary and secondary productivity
Concept used. Each pair below names two related but distinct
ecological concepts. We list them side-by-side in compact tables. A
food chain traces energy flow from one trophic level to the
next; productivity measures the rate of biomass build-up;
decomposition returns nutrients from dead matter to the
abiotic pool; and ecological pyramids visualise number, biomass or
energy across trophic levels.
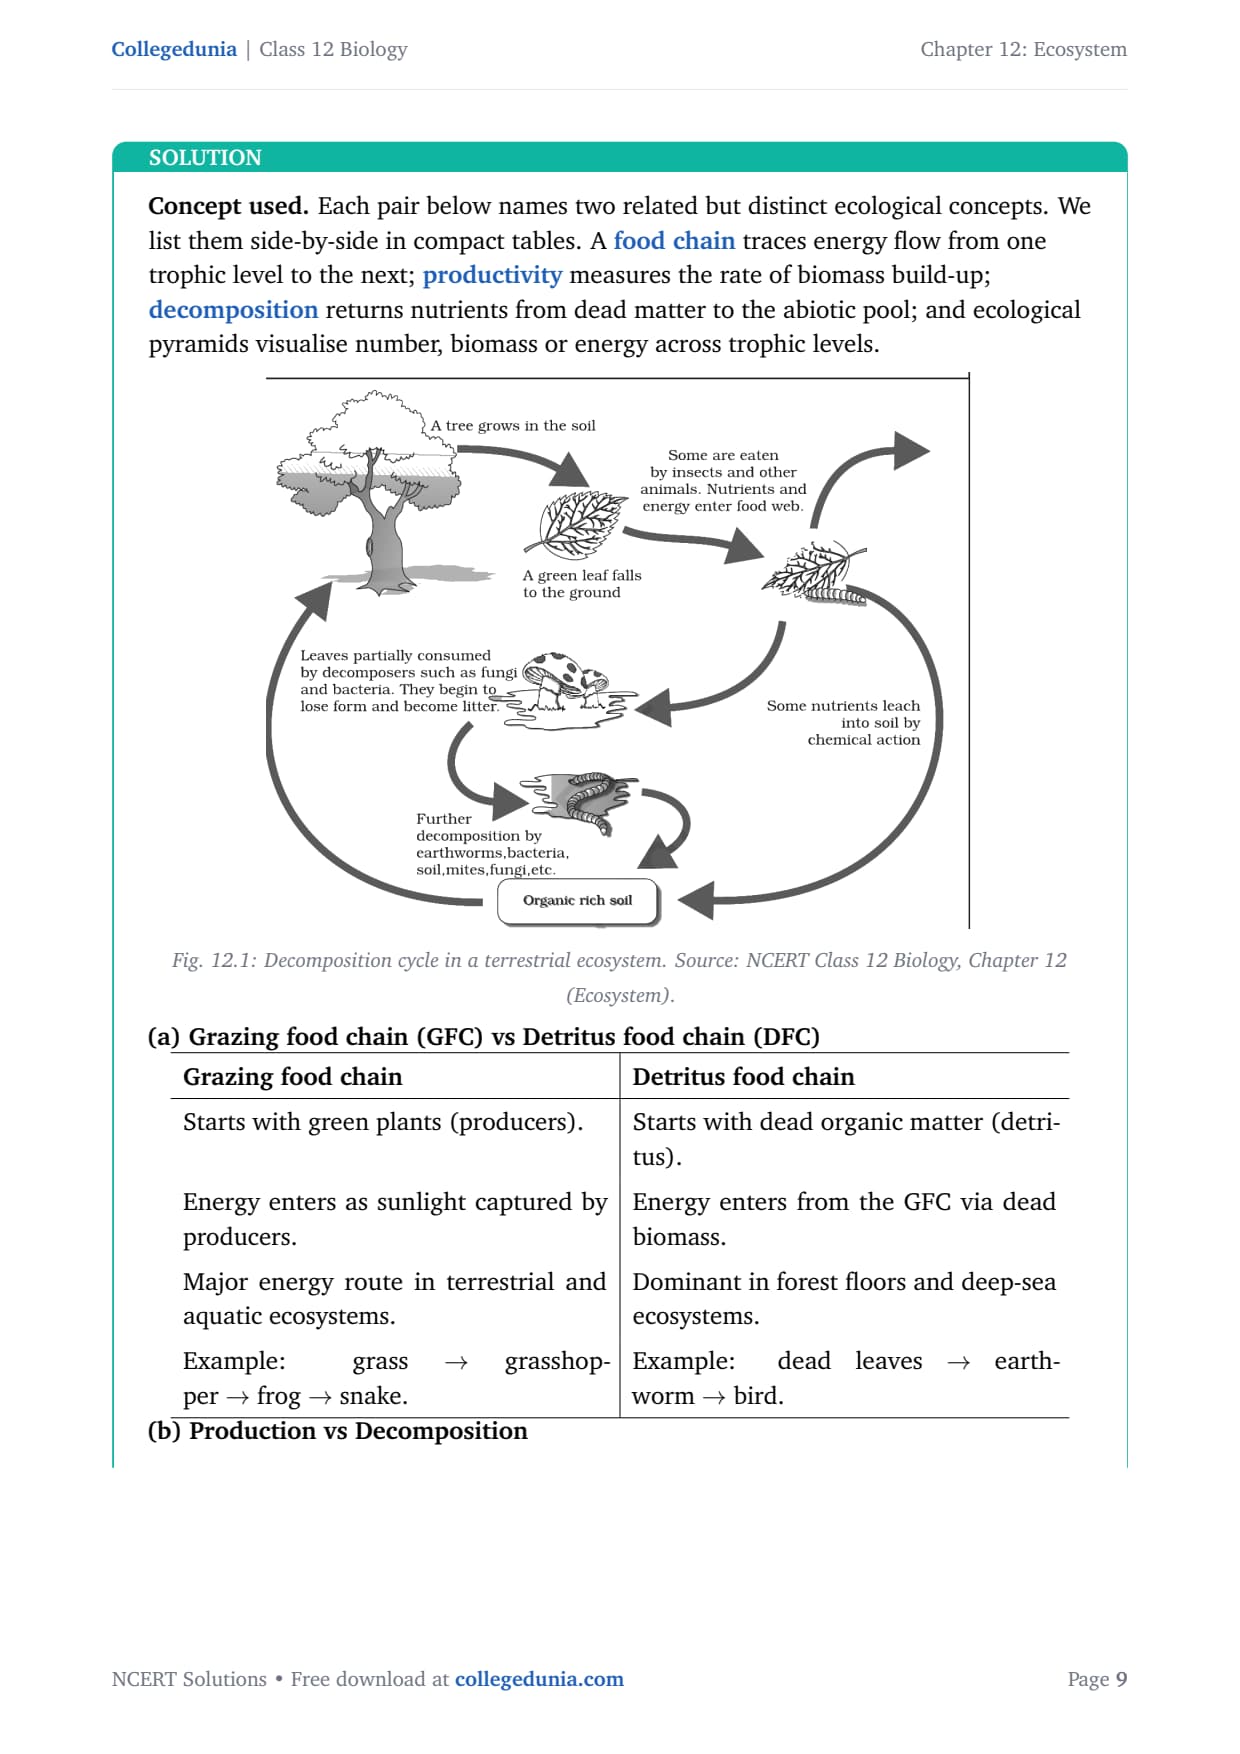
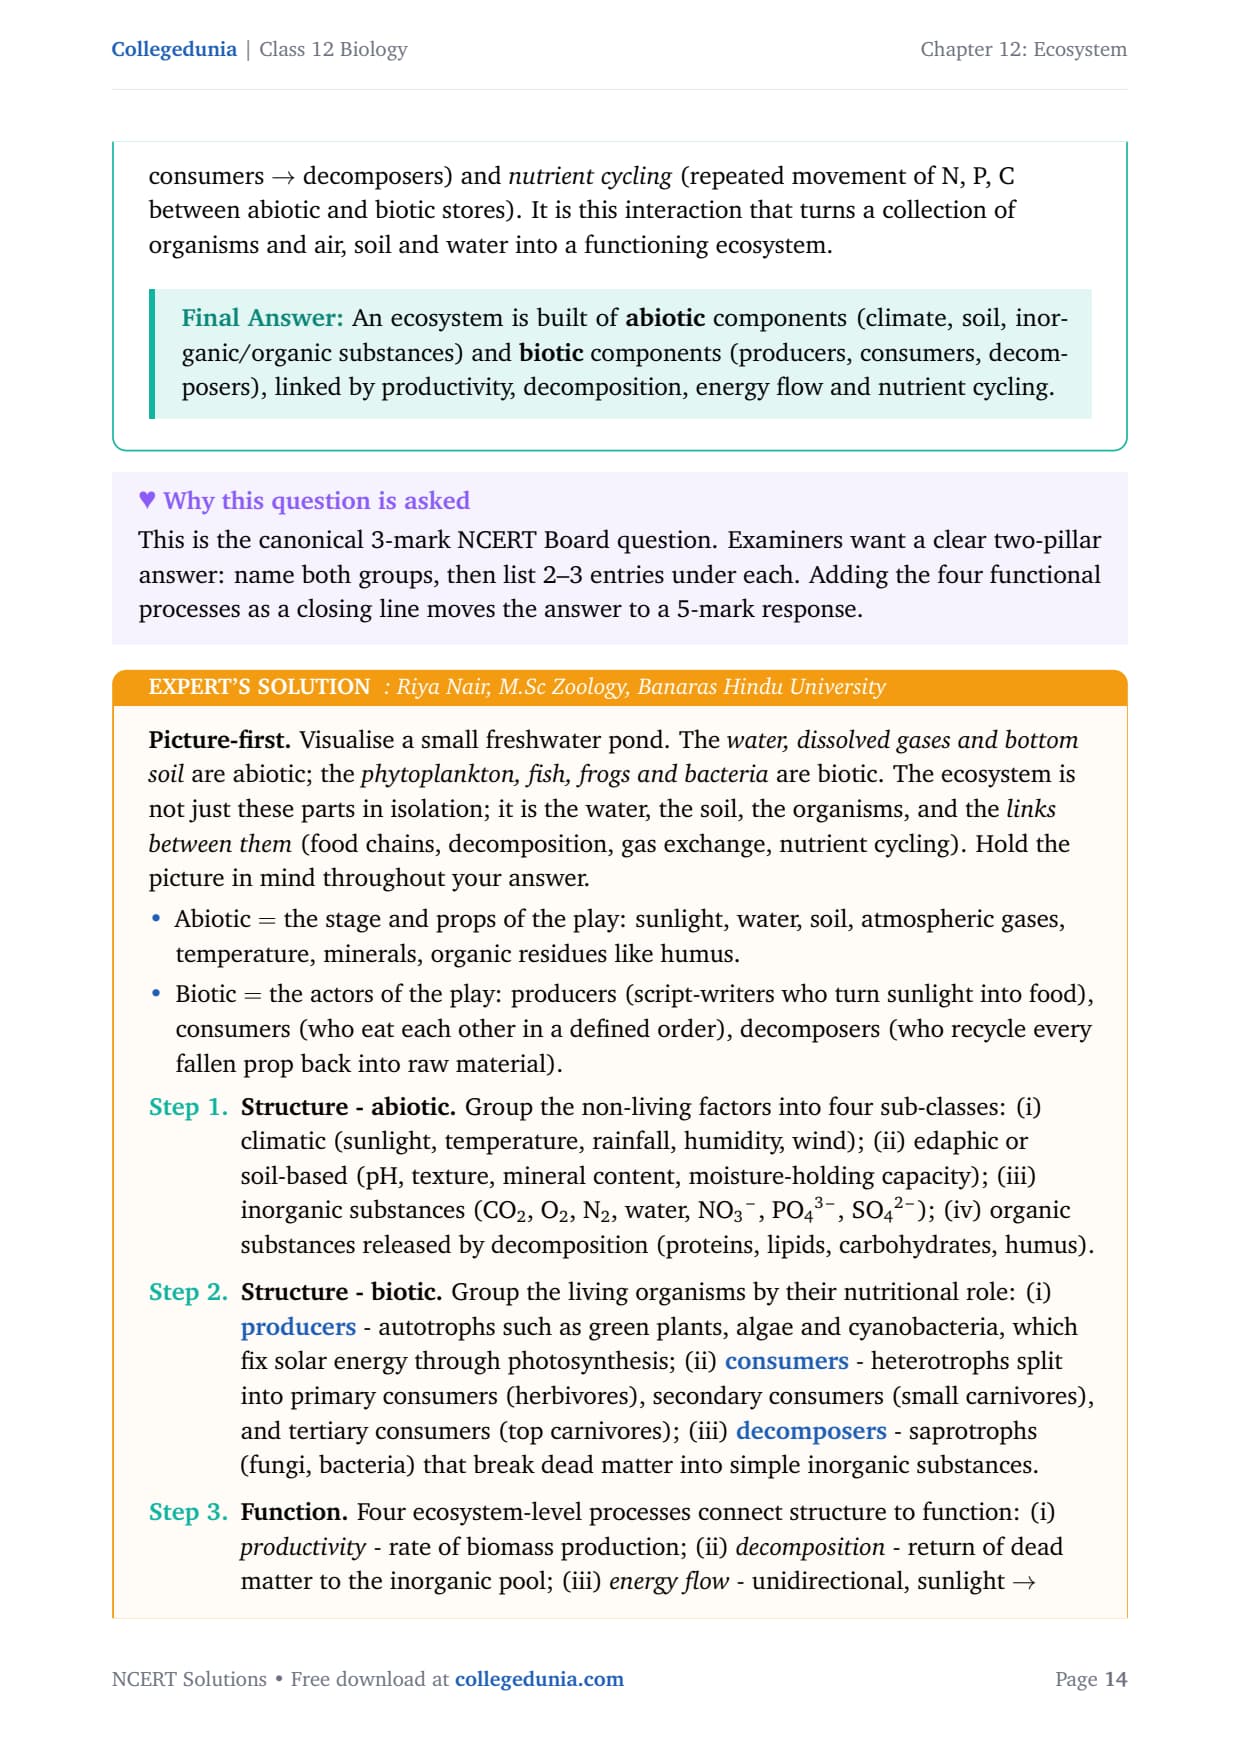
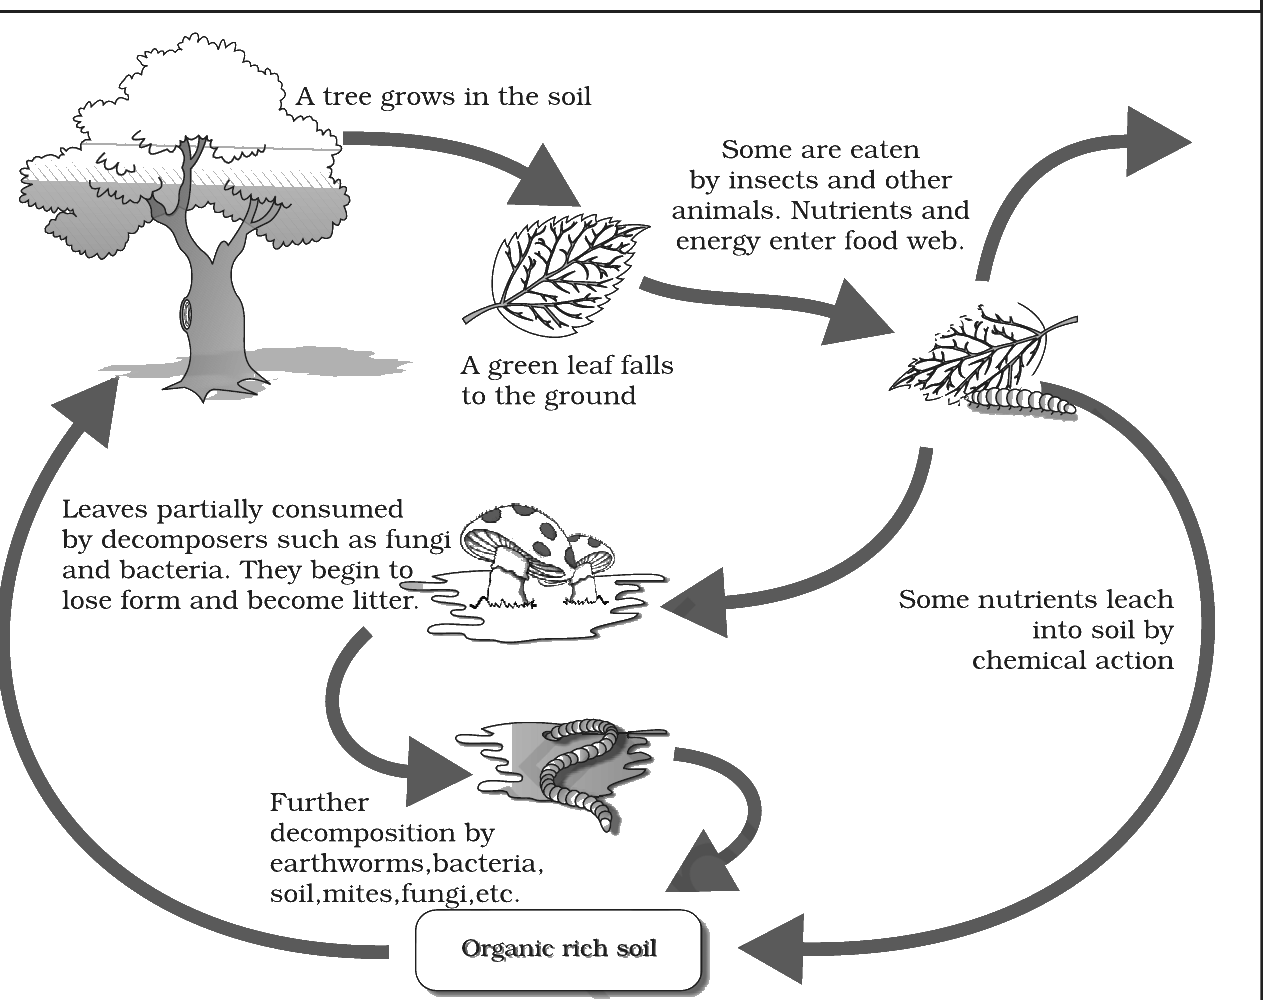
Fig. 12.1: Decomposition cycle in a terrestrial ecosystem. Source: NCERT Class 12 Biology, Chapter 12 (Ecosystem).
(a) Grazing food chain (GFC) vs Detritus food chain (DFC)
1.3
tabularp0.45|p0.45
Grazing food chain & Detritus food chain
Starts with green plants (producers). & Starts with dead organic matter (detritus).
Energy enters as sunlight captured by producers. & Energy enters from the GFC via dead biomass.
Major energy route in terrestrial and aquatic ecosystems. & Dominant in forest floors and deep-sea ecosystems.
Example: grass → grasshopper → frog → snake. & Example: dead leaves → earthworm → bird.
tabular
(b) Production vs Decomposition
1.3
tabularp0.45|p0.45
Production & Decomposition
Building of organic matter from inorganic substances. & Breakdown of organic matter into inorganic substances.
Carried out by producers (autotrophs). & Carried out by decomposers (fungi, bacteria).
Requires solar energy (anabolic). & Releases energy as heat (catabolic).
Increases O2, decreases CO2 in the atmosphere. & Increases CO2, returns nutrients to soil.
tabular
(c) Upright vs Inverted pyramid
1.3
tabularp0.45|p0.45
Upright pyramid & Inverted pyramid
Broad base (producers), narrow apex. & Narrow base, broad upper levels.
Number/biomass/energy decreases with trophic level. & Number or biomass increases with trophic level.
Typical of grasslands and ponds. & Pyramid of biomass in oceans (phytoplankton → zooplankton → fish).
Pyramid of energy is always upright. & Pyramid of energy is never inverted.
tabular
(d) Food chain vs Food web
1.3
tabularp0.45|p0.45
Food chain & Food web
Linear, single-direction energy flow. & Network of many interlinked food chains.
Each organism eats only one type of food. & Each organism may have many food sources.
Less stable; loss of one link breaks the chain. & More stable; alternate routes if one link fails.
Example: grass → rabbit → fox. & Example: grassland web with many herbivores, carnivores, omnivores.
tabular
(e) Litter vs Detritus
1.3
tabularp0.45|p0.45
Litter & Detritus
Fallen leaves, twigs and bark accumulating on the forest floor. & All dead plant and animal matter, including faeces and remains.
Usually surface layer, less broken down. & Includes litter plus dead bodies and excreta from any source.
Mostly plant-derived. & Plant + animal origin.
Foundation for the detritus food chain via fragmentation. & Acts as raw material for decomposers.
tabular
(f) Primary vs Secondary productivity
1.3
tabularp0.45|p0.45
Primary productivity & Secondary productivity
Rate of biomass production by producers (autotrophs). & Rate of assimilation of food energy by consumers (heterotrophs).
Two forms: GPP (gross) and NPP (net). & Single estimate, no GPP–NPP split in NCERT.
Depends on plant species, sunlight, water, nutrients. & Depends on food availability, digestion efficiency, herbivore/carnivore type.
Units: g m-2 yr-1 or kcal m-2 yr-1. & Same units.
tabular
Each pair compared with respect to source, direction, examples and ecological role above.
SK
Sneha Kapoor
M.Sc Botany, Delhi University
Verified Expert
Structural observation. The six pairs form three clusters:
flow concepts (a, d), rate concepts (b, f), and shape/material
concepts (c, e). Reading them as clusters explains why the chapter
chose these six and locks every pair into long-term memory.
Flow cluster (a, d). GFC vs DFC contrast the
starting point of energy: living producers vs dead
organic matter. Food chain vs food web contrast topology
of energy flow: linear single-route vs branching multi-route.
Both pairs ultimately ask the same meta-question: ``through
how many channels can the same packet of energy travel?''
Rate cluster (b, f). Production vs decomposition
contrast direction of carbon transformation: small
→ large (anabolism) vs large → small (catabolism).
Primary vs secondary productivity contrast who is
building: producers (autotrophs, sunlight-driven) vs
consumers (heterotrophs, food-driven). Both pairs share the
same units (g m-2 yr-1 or kcal m-2 yr-1)
because rate concepts are always per unit area per unit time.
Material cluster (c, e). Upright vs inverted pyramid
contrast pyramid shape, which in turn reflects either
body-size of the producer (numbers pyramid) or turnover-rate
of the producer (biomass pyramid). Litter vs detritus
contrast composition: litter is the leafy surface
layer, detritus is the wider pool of dead matter from any
source.
Cross-chapter anchors. The only pyramid that can
never be inverted is the energy pyramid (second law of
thermodynamics). The only ``producer'' in NCERT is the
autotroph. The only ecosystem with an inverted biomass
pyramid named in NCERT is the open ocean (phytoplankton).
Common trap. Examiners often word the question as
``Differentiate between any three pairs''. Pick the
easiest three first (typically a, c, d) and save the harder
rate-concept pairs (b, f) for the end of your writing time,
when you can give them more thought.
Worked memory hook for the flow cluster (a, d).
Picture two diagrams: GFC starts with a sun and a
green plant; DFC starts with a pile of dead
leaves. Picture food chain as a straight thread
connecting four beads (producer, herbivore, carnivore, top
carnivore); picture food web as a net where every
bead has many threads going in and out. These two pictures
encode all four answers in the flow cluster.
Worked memory hook for the rate cluster (b, f).
Think of production as a factory building chairs from
wood (sunlight + CO2 → glucose), and decomposition
as a recycling plant taking apart chairs back into
wood and screws (glucose → CO2 + minerals). For
the second pair, primary productivity is the wood-cutter's
job (producer); secondary productivity is the carpenter's job
(consumer assimilating already-cut wood).
Worked memory hook for the material cluster (c, e).
Pyramid shapes encode body-size (numbers pyramid) and
turnover rate (biomass pyramid). Litter is the leafy
carpet of the forest floor; detritus is the leafy carpet
plus everything else that has died. Litter ⊂
detritus.
Why this matters. Tabulating ``source, mechanism, example''
for each pair lets a student earn full marks even in a high-stakes
3-mark slot, and the cluster framing makes long-term recall painless.
All six pairs distinguished by definition, mechanism and example, organised into flow (a, d), rate (b, f) and material (c, e) clusters.
Q 12.7
Describe the components of an ecosystem.
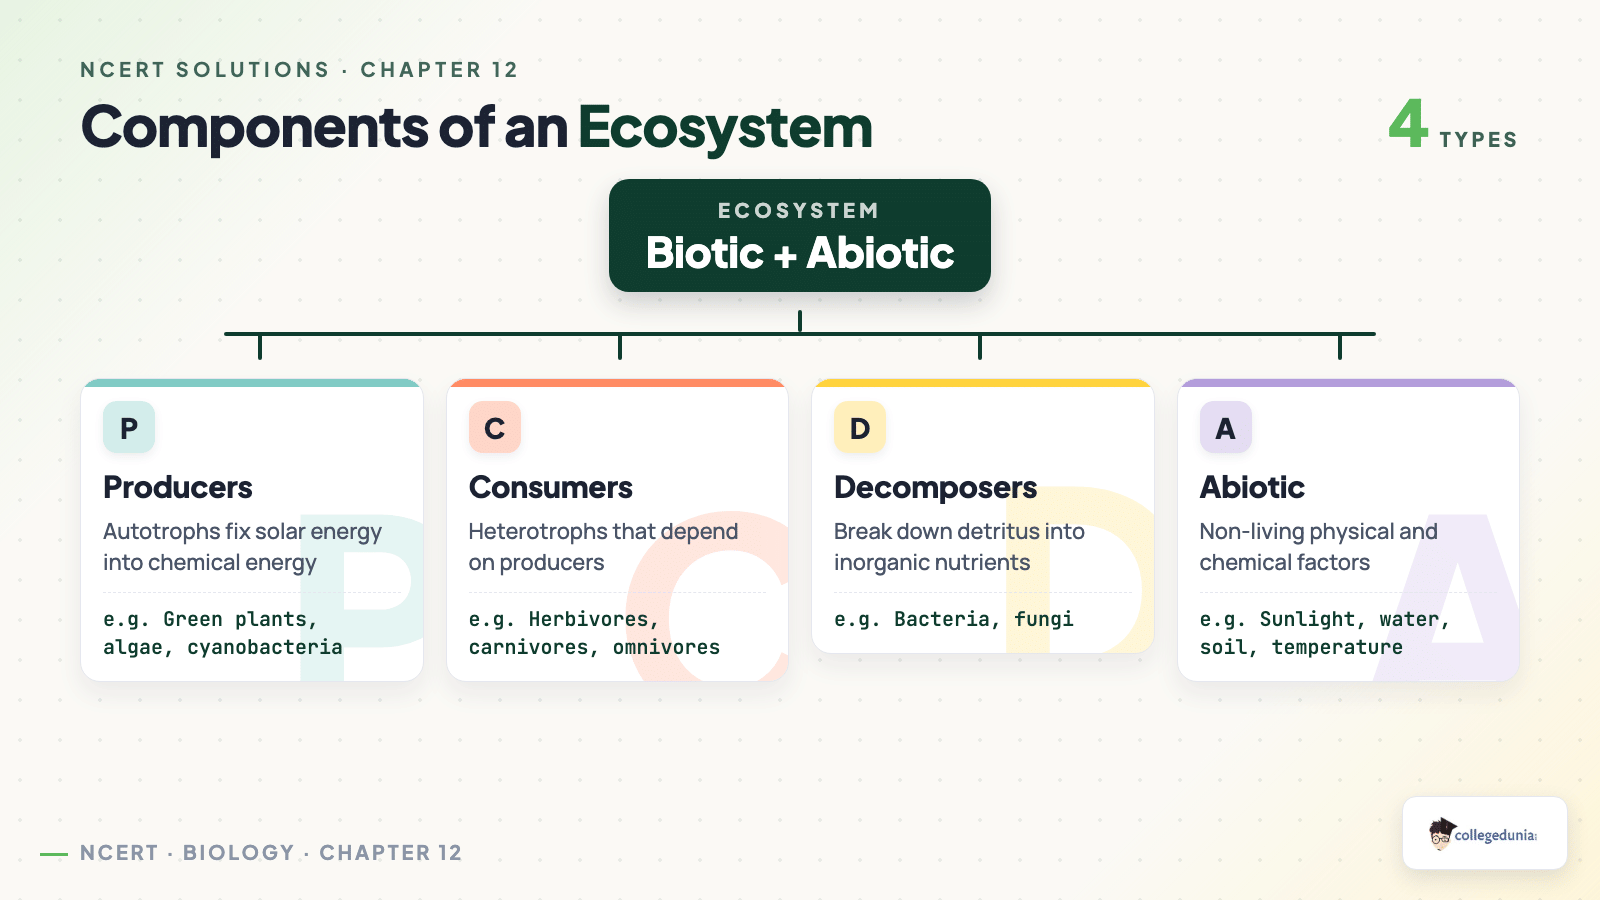
Concept used. An ecosystem (e.g. forest, pond,
desert, grassland) is the structural and functional unit of nature
where physical surroundings and living organisms interact through
energy flow and nutrient cycling. Its components are classified into
two broad groups: abiotic (non-living) and biotic
(living).
1. Abiotic components. These are the non-living physical and
chemical factors that shape the ecosystem:
Organic substances: proteins, lipids, carbohydrates,
humus released by decomposition.
2. Biotic components. These are all the living organisms in
the ecosystem, grouped by their nutritional role:
Producers (autotrophs): green plants, algae,
cyanobacteria. They fix solar energy by photosynthesis and
synthesise organic compounds from CO2 and water.
Consumers (heterotrophs): animals that feed on
producers or other consumers. Subdivided into primary
consumers (herbivores), secondary consumers (small carnivores)
and tertiary consumers (top carnivores).
Decomposers (saprotrophs): fungi and bacteria that
break down dead organic matter into simple inorganic
substances, returning nutrients to the abiotic pool.
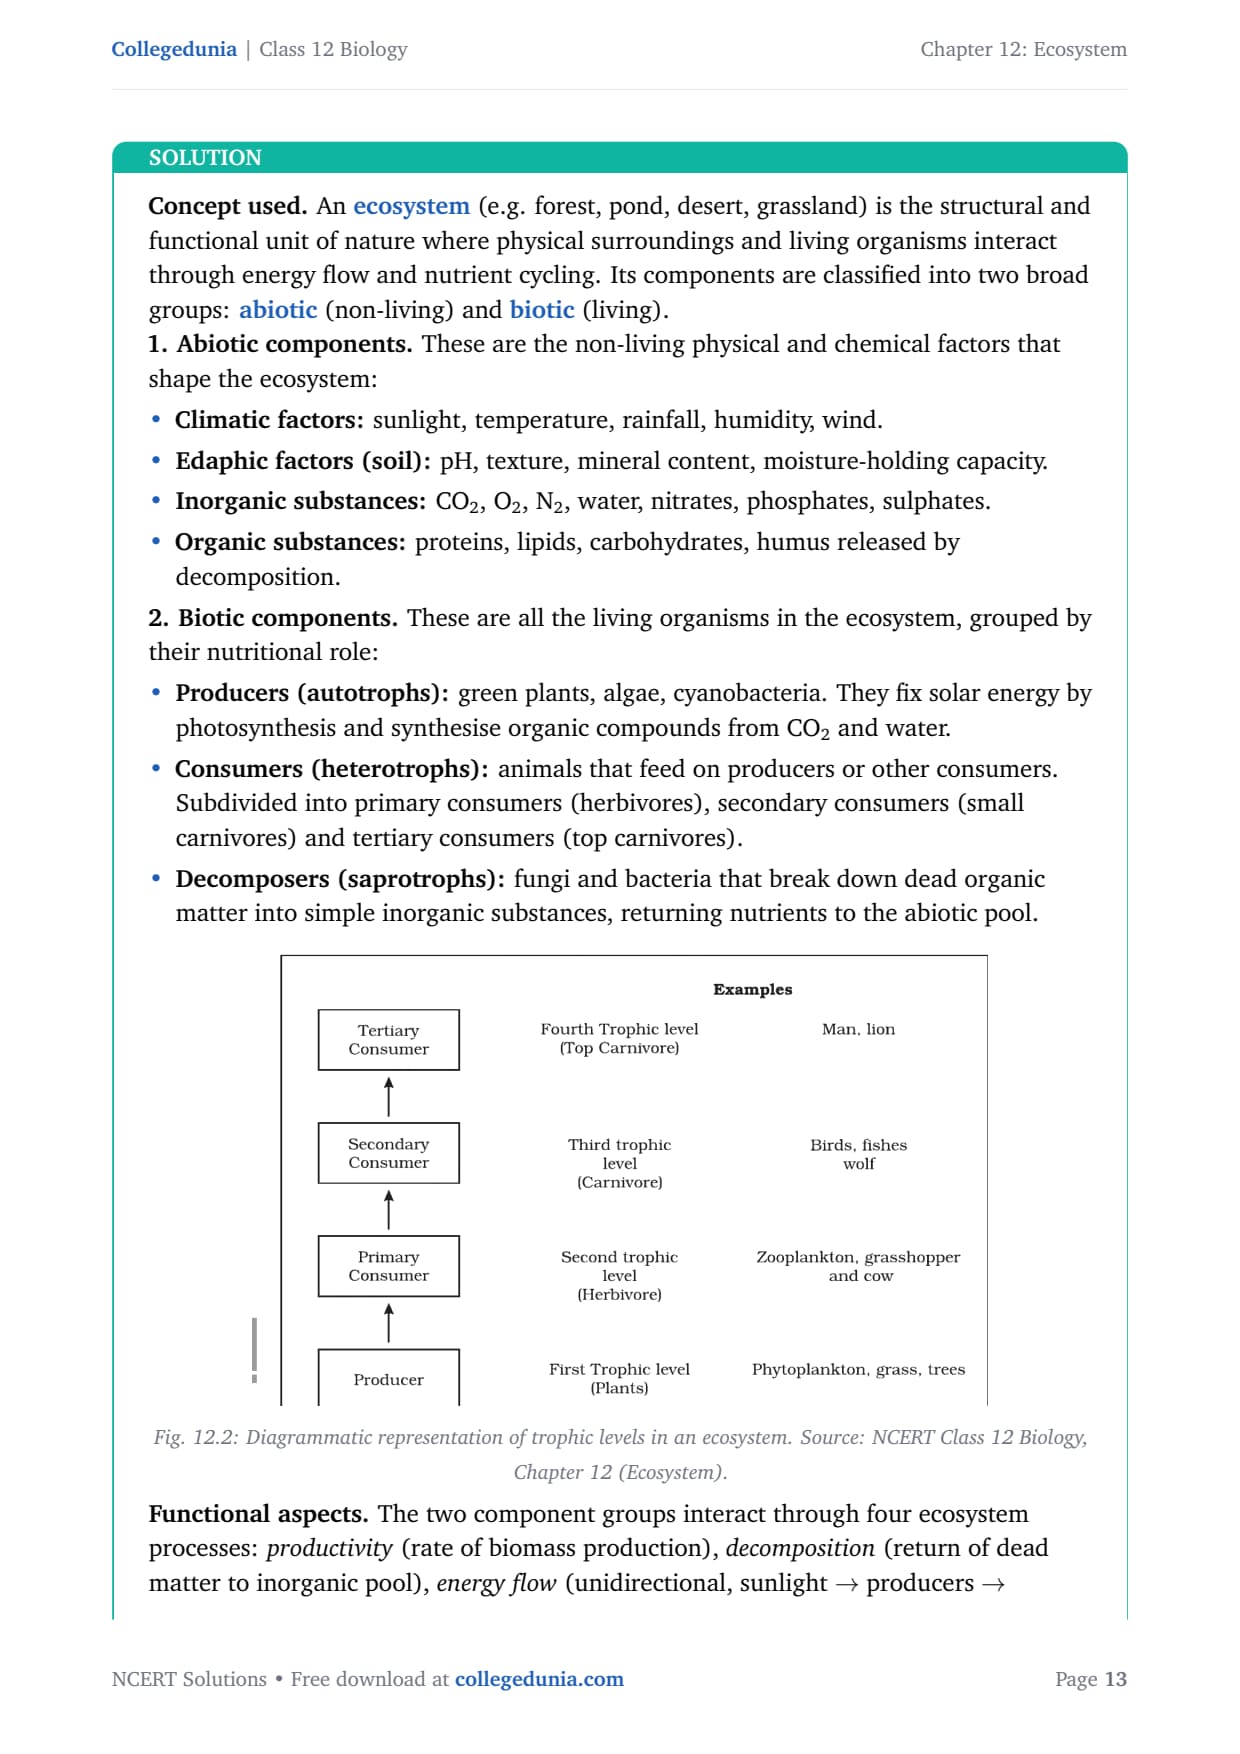
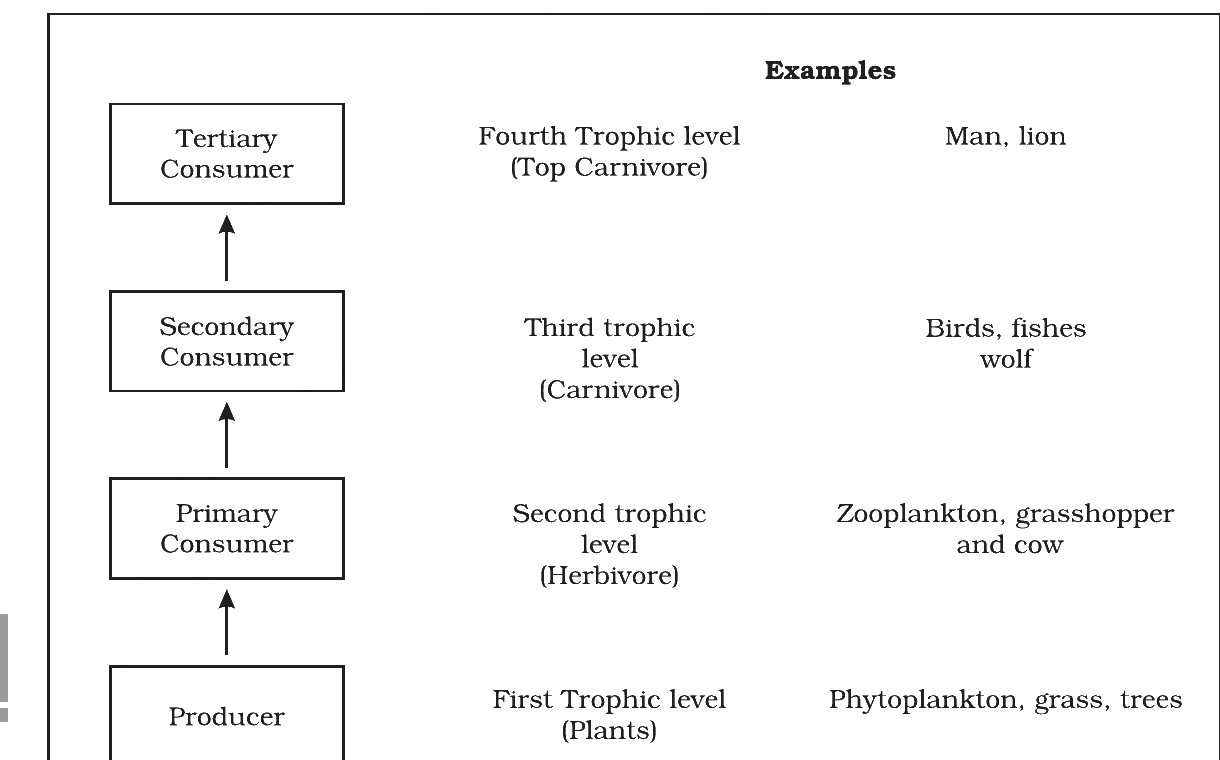
Fig. 12.2: Diagrammatic representation of trophic levels in an ecosystem. Source: NCERT Class 12 Biology, Chapter 12 (Ecosystem).
Functional aspects. The two component groups interact
through four ecosystem processes: productivity (rate of biomass
production), decomposition (return of dead matter to inorganic
pool), energy flow (unidirectional, sunlight → producers
→ consumers → decomposers) and nutrient cycling
(repeated movement of N, P, C between abiotic and biotic stores). It
is this interaction that turns a collection of organisms and air, soil
and water into a functioning ecosystem.
An ecosystem is built of abiotic components (climate, soil, inorganic/organic substances) and biotic components (producers, consumers, decomposers), linked by productivity, decomposition, energy flow and nutrient cycling.
RN
Riya Nair
M.Sc Zoology, Banaras Hindu University
Verified Expert
Picture-first. Visualise a small freshwater pond. The
water, dissolved gases and bottom soil are abiotic; the
phytoplankton, fish, frogs and bacteria are biotic. The
ecosystem is not just these parts in isolation; it is the water, the
soil, the organisms, and the links between them (food chains,
decomposition, gas exchange, nutrient cycling). Hold the picture in
mind throughout your answer.
Abiotic = the stage and props of the play: sunlight, water,
soil, atmospheric gases, temperature, minerals, organic
residues like humus.
Biotic = the actors of the play: producers (script-writers
who turn sunlight into food), consumers (who eat each other
in a defined order), decomposers (who recycle every fallen
prop back into raw material).
Structure - abiotic. Group the non-living factors
into four sub-classes: (i) climatic (sunlight, temperature,
rainfall, humidity, wind); (ii) edaphic or soil-based (pH,
texture, mineral content, moisture-holding capacity); (iii)
inorganic substances (CO2, O2, N2, water,
NO3-, PO4^3-, SO4^2-); (iv) organic
substances released by decomposition (proteins, lipids,
carbohydrates, humus).
Structure - biotic. Group the living organisms by
their nutritional role: (i) producers - autotrophs
such as green plants, algae and cyanobacteria, which fix
solar energy through photosynthesis; (ii) consumers
- heterotrophs split into primary consumers (herbivores),
secondary consumers (small carnivores), and tertiary
consumers (top carnivores); (iii) decomposers -
saprotrophs (fungi, bacteria) that break dead matter into
simple inorganic substances.
Function. Four ecosystem-level processes connect
structure to function: (i) productivity - rate of
biomass production; (ii) decomposition - return of
dead matter to the inorganic pool; (iii) energy flow -
unidirectional, sunlight → producers → consumers
→ decomposers; (iv) nutrient cycling - repeated
movement of N, P, C between abiotic and biotic stores.
Example - pond ecosystem. Abiotic: pond water,
sunlight reaching the surface, dissolved O2 and CO2,
muddy bottom soil. Biotic: phytoplankton (producers),
zooplankton and small fish (primary consumers), large fish
(secondary consumers), bacteria and fungi (decomposers). The
ecosystem is the pond as a whole, including the gas
exchange at the surface and the nutrient release by mud
bacteria.
Synthesis. An ecosystem is not just a sum of parts;
it is the network of interactions among parts. Remove
the producers and consumers starve; remove the decomposers
and nutrients lock up in dead matter; remove the abiotic
substrate and no life is possible. Each component is
necessary.
Why this matters. The same two-pillar (abiotic + biotic)
schema reappears in Chapter 11 (Organisms and Populations) and
Chapter 13 (Biodiversity and Conservation). Mastering it once pays
off across the entire ``Ecology'' unit, and gives the full structure
that examiners expect for any 5-mark essay on ecosystem composition.
An ecosystem = abiotic components (climatic, edaphic, inorganic, organic) + biotic components (producers, consumers, decomposers), connected by productivity, decomposition, energy flow and nutrient cycling.
Q 12.8
Define ecological pyramids and describe with examples, pyramids of number and biomass.
Concept used. An ecological pyramid is a graphical
representation of the relationship between organisms at different
trophic levels of a food chain in terms of their number,
biomass or energy. The base of every pyramid represents
the producers (first trophic level); successive tiers represent
primary consumers, secondary consumers and so on. The three types of
pyramids are pyramid of numbers, pyramid of biomass and
pyramid of energy.
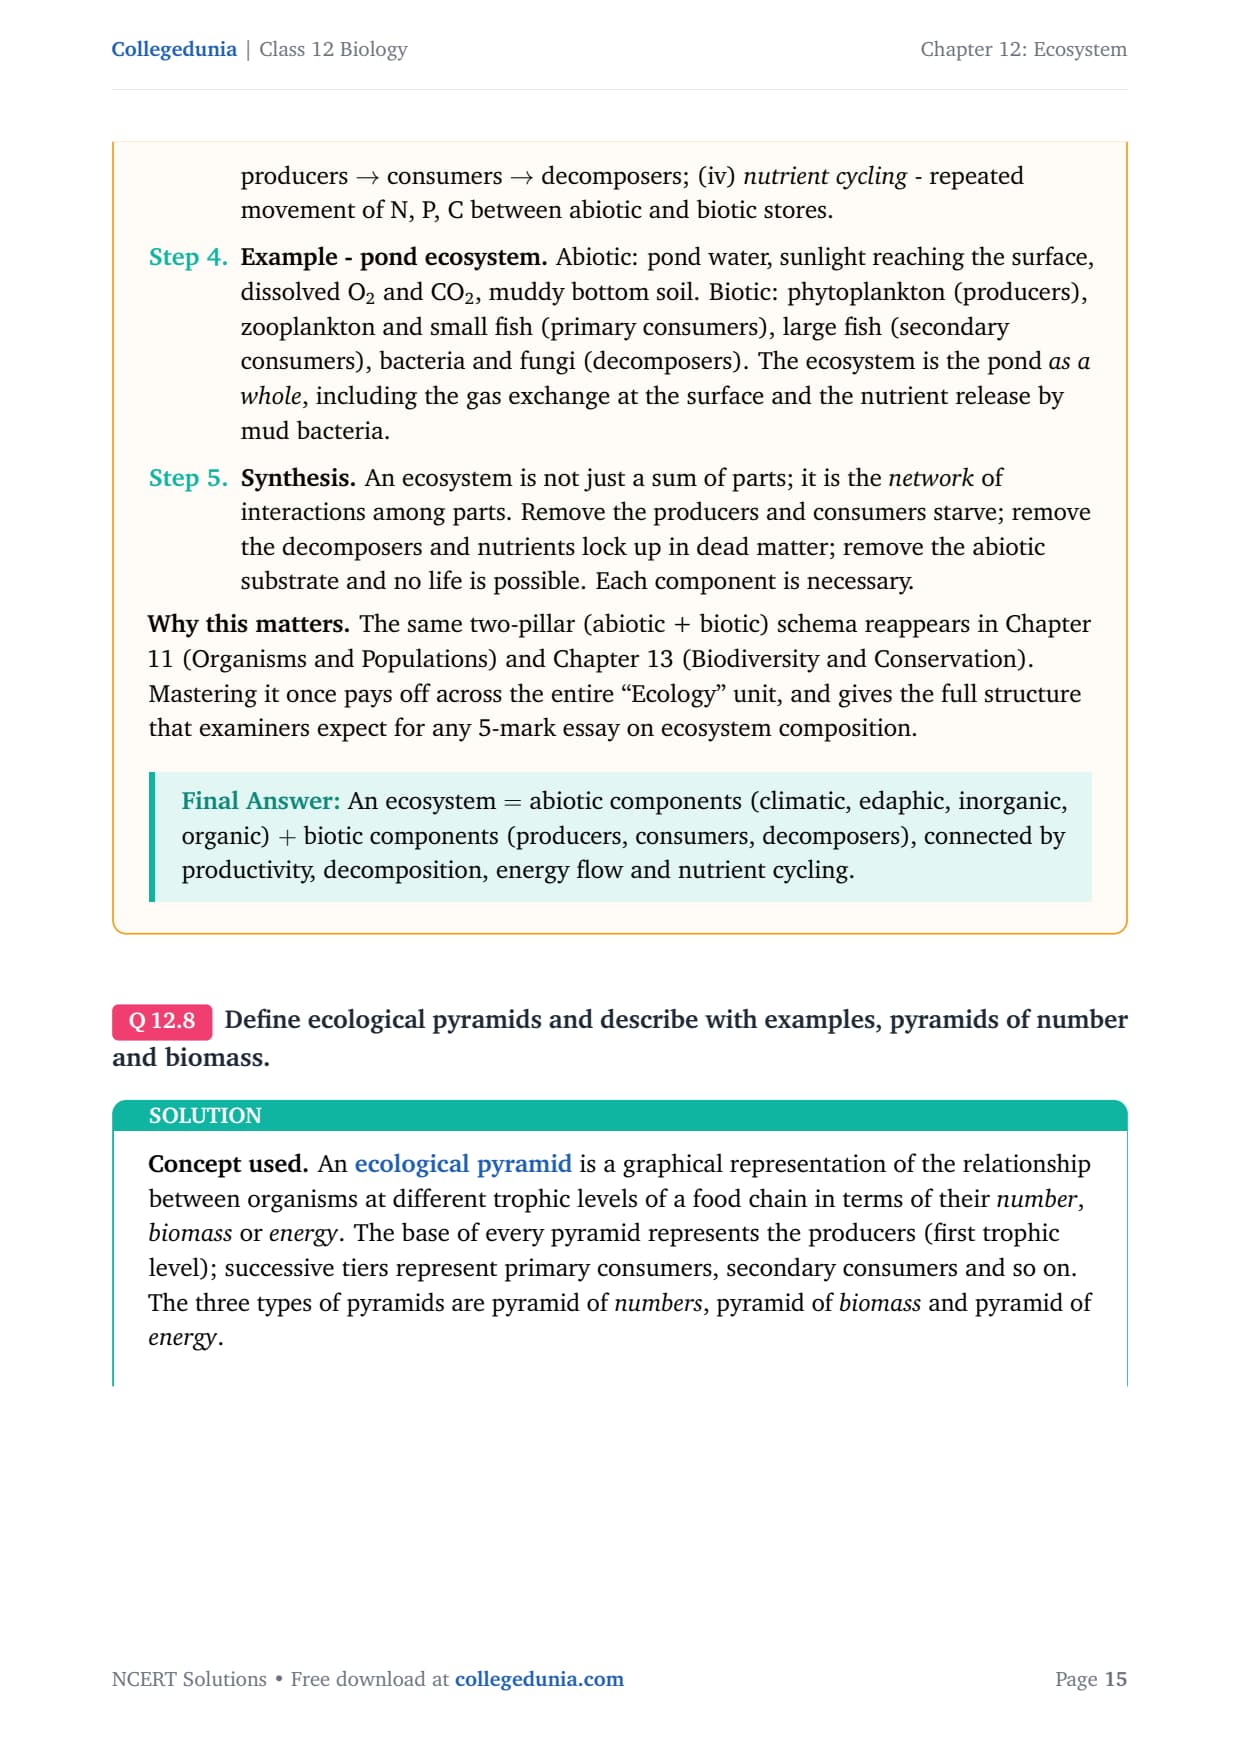
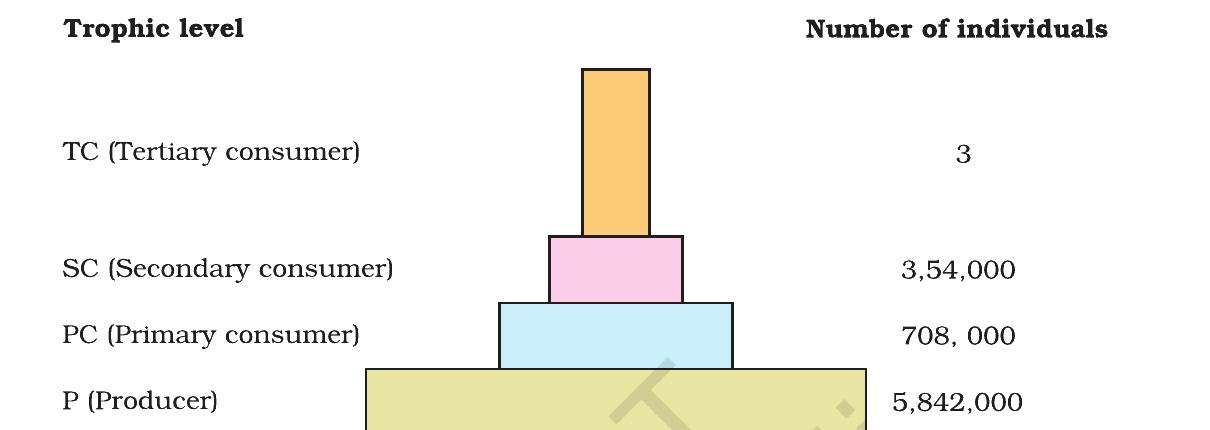
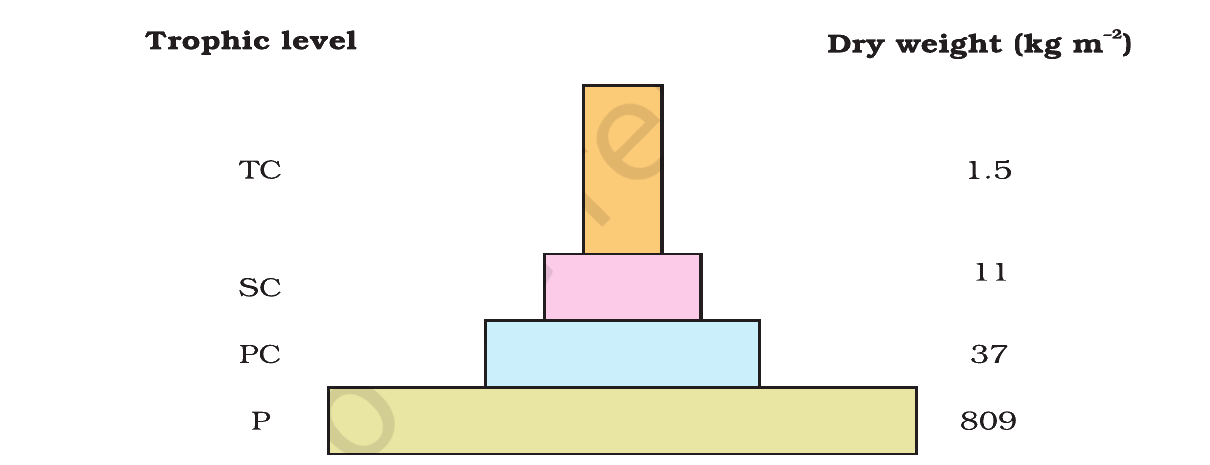
Fig. 12.4(a): Pyramid of numbers in a grassland ecosystem; only three top-carnivores are supported by ∼ 6 million producer plants. Source: NCERT Class 12 Biology, Chapter 12 (Ecosystem).
Pyramid of numbers. It plots the number of individuals
at each trophic level.
Grassland (upright). A grassland holds millions of
grass plants, supporting thousands of grasshoppers, then
hundreds of frogs, then a few snakes and only three top
eagles. The pyramid is broad at the base and narrow at the
apex.
Tree-dominated (inverted/spindle). A single big tree
supports thousands of leaf-eating insects, which support
hundreds of insectivorous birds. Producer count is small but
herbivore count is huge; the pyramid is inverted at the lower
level.
Parasitic chain (inverted). One large tree → many
birds → many more lice/parasites on each bird. Numbers
increase up the chain.
In all forms, the pyramid counts heads, not size.
Pyramid of biomass. It plots the dry weight per unit
area (biomass) at each trophic level.
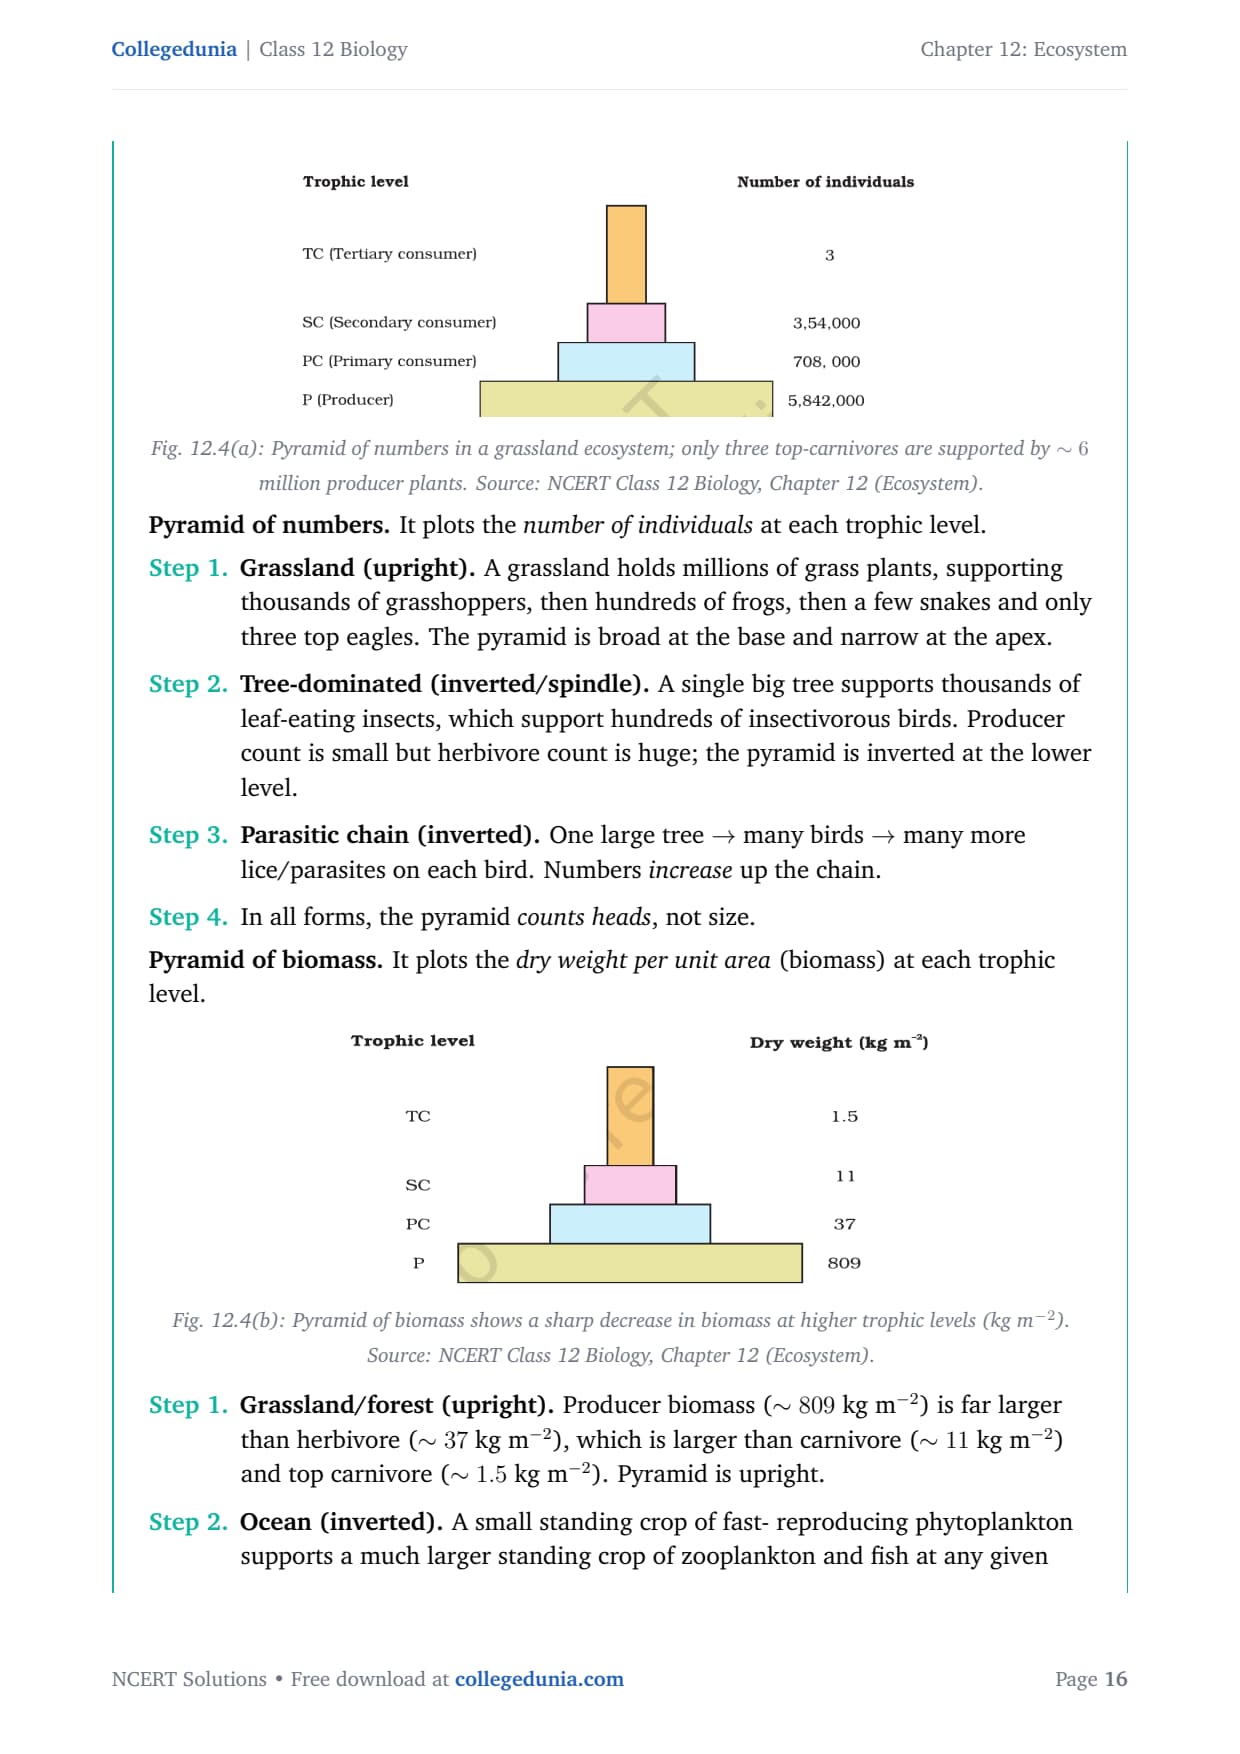
Fig. 12.4(b): Pyramid of biomass shows a sharp decrease in biomass at higher trophic levels (kg m-2). Source: NCERT Class 12 Biology, Chapter 12 (Ecosystem).
Grassland/forest (upright). Producer biomass
(∼ 809 kg m-2) is far larger than herbivore
(∼ 37 kg m-2), which is larger than carnivore
(∼ 11 kg m-2) and top carnivore (∼ 1.5
kg m-2). Pyramid is upright.
Ocean (inverted). A small standing crop of fast-
reproducing phytoplankton supports a much larger standing crop
of zooplankton and fish at any given moment. Pyramid is
inverted, because phytoplankton turn over so quickly that
their instantaneous biomass is tiny.
Biomass is a snapshot; high turnover producers can look
light on the snapshot while feeding a heavier consumer mass.
Limitations. Both pyramids ignore the same species occupying
two trophic levels (e.g. a sparrow eating seeds and worms) and exclude
saprophytes (decomposers).
Ecological pyramids show numbers, biomass or energy across trophic levels; pyramids of numbers and biomass may be upright (grassland) or inverted (tree-dominated for numbers, ocean for biomass).
AP
Ananya Pillai
M.Sc Microbiology, JNU
Verified Expert
Strategic angle. Three pyramids, two of which can flip. Hold
two anchors in mind: ``grassland is upright for all three pyramids'',
and ``ocean flips the biomass pyramid because phytoplankton turn over
in days while zooplankton and fish live for weeks or years''. From
those two facts every exception in the chapter can be reconstructed.
Pyramid of numbers: counts individuals; shape depends on
producer body-size.
Pyramid of biomass: weighs standing crop in g or kg per unit
area; shape depends on turnover rate of producers.
Pyramid of energy: rate of energy transfer per unit time per
unit area; always upright, no exception (second law of
thermodynamics).
Define a pyramid. A graphical representation of the
trophic relationship between organisms in terms of number,
biomass or energy. Base = producers; apex = top
carnivore.
Pyramid of numbers (upright case). In a grassland,
millions of grass plants feed thousands of grasshoppers, which
feed hundreds of frogs, which feed dozens of snakes, which
feed only a few hawks. Producer count is the largest, top
carnivore count is the smallest. Pyramid widens at the base
and narrows at the apex.
Pyramid of numbers (inverted case). On a single big
tree, the producer count is 1, but it supports thousands of
leaf-eating insects, which in turn support a few hundred
birds. Producer count is tiny but herbivore count is huge.
The same shape (spindle/inverted) shows up in parasitic
chains: 1 tree → many birds → many more lice per
bird.
Pyramid of biomass (upright case). In grassland or
forest, dry-weight per unit area falls from producer
(∼ 809 kg m-2) to herbivore (∼ 37) to
carnivore (∼ 11) to top carnivore (∼ 1.5). Standing
crop drops sharply at every transfer.
Pyramid of biomass (inverted case). In open ocean, a
small standing crop of phytoplankton (which divides every few
days) supports a much larger standing crop of zooplankton and
fish at any given instant. Biomass at level 2 is greater than
biomass at level 1: pyramid is inverted. The key word is
standing crop: it is a snapshot, not a sum over time.
Limitations. Pyramids assume each species occupies
one trophic level, but real organisms (e.g. sparrow eating
both seeds and insects) span two. Pyramids also exclude
saprophytes (fungi, bacteria) despite their central role in
nutrient recycling.
Why this matters. The biomass-pyramid inversion in oceans is
the single ``exception'' students forget under exam stress. Citing
the phytoplankton turnover-rate explanation earns the second mark in
a 3-mark Board answer and is the conceptual hinge for the entire Q8
response.
Pyramids of numbers and biomass: defined, drawn for upright (grassland) and inverted (tree chain or ocean) cases, with their two limitations on multi-level species and excluded saprophytes.
Q 12.9
What is primary productivity? Give brief description of factors that affect primary productivity.
Concept used.Primary productivity is defined as
the amount of biomass (or organic matter) produced per unit area, per
unit time, by plants during photosynthesis. It is expressed as weight
(g m-2 yr-1) or energy (kcal m-2 yr-1).
Productivity varies by ecosystem because the amount of fixed solar
energy depends on which plants live there and on the abiotic
conditions of light, water, temperature and nutrients.
Two important terms.
Gross Primary Productivity (GPP). Total rate of
production of organic matter (biomass) by producers, including
what they later use for respiration. It is the gross capture
of solar energy.
Net Primary Productivity (NPP). The biomass left
after producers spend some of their GPP on respiration (R):
NPP = GPP - R.
NPP is the new biomass available to herbivores and
decomposers.
Factors that affect primary productivity.
Plant species (variety). Different species fix
carbon at different rates. C4 plants (sugarcane,
maize) have higher productivity than C3 plants
because of more efficient carbon fixation under high light
and temperature.
Environmental (climatic) factors. Light, temperature,
precipitation, humidity and atmospheric CO2 all directly
change the rate of photosynthesis. Tropical rainforests are
the most productive land ecosystems because all four factors
are favourable year-round.
Nutrient availability. Soil/water content of
nitrogen, phosphorus, potassium and trace elements limits
productivity in many ecosystems. In oceans, nitrogen and iron
are the common limiting nutrients.
Photosynthetic capacity of plants. Determined by
chlorophyll content, leaf area index, root depth and overall
physiology of the producer.
Other ecosystem-specific limits. Light penetration
limits aquatic productivity; water availability limits
terrestrial productivity in deserts; latitude and altitude
modulate both temperature and light.
Annual global figures. The annual net primary productivity
of the whole biosphere is approximately 170 billion tonnes
(dry weight) of organic matter; of this, the oceans contribute only
∼ 55 billion tonnes despite covering 70% of Earth's surface.
Primary productivity = biomass produced per unit area per unit time by plants. It depends on plant species, environmental factors (light, temperature, water, CO2), nutrient availability and the photosynthetic capacity of producers.
IV
Ishaan Verma
M.Sc Biotechnology, AIIMS Delhi
Verified Expert
Quick reading. ``Primary'' tells you it is the producers'
output. ``Productivity'' tells you it is a rate, not a stock.
Combined: producers' biomass output per unit area per unit time. The
question really asks for one tight definition plus a structured
factor list, so plan the answer in three blocks: definition, GPP/NPP,
factors.
GPP: gross organic matter fixed by photosynthesis per unit
area per unit time.
Respiration (R): producers' own metabolic cost of staying
alive.
NPP: GPP - R, the leftover available to herbivores
and decomposers.
Definition. Primary productivity is the rate of
capture of solar energy and its conversion to organic matter
per unit area per unit time by autotrophs (producers). It is
the foundation on which every consumer in the ecosystem
feeds.
Units and forms. Mass form: g m-2 yr-1.
Energy form: kcal m-2 yr-1. GPP includes
respiratory loss; NPP excludes it. The relationship is
NPP = GPP - R.
Factor 1 - plant species (variety). C4 plants
(sugarcane, maize, sorghum) outperform C3 plants (rice,
wheat) at high light and temperature because their PEP-
carboxylase enzyme has a higher affinity for CO2, which
suppresses photorespiration.
Factor 2 - environmental (climatic) factors.
Sunlight intensity, day length, temperature, rainfall, soil
moisture, humidity and atmospheric CO2 all directly
affect the rate of photosynthesis. Tropical rainforests are
the most productive land ecosystems precisely because all
these factors are favourable year-round.
Factor 3 - nutrient availability. Nitrogen,
phosphorus, potassium and trace elements (Fe, Mg, Mn) limit
photosynthetic rate when in short supply. In open oceans, the
limit is usually iron or nitrogen; in farmland, often
phosphorus.
Factor 4 - photosynthetic capacity of plants.
Determined by chlorophyll content per unit leaf area, leaf
area index (LAI), root depth, stomatal density and overall
plant physiology.
Factor 5 - other ecosystem-specific limits. Light
penetration limits aquatic productivity below the photic
zone; water availability limits terrestrial productivity in
deserts; latitude and altitude modulate both light and
temperature.
Global context. Annual NPP of the entire biosphere
is ∼ 170 bn t y-1 dry weight; oceans contribute
only ∼ 55 bn t y-1 despite covering 70% of the
planet, because most of the open ocean is nutrient-poor.
Why this matters. GPP, NPP and the factor list are the
backbone of every productivity-themed CUET/NEET MCQ in the chapter
and they thread directly into the energy-flow story of Q11. The
170 bn t figure earns a ``conceptual depth'' mark on Board essays.
Primary productivity = rate of biomass production by producers; NPP = GPP - R; controlled by plant species (C3/C4), climate, nutrients, photosynthetic capacity, and ecosystem-specific limits.
Q 12.10
Define decomposition and describe the processes and products of decomposition.
Concept used.Decomposition is the breakdown of
complex organic matter (detritus) into simpler inorganic substances
like CO2, water and nutrients (NO3-, PO4^3-, SO4^2-)
by decomposers (mainly fungi and bacteria, together with detritivores
like earthworms). The substrate for decomposition is detritus, which
includes dead plant parts (leaves, bark, flowers), dead animals and
faecal matter.
Processes of decomposition. Decomposition proceeds in five
overlapping steps:
Fragmentation.Detritivores (earthworms,
mites, millipedes) physically break detritus into smaller
pieces, vastly increasing its surface area.
Leaching. Water-soluble inorganic nutrients (sugars,
ions) seep down through the soil with rainwater and become
unavailable for the next step (or get adsorbed on soil
particles).
Catabolism. Bacterial and fungal enzymes
(cellulases, ligninases, proteases) chemically break the
fragmented detritus into smaller organic compounds.
Humification. Partly degraded matter accumulates as
humus, a dark amorphous, colloidal substance
resistant to further attack. Humus stores nutrients and is
slowly mineralised.
Mineralisation. Humus and any remaining organic
compounds are finally converted by microbes into inorganic
nutrients: CO2, water, NH4+, NO3-,
PO4^3-, SO4^2-.
Products of decomposition. The final products are
CO2, water and a pool of inorganic plant nutrients
(NH4+, NO3-, PO4^3-, SO4^2-, K+,
Ca^2+), which become available again for producers, closing
the nutrient cycle.
Factors that affect decomposition rate.
Chemistry of detritus. Detritus rich in nitrogen and
soluble sugars decomposes fast; detritus rich in lignin and
chitin decomposes slowly.
Climate. Warm and moist conditions favour
decomposition; cold or dry conditions slow it.
Oxygen. Decomposition is largely an aerobic process;
anaerobic (water-logged) conditions stall it and lead to
organic accumulation (peat bogs).
Decomposition = enzymatic breakdown of detritus into CO2, water and inorganic nutrients by decomposers; five processes (fragmentation, leaching, catabolism, humification, mineralisation) are favoured by warm, moist, aerobic conditions and nitrogen-rich substrates.
DJ
Diya Joshi
Ph.D Organic Chemistry, IISc Bangalore
Verified Expert
Structural observation. Five steps, two end-products,
three controlling factors. If you can rattle off ``5–2–3'' you can
rebuild the whole answer from memory, even under exam pressure.
Define the substrate and the agent. Detritus is the
substrate for decomposition: dead leaves, twigs, bark,
flowers, dead animals and faecal matter. The agents are
decomposers (saprophytic fungi and bacteria), assisted
by detritivores (earthworms, mites, millipedes,
termites) that physically fragment the detritus.
Step 1 - fragmentation. Detritivores break detritus
into smaller particles, increasing the surface area available
for microbial attack. Earthworms swallow soil and detritus
together, grinding it in their gizzards. This is a purely
physical process.
Step 2 - leaching. Water-soluble inorganic nutrients
(sugars, simple ions) are washed down through the soil
profile by rainwater. Some get adsorbed on clay particles and
become temporarily unavailable.
Step 3 - catabolism. Bacterial and fungal enzymes
(cellulases for cellulose, ligninases for lignin, proteases
for proteins) chemically degrade the fragmented detritus into
smaller organic compounds. This is the heart of decomposition.
Step 4 - humification. Partially degraded matter
accumulates as humus, a dark, amorphous, colloidal
substance highly resistant to microbial attack. Humus is a
slow-release reservoir of nutrients and improves soil
structure.
Step 5 - mineralisation. Some microbes continue to
attack humus, releasing inorganic ions: NH4+, NO3-,
PO4^3-, SO4^2-, K+, Ca^2+. These
return to the soil pool for plant uptake.
Two end-products. (i) CO2 + water released to
the atmosphere and soil; (ii) the inorganic nutrient pool
ready for re-absorption by producers. The nutrient cycle is
thereby closed.
Three controlling factors. (i) Detritus chemistry:
high lignin or chitin slows decomposition, high nitrogen or
soluble sugars speeds it up. (ii) Climate: warm and moist
conditions favour decomposition; cold or dry conditions slow
it. (iii) Oxygen: decomposition is largely aerobic; anaerobic
(water-logged) conditions stall it and lead to organic
accumulation in peat bogs and marshes.
Why this matters. The same five-step list shows up in CUET
fill-ins (``humus is produced during 1cm0.4pt'') and in
6-mark Board essays on nutrient cycling. Remembering the order also
makes drawing the carbon cycle easier and earns a separate mark for
``mineralisation'' as a distinct final step.
Decomposition: enzymatic conversion of detritus to CO2, water and inorganic nutrients via fragmentation, leaching, catabolism, humification and mineralisation; rate set by detritus chemistry, climate and oxygen.
Q 12.11
Give an account of energy flow in an ecosystem.
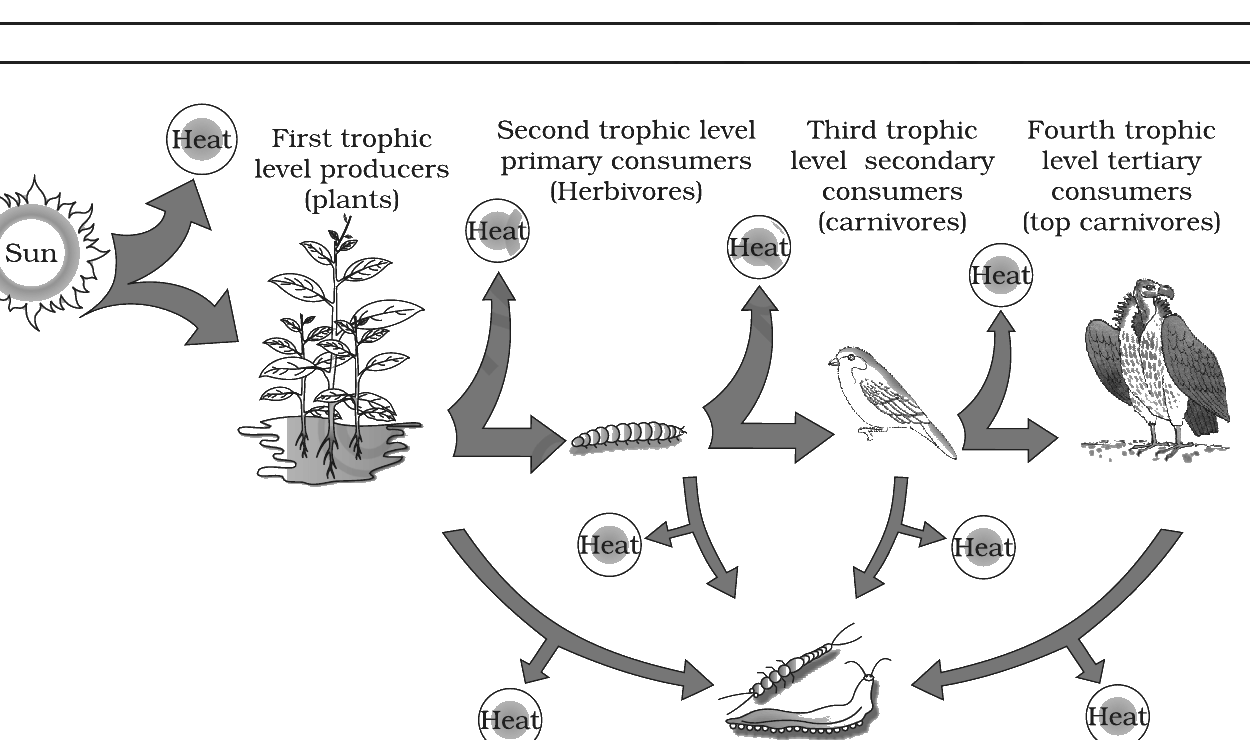
Concept used.Energy flow in an ecosystem is the
one-way movement of energy from the Sun through producers, consumers
and decomposers, with energy lost as heat at every transfer. It is
governed by two laws: the first law of thermodynamics (energy
is neither created nor destroyed, only transformed) and the
second law of thermodynamics (every transfer increases
entropy, releasing some energy as unusable heat). The chapter
highlights three quantitative anchors: ≈ 50% of incident
solar radiation is PAR; plants capture only 2–10% of PAR; and
only about 10% of energy passes from one trophic level to the next
(Lindeman's 10% law).
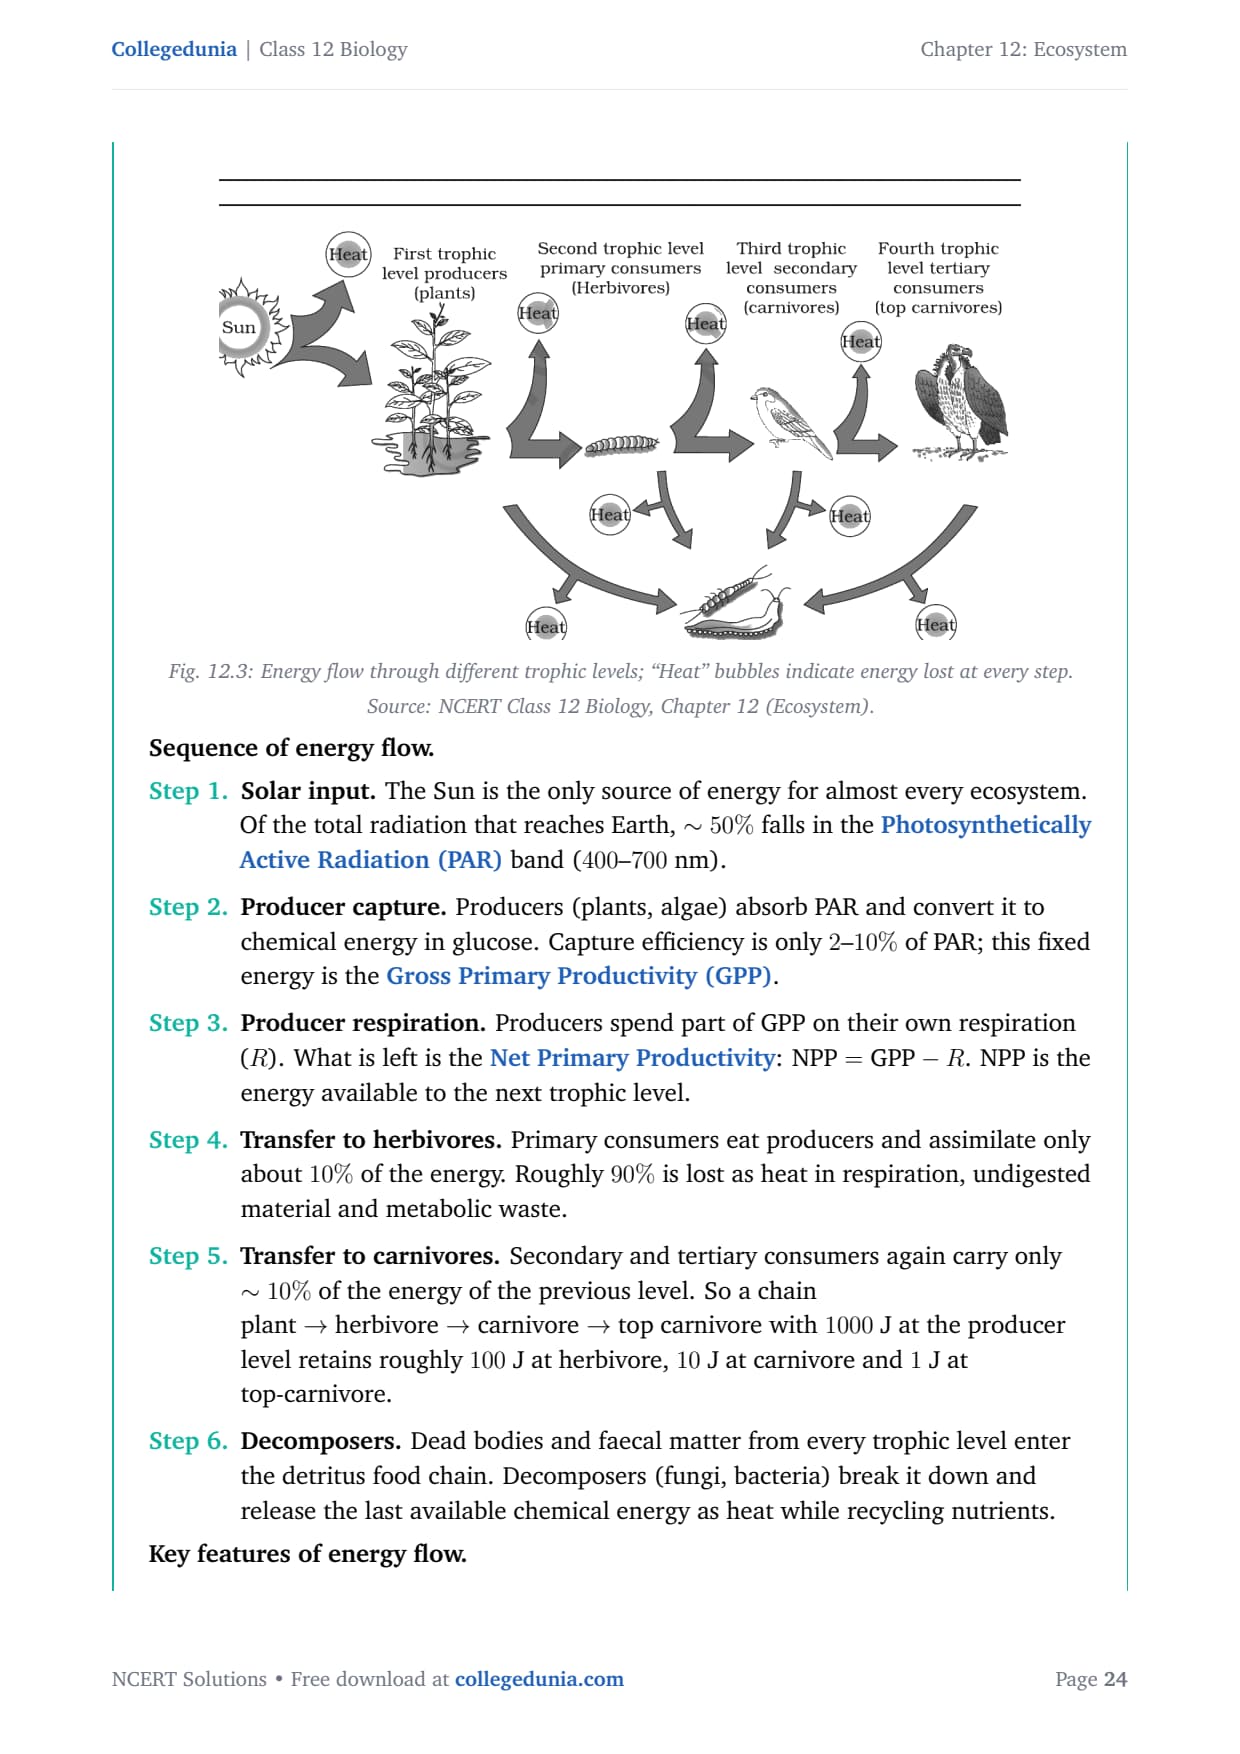
Fig. 12.3: Energy flow through different trophic levels; ``Heat'' bubbles indicate energy lost at every step. Source: NCERT Class 12 Biology, Chapter 12 (Ecosystem).
Sequence of energy flow.
Solar input. The Sun is the only source of energy
for almost every ecosystem. Of the total radiation that
reaches Earth, ∼ 50% falls in the
Photosynthetically Active Radiation (PAR) band
(400–700 nm).
Producer capture. Producers (plants, algae) absorb
PAR and convert it to chemical energy in glucose. Capture
efficiency is only 2–10% of PAR; this fixed energy is
the Gross Primary Productivity (GPP).
Producer respiration. Producers spend part of GPP on
their own respiration (R). What is left is the
Net Primary Productivity: NPP = GPP - R.
NPP is the energy available to the next trophic level.
Transfer to herbivores. Primary consumers eat
producers and assimilate only about 10% of the energy.
Roughly 90% is lost as heat in respiration, undigested
material and metabolic waste.
Transfer to carnivores. Secondary and tertiary
consumers again carry only ∼ 10% of the energy of the
previous level. So a chain
plant → herbivore → carnivore → top carnivore
with 1000 J at the producer level retains roughly 100 J at
herbivore, 10 J at carnivore and 1 J at top-carnivore.
Decomposers. Dead bodies and faecal matter from
every trophic level enter the detritus food chain.
Decomposers (fungi, bacteria) break it down and release the
last available chemical energy as heat while recycling
nutrients.
Key features of energy flow.
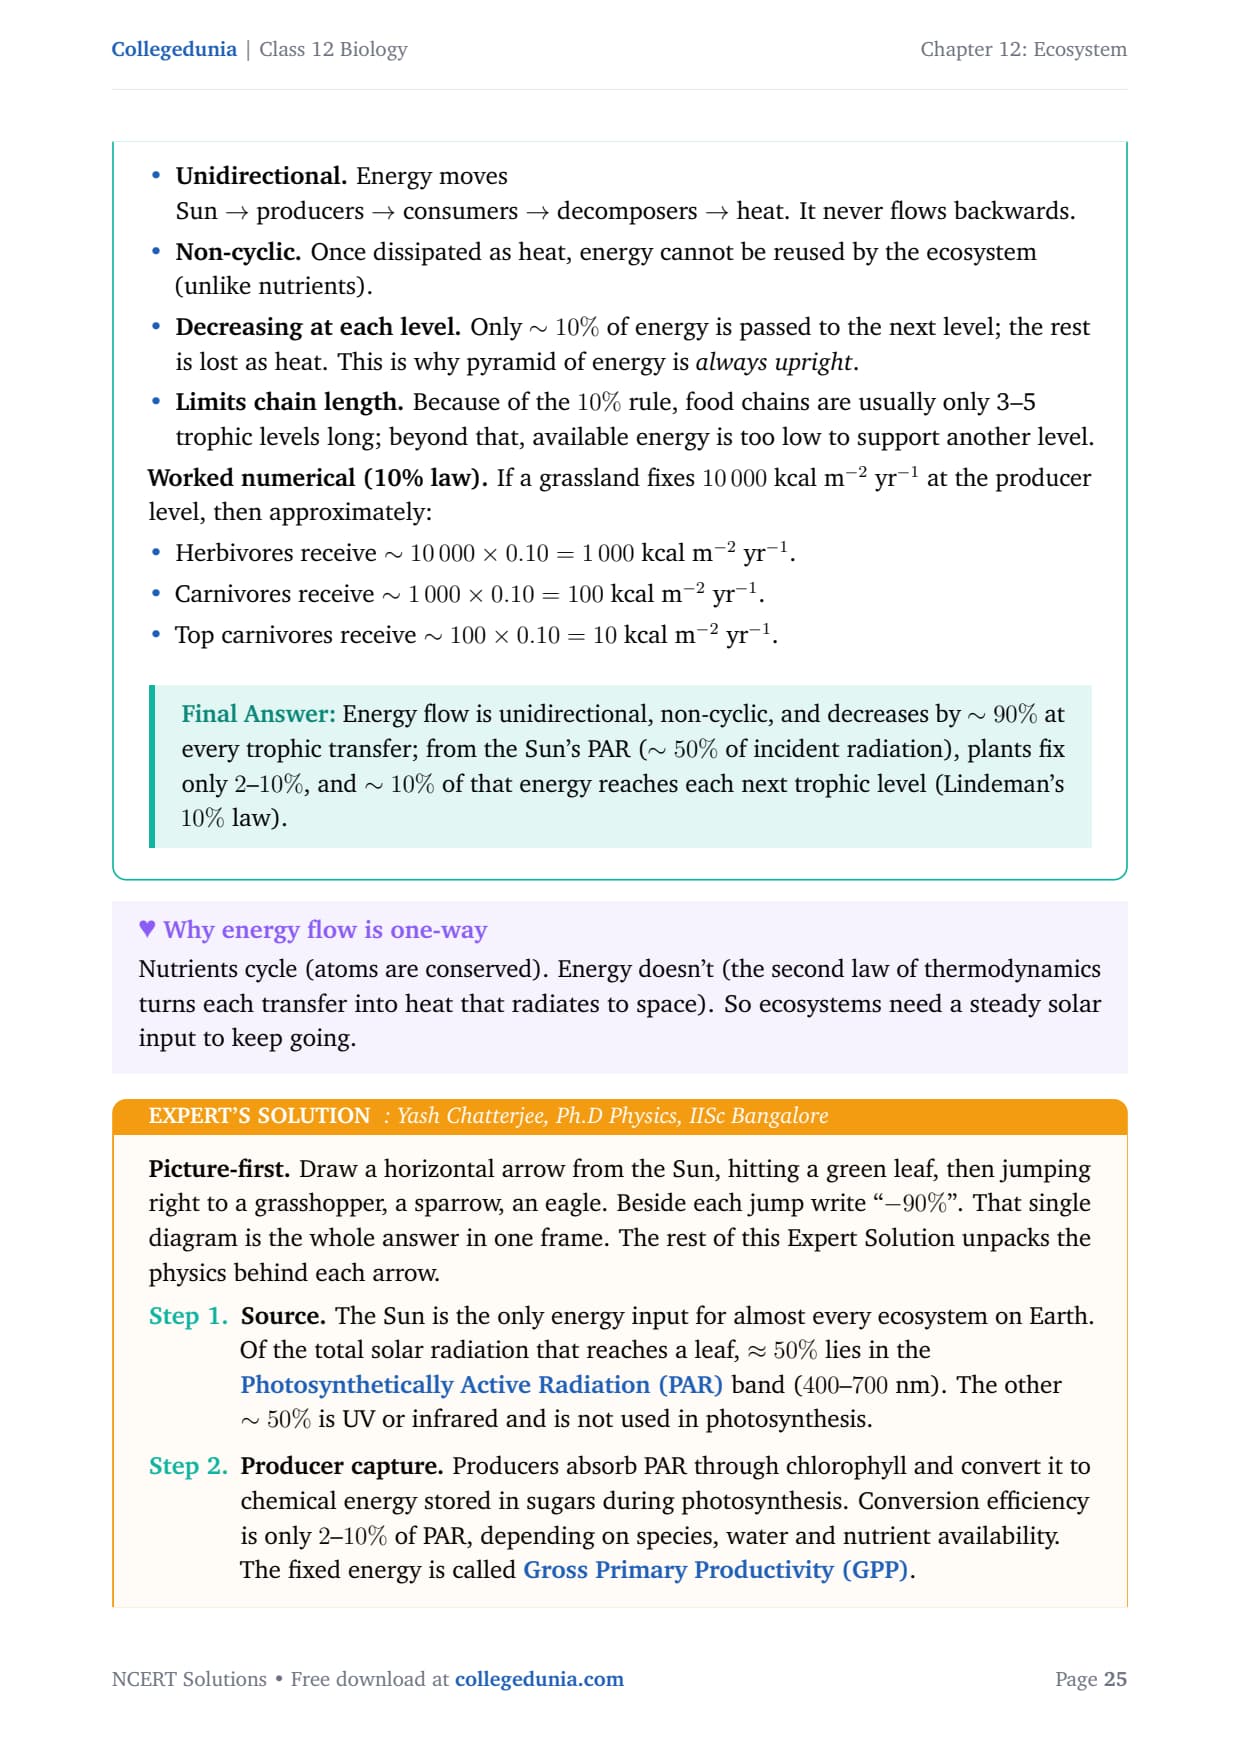
Unidirectional. Energy moves Sun → producers → consumers → decomposers → heat. It never flows backwards.
Non-cyclic. Once dissipated as heat, energy cannot be reused by the ecosystem (unlike nutrients).
Decreasing at each level. Only ∼ 10% of energy is passed to the next level; the rest is lost as heat. This is why pyramid of energy is always upright.
Limits chain length. Because of the 10% rule, food chains are usually only 3–5 trophic levels long; beyond that, available energy is too low to support another level.
Worked numerical (10% law). If a grassland fixes
10 000 kcal m-2 yr-1 at the producer level, then
approximately:
Energy flow is unidirectional, non-cyclic, and decreases by ∼ 90% at every trophic transfer; from the Sun's PAR (∼ 50% of incident radiation), plants fix only 2–10%, and ∼ 10% of that energy reaches each next trophic level (Lindeman's 10% law).
YC
Yash Chatterjee
Ph.D Physics, IISc Bangalore
Verified Expert
Picture-first. Draw a horizontal arrow from the Sun, hitting
a green leaf, then jumping right to a grasshopper, a sparrow, an
eagle. Beside each jump write ``-90%''. That single diagram is the
whole answer in one frame. The rest of this Expert Solution unpacks
the physics behind each arrow.
Source. The Sun is the only energy input for almost
every ecosystem on Earth. Of the total solar radiation that
reaches a leaf, ≈ 50% lies in the
Photosynthetically Active Radiation (PAR) band
(400–700 nm). The other ∼ 50% is UV or infrared
and is not used in photosynthesis.
Producer capture. Producers absorb PAR through
chlorophyll and convert it to chemical energy stored in
sugars during photosynthesis. Conversion efficiency is only
2–10% of PAR, depending on species, water and nutrient
availability. The fixed energy is called Gross
Primary Productivity (GPP).
Respiration loss at the producer. Producers spend a
substantial fraction of GPP on their own respiration (R) -
roughly 20–40% in most plants. What is left is the
Net Primary Productivity: NPP = GPP - R.
Only NPP is available to the next trophic level.
Pathway. Sun → producers (GPP, then NPP) →
herbivores → carnivores → top carnivores →
decomposers → heat radiated to space. Energy flows in one
direction; it never goes back up the chain.
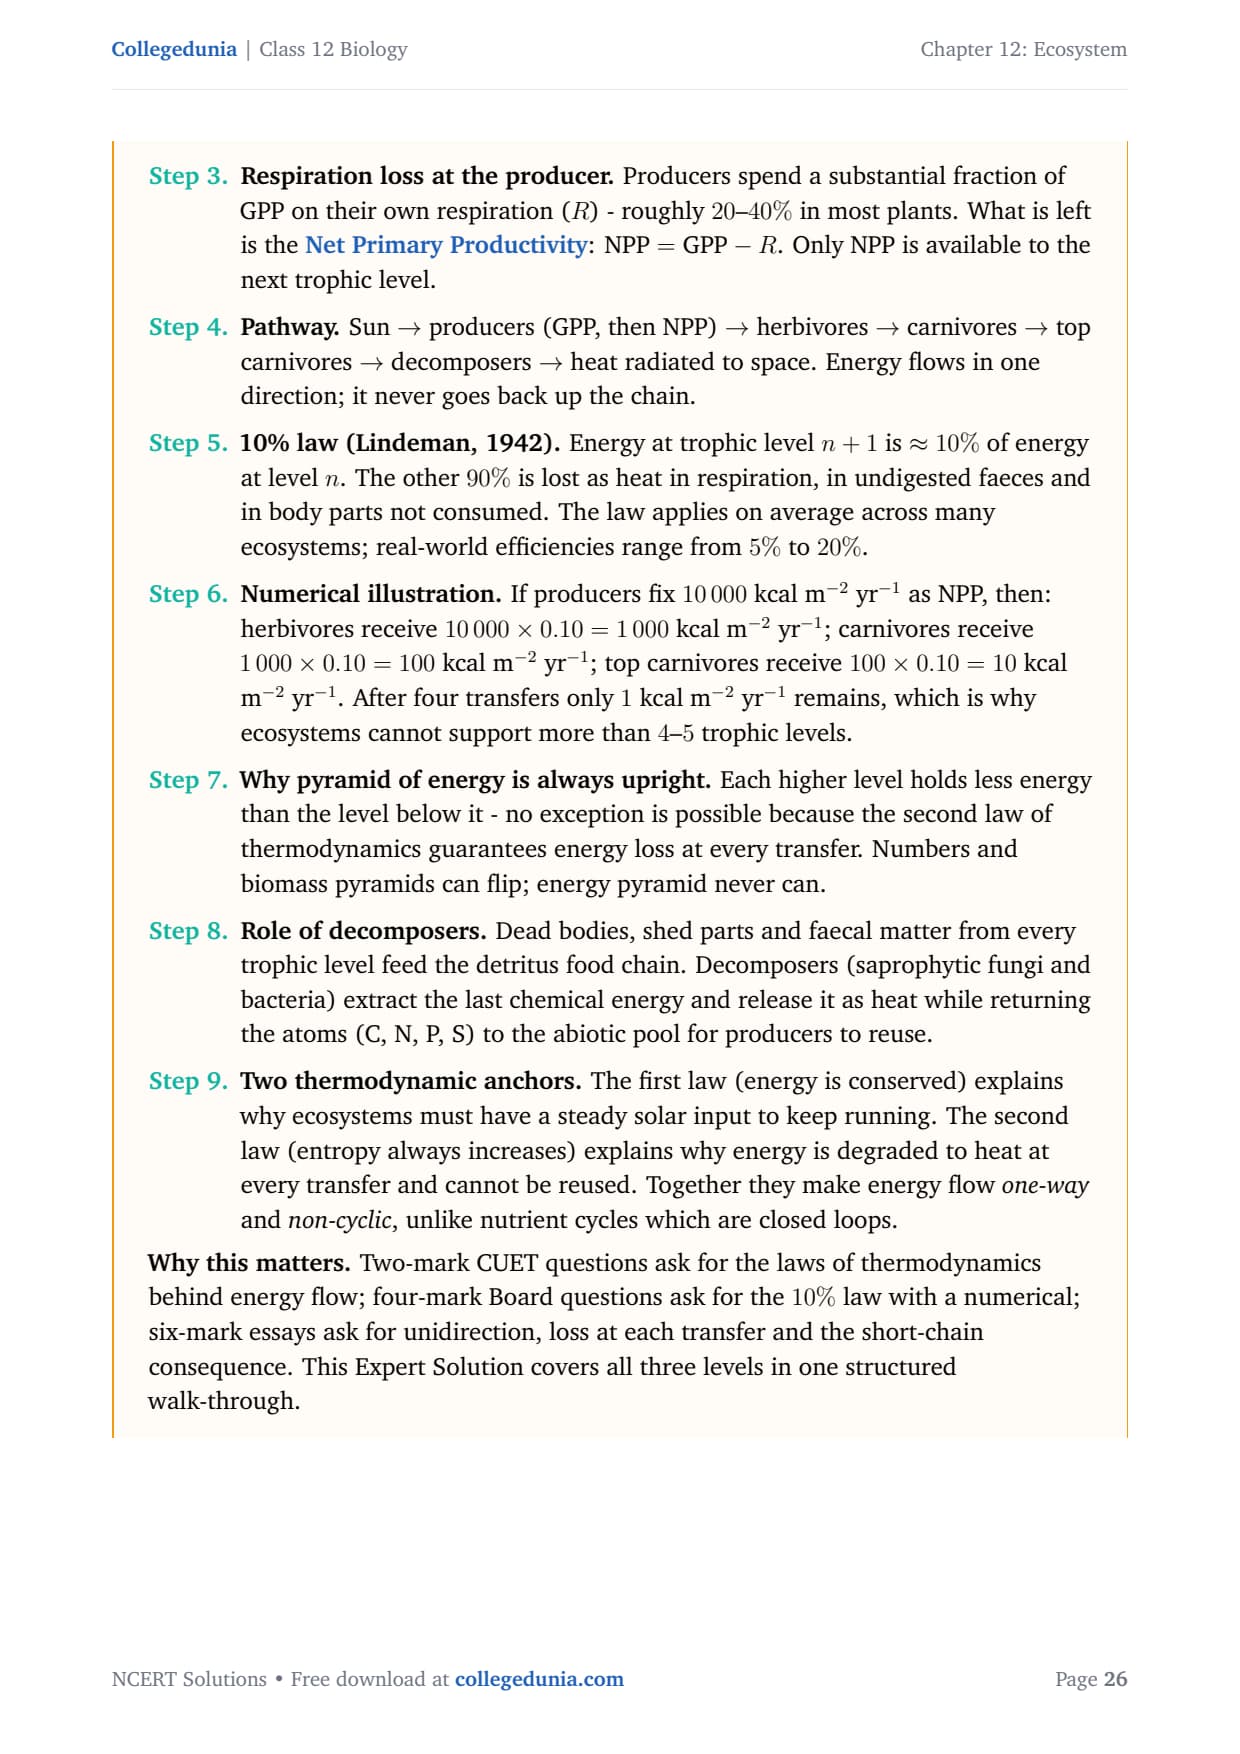
10% law (Lindeman, 1942). Energy at trophic level
n+1 is ≈ 10% of energy at level n. The other
90% is lost as heat in respiration, in undigested faeces
and in body parts not consumed. The law applies on average
across many ecosystems; real-world efficiencies range from
5% to 20%.
Numerical illustration. If producers fix
10 000 kcal m-2 yr-1 as NPP, then:
herbivores receive 10 000 × 0.10 = 1 000
kcal m-2 yr-1;
carnivores receive 1 000 × 0.10 = 100 kcal m-2
yr-1;
top carnivores receive 100 × 0.10 = 10 kcal m-2
yr-1. After four transfers only 1 kcal m-2
yr-1 remains, which is why ecosystems cannot support
more than 4–5 trophic levels.
Why pyramid of energy is always upright. Each higher
level holds less energy than the level below it - no
exception is possible because the second law of
thermodynamics guarantees energy loss at every transfer.
Numbers and biomass pyramids can flip; energy pyramid never
can.
Role of decomposers. Dead bodies, shed parts and
faecal matter from every trophic level feed the detritus food
chain. Decomposers (saprophytic fungi and bacteria) extract
the last chemical energy and release it as heat while
returning the atoms (C, N, P, S) to the abiotic pool for
producers to reuse.
Two thermodynamic anchors. The first law (energy is
conserved) explains why ecosystems must have a steady solar
input to keep running. The second law (entropy always
increases) explains why energy is degraded to heat at every
transfer and cannot be reused. Together they make energy flow
one-way and non-cyclic, unlike nutrient cycles
which are closed loops.
Why this matters. Two-mark CUET questions ask for the laws of
thermodynamics behind energy flow; four-mark Board questions ask for
the 10% law with a numerical; six-mark essays ask for unidirection,
loss at each transfer and the short-chain consequence. This Expert
Solution covers all three levels in one structured walk-through.
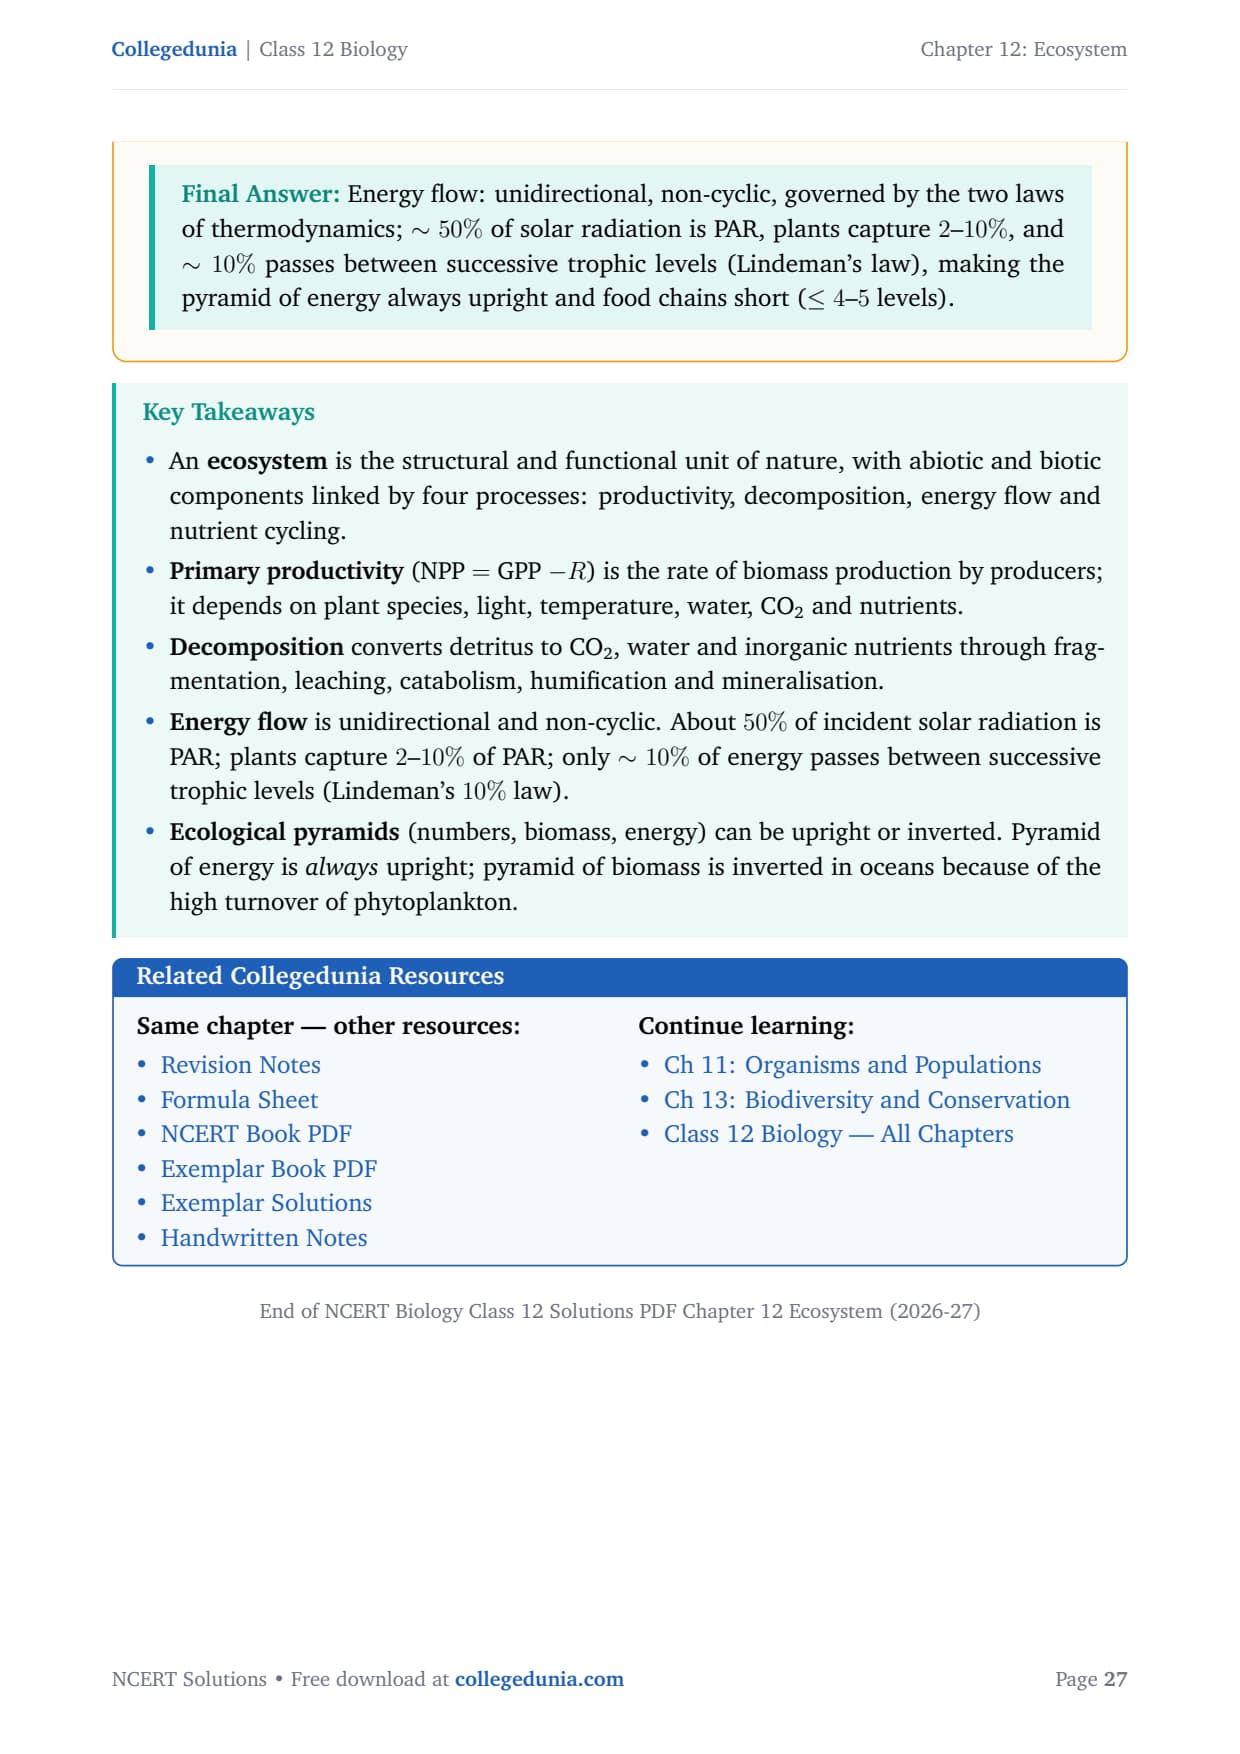
Energy flow: unidirectional, non-cyclic, governed by the two laws of thermodynamics; ∼ 50% of solar radiation is PAR, plants capture 2–10%, and ∼ 10% passes between successive trophic levels (Lindeman's law), making the pyramid of energy always upright and food chains short (≤ 4–5 levels).
NCERT Solutions for Class 12 Biology: All Chapters
Browse all 13 Class 12 Biology NCERT Solutions below.
We surveyed 13,100 Class 12 Biology students before the boards. Here is what they said about Ecosystem:
74% of students rated the 10% energy-flow law and the pyramid-of-energy diagram as the hardest sub-topic.
63% lost 1-2 marks on telling apart GPP, NPP and secondary productivity.
4 out of 5 students skipped the carbon and nitrogen cycle flowchart in their answer sheet.
Source: 2025 Class 12 Biology student survey, 13,100 students across 18 states.
Ecosystem Class 12 Biology NCERT Solutions FAQs
Ques. Where can I download Class 12 Biology Chapter 12 Ecosystem NCERT Solutions PDF?
Ans. You can download the Ecosystem Class 12 Biology NCERT Solutions PDF directly from this page. Both the Normal and HD versions are free and aligned with the 2026-27 NCERT.
Ques. Are these NCERT Solutions aligned with the 2026-27 syllabus?
Ans. Yes. This page reflects the current 2026-27 syllabus for Class 12 Biology. NCERT did not trim Ecosystem, so all 16 exercise questions are still examinable for CBSE Boards and NEET.
Ques. How many questions are there in the Ecosystem NCERT exercise?
Ans. The end-of-chapter exercise has 16 numbered questions covering ecosystem structure, productivity (GPP / NPP), decomposition, energy flow, ecological pyramids, succession and nutrient cycles. The PDF carries step-by-step worked answers to every one.
Ques. What is the NEET weightage of Class 12 Biology Chapter 12 Ecosystem?
Ans. NEET pulls 2 to 3 questions from Ecosystem every year. Energy flow with Lindeman's 10% law and the carbon / phosphorus cycles are the two highest-yield sub-topics.
Ques. What is the difference between GPP and NPP in Class 12 Biology?
Ans. GPP (Gross Primary Productivity) is the total energy fixed by producers per unit area per unit time. NPP (Net Primary Productivity) is the energy left after the producer's own respiration (R) is subtracted, i.e. NPP = GPP − R. NPP is what becomes available to herbivores.
Ques. Why is the pyramid of energy always upright?
Ans. Because energy follows the 10% law: only 10% of the energy at one trophic level transfers to the next; the rest is lost as heat. So the higher level always carries less energy than the level below, making the pyramid upright in every ecosystem. Pyramids of numbers and biomass can invert, but the pyramid of energy never does.
Ques. What is the 10% law of energy transfer in an ecosystem?
Ans. Lindeman's 10% law states that only about 10% of the energy in one trophic level is converted to biomass at the next trophic level. The remaining 90% is lost mainly as heat during respiration and as un-ingested or un-assimilated matter.
Ques. What are the five steps of decomposition in an ecosystem?
Ans. The five steps are: fragmentation (by detritivores like earthworms), leaching (water carries soluble inorganic nutrients into soil), catabolism (bacterial / fungal enzymes degrade detritus), humification (formation of dark amorphous humus), and mineralisation (humus releases inorganic nutrients).
Ques. How do NCERT Solutions for Ecosystem help with NEET preparation?
Ans. Every solution flags the exact term NEET asks verbatim. Words like GPP, NPP, standing crop, ecological efficiency, primary productivity, detritivore vs decomposer, sedimentary vs gaseous cycle, and Lindeman's 10% law all appear with NCERT spelling, so the same answer doubles as a one-mark MCQ recall sheet. The productivity-and-pyramid table on this page covers the 12 most-tested NEET numbers.









Comments