The 2026-27 NCERT keeps Part 2 Chapter 4 Analysis of Financial Statements intact in Part B, covering financial analysis, its tools, and Comparative and Common Size Statements. These NCERT Solutions solve every question in textbook order.
CBSE Weightage: 4 to 6 marks, usually one 6-mark statement question plus a 1-mark objective question
CUET Relevance: 3 to 5 questions in the Accountancy paper, mostly on tools of analysis and statement format
These NCERT Solutions are reviewed by Chartered Accountants and CBSE Commerce educators, mapped to the 2026-27 print, and checked against five years of CBSE and CUET papers.
Part 2 Chapter 4 sits in Part B: Financial Statements Analysis, between Chapter 3 and Chapters 5-6.
Why Class 12 Accountancy Part 2 Chapter 4 Solutions Are Worth the Practice
Analysis of Financial Statements is high-return: CBSE almost always sets one full Comparative or Common Size Statement. Students often lose 2 to 3 marks on presentation, not calculation. These solutions train you to write the CBSE-accepted format.
Quick Tip: In a Comparative Statement, the percentage change always uses the previous year (base) figure, not the current year. Reversing the base is the top reason a correct calculation still loses the percentage-column mark.
Class 12 Accountancy Part 2 Chapter 4 Analysis Of Financial Statements NCERT Solutions
Full Working: Each Statement solved column by column.
Expert Verification: CAs checked every percentage and sub-total.
Answer-Writing Cues: Each solution flags where step marks sit.
NCERT Solutions for Class 12 Accountancy Part 2 Chapter 4: Common Question Phrasings
CBSE recycles a small set of phrasings. Recognising the wording tells you instantly which statement format to use.
Question Stem
What It Wants
"Prepare a Comparative Statement of Profit and Loss..."
Two-year columns plus absolute and percentage change
"Prepare a Common Size Balance Sheet..."
Each item as % of Total Assets or Total Equity and Liabilities
"State any two objectives / limitations of financial analysis."
1 to 3 mark theory answer in points
"List the tools of analysis of financial statements."
Comparative, Common Size, Ratio Analysis, Cash Flow
"From the following Statement of Profit and Loss, prepare..."
Numerical with given Revenue, Expenses and Tax
Analysis of Financial Statements Exercise-by-Exercise Breakdown (NCERT Class 12 Accountancy)
The chapter has no numbered exercises; questions are grouped by type. The table shows how many of each type the NCERT print carries.
Question Block
Count
Sub-Topic
Test Your Understanding (Objective)
6+
Meaning, tools, parties interested
Short Answer Questions
5
Objectives, limitations, types of analysis
Long Answer Questions
4
Tools of analysis, significance of analysis
Numerical Questions
12+
Comparative Statement, Common Size Statement
Concept: Comparative Statements show horizontal analysis (change over two years); Common Size Statements show vertical analysis (each item as a percentage of a base). Name the type when CBSE asks.
Sample Fully-Solved Question Walk-Through: Comparative Statement of Profit and Loss
A typical 6-mark CBSE numerical: Revenue from Operations was Rs 8,00,000 in 2023-24 and Rs 10,00,000 in 2024-25; Total Expenses were Rs 5,00,000 and Rs 6,50,000; tax is 50%. The percentage change uses the base-year figure:
$$\text{Percentage Change} = \frac{\text{Absolute Change}}{\text{Previous Year Figure}} \times 100$$
Particulars
2023-24 (Rs)
2024-25 (Rs)
Absolute Change (Rs)
% Change
Revenue from Operations
8,00,000
10,00,000
2,00,000
25.00
Total Expenses
5,00,000
6,50,000
1,50,000
30.00
Profit before Tax
3,00,000
3,50,000
50,000
16.67
Less: Tax @ 50%
1,50,000
1,75,000
25,000
16.67
Profit after Tax
1,50,000
1,75,000
25,000
16.67
Percentage change for Revenue from Operations: 2,00,0008,00,000 × 100 = 25% . Full marks need the four-column layout, correct sub-totals, and two-decimal rounding.
Marks Budget for a 6-Mark Analysis of Financial Statements Question
Knowing where each mark sits tells you what you must not skip under exam pressure.
Step
Marks
What Earns It
Correct format and column headings
1
Four-column layout with title and sub-headings
Current and previous year figures placed correctly
1.5
Right items under right years, with sub-totals
Absolute change column
1.5
Current year minus previous year, every line
Percentage change column
1.5
Change over base year, two-decimal rounding
Profit before / after tax line
0.5
Tax adjustment and final profit shown
Common Mistakes Students Make in Analysis of Financial Statements
Most lost marks come from presentation slips, not arithmetic. Watch for these.
Computing the percentage change on the current year instead of the previous (base) year.
Using a Comparative format when Common Size was asked, or the reverse.
Forgetting the Tax line, so Profit after Tax is missing.
In a Common Size Balance Sheet, using the wrong base (Total Assets or Total Equity and Liabilities).
Watch Out:A Common Size Statement always sums to 100% on its base. If your column does not total 100, a figure is wrong, and the examiner will spot it.
How to Study Analysis of Financial Statements for Class 12 Accountancy Boards
This is a format-driven chapter, so practice beats re-reading. Budget about 6 to 7 hours, spread over four short sessions.
Day 1 (1.5 hours): Read the meaning, objectives, and limitations; learn the four tools by name.
Day 2 (2 hours): Solve Comparative Statement numericals until the layout is automatic.
Day 3 (2 hours): Solve Common Size numericals for both Profit and Loss and Balance Sheet.
Day 4 (1 hour): Revise theory questions and attempt one past-paper question, timed.
Analysis of Financial Statements Previous Year Questions Weightage (2021–2026)
The table shows how the chapter has appeared in recent CBSE and CUET papers. The full list is on the Notes page.
Year
CBSE Board
CUET (Accountancy)
2026
-
-
2025
Comparative Statement of Profit and Loss (6 marks)
Important Formulae for Analysis of Financial Statements
Two formulae drive this chapter: Percentage Change = (Absolute Change / Previous Year Figure) × 100, and Common Size % = (Item / Base) × 100. Base: Revenue from Operations for Profit and Loss; Total Assets for the Balance Sheet.
All NCERT Solutions for Analysis of Financial Statements with Step-by-Step Working
Every NCERT question for this chapter is listed below with a full Solution and Expert Solution in collapsible tabs.
Short Answer Questions
Q 8.1
List the techniques of Financial Statement Analysis.
Concept used.Financial Statement Analysis is the
process of critically evaluating the information in the financial
statements (Balance Sheet, Statement of Profit and Loss, Cash Flow
Statement) to judge a firm's profitability, solvency and operational
efficiency. A technique (or tool) is a standard method used to
turn raw figures into a comparison that means something.
The NCERT chapter lists five commonly used techniques.
Comparative Statements. Statements that show the
profitability and financial position for two or more periods
side by side, with the absolute and percentage change. Also
called horizontal analysis.
Common Size Statements. Statements in which every
item is expressed as a percentage of a common base (revenue
from operations for the Statement of Profit and Loss; total
assets or total of equity and liabilities for the Balance
Sheet). Also called vertical analysis.
Trend Analysis. Studying operational results and
financial position over a series of years by expressing each
year's figure as a percentage of a chosen base year.
Ratio Analysis. Establishing the relationship
between two items of the Balance Sheet and/or the Statement
of Profit and Loss as a ratio, to measure profitability,
solvency and efficiency.
Cash Flow Analysis. Analysing the actual movement
of cash into and out of the business (inflows, outflows and
net cash flow) during an accounting year.
The five techniques are: Comparative Statements, Common Size
Statements, Trend Analysis, Ratio Analysis and Cash Flow Analysis.
AS
Aarav Sharma
M.Com Accounting and Finance, Delhi University
Verified Expert
Quick reading. A "list" question wants a clean enumeration,
not paragraphs, but the marks come from never missing one. The
reliable trick is to remember the five tools by what each one
compares, because every tool is just a different kind of comparison
of the same statement figures.
The five comparisons map one-to-one onto the five tools:
One item, this year vs last year ⇒ Comparative
Statements.
One item, many years vs a fixed base year ⇒
Trend Analysis.
One item vs a common base in the same statement
⇒ Common Size Statements.
One item vs another related item, as a ratio ⇒
Ratio Analysis.
Cash coming in vs cash going out ⇒ Cash Flow
Analysis.
Across time, same firm. Comparative Statements
compare period with period (absolute and percentage change);
Trend Analysis compares many years against one base year
fixed at 100.
Within one statement, structure. Common Size
Statements express each item as a percentage of a common
base (revenue for the P&L, total assets for the Balance
Sheet).
Between two items, relationship. Ratio Analysis
relates one figure to another as a ratio to measure
profitability, solvency and efficiency.
Cash movement. Cash Flow Analysis nets cash
inflows against cash outflows to find the change in cash
position between two balance-sheet dates.
Why this matters. Examiners often follow "list" with
"classify": Comparative and Trend are horizontal analysis;
Common Size and Ratio are vertical analysis; Cash Flow stands
apart as a movement analysis. Knowing this grouping lets you answer
the follow-up without re-reading the chapter.
Common mistakes. Three predictable slips lose marks: (a) computing percentage change on the current-year base rather than the previous-year base in a comparative statement; (b) confusing common-size analysis (each item as a percent of a common base such as Revenue from Operations or Total Assets) with trend analysis (each item as a percent of a chosen base year); (c) discussing limitations in general terms without naming the specific limitation such as ignoring price-level changes or window dressing.
Comparative Statements, Common Size Statements, Trend
Analysis, Ratio Analysis, Cash Flow Analysis.
Q 8.2
Distinguish between Vertical and Horizontal Analysis of financial data.
Concept used.Horizontal analysis compares a single
item across two or more periods to see how it changed over time.
Vertical analysis compares each item within one period
against a common base in that same period, to see its relative size.
The names come from the direction in which the eye moves: across
columns (horizontal) versus down a single column (vertical).
Basis of comparison. Horizontal analysis compares
figures of the current year with those of one or more
previous years. Vertical analysis compares each item with a
common base figure of the same year.
Tools that use it. Horizontal analysis is done
through Comparative Statements and Trend Analysis. Vertical
analysis is done through Common Size Statements and Ratio
Analysis.
Purpose. Horizontal analysis shows the direction and
rate of change over time (is the item growing or shrinking).
Vertical analysis shows the internal structure or proportion
of each item within the statement.
Usefulness. Horizontal analysis suits intra-firm
study over years. Vertical analysis suits inter-firm
comparison even between firms of very different sizes,
because everything is reduced to a percentage.
Horizontal analysis = time-wise comparison of one item
across years (Comparative & Trend). Vertical analysis = same-year
comparison of each item with a common base (Common Size & Ratio).
PM
Priya Mehta
M.Com, Banaras Hindu University
Verified Expert
Structural observation. Picture a financial statement as a
grid of figures. Horizontal analysis reads the grid across
(the same item over several year-columns). Vertical analysis reads
the grid down a single column (each item measured against
that column's base). The whole distinction follows from which
direction the eye moves, which is why the names "horizontal" and
"vertical" were chosen.
A four-line contrast captures everything an exam answer needs:
Basis: horizontal compares across years; vertical
compares within one year against a base.
Tools: horizontal uses Comparative Statements and
Trend Analysis; vertical uses Common Size Statements and
Ratio Analysis.
Output: horizontal yields absolute change and
percentage change; vertical yields a component percentage.
Best use: horizontal tracks one firm's growth over
time; vertical compares firms of unequal size on a common
100 base.
Direction. Row-wise across year-columns
⇒ horizontal. Column-wise top to bottom within
one year ⇒ vertical.
Output. Horizontal gives absolute and percentage
change of each item over time. Vertical gives each item as a
percentage of the period's common base.
Best use. Horizontal is for intra-firm growth
tracking; vertical is for inter-firm comparison even between
firms of very different sizes.
Reconcile the pair. Both analyse the very same
statement figures; they differ only in the direction of
comparison, so a complete analysis usually uses both.
Why this matters. Two firms of unequal size can be laid
side by side only after a common size statement scales both to 100;
a raw comparative statement of unequal firms cannot be compared
directly. That single practical consequence is the point the
examiner is testing.
Common mistakes. Three predictable slips lose marks: (a) computing percentage change on the current-year base rather than the previous-year base in a comparative statement; (b) confusing common-size analysis (each item as a percent of a common base such as Revenue from Operations or Total Assets) with trend analysis (each item as a percent of a chosen base year); (c) discussing limitations in general terms without naming the specific limitation such as ignoring price-level changes or window dressing.
Horizontal = across-time, row-wise (change, via
Comparative and Trend). Vertical = within-year, column-wise
(proportion, via Common Size and Ratio).
Q 8.3
State the meaning of Analysis and Interpretation.
Concept used. The term financial analysis has two
inseparable parts: analysis and interpretation. Analysis
prepares the data; interpretation explains what the prepared data
means. One is useless without the other.
Analysis. Analysis means the simplification of
financial data by a methodical classification of the figures
given in the financial statements. It regroups and rearranges
the raw figures (for example, into comparative or common size
form) so that relationships become visible.
Interpretation. Interpretation means explaining the
meaning and significance of the data so simplified. It draws
conclusions: whether profitability is rising or falling,
whether the firm is becoming more or less solvent, and what
this implies for decision-making.
Why both are needed. Analysis without
interpretation is useless, because numbers alone do not tell
a story. Interpretation without analysis is difficult or even
impossible, because there is nothing organised to interpret.
The two are complementary.
Analysis = methodical simplification and classification of
financial data. Interpretation = explaining the meaning and
significance of that data. They are complementary.
RV
Rohit Verma
M.Com Accountancy, University of Mumbai
Verified Expert
Quick reading. The two words name two stages in a fixed
order: first you do the analysis (arrange the numbers), then
you say the interpretation (explain what the arrangement
means). Answering in that order, and stressing that they are
complementary, is the complete answer.
It helps to map each term to a plain question it answers:
Analysis answers "What do the numbers look like once
organised?" It is mechanical: reclassify, regroup, simplify.
Interpretation answers "So what does that organised
picture mean for the firm?" It is judgemental: strength,
weakness, trend, prospect.
Analysis = the "what". Methodically reclassify and
simplify the statement figures (for example into comparative
or common size form) so patterns and relationships surface.
Interpretation = the "so what". State the
significance of those patterns: is profitability rising,
is solvency improving, what does it predict.
Show the dependence. Analysis without
interpretation is useless (numbers alone tell no story);
interpretation without analysis is impossible (nothing
organised to explain).
Conclude they are complementary. Together they form
the judgemental process that estimates the past, reads the
present and predicts the future.
Why this matters. In a board exam, a comparative statement
submitted with no concluding remark loses every interpretation mark,
because the "interpretation" half of the term was skipped. Always
close a numerical with a one-line "the firm's profitability
improved / declined because ..." comment.
Common mistakes. Three predictable slips lose marks: (a) computing percentage change on the current-year base rather than the previous-year base in a comparative statement; (b) confusing common-size analysis (each item as a percent of a common base such as Revenue from Operations or Total Assets) with trend analysis (each item as a percent of a chosen base year); (c) discussing limitations in general terms without naming the specific limitation such as ignoring price-level changes or window dressing.
Analysis simplifies and classifies the data;
interpretation explains its meaning and significance. They are
complementary and must be done together.
Q 8.4
State the importance of Financial Analysis?
Concept used.Financial analysis identifies the
financial strengths and weaknesses of a firm by establishing
relationships between items of the Balance Sheet and the Statement of
Profit and Loss. Its importance is judged by how many different stakeholders
it serves and the decisions it supports.
Judging operational efficiency. It measures the
success of operations and appraises managerial performance,
helping the finance manager and top management take rational
decisions and exercise financial control.
Assessing short-term solvency. Trade payables use it
to judge the firm's ability to meet short-term obligations,
that is, its liquidity position.
Assessing long-term solvency. Lenders use it to
judge the firm's long-term solvency and survival, its ability
to generate cash, pay interest and repay the principal.
Guiding investment decisions. Investors use it to
analyse present and future profitability and the capital
structure, to decide whether to buy, sell or hold shares.
Other stakeholders. Labour unions use it to support wage
demands; economists, researchers and government agencies use
it for price regulation, taxation and policy.
Financial analysis is important because it reveals strengths
and weaknesses and serves managers, trade payables, lenders,
investors, labour unions and the government in their respective
decisions.
AI
Aditi Iyer
M.Com Finance, University of Madras
Verified Expert
Strategic angle. The cleanest way to answer "importance" is
user by user, because the NCERT explains significance through the
needs of each user group.
Lenders: long-term solvency, interest and principal
repayment.
Investors: profitability and risk for buy / sell /
hold.
Labour unions, economists, government: wage
capacity, economic study, regulation and taxation.
Name the user. Start with the user group (finance
manager, trade payable, lender, investor, labour union,
government).
State the decision. For each, write the single
decision the analysis supports: control and efficiency for
management, short-term liquidity for trade payables,
long-term solvency and repayment ability for lenders,
profitability and risk for investors, wage capacity for
labour unions, regulation and taxation for the government.
Link to the statements. Note that every user reads
the same Balance Sheet and Statement of Profit and Loss; the
analysis differs only because the purpose differs.
Repeat across all groups. Cover every group so no
importance mark is left on the table.
Why this matters. Framing the answer user by user proves to
the examiner that you understand why the same statements are
analysed differently by different parties: the technique chosen
serves the interest of the analyst, so a lender's solvency focus and
an investor's profitability focus draw different conclusions from
identical figures.
Common mistakes. Three predictable slips lose marks: (a) computing percentage change on the current-year base rather than the previous-year base in a comparative statement; (b) confusing common-size analysis (each item as a percent of a common base such as Revenue from Operations or Total Assets) with trend analysis (each item as a percent of a chosen base year); (c) discussing limitations in general terms without naming the specific limitation such as ignoring price-level changes or window dressing.
It supports decisions of every stakeholder: management,
trade payables, lenders, investors, labour unions and government.
Q 8.5
What are Comparative Financial Statements?
Concept used.Comparative Financial Statements are
the Statement of Profit and Loss and the Balance Sheet prepared with
separate columns for the current year, the previous year, and the
change during the year shown both in absolute money terms and in
percentage terms.
What they contain. For each item there are four
figures: the previous year's amount, the current year's
amount, the absolute change, and the percentage change.
How the change is found. The absolute change is the
current year figure minus the previous year figure. The
percentage change is
% change
= Absolute changePrevious year figure× 100 .
Purpose. They show not only the balances on
different dates but also the extent of increase or decrease
between those dates, revealing the direction and trend of
performance.
Other name. Because they compare the same item
across periods, this is a form of horizontal analysis.
Comparative Financial Statements are the Statement of Profit
and Loss and Balance Sheet shown for two periods side by side, with
the absolute and percentage change for every item (horizontal
analysis).
KG
Karan Gupta
M.Com, University of Calcutta
Verified Expert
Picture-first. The fastest way to "define" a comparative
statement is to draw its skeleton. It is always a five-column grid:
Particulars, Previous Year, Current Year, Absolute Change, Percentage
Change. That grid is the comparative statement, and every
exam question simply asks you to fill it.
The two derived columns follow one rule each:
Absolute change= Current Year - Previous Year.
Its sign (or a bracket) shows whether the item rose or fell.
Percentage change=
Absolute changePrevious Year× 100.
The base is always the earlier year.
Columns 2 and 3. Enter the two years' absolute
figures for every item of the Statement of Profit and Loss
or Balance Sheet.
Column 4. Subtract: Column 3 - Column 2, keeping
the sign so a decrease shows as negative or in brackets.
Column 5. Divide Column 4 by Column 2 and multiply
by 100 to get the percentage change.
Read the result. The filled grid shows not just the
balances but the direction and rate of change, which is the
purpose of a comparative statement.
Why this matters. Knowing the five-column layout by heart
means you can build any comparative statement in the exam without
re-deriving the format, and you will never forget the
interpretation column (Column 5) that carries the analysis marks.
Common mistakes. Three predictable slips lose marks: (a) computing percentage change on the current-year base rather than the previous-year base in a comparative statement; (b) confusing common-size analysis (each item as a percent of a common base such as Revenue from Operations or Total Assets) with trend analysis (each item as a percent of a chosen base year); (c) discussing limitations in general terms without naming the specific limitation such as ignoring price-level changes or window dressing.
A two-period side-by-side five-column statement with
absolute and percentage change for each item (horizontal analysis).
Q 8.6
What do you mean by Common Size Statements?
Concept used. A Common Size Statement (also called
a component percentage statement) is a financial statement in which
every item is expressed as a percentage of a common base, so that
statements of different sizes can be compared on a level footing.
The common base. For the Statement of Profit and
Loss the base is revenue from operations, taken as 100. For
the Balance Sheet the base is total assets (or total of
equity and liabilities), taken as 100.
How each item is shown. Each item is converted using
Component %
= Individual itemCommon base× 100 .
Purpose. Because every figure is reduced to a
percentage of a common 100, firms that differ greatly in size
can be compared, and the internal structure of the statements
becomes visible.
Other name. Since each item is compared down the
column against a base of the same year, this is
vertical analysis.
A Common Size Statement expresses each item as a percentage
of a common base (revenue from operations for the P&L; total assets
or total equity and liabilities for the Balance Sheet) to allow
comparison across firms of any size.
SR
Sneha Reddy
M.Com Accountancy, Osmania University
Verified Expert
Strategic angle. The single defining feature of a common
size statement is the common base set to 100. If you state
the correct base for each statement and the conversion formula, the
definition is complete and the purpose follows naturally.
Two facts carry the answer, and both are about the base:
The base is not arbitrary: it is revenue from operations for
the Statement of Profit and Loss, and total assets (equal to
total of equity and liabilities) for the Balance Sheet.
Because every figure is divided by the same base and
multiplied by 100, two firms of very different sizes are
reduced to the same scale and become directly comparable.
P&L base. Revenue from operations = 100; every
expense and profit line is shown as a percentage of it.
Balance Sheet base. Total assets (or total equity
and liabilities) = 100; every asset and liability is shown
as a percentage of it.
Conversion. Each item
= itemcommon base× 100.
Purpose. The resulting percentages reveal the
internal structure of the statement and allow inter-firm and
industry comparison regardless of size (vertical analysis).
Why this matters. The base choice is the single most
examined point in this topic: revenue for the P&L and total assets
for the Balance Sheet, never the other way round. Swapping them is
the most common reason marks are lost here.
Common mistakes. Three predictable slips lose marks: (a) computing percentage change on the current-year base rather than the previous-year base in a comparative statement; (b) confusing common-size analysis (each item as a percent of a common base such as Revenue from Operations or Total Assets) with trend analysis (each item as a percent of a chosen base year); (c) discussing limitations in general terms without naming the specific limitation such as ignoring price-level changes or window dressing.
A statement expressing every item as a % of a common base
(revenue for the P&L; total assets for the Balance Sheet), enabling
size-independent comparison (vertical analysis).
Long Answer Questions
Q 8.7
Describe the different techniques of financial analysis and explain the limitations of financial analysis.
Concept used.Financial analysis uses standard
techniques to convert raw statement figures into meaningful
comparisons; but because it relies entirely on the financial
statements, it inherits their limitations. A full answer has
two parts: the five techniques, then the limitations.
Comparative Statements. Profitability and position
for two or more periods shown side by side with absolute and
percentage change. Reveals the direction and trend of
performance (horizontal analysis).
Common Size Statements. Each item expressed as a
percentage of a common base, allowing comparison of firms of
different sizes (vertical analysis).
Trend Analysis. Each year's figure expressed as a
percentage of a base year over a series of years, to spot
long-run rising, falling or steady patterns.
Ratio Analysis. Relationship between two statement
items expressed as a ratio, measuring profitability, solvency
and efficiency.
Cash Flow Analysis. Study of the actual inflow and
outflow of cash to find the net change in cash position
between two balance sheet dates.
Limitations checklist
Price levels ignored • accounting-policy changes mislead
• only a study of reports • non-monetary factors
ignored • historical, not current, position.
Limitations of financial analysis.
Ignores price level changes. It does not adjust for
inflation, so figures of different years are not strictly
comparable.
Affected by accounting changes. Results can mislead
if the firm changes its accounting procedures and the change
is not known.
Only a study of reports. It analyses only what the
company reports; it cannot reveal what is left out.
Ignores non-monetary factors. Only monetary
information is considered; quality of management, labour
relations and similar factors are not captured.
Based on accounting concepts. Statements rest on
accounting concepts and conventions, so they do not reflect
the current (market) position.
Techniques: Comparative, Common Size, Trend, Ratio and Cash
Flow Analysis. Limitations: ignores price levels, misled by
accounting changes, only a study of reports, ignores non-monetary
factors, and does not show the current position.
VJ
Vivaan Joshi
M.Com Finance, Symbiosis Pune
Verified Expert
Strategic angle. Treat this as two short lists glued
together. Each technique gets one defining sentence; each limitation
gets one cause-and-effect sentence.
Techniques (what they do): Comparative (period vs period),
Common Size (item vs base), Trend (year vs base year), Ratio
(item vs item), Cash Flow (inflow vs outflow).
Limitations (why they weaken the analysis): inflation
ignored, policy changes mislead, only reported data, only
monetary data, historical not current.
List the five techniques. Comparative Statements
(period vs period, with absolute and % change), Common Size
Statements (each item as a % of a common base), Trend
Analysis (each year vs a fixed base year), Ratio Analysis
(one item related to another as a ratio), Cash Flow Analysis
(inflows netted against outflows).
State the five limitations as cause and effect.
Price-level changes ignored, so cross-year figures are not
truly comparable; accounting-policy changes can mislead if
not disclosed; only reported data is analysed; only monetary
information is captured; statements are historical, not
current.
Connect the halves. Point out that the limitations
exist because the techniques operate only on the
reported, historical, monetary statements.
Close. Conclude that financial analysis is helpful
but must always be read with these limitations in mind.
Why this matters. Examiners reward the student who connects
the two halves rather than listing them in isolation: the
limitations are not a separate topic, they are the direct
consequence of the very data the techniques are confined to.
Common mistakes. Three predictable slips lose marks: (a) computing percentage change on the current-year base rather than the previous-year base in a comparative statement; (b) confusing common-size analysis (each item as a percent of a common base such as Revenue from Operations or Total Assets) with trend analysis (each item as a percent of a chosen base year); (c) discussing limitations in general terms without naming the specific limitation such as ignoring price-level changes or window dressing.
Five techniques (Comparative, Common Size, Trend, Ratio,
Cash Flow) and five limitations (price levels, accounting changes,
report-only, non-monetary ignored, not current position).
Q 8.8
Explain the usefulness of trend percentages in interpretation of financial performance of a company.
Concept used.Trend analysis studies operational
results and financial position over a series of years. A
trend percentage expresses each year's figure of an item as
a percentage of that same item in a chosen base year, computed
as
Trend %
= Figure of the given yearFigure of the base year× 100 .
The base year itself is therefore always 100.
Long-run view. By looking at many years at once,
trend percentages take a long-run view that may point to
basic changes in the nature of the business that a single
year cannot show.
Direction of change. By watching a particular item
or ratio, one can see whether it is rising, falling or
staying relatively constant over time.
Early signals. From this direction a problem can be
detected early, or the sign of good or poor management can be
read, before it shows up sharply in absolute figures.
Simple comparison. Because every year is scaled
against the base year's 100, comparing performance across
many years becomes simple and quick.
Forecasting aid. A consistent trend supports a
reasonable forecast of future performance, useful for
planning and for investors.
Trend percentages give a long-run, base-year-scaled view
that shows the direction of change, gives early signals of good or
poor management, makes multi-year comparison simple, and supports
forecasting.
AN
Ananya Nair
M.Com Accountancy, University of Kerala
Verified Expert
Picture-first. Imagine plotting one item, say sales, for ten
years with the first year fixed at 100. The shape of that line, its
slope and its turning points, is exactly what trend analysis reads.
Everything useful about trend percentages follows from that mental
graph.
The graph metaphor unpacks into four concrete benefits:
A long line shows the long-run direction that a single
year's figure cannot reveal.
The slope tells whether the item is rising, falling or flat.
A change in slope is an early signal of good or poor
management, well before absolute figures react sharply.
Because every point is scaled to the base 100, comparing ten
years is as easy as comparing two.
Fix the base year at 100. Choose a representative
year as the base; its trend percentage is always 100.
Scale every later year. Compute
that year's figurebase year figure× 100
for each subsequent year.
Read the slope. Rising, falling or flat tells the
story of the business over the long run.
Use it to forecast. A consistent slope supports a
reasonable projection of the next period, which is the
planning value of the tool.
Why this matters. A rising sales trend paired with a
faster-rising cost trend warns of shrinking margins long before
profit actually turns negative. That early-warning property, read
straight off the scaled line, is the interpretation value examiners
want you to state explicitly.
Common mistakes. Three predictable slips lose marks: (a) computing percentage change on the current-year base rather than the previous-year base in a comparative statement; (b) confusing common-size analysis (each item as a percent of a common base such as Revenue from Operations or Total Assets) with trend analysis (each item as a percent of a chosen base year); (c) discussing limitations in general terms without naming the specific limitation such as ignoring price-level changes or window dressing.
Trend percentages reveal long-run direction, give early
warnings of good or poor management, simplify multi-year comparison
and support forecasting.
Q 8.9
What is the importance of comparative statements? Illustrate your answer with particular reference to comparative income statement.
Concept used. A Comparative Statement shows each
item for two periods together with its absolute and percentage change.
A Comparative Income Statement (comparative Statement of
Profit and Loss) applies this to revenue, expenses and profit.
Shows change clearly. It shows not just the balances
of two years but the exact increase or decrease between them,
in both rupees and percentage.
Reveals direction and trend. It tells whether
revenue, expenses and profit are moving up or down and how
fast, indicating the direction of performance.
Helps in interpretation. By comparing the
percentage change in revenue with the percentage change in
expenses, one can judge whether profitability is improving.
Aids decision-making. Management, investors and
lenders use the visible changes to take operating, investment
and lending decisions.
Illustration (Comparative Income Statement).
1.35
tabularlrrrr
Particulars & Year 1 & Year 2 & Abs. change & % change
Here revenue rose 25% while expenses rose only 10%, so profit before
tax jumped 50%. The comparative income statement makes this
favourable structural change immediately visible: a result no single
year's statement could show.
Comparative statements show the absolute and percentage
change between two periods, reveal direction and trend, support
interpretation and decision-making; a comparative income statement
shows, for example, profit rising 50% because revenue grew faster
(25%) than expenses (10%).
ID
Ishaan Desai
M.Com Finance, Gujarat University
Verified Expert
Strategic angle. The word "illustrate" is the instruction
that matters. State the importance in crisp points, then immediately
prove each point with a tiny three-line income statement so
the examiner sees the concept applied, not merely defined.
The importance reduces to four points, each of which the
illustration must visibly demonstrate:
It shows the exact change between two years in rupees and
percentage.
It reveals the direction and trend of revenue, expenses and
profit.
It supports interpretation by letting you compare the %
change in revenue with the % change in expenses.
It aids decisions of management, investors and lenders.
State the importance. Visible change, direction and
trend, interpretation support, decision support.
Set up the illustration. Take revenue
16,00,000 → 20,00,000 and expenses
10,00,000 → 11,00,000 for two years.
Compute the changes. Revenue
4,00,00016,00,000× 100 = +25%;
expenses
1,00,00010,00,000× 100 = +10%;
profit before tax
3,00,0006,00,000× 100 = +50%.
Read the story. Revenue grew faster than expenses,
so profit jumped 50%, a structural improvement no single
year's statement could show.
Why this matters. A worded definition with no numbers caps
your marks on an "illustrate" question; the small worked example
that turns the definition into a visible 50% profit jump is exactly
what secures full credit.
Common mistakes. Three predictable slips lose marks: (a) computing percentage change on the current-year base rather than the previous-year base in a comparative statement; (b) confusing common-size analysis (each item as a percent of a common base such as Revenue from Operations or Total Assets) with trend analysis (each item as a percent of a chosen base year); (c) discussing limitations in general terms without naming the specific limitation such as ignoring price-level changes or window dressing.
Importance: visible change, trend, interpretation and
decision support, illustrated by profit before tax rising 50% when
revenue (+25%) outgrew expenses (+10%).
Q 8.10
What do you understand by analysis and interpretation of financial statements? Discuss its importance.
Concept used.Analysis and interpretation of
financial statements is the process of critically evaluating the
information in the financial statements to understand the firm and
make decisions about its operations. Analysis simplifies and
classifies the data; interpretation explains its meaning.
Meaning of analysis. It is the methodical
classification and simplification of the figures in the
financial statements so that relationships between them
become clear.
Meaning of interpretation. It is explaining the
meaning and significance of the simplified data: judging
profitability, solvency and operational efficiency, and the
firm's future prospects.
They are complementary. Analysis without
interpretation is useless; interpretation without analysis is
almost impossible. Together they form a judgemental process
that estimates past and present position and predicts the
future.
Importance.
Assesses current profitability and operational efficiency of
the firm and its departments, so the financial health can be
judged.
Ascertains the relative importance of the different
components of the financial position.
Identifies the reasons for changes in profitability or
financial position.
Judges the firm's ability to repay debt and assesses
short-term and long-term liquidity.
Serves owners, lenders, investors, trade payables, employees
and government in their respective decisions.
Analysis = simplifying and classifying statement data;
interpretation = explaining its significance. Together they assess
profitability, the structure of the financial position, reasons for
change, debt-paying ability and serve every user's decisions.
DB
Diya Banerjee
M.Com Accountancy, Jadavpur University
Verified Expert
Quick reading. This is a two-part question hiding in one
sentence: first define the analysis-interpretation pair, then
discuss its importance. The discussion half carries most of
the marks, so keep the definition tight and spend the rest on the
objectives.
The importance is best given as the four NCERT objectives plus the
user dimension:
Assess current profitability and operational efficiency to
judge financial health.
Ascertain the relative importance of the components of the
financial position.
Identify the reasons for changes in profitability or
position.
Judge debt-paying ability and short- and long-term
liquidity, serving owners, lenders, investors and others.
Define the pair. Analysis simplifies and classifies
the figures; interpretation explains their significance;
they are complementary.
List the four objectives.
profitability/efficiency, relative importance of components,
reasons for change, debt-paying ability.
Add the user dimension. Note that owners, lenders,
investors, trade payables and government each rely on this
analysis for their own decisions.
Conclude. The pair together forms the judgemental
process that reads the past and present and predicts the
future.
Why this matters. The verb "discuss" expects the objectives
spelled out, not just the meaning of the two words. Stopping at the
definition is the single most common reason marks are lost on this
question.
Common mistakes. Three predictable slips lose marks: (a) computing percentage change on the current-year base rather than the previous-year base in a comparative statement; (b) confusing common-size analysis (each item as a percent of a common base such as Revenue from Operations or Total Assets) with trend analysis (each item as a percent of a chosen base year); (c) discussing limitations in general terms without naming the specific limitation such as ignoring price-level changes or window dressing.
Definition of the complementary pair plus the four NCERT
objectives and the multi-user importance.
Q 8.11
Explain how common size statements are prepared giving an example.
Concept used. A Common Size Statement expresses
each item as a percentage of a common base. The base is revenue from
operations for the Statement of Profit and Loss, and total assets (or
total of equity and liabilities) for the Balance Sheet. The
conversion is
Component %
= Individual itemCommon base× 100 .
List absolute figures. Write the absolute rupee
figures of all items for the period(s) under study.
Choose the common base as 100. Revenue from
operations for the P&L; total assets or total equity and
liabilities for the Balance Sheet.
Work out each percentage. For every item, divide it
by the base and multiply by 100, and record the percentage
in a separate column.
Example (Common Size Statement of Profit and Loss).
Let revenue from operations be 10,00,000 and cost of
revenue from operations be 6,00,000.
Base = revenue from operations = 10,00,000 = 100%.
Cost of revenue from operations
= 6,00,00010,00,000× 100 = 60%.
Revenue from operations & 10,00,000 & 100
Less: Cost of revenue from operations & 6,00,000 & 60
Gross profit & 4,00,000 & 40
tabular
Steps: list absolute figures, fix the common base as 100,
express each item as a % of that base. Example: with revenue
10,00,000 (100%) and cost 6,00,000 (60%),
gross profit is 4,00,000 (40%).
YK
Yash Kapoor
M.Com Finance, University of Pune
Verified Expert
Strategic angle. A "how to prepare, with an example"
question is graded in two halves: the procedure and the worked
illustration. State the three preparation steps crisply, then build
a two or three line table so each step is visibly applied to real
numbers.
The procedure is exactly three steps, and the example must show all
three in action:
List the absolute figures for the period.
Fix the common base at 100 (revenue for the P&L; total
assets for the Balance Sheet).
Convert every item using
itembase× 100.
State the three steps. List absolute figures, set
the common base to 100, compute each item as
item/base× 100.
Choose the base. Take revenue from operations
= 10,00,000 as the base (= 100%).
Apply to cost.6,00,00010,00,000× 100 = 60%, so
cost of revenue is 60% of revenue.
Apply to gross profit.10,00,000 - 6,00,000 = 4,00,000, i.e.
4,00,00010,00,000× 100 = 40%, and
present the three lines as a small common size table.
Why this matters. The example is what separates a 4-mark
and a 6-mark answer here: a procedure stated without a worked table
is treated as incomplete, because the question explicitly asked for
an illustration.
Common mistakes. Three predictable slips lose marks: (a) computing percentage change on the current-year base rather than the previous-year base in a comparative statement; (b) confusing common-size analysis (each item as a percent of a common base such as Revenue from Operations or Total Assets) with trend analysis (each item as a percent of a chosen base year); (c) discussing limitations in general terms without naming the specific limitation such as ignoring price-level changes or window dressing.
Three steps plus a worked table: cost 60%, gross profit
40% on a revenue base of 100%.
Numerical Questions
Q 8.12
Following are the balance sheets of Alpha Ltd., as at March 31, 2016 and 2017. You are required to prepare a Comparative Balance Sheet. [3pt]
Equity & Liabilities: Share Capital 2,00,000 / 4,00,000; Reserve & Surplus 1,00,000 / 1,50,000; Long Term Borrowings 2,00,000 / 3,00,000; Short term borrowings 50,000 / 70,000; Trade Payables 30,000 / 60,000; Other Current Liabilities 20,000 / 10,000; Short Term Provisions 20,000 / 20,000; Total 6,20,000 / 10,20,000. Assets: Fixed Assets 2,00,000 / 5,00,000; Non-Current Investments 1,00,000 / 1,25,000; Current Investments 60,000 / 80,000; Inventories 1,35,000 / 1,55,000; Trade Receivables 60,000 / 90,000; Cash and Cash Equivalents 25,000 / 10,000; Short term Loans & Advances 40,000 / 60,000; Total 6,20,000 / 10,20,000.
Concept used. A Comparative Balance Sheet shows
each item for both years with the absolute change and the percentage
change. For every line:
Absolute change = Figure2017 - Figure2016,
% change
= Absolute changeFigure2016× 100 .
A bracket or minus sign denotes a decrease.
Sign rule
Increase ⇒ positive. Decrease ⇒ shown with a
minus sign or in brackets. The base of the percentage is always the
earlier year (2016).
Note for editor: The 2017 Equity & Liabilities column of the
NCERT question adds to 10,10,000, while the textbook
prints the total as 10,20,000 (a known textbook
misprint, consistent across Shaalaa, learncbse and BYJU'S). The
NCERT-printed total of 10,20,000 has been retained, as
the asset side independently totals 10,20,000.
Comparative Balance Sheet prepared. Total of equity and
liabilities (and of assets) rises from 6,20,000 to
10,20,000, an increase of 4,00,000
(+64.52%). Fixed assets show the steepest rise (+150%); cash
falls 60%.
PS
Pranav Singh
M.Com Accountancy, University of Delhi
Verified Expert
Strategic angle. Instead of treating fifteen lines as
fifteen unrelated sums, group them into four economic blocks:
owners' funds, borrowed funds, fixed-side assets and working-capital
assets. Apply the same two formulas to every line, and read each
block as a story. The two formulas are, for every line,
Abs.=Figure2017-Figure2016 and
%=Abs.Figure2016× 100.
Owners' funds block. Share capital:
4,00,000 - 2,00,000 = +2,00,000, so
2,00,0002,00,000× 100 = +100%.
Reserve & surplus:
1,50,000 - 1,00,000 = +50,000, so
50,0001,00,000× 100 = +50%.
Total owners' funds rose from 3,00,000 to
5,50,000: the owners injected fresh money.
Borrowed funds block. Long-term borrowings
3,00,000 - 2,00,000 = +1,00,000 (+50%);
short-term borrowings 70,000 - 50,000 = +20,000
(+40%); trade payables
60,000 - 30,000 = +30,000 (+100%); other current
liabilities 10,000 - 20,000 = -10,000 (-50%);
provisions unchanged (0%). Borrowing rose but less than
owners' funds.
Fixed-side assets block. Fixed assets
5,00,000 - 2,00,000 = +3,00,000
(3,00,0002,00,000× 100 = +150%);
non-current investments
1,25,000 - 1,00,000 = +25,000 (+25%). Most of
the new money went into fixed assets.
Working-capital assets block. Current investments
+20,000 (+33.33%); inventories +20,000
(20,0001,35,000× 100 = +14.81%);
trade receivables +30,000 (+50%); cash
10,000 - 25,000 = -15,000 (-60%); short-term
loans & advances +20,000 (+50%). Cash is the only
line that fell sharply.
Reconcile the totals. Add the figures: the
NCERT-printed totals are 6,20,000 and 10,20,000,
giving +4,00,000 and
4,00,0006,20,000× 100 = +64.52% on
each side, so the statement balances. (The 2017 liability
column's arithmetic slip to 10,10,000 is the known
textbook misprint noted above.)
Why this matters. The structure tells the real story: a
+150% jump in fixed assets was financed mainly by fresh owners'
funds and long-term debt, not by squeezing cash or short-term
sources. That is a healthy, well-funded expansion, the one-line
interpretation an examiner rewards.
Common mistakes. Three predictable slips lose marks: (a) computing percentage change on the current-year base rather than the previous-year base in a comparative statement; (b) confusing common-size analysis (each item as a percent of a common base such as Revenue from Operations or Total Assets) with trend analysis (each item as a percent of a chosen base year); (c) discussing limitations in general terms without naming the specific limitation such as ignoring price-level changes or window dressing.
Same Comparative Balance Sheet; both totals
6,20,000 → 10,20,000, +64.52%, expansion led by fixed
assets (+150%) funded by capital (+100%) and long-term debt
(+50%); cash the only sharp fall (-60%).
Q 8.13
Following are the Balance Sheets of Beta Ltd., as at March 31, 2016 and 2017. Prepare comparative Balance Sheet. [3pt]
Equity & Liabilities: Share Capital 4,00,000 / 3,00,000; Reserves and surplus 1,50,000 / 1,00,000; Long term borrowings (IDBI) 3,00,000 / 1,00,000; Short term borrowings 70,000 / 50,000; Trade payables 60,000 / 30,000; Other current liabilities 1,10,000 / 1,00,000; Short term provisions 10,000 / 20,000; Total 11,00,000 / 7,00,000. Assets: Fixed Assets 4,00,000 / 2,20,000; Non-current Investments 2,25,000 / 1,00,000; Current Investments 80,000 / 60,000; Inventories 1,05,000 / 90,000; Trade Receivables 90,000 / 60,000; Cash and Cash Equivalents 1,00,000 / 85,000; Short term loans & Advances 1,00,000 / 85,000; Total 11,00,000 / 7,00,000.
Concept used. Same as the previous question. For every line,
absolute change = Figure2017 - Figure2016 and
% change = Absolute changeFigure2016× 100.
Here almost every figure falls, so most signs are negative.
Note for editor: The NCERT prints the 2016 total of equity
and liabilities as 1,10,000; this is a typographical
slip for 11,00,000 (the asset side and the 2017 column
both confirm 11,00,000). The corrected
11,00,000 has been used so both sides reconcile.
Comparative Balance Sheet prepared. Almost every item
contracted: the total fell from 11,00,000 to
7,00,000, a decrease of 4,00,000
(-36.36%). Only short-term provisions rose (+100%).
MC
Meera Chatterjee
M.Com Finance, University of Calcutta
Verified Expert
Structural observation. This is the mirror image of Alpha
Ltd: nearly every line shrinks, so the discipline is to carry the
minus sign consistently and always divide by the larger 2016 base.
Read it block by block, computing each figure in full so no sign
slips.
Owners' funds block. Share capital:
3,00,000 - 4,00,000 = -1,00,000, so
-1,00,0004,00,000× 100 = -25%.
Reserves and surplus:
1,00,000 - 1,50,000 = -50,000, so
-50,0001,50,000× 100 = -33.33%.
Owners' funds fell from 5,50,000 to 4,00,000.
The lone increase. Short-term provisions
20,000 - 10,000 = +10,000, so
10,00010,000× 100 = +100%: the only
line that grew.
Fixed-side assets block. Fixed assets
2,20,000 - 4,00,000 = -1,80,000 (-45%);
non-current investments
1,00,000 - 2,25,000 = -1,25,000
(-1,25,0002,25,000× 100 = -55.56%):
the deepest cuts, meaning assets were sold off.
Working-capital assets block. Current investments
-20,000 (-25%); inventories -15,000
(-14.29%); trade receivables -30,000 (-33.33%);
cash -15,000 (-15%); short-term loans & advances
-15,000 (-15%). Every working-capital line also
shrank.
Reconcile the totals. Both sides move
11,00,000 → 7,00,000, so absolute change
= -4,00,000 and
-4,00,00011,00,000× 100 = -36.36%.
The corrected 2016 figure of 11,00,000 (not the
misprinted 1,10,000) makes both sides tie.
Why this matters. A balance sheet that contracts on every
front, with long-term borrowings down two-thirds and fixed assets
down nearly half, points to a firm winding down or sharply
downsizing operations. Stating that single interpretation, backed by
the -66.67% debt figure, is what secures the analysis mark.
Common mistakes. Three predictable slips lose marks: (a) computing percentage change on the current-year base rather than the previous-year base in a comparative statement; (b) confusing common-size analysis (each item as a percent of a common base such as Revenue from Operations or Total Assets) with trend analysis (each item as a percent of a chosen base year); (c) discussing limitations in general terms without naming the specific limitation such as ignoring price-level changes or window dressing.
Same Comparative Balance Sheet; total contracts
11,00,000 → 7,00,000 (-36.36%); owners' funds, debt
and all assets fall, only short-term provisions rise (+100%).
Q 8.14
Prepare Comparative Statement of profit and loss from the following information. [3pt]
2015-16 / 2016-17: Freight Outward 20,000 / 10,000; Wages (office) 10,000 / 5,000; Manufacturing Expenses 50,000 / 20,000; Stock adjustment (60,000) / 30,000; Cash purchases 80,000 / 60,000; Credit purchases 60,000 / 20,000; Return inward 8,000 / 4,000; Gross profit (30,000) / 90,000; Carriage outward 20,000 / 10,000; Machinery 3,00,000 / 2,00,000; 10% depreciation on machinery 10,000 / 5,000; Interest on short-term loans 20,000 / 20,000; 10% debentures 20,000 / 10,000; Profit on sale of furniture 20,000 / 10,000; Loss on sale of office car 90,000 / 60,000; Tax rate 40% / 50%.
Concept used. A Comparative Statement of Profit and
Loss (in the NCERT/Schedule III format) lists every item under
Revenue, Expenses, Profit before tax and Profit after tax with an
absolute change and a percentage change column. The data are scattered,
so we must first derive Revenue from Operations and classify every item.
The two key relations are:
Revenue from Operations (Net Sales)= Purchases + Manufacturing Expenses + Change in
Inventory + Gross Profit - Sales Return.
Profit before tax= Total Revenue - Total
Expenses (Total Revenue = Revenue from Operations + Other
Income).
Machinery is a balance sheet item (not a P&L line); the depreciation
figure is given directly ( 10,000/ 5,000), so we
use it as printed. Freight outward, carriage outward and loss on sale
of office car are grouped under Other Expenses.
Change in Inventories. The "stock adjustment" line
is the closing-less-opening change (a positive figure reduces
cost, a negative figure raises it). 2015-16: (60,000);
2016-17: 30,000. Change = +90,000 (base is negative,
so the percentage is n/a).
Profit before Tax= Total Revenue - Total
Expenses.
2015-16: 1,12,000 - 2,52,000 = -1,40,000 (loss).
2016-17: 2,26,000 - 2,21,000 = +5,000.
Change = +1,45,000 (turnaround from loss to profit).
Tax. 2015-16 PBT is a loss, so tax is nil.
2016-17: 50% × 5,000 = 2,500.
Change = +2,500.
1. Revenue from Operations & 92,000 & 2,16,000 & +1,24,000 & +134.78
2. Other Income & 20,000 & 10,000 & -10,000 & -50.00 3. Total Revenue (1+2) & 1,12,000 & 2,26,000 & +1,14,000 & +101.79
5l4. Expenses
a. Purchases of Stock-in-Trade & 1,40,000 & 80,000 & -60,000 & -42.86
b. Change in Inventories & (60,000) & 30,000 & +90,000 & n/a
c. Employee Benefit Expenses & 10,000 & 5,000 & -5,000 & -50.00
d. Finance Costs & 22,000 & 21,000 & -1,000 & -4.55
e. Depreciation & Amort. & 10,000 & 5,000 & -5,000 & -50.00
f. Other Expenses & 1,30,000 & 80,000 & -50,000 & -38.46 Total Expenses & 2,52,000 & 2,21,000 & -31,000 & -12.30 5. Profit before Tax (3-4) & (1,40,000) & 5,000 & +1,45,000 & n/a
Less: Income Tax & nil & 2,500 & +2,500 & n/a 6. Profit after Tax & (1,40,000) & 2,500 & +1,42,500 & n/a
tabular
Comparative Statement of Profit and Loss prepared. Revenue
from operations rose 92,000 → 2,16,000
(+134.78%). The firm turned around from a loss after tax of
(1,40,000) in 2015-16 to a profit of 2,500 in
2016-17, an improvement of 1,42,500.
SR
Siddharth Rao
M.Com Accountancy, University of Hyderabad
Verified Expert
Strategic angle. The figures are scattered on purpose to
test classification. The safe method is to first derive Revenue from
Operations using the trading-account identity, then build the
Statement of Profit and Loss in the Schedule III ladder
(Revenue → Other income → Total revenue → Expenses by
nature → PBT → Tax → PAT), computing each figure fully
before attaching the change columns.
Classify the stray items. Wages (office) →
Employee Benefit Expenses (10,000 / 5,000). Freight
Outward + Carriage Outward + Loss on sale of office car
→ Other Expenses (1,30,000 / 80,000). Profit on
sale of furniture → Other Income (20,000 / 10,000).
Interest on short-term loans + 10% debenture interest
(2,000 / 1,000) → Finance Costs (22,000 /
21,000). Depreciation given directly (10,000 / 5,000);
Machinery is a balance-sheet item, not a P&L line.
Total Revenue and Total Expenses.
Total revenue: 1,12,000 / 2,26,000. Total expenses
= Purchases + Stock-adj inventory change + Wages +
Finance + Dep + Other.
2015-16: 1,40,000 + (-60,000) + 10,000 + 22,000 +
10,000 + 1,30,000 = 2,52,000.
2016-17: 80,000 + 30,000 + 5,000 + 21,000 + 5,000
+ 80,000 = 2,21,000.
Stack to PAT. PBT = Total Revenue - Total
Expenses.
2015-16: 1,12,000 - 2,52,000 = -1,40,000 (loss,
so tax nil; PAT = -1,40,000).
2016-17: 2,26,000 - 2,21,000 = +5,000; tax =
50% × 5,000 = 2,500; PAT = 5,000 - 2,500 =
2,500. Change in PAT = +1,42,500 (turnaround from
loss to profit).
Change column rule. Use absolute change everywhere;
mark PBT, PAT and the Change-in-Inventories lines "n/a" for
percentage because their 2015-16 base is negative or signed
(a percentage on a negative or zero base is undefined).
Cross-check the turnaround. Revenue more than
doubled (92,000 → 2,16,000, +134.78%); other
expenses fell sharply ( 1,30,000→80,000, -38.46%); together they flipped the
bottom line from a 1,40,000 loss to a small
profit of 2,500, an exact 1,42,500
swing, confirming the statement is internally consistent.
Why this matters. The two single most common errors are
(i) putting the loss on sale of the office car above gross profit
when it is a non-operating "Other Expense", and (ii) forgetting to
subtract Returns Inward ( 8,000 / 4,000) when deriving
Net Sales. Either slip collapses every downstream figure, so the
classification step is where the marks are won or lost.
Common mistakes. Three predictable slips lose marks: (a) computing percentage change on the current-year base rather than the previous-year base in a comparative statement; (b) confusing common-size analysis (each item as a percent of a common base such as Revenue from Operations or Total Assets) with trend analysis (each item as a percent of a chosen base year); (c) discussing limitations in general terms without naming the specific limitation such as ignoring price-level changes or window dressing.
Same comparative statement: Revenue from Operations
92,000 → 2,16,000 (+134.78%); PAT swings
from (1,40,000) to 2,500, a
1,42,500 improvement; tax 2,500 only in
2016-17.
Q 8.15
Prepare Comparative Statement of Profit and Loss from the following information: [3pt]
2015-16 / 2016-17: Manufacturing expenses 35,000 / 80,000; Opening stock 30,000 / (60% of closing stock); Sales 9,60,000 / 4,50,000; Returns outward 4,000 (out of credit purchase) / 6,000 (out of cash purchase); Closing stock 150% of opening / 1,00,000; Credit purchases 1,50,000 / 150% of cash purchase; Cash purchases 80% of credit purchases / 40,000; Carriage outward 10,000 / 30,000; Depreciation on building 20% / 10% (building 1,00,000 / 2,00,000); Interest on bank overdraft 5,000 / nil; 10% debentures 2,00,000 / 20,00,000; Profit on sale of copyright 10,000 / 20,000; Loss on sale of personal car 10,000 / 20,000; Other operating expenses 20,000 / 10,000; Tax rate 50% / 40%.
Concept used. As in Q14, first resolve every relational
clue into a number, build the Statement of Profit and Loss, then add
the change columns. Key relations:
Net purchases= (cash + credit purchases) -
returns outward.
Cost of revenue from operations= opening stock
+ net purchases + manufacturing expenses - closing
stock.
Loss on sale of a personal car is a personal (not
business) item and is excluded from the company's
Statement of Profit and Loss.
Indirect / operating expenses= carriage outward + depreciation on building + other
operating expenses.
Depreciation: 2015-16 = 20% of 1,00,000 = 20,000;
2016-17 = 10% of 2,00,000 = 20,000.
Total: 2015-16 = 10,000 + 20,000 + 20,000 = 50,000;
2016-17 = 30,000 + 20,000 + 10,000 = 60,000.
Add other income, less finance cost.
Other income = profit on sale of copyright
(10,000 / 20,000). Finance cost = interest on bank
overdraft (5,000 / 0) + interest on 10% debentures
(10% of 2,00,000 / 20,00,000 = 20,000 /
2,00,000). Loss on sale of personal car is
excluded.
Comparative Statement of Profit and Loss prepared. Sales
fell 9,60,000 → 4,50,000 (-53.13%)
and profit after tax fell 3,04,500 →
45,600 (-85.02%), worsened by a sharp rise in finance
cost on the enlarged 10% debentures.
TP
Tara Pillai
M.Com Finance, University of Kerala
Verified Expert
Strategic angle. Every "X% of Y" clue must be converted
into a rupee figure before any statement can be built. Resolve the
stock and purchase relations first, then feed them into the standard
ladder, computing each line in full.
Open the stock relations.
2015-16 closing stock = 150% of opening
= 1.5 × 30,000 = 45,000.
2016-17 opening stock = 60% of closing
= 0.6 × 1,00,000 = 60,000 (closing given as
1,00,000).
Open the purchase relations.
2015-16: credit = 1,50,000, cash = 80% of credit
= 0.8 × 1,50,000 = 1,20,000.
2016-17: cash = 40,000, credit = 150% of cash
= 1.5 × 40,000 = 60,000.
Drop the personal car loss. Loss on sale of a
personal car is not a business expense (business
entity concept); exclude it entirely before computing PBT.
Stack to PAT. Indirect expenses
50,000 / 60,000; other income 10,000 / 20,000;
finance cost 25,000 / 2,00,000 (bank overdraft
interest plus 10% debenture interest, which is
20,000 / 2,00,000). PBT
= 6,09,000 / 76,000; tax at 50% / 40%= 3,04,500 / 30,400; PAT
= 3,04,500 / 45,600. Change in PAT
= -2,58,900,
-2,58,9003,04,500× 100 = -85.02%.
Cross-check the collapse. Confirm the figures
cohere: sales fell roughly 53%, which alone would cut
profit, but profit fell far more steeply (85%). The extra
damage is the finance cost rising from 25,000 to
2,00,000, an 1,75,000 jump that
almost exactly equals the missing profit. This sanity check
confirms the debenture expansion, not just lower sales,
drove the result.
Why this matters. The 10% debentures balloon from
2,00,000 to 20,00,000, so debenture
interest jumps from 20,000 to 2,00,000.
That single finance-cost surge is why profit collapsed even though
the firm stayed profitable: stating this is the interpretation mark.
Common mistakes. Three predictable slips lose marks: (a) computing percentage change on the current-year base rather than the previous-year base in a comparative statement; (b) confusing common-size analysis (each item as a percent of a common base such as Revenue from Operations or Total Assets) with trend analysis (each item as a percent of a chosen base year); (c) discussing limitations in general terms without naming the specific limitation such as ignoring price-level changes or window dressing.
Same statement: sales -53.13%; PAT
3,04,500 → 45,600 (-85.02%), driven by
a tenfold rise in debenture interest; personal car loss excluded.
Q 8.16
Prepare a Common size statement of profit and loss of Shefali Ltd. with the help of following information: [3pt]
2015-16 / 2016-17: Revenue from operations 6,00,000 / 8,00,000; Cost of revenue from operations 4,28,000 / 7,28,000; Indirect expense 25% of gross profit / 25% of gross profit; Other incomes 10,000 / 12,000; Income tax 30% / 30%.
Concept used. In a Common Size Statement of Profit
and Loss, revenue from operations is the common base, taken as
100%, and every other item is shown as
% of revenue
= ItemRevenue from operations× 100 .
Convert each to % of revenue (base
6,00,000 and 8,00,000). For example, cost of
revenue 2015-16:
4,28,0006,00,000× 100 = 71.33%;
2016-17:
7,28,0008,00,000× 100 = 91.00%.
Common Size Statement of Profit and Loss prepared. Profit
after tax fell from 16.22% of revenue (2015-16) to 5.78%
(2016-17), mainly because cost of revenue rose from 71.33% to
91.00% of revenue.
AB
Aditya Bhat
M.Com Accountancy, University of Mumbai
Verified Expert
Picture-first. Treat each year's revenue as a fixed bar of
length 100. The whole question is: how much of that bar does cost
eat, and how much survives as profit? Build every figure first, then
scale.
Tax and PAT. Tax = 30% of PBT
= 41,700 / 19,800; PAT
= 1,39,000 - 41,700 = 97,300 and
66,000 - 19,800 = 46,200.
Scale every line to revenue. Divide each figure by
its year's revenue and multiply by 100. Cost of revenue:
4,28,0006,00,000× 100 = 71.33% and
7,28,0008,00,000× 100 = 91.00%.
PAT: 97,3006,00,000× 100 = 16.22% and
46,2008,00,000× 100 = 5.78%.
Why this matters. Revenue grew in rupees, yet the
cost-to-revenue ratio leapt from 71.33% to 91%, crushing the
profit margin from 16.22% to 5.78%. Common size analysis
exposes this structural slide where a comparative statement might
hide it behind a rising rupee revenue; stating that contrast is the
interpretation mark.
Common mistakes. Three predictable slips lose marks: (a) computing percentage change on the current-year base rather than the previous-year base in a comparative statement; (b) confusing common-size analysis (each item as a percent of a common base such as Revenue from Operations or Total Assets) with trend analysis (each item as a percent of a chosen base year); (c) discussing limitations in general terms without naming the specific limitation such as ignoring price-level changes or window dressing.
Same common size statement: PAT margin slides
16.22% → 5.78% because cost-to-revenue climbs
71.33% → 91%.
Q 8.17
Prepare a Common Size balance sheet from the following balance sheet of Aditya Ltd., and Anjali Ltd.: [3pt]
Aditya Ltd. / Anjali Ltd.: Equity share capital 6,00,000 / 8,00,000; Reserves and surplus 3,00,000 / 2,50,000; Current liabilities 1,00,000 / 1,50,000; Total 10,00,000 / 12,00,000. Fixed assets 4,00,000 / 7,00,000; Current assets 6,00,000 / 5,00,000; Total 10,00,000 / 12,00,000.
Concept used. In a Common Size Balance Sheet, the
total of the balance sheet (total of equity and liabilities, equal to
total assets) is the common base, taken as 100%, and every item is
shown as
% of total
= ItemBalance sheet total× 100 .
Here it is an inter-firm comparison, so Aditya Ltd is scaled
on its own total ( 10,00,000) and Anjali Ltd on its own
total ( 12,00,000).
Common Size Balance Sheet prepared. Aditya Ltd is
current-asset heavy (60% of total) while Anjali Ltd is fixed-asset
heavy (58.33%); Anjali relies more on share capital (66.67% vs
60%).
SK
Sanya Kapoor
M.Com Finance, University of Pune
Verified Expert
Structural observation. Two firms of unequal size can be
compared only after both are scaled to a common 100. The base for
each firm is its own balance-sheet total, so divide every line by
that firm's total and the two structures line up directly.
Fix the bases. Aditya's total
= 10,00,000; Anjali's total = 12,00,000. Each
firm is scaled against its own total, never the
other's.
Liabilities side. Equity share capital:
6,00,00010,00,000× 100 = 60% vs
8,00,00012,00,000× 100 = 66.67%.
Reserves: 3,00,00010,00,000× 100 = 30%
vs 2,50,00012,00,000× 100 = 20.83%.
Current liabilities:
1,00,00010,00,000× 100 = 10% vs
1,50,00012,00,000× 100 = 12.50%.
Assets side. Fixed assets:
4,00,00010,00,000× 100 = 40% vs
7,00,00012,00,000× 100 = 58.33%.
Current assets:
6,00,00010,00,000× 100 = 60% vs
5,00,00012,00,000× 100 = 41.67%.
Confirm each column sums to 100%. Aditya
liabilities 60 + 30 + 10 = 100; Anjali assets
58.33 + 41.67 = 100, so the scaling is internally
consistent.
Why this matters. Once scaled, the contrast is sharp:
Aditya is liquidity-rich (current assets 60% of its total) while
Anjali is capacity-rich (fixed assets 58.33%) and leans more on
equity (66.67% vs 60%). Drawing that structural comparison is
exactly what common size analysis is built to deliver, and is the
interpretation an examiner rewards.
Common mistakes. Three predictable slips lose marks: (a) computing percentage change on the current-year base rather than the previous-year base in a comparative statement; (b) confusing common-size analysis (each item as a percent of a common base such as Revenue from Operations or Total Assets) with trend analysis (each item as a percent of a chosen base year); (c) discussing limitations in general terms without naming the specific limitation such as ignoring price-level changes or window dressing.
Same common size balance sheet: Aditya is current-asset
heavy (60%), Anjali is fixed-asset heavy (58.33%) and more
equity-financed (66.67%); bases 10,00,000 and
12,00,000.
More Analysis of Financial Statements Accountancy Class 12 Resources
Analysis of Financial Statements Class 12 Accountancy NCERT Solutions FAQs
Ques. Where can I download Analysis of Financial Statements Class 12 Accountancy NCERT Solutions PDF?
Ans. You can download the Analysis of Financial Statements Class 12 Accountancy NCERT Solutions PDF directly from this page. Both the Normal and HD versions are available, and both are free.
Ques. Are these Class 12 Accountancy Part 2 Chapter 4 NCERT Solutions aligned with the 2026-27 syllabus?
Ans. Yes. The solutions reflect the current 2026-27 NCERT edition. Part 2 Chapter 4 was kept intact, so all questions on Comparative Statements, Common Size Statements, and tools of analysis are in scope.
Ques. How many pages is the Class 12th Accountancy Analysis of Financial Statements NCERT Solutions PDF?
Ans. The solutions PDF runs approximately 25 to 30 pages and covers every Short Answer, Long Answer, and numerical question, including full Comparative and Common Size Statements.
Ques. What is the difference between a Comparative Statement and a Common Size Statement?
Ans. A Comparative Statement is horizontal analysis: it shows the change in each item over two years in absolute and percentage terms. A Common Size Statement is vertical analysis: it expresses each item as a percentage of a common base for a single year.
Ques. How many marks does Analysis of Financial Statements carry in the CBSE Class 12 Accountancy paper?
Ans. The chapter typically carries 4 to 6 marks, usually one 6-mark Comparative or Common Size Statement question plus a 1-mark objective question. It is part of the Financial Statements Analysis unit in Part B.
Ques. What are the tools of analysis of financial statements?
Ans. The four tools are Comparative Statements, Common Size Statements, Ratio Analysis, and Cash Flow Statement. CBSE often asks you to list or briefly explain any two of these.
Ques. Is Part 2 Chapter 4 Analysis of Financial Statements important for CUET Accountancy?
Ans. Yes. The CUET Accountancy domain paper usually sets 3 to 5 questions from this chapter, mostly on the tools of analysis, the objectives and limitations, and the format of Comparative and Common Size Statements.





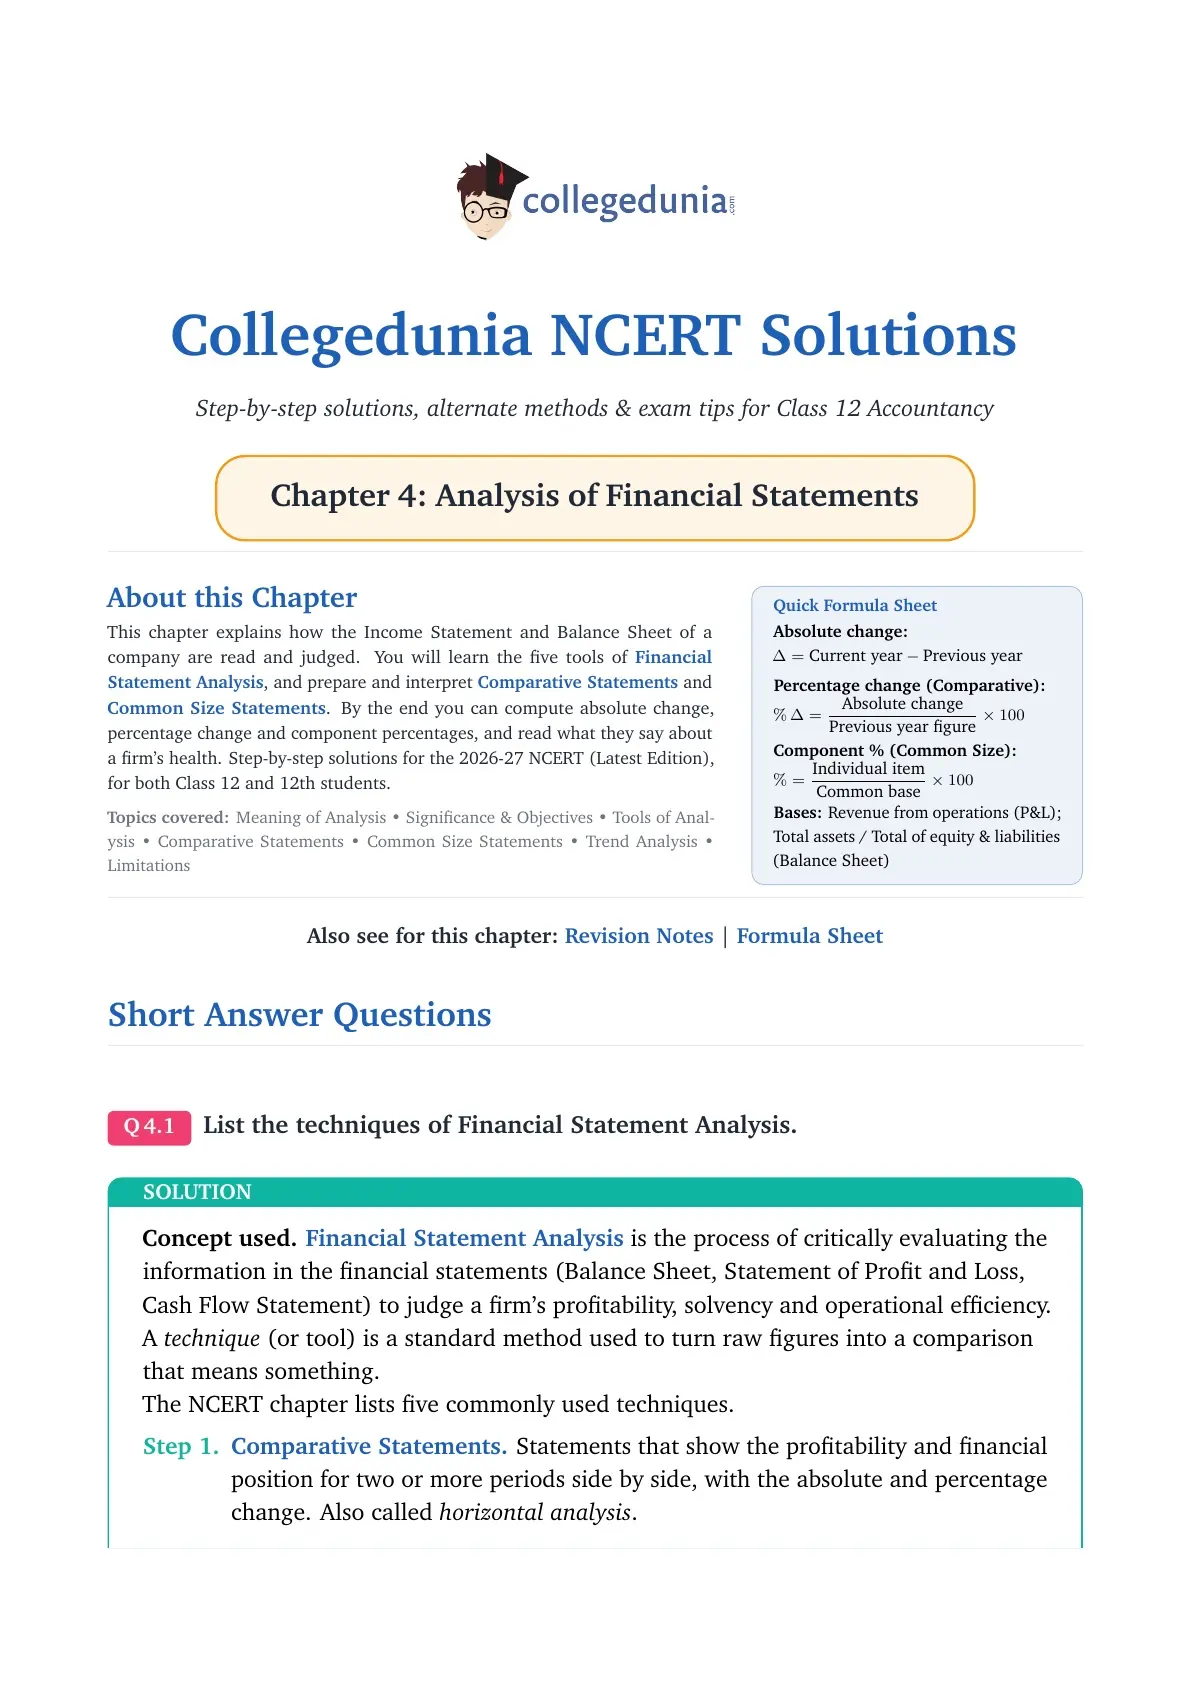
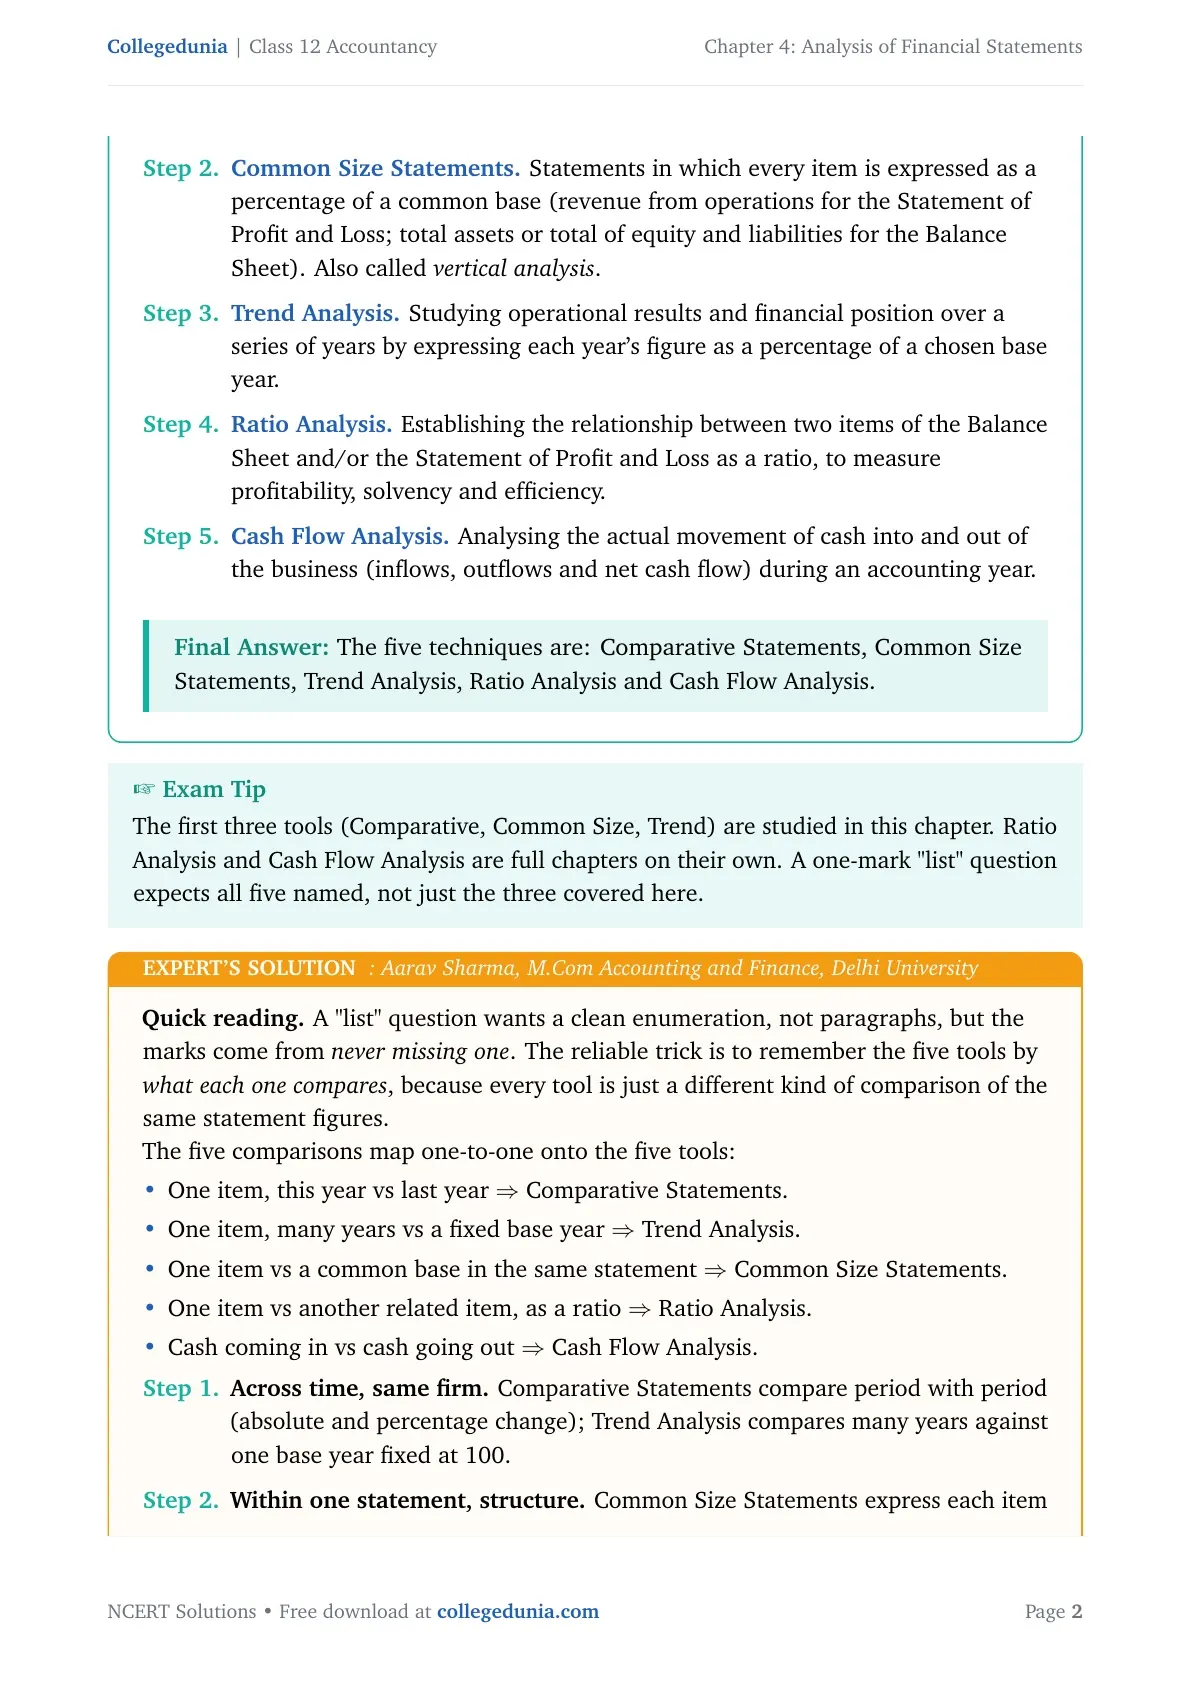
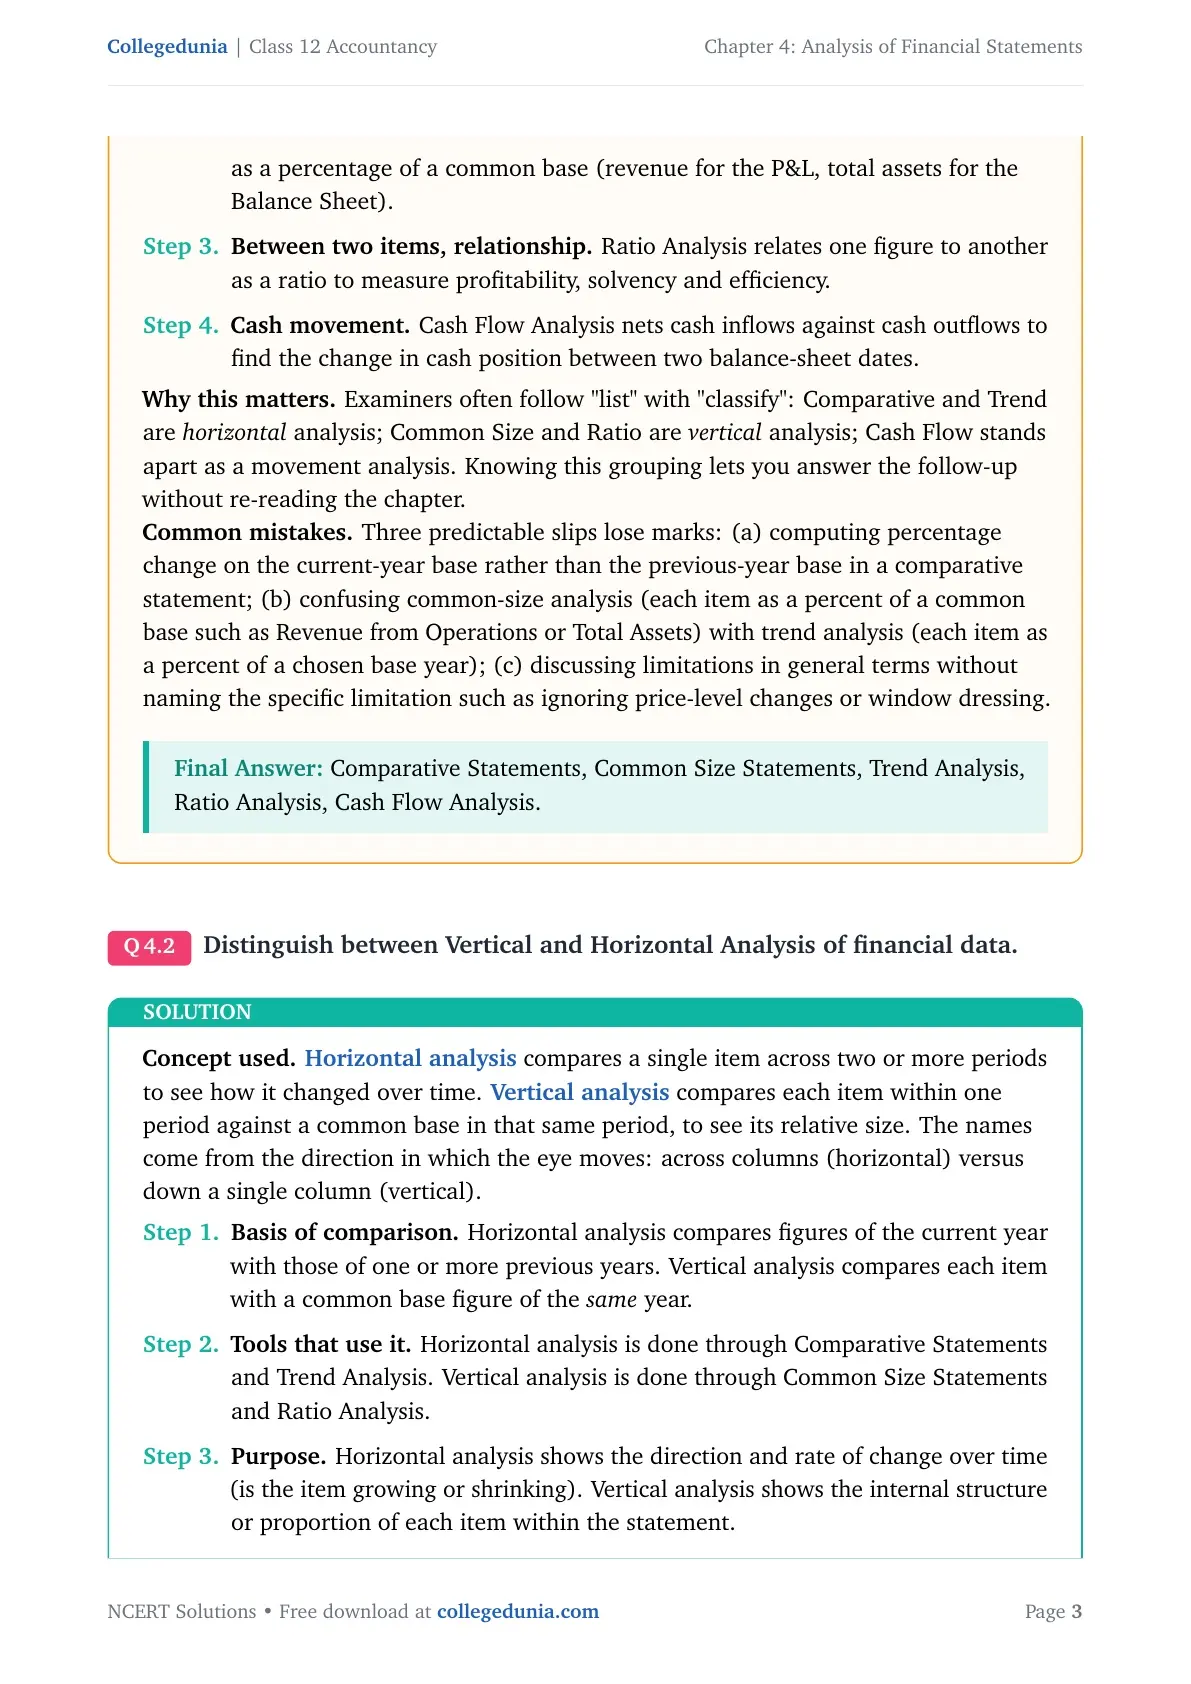
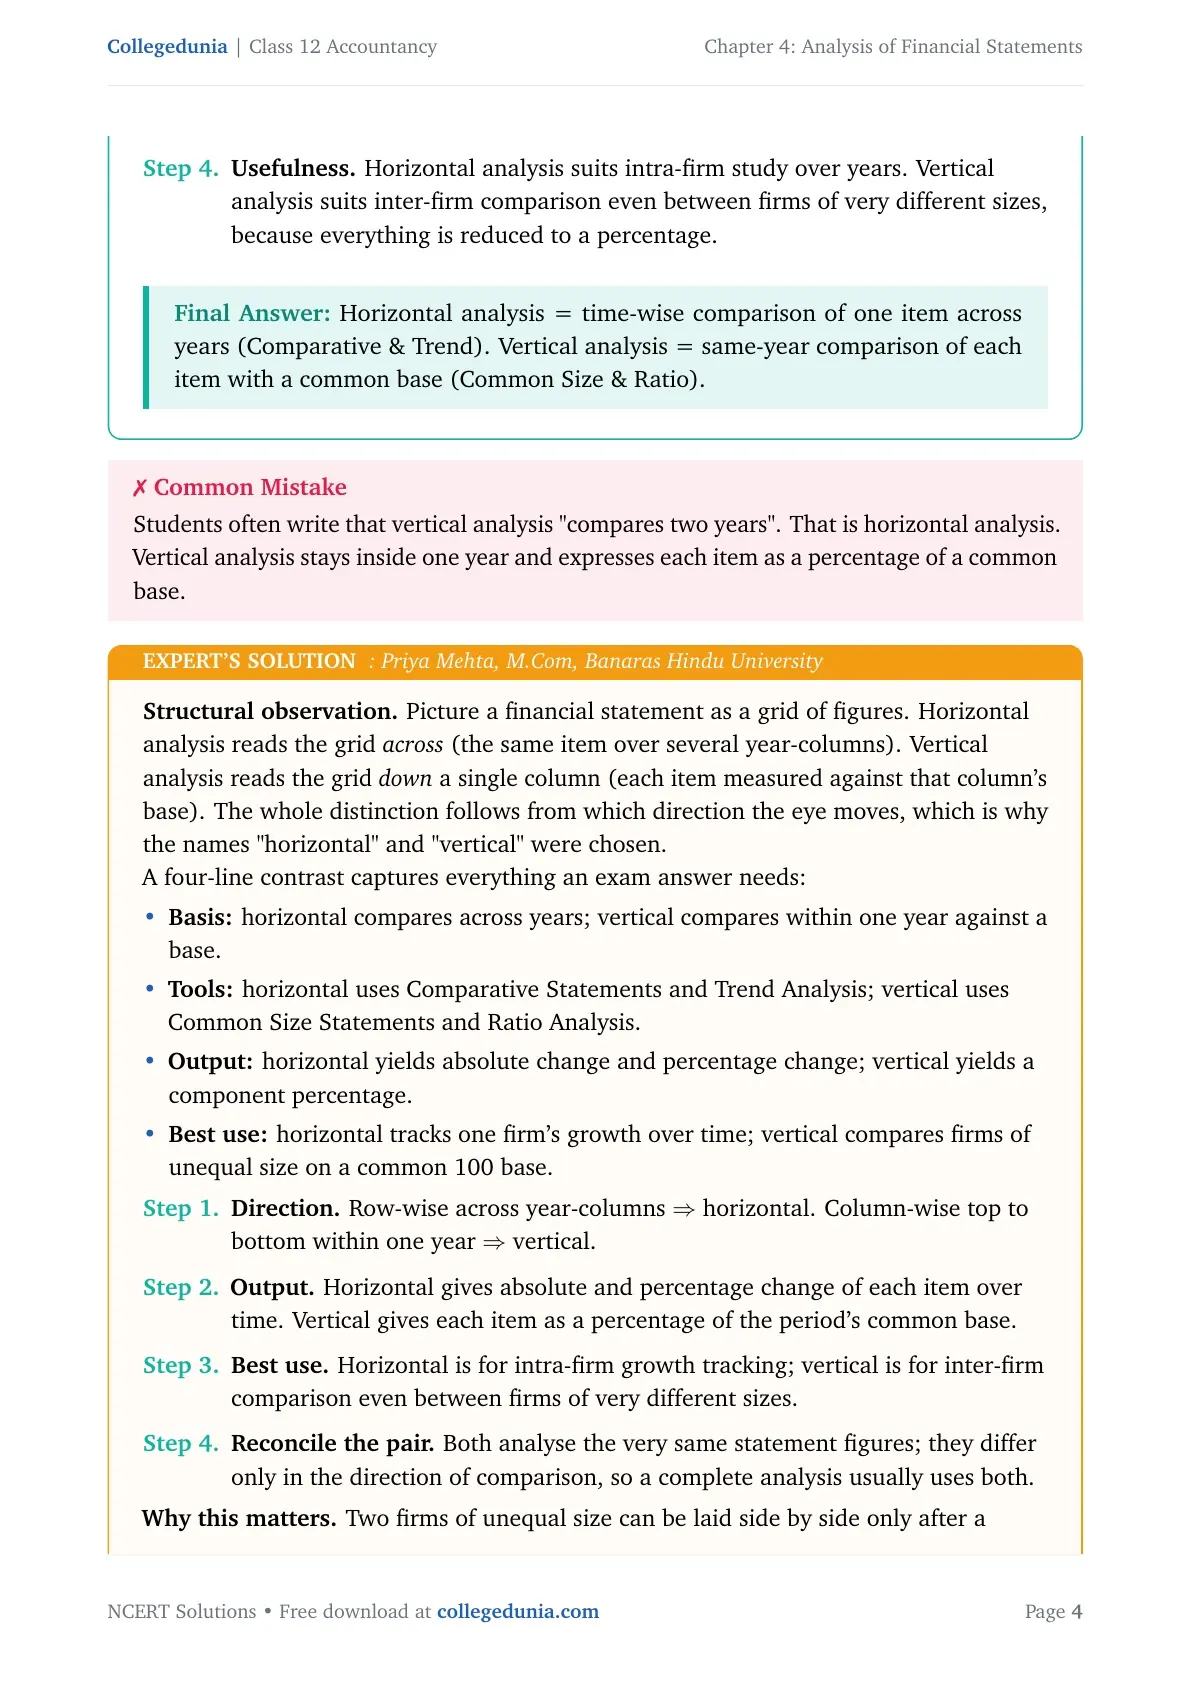
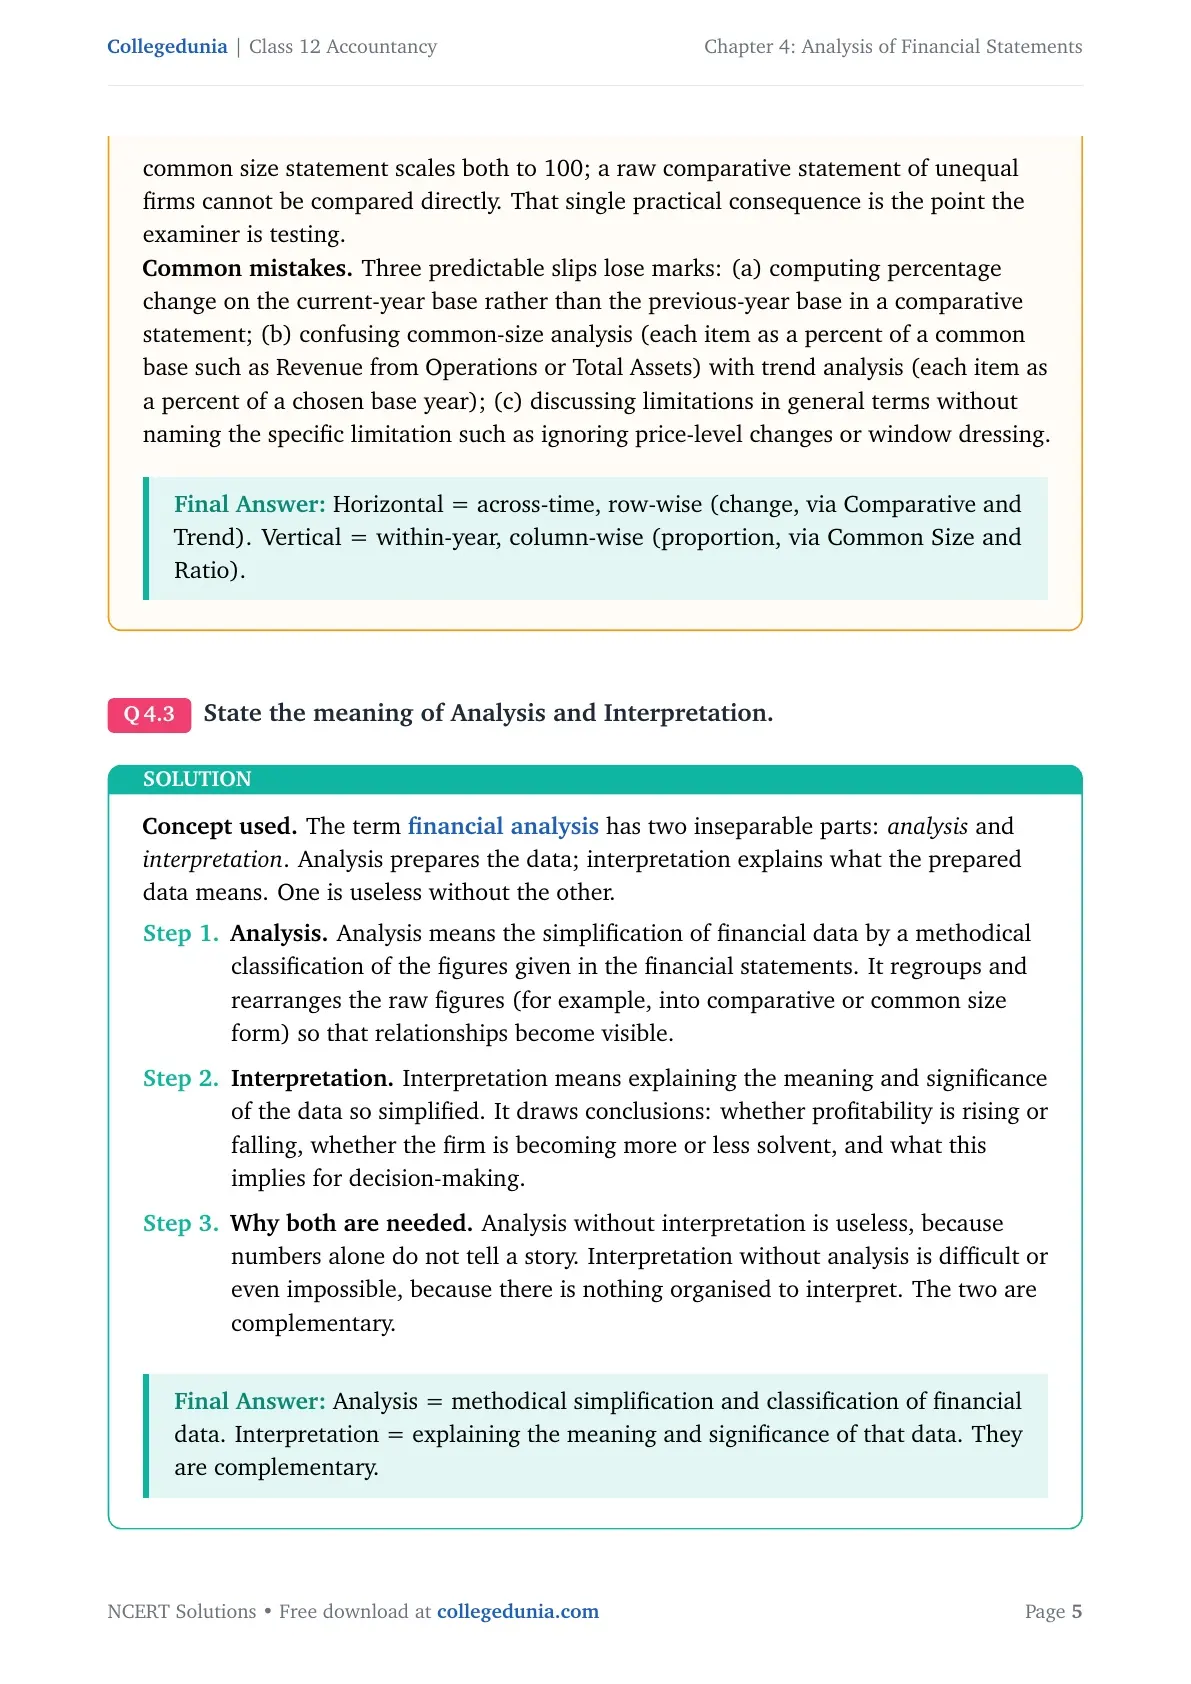
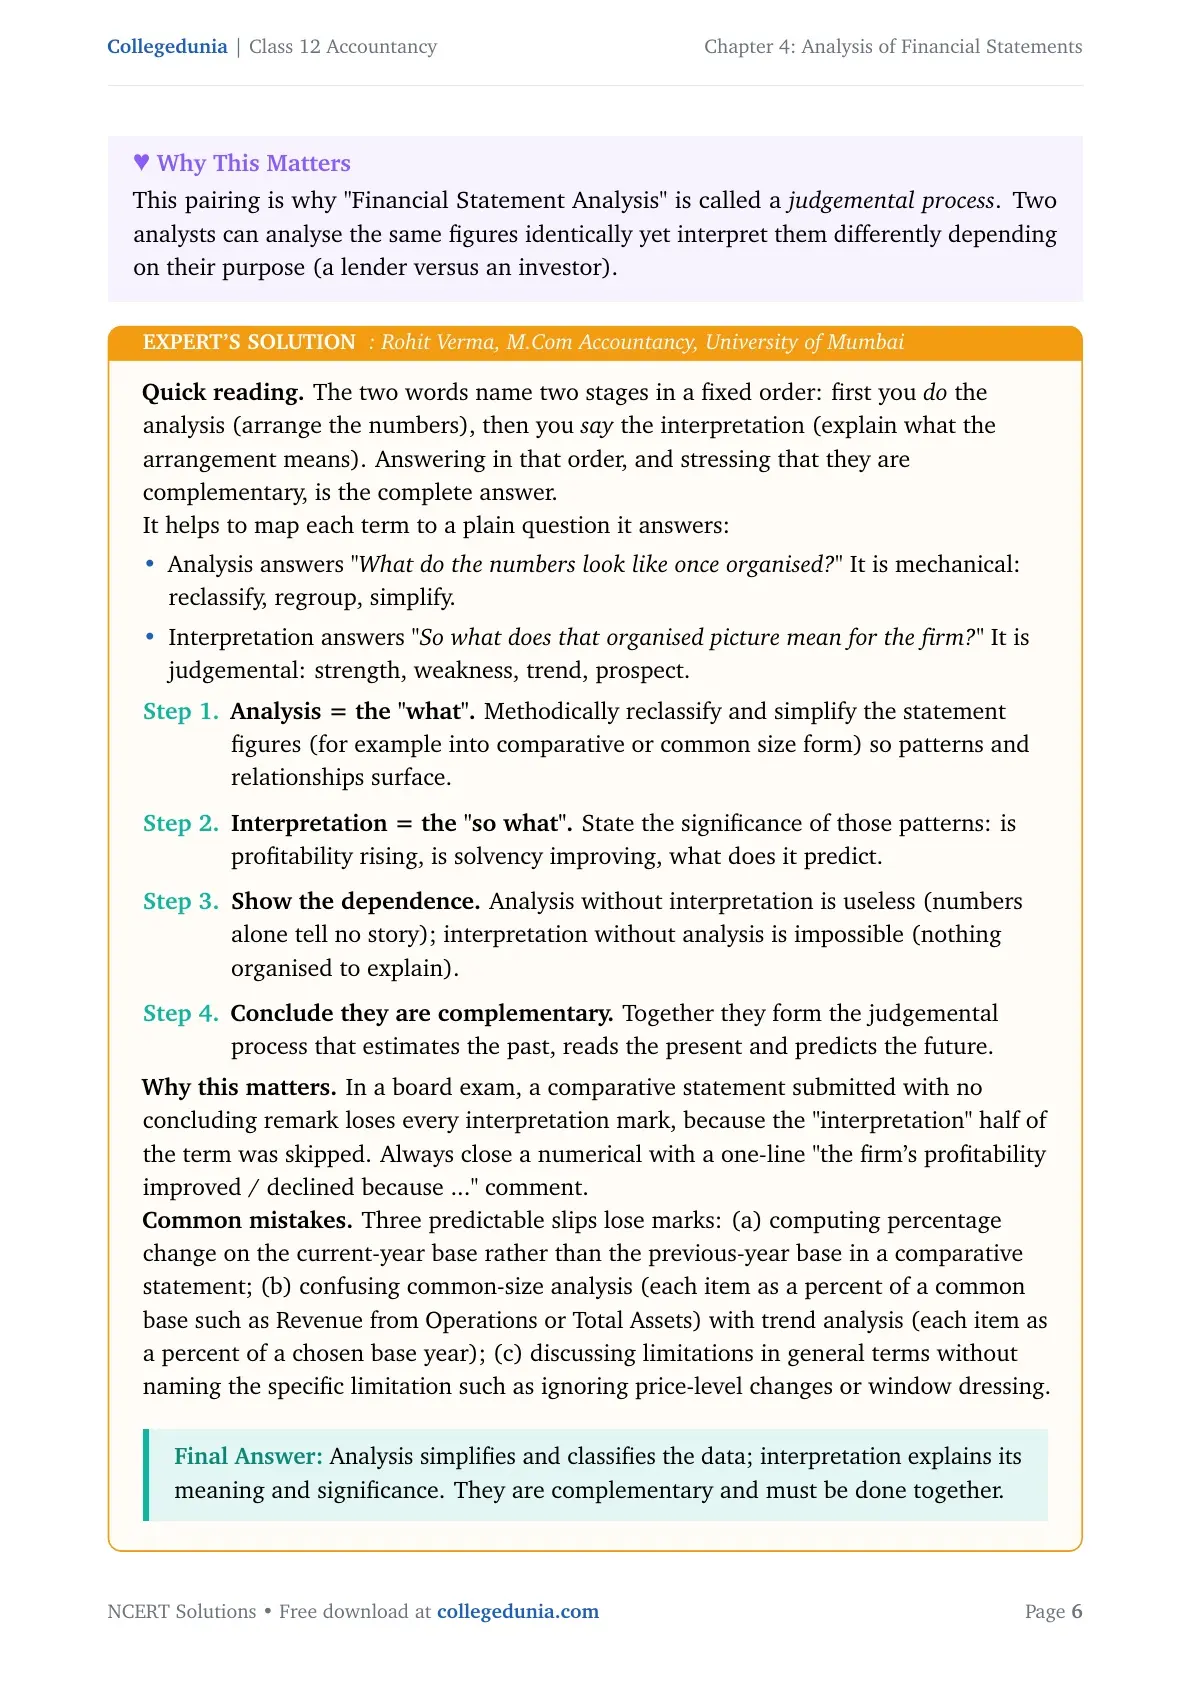
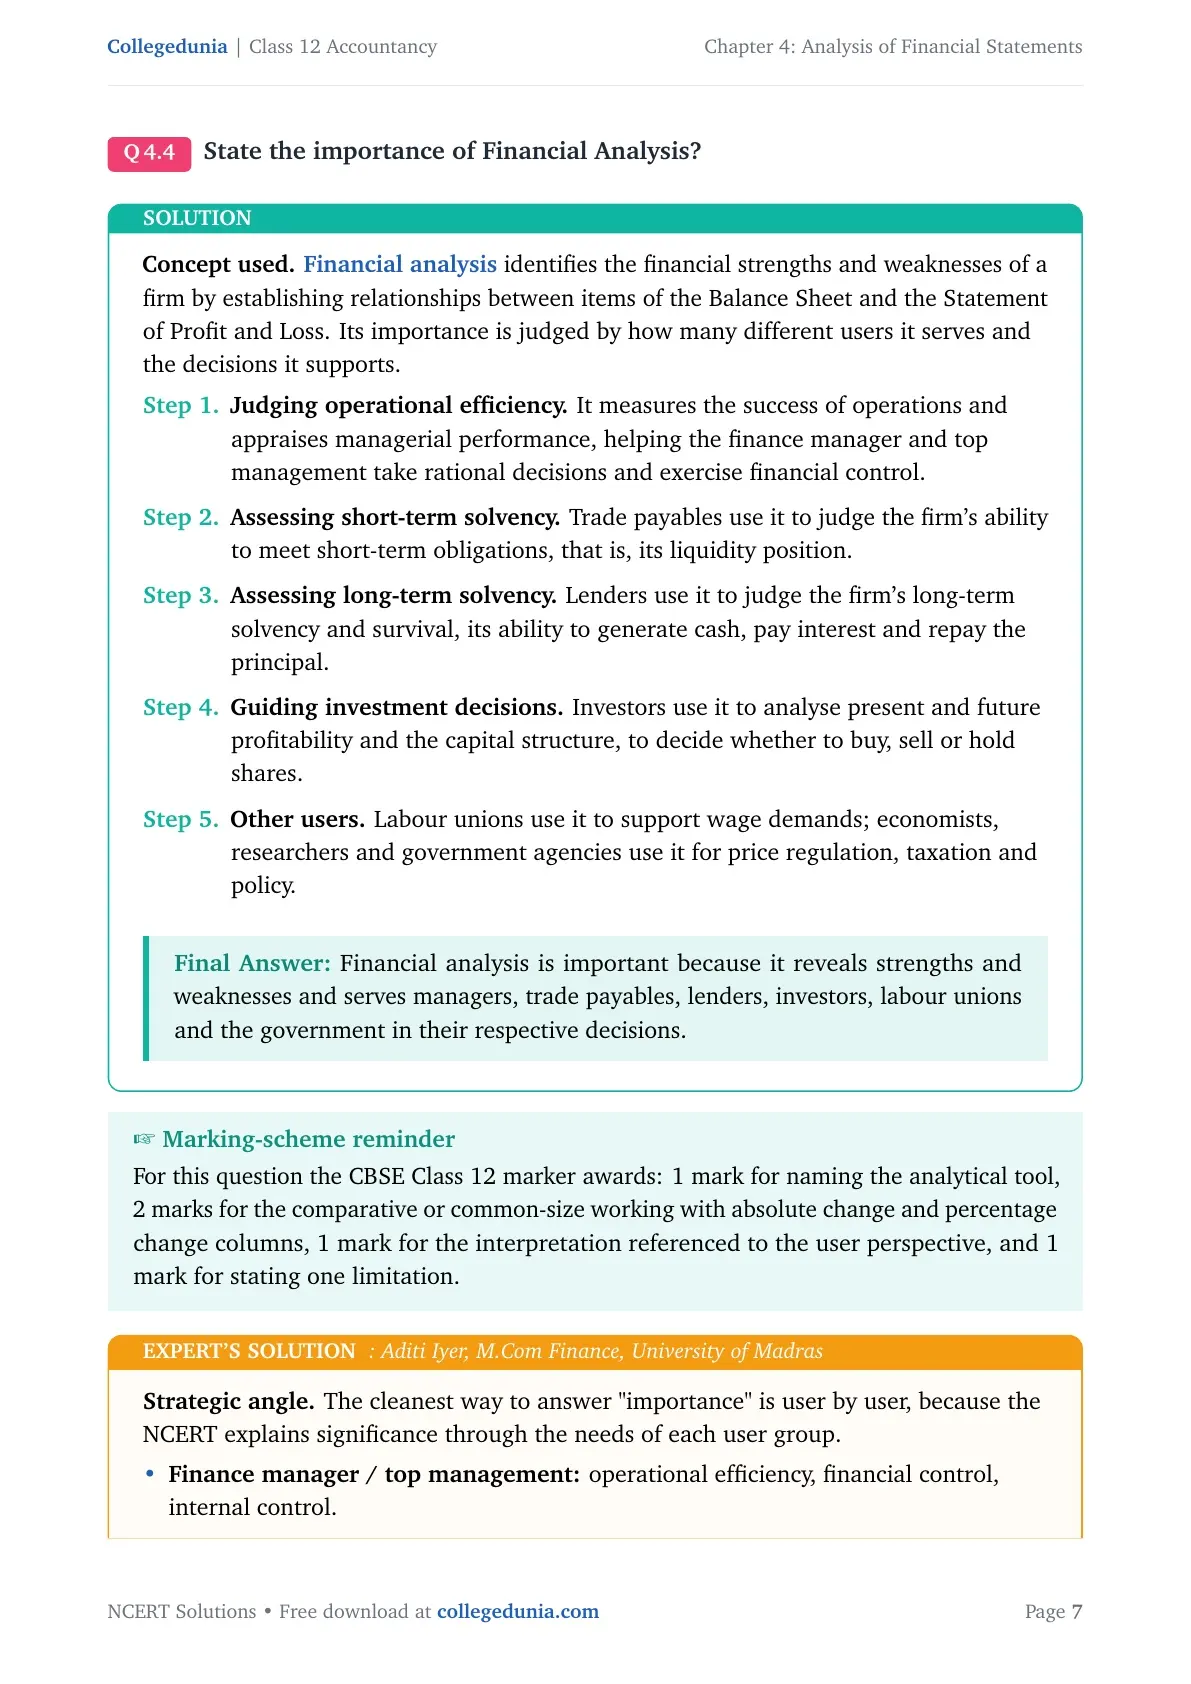
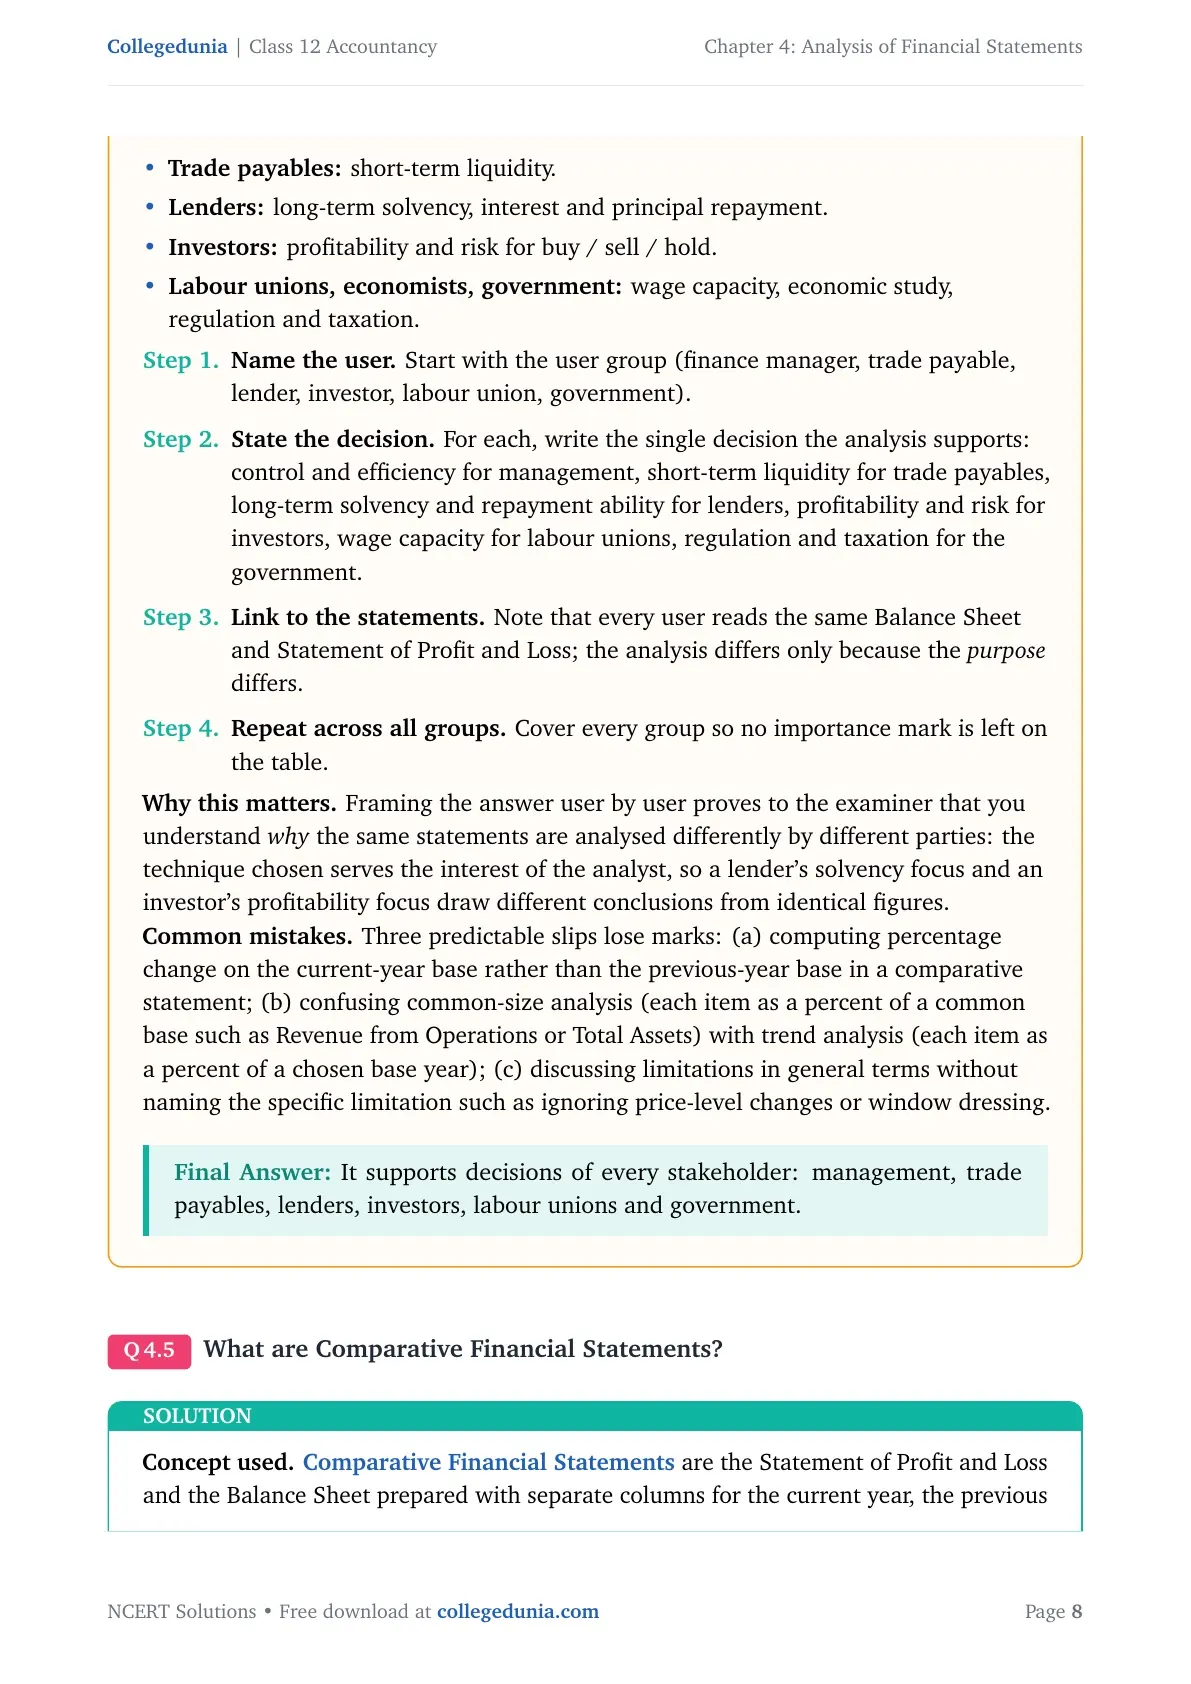
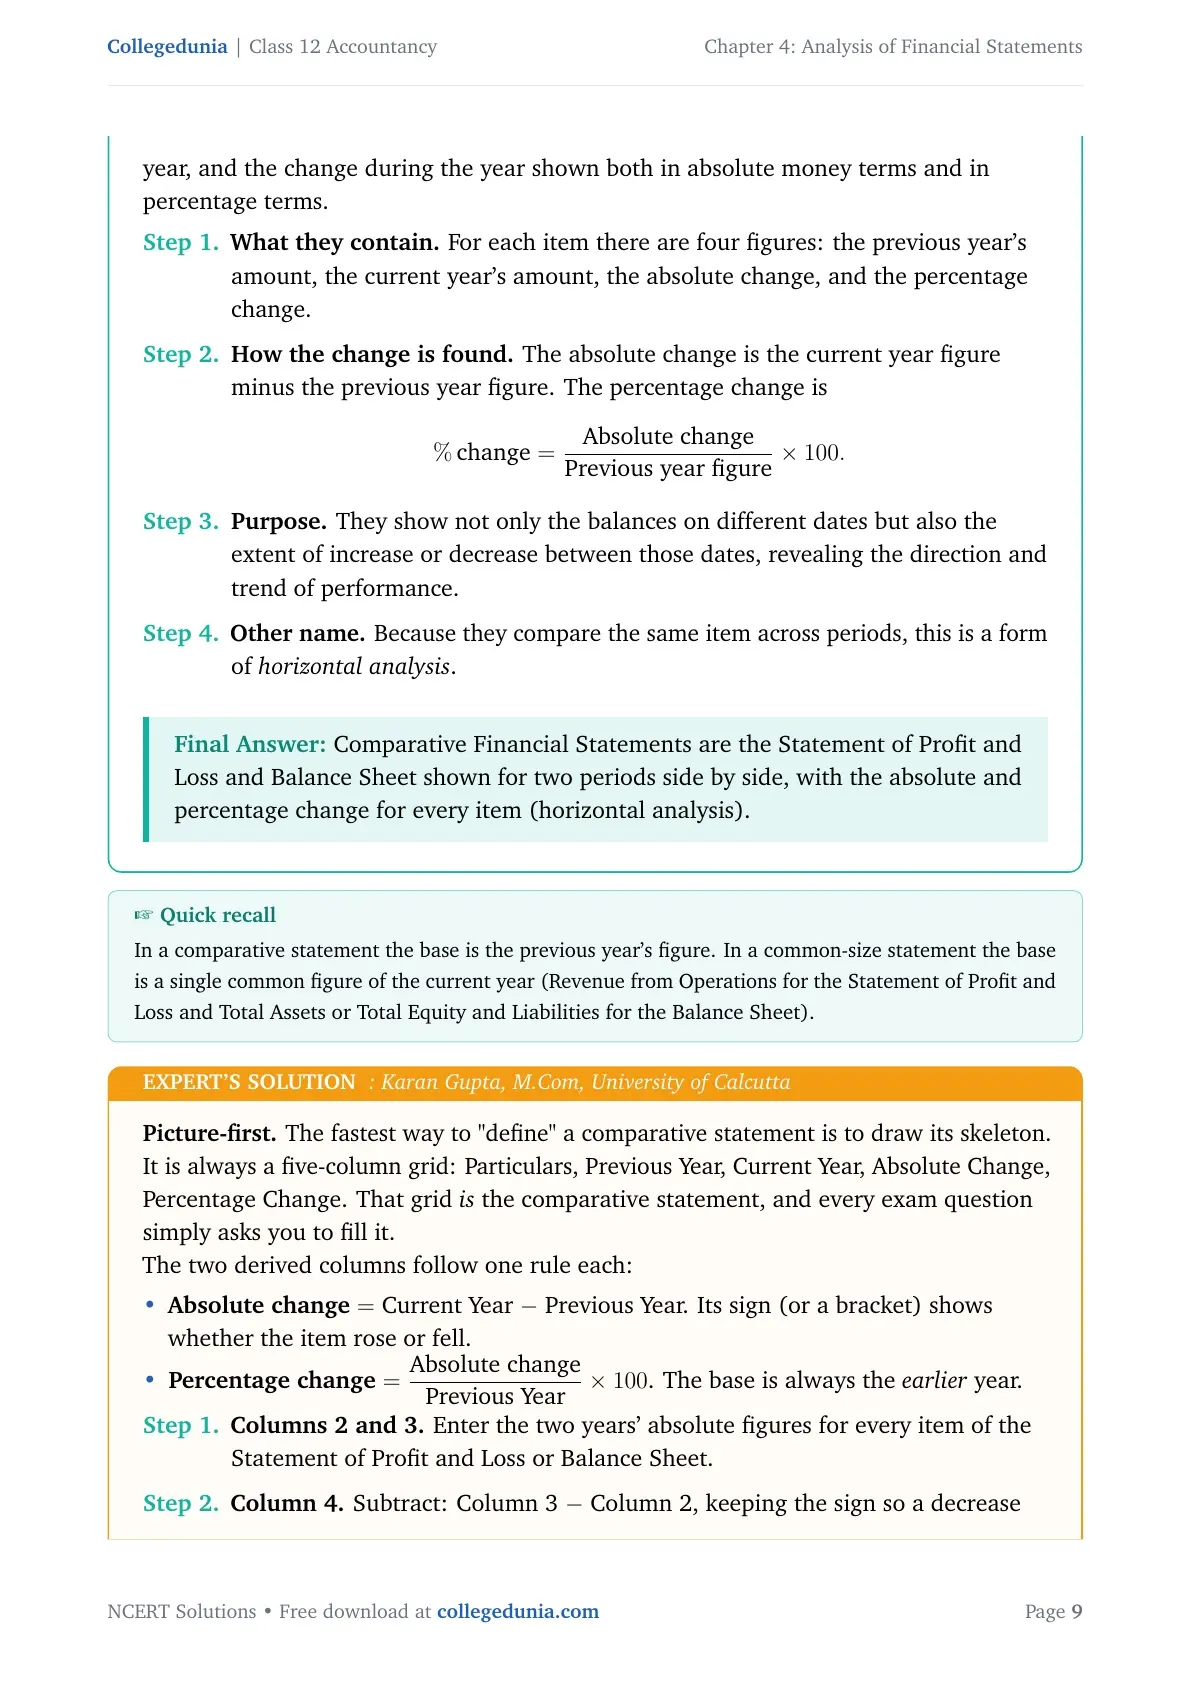
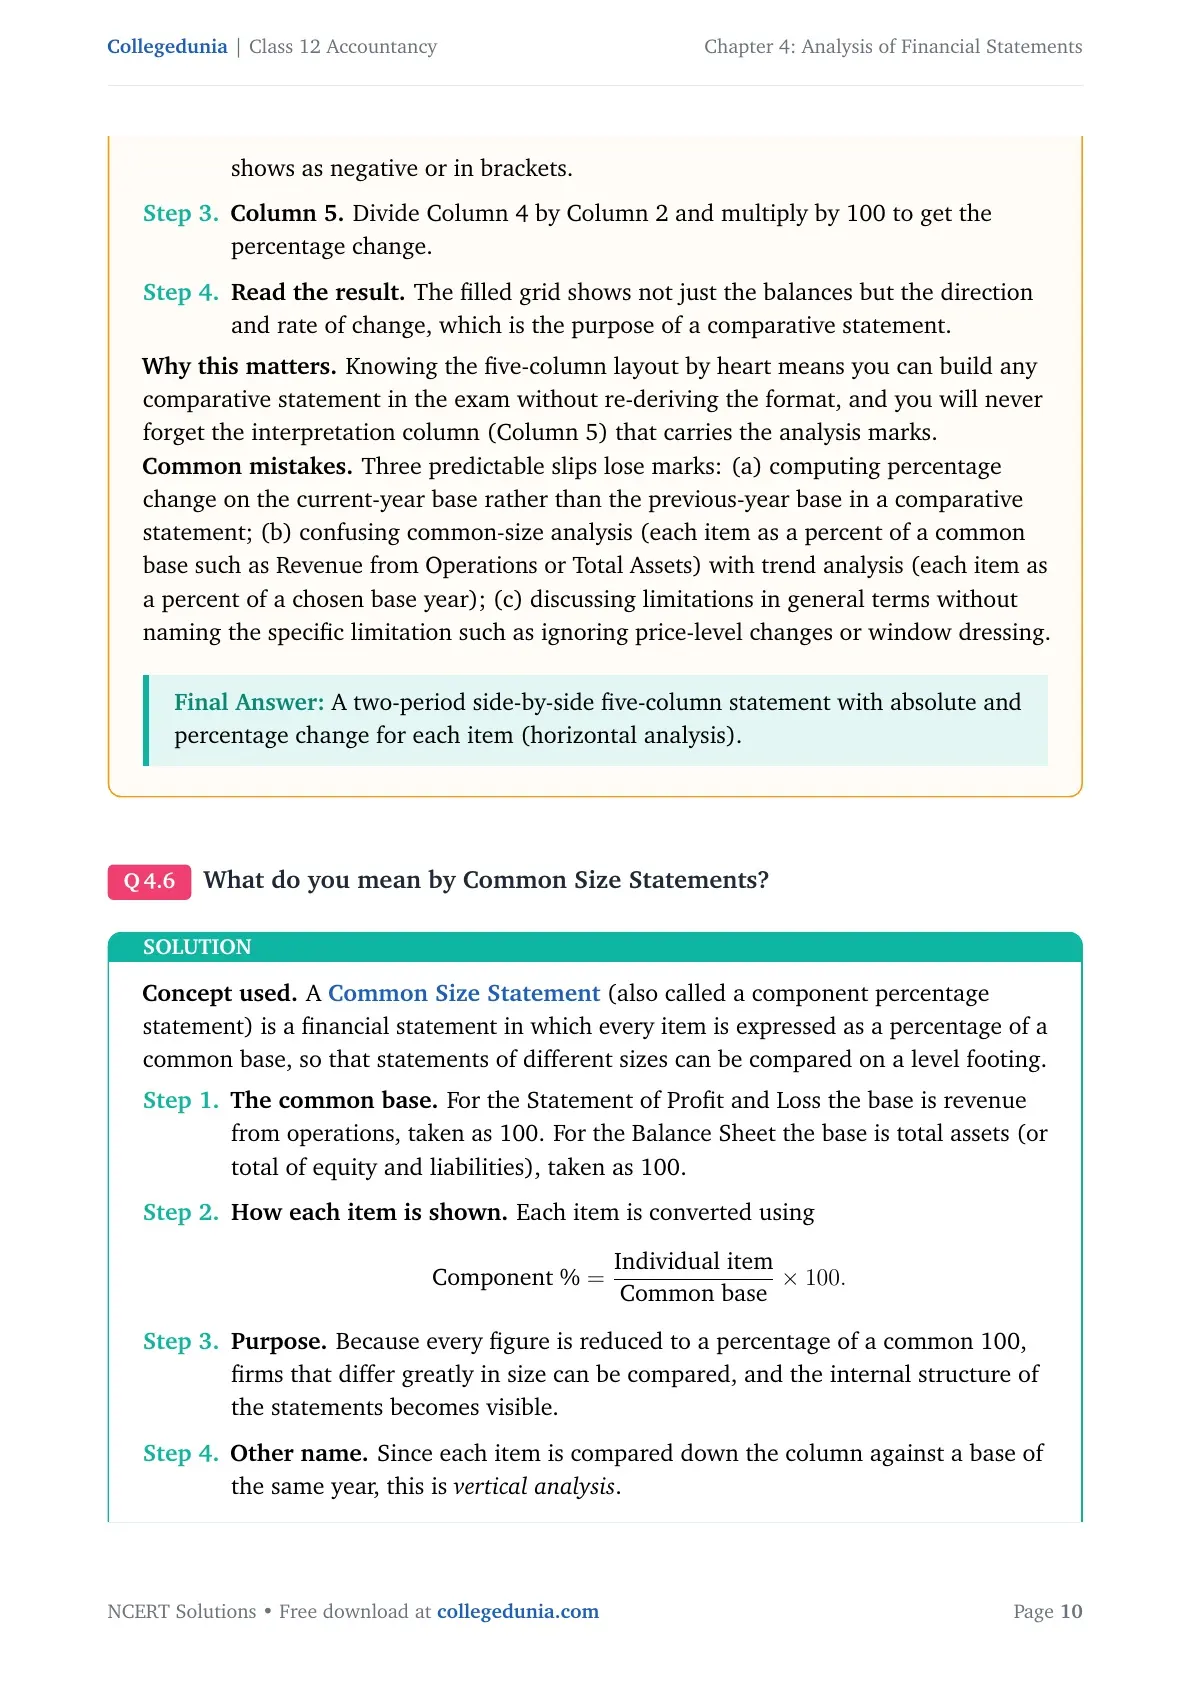
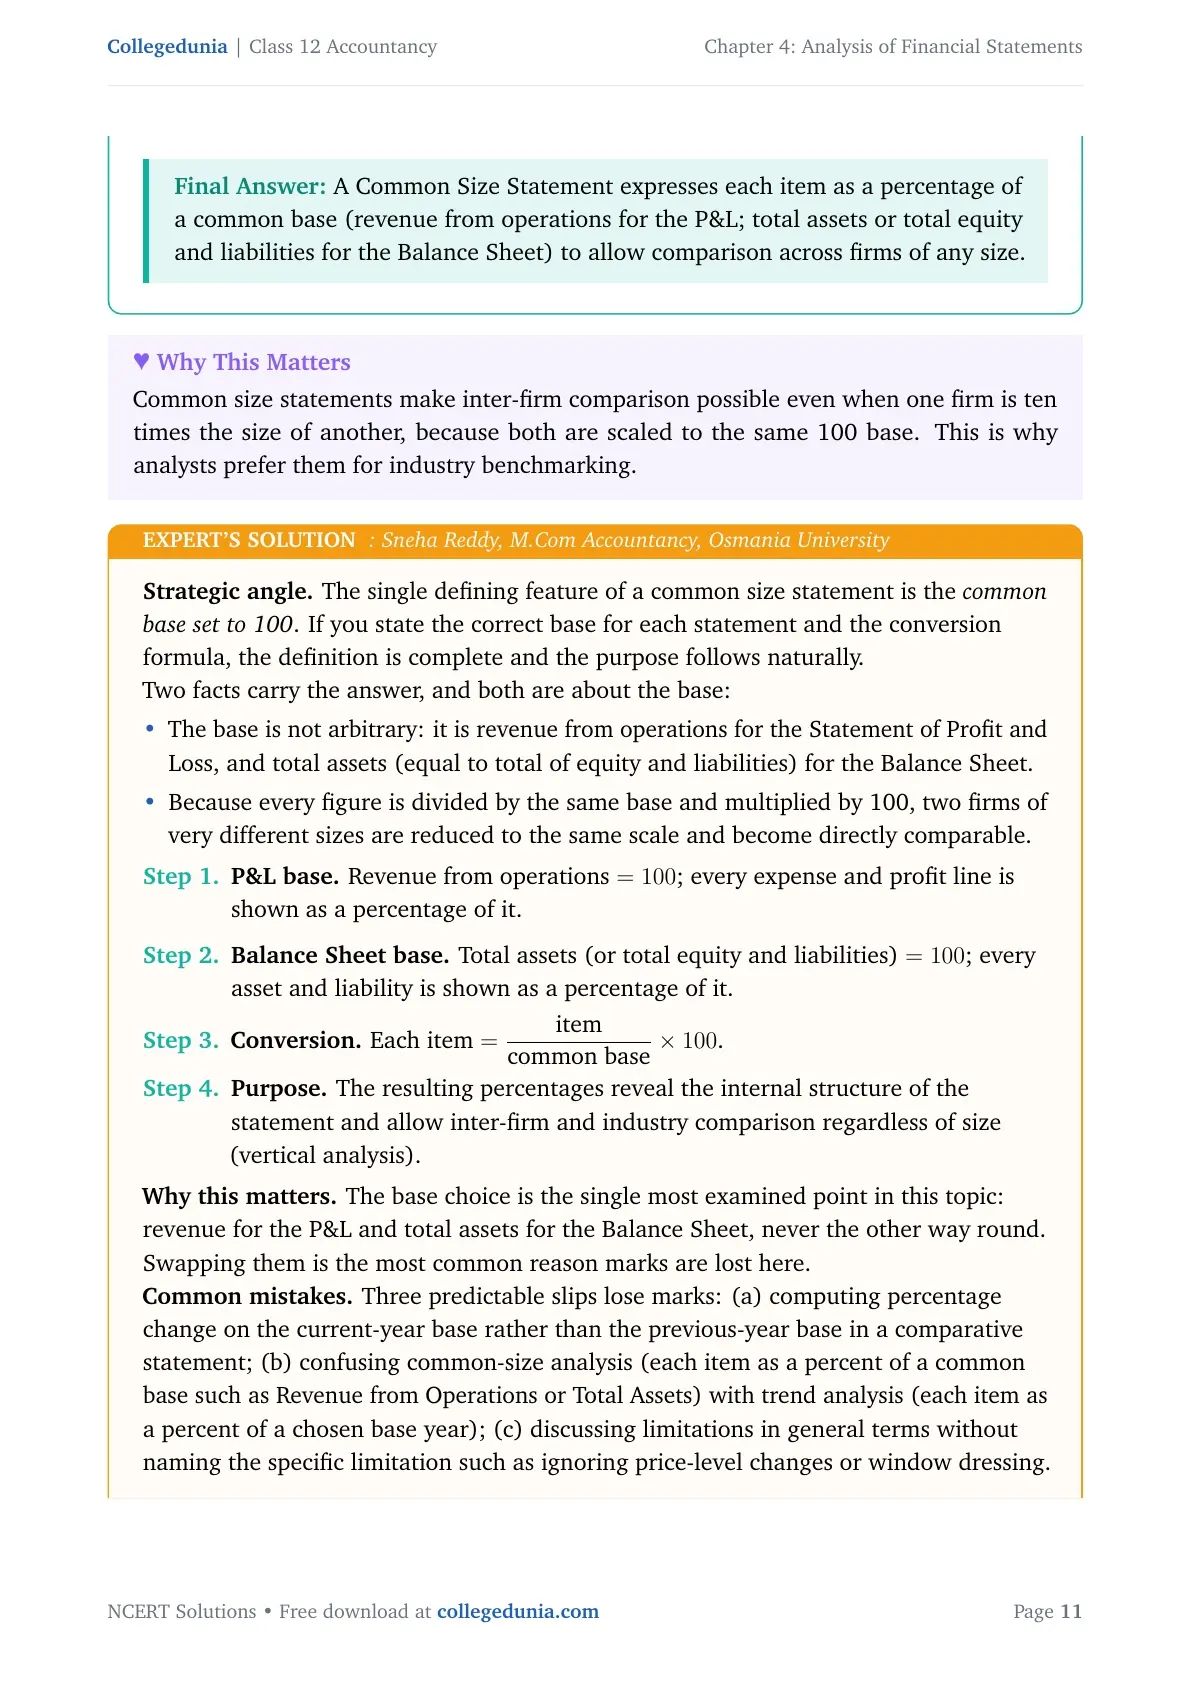
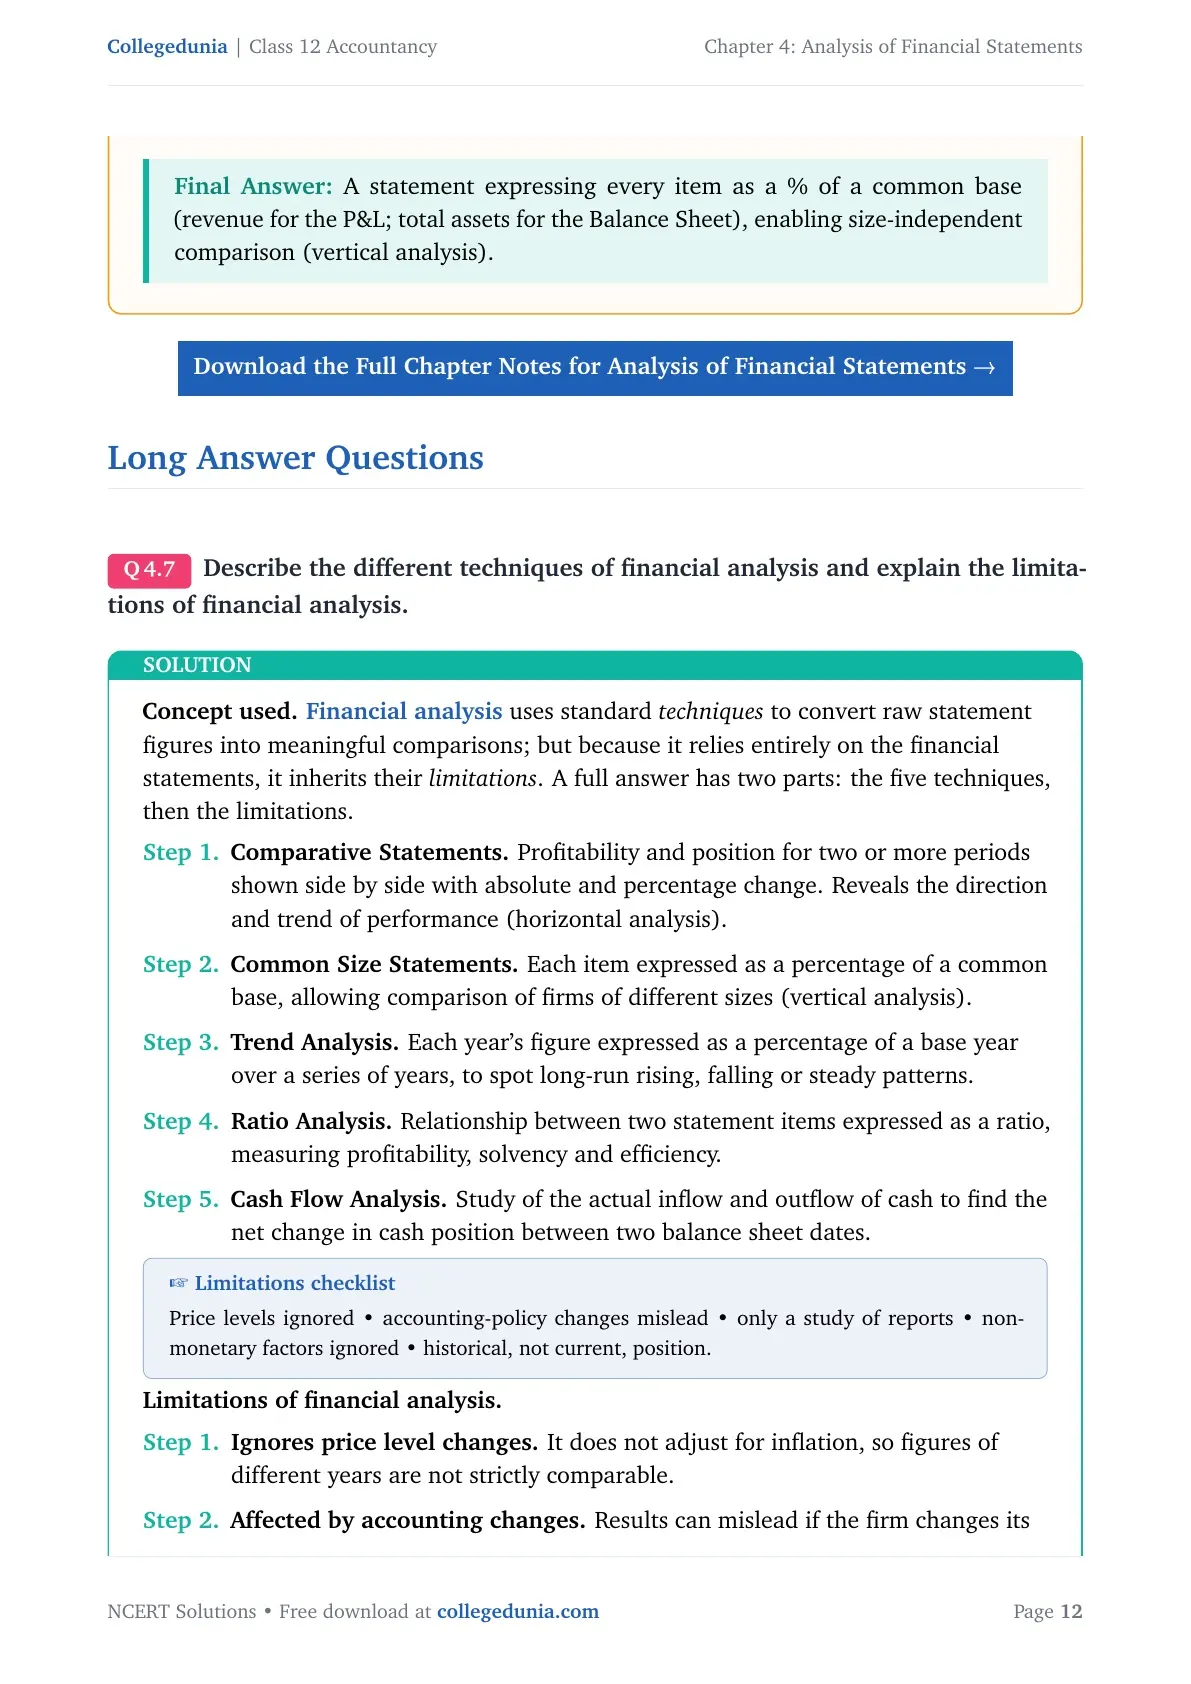
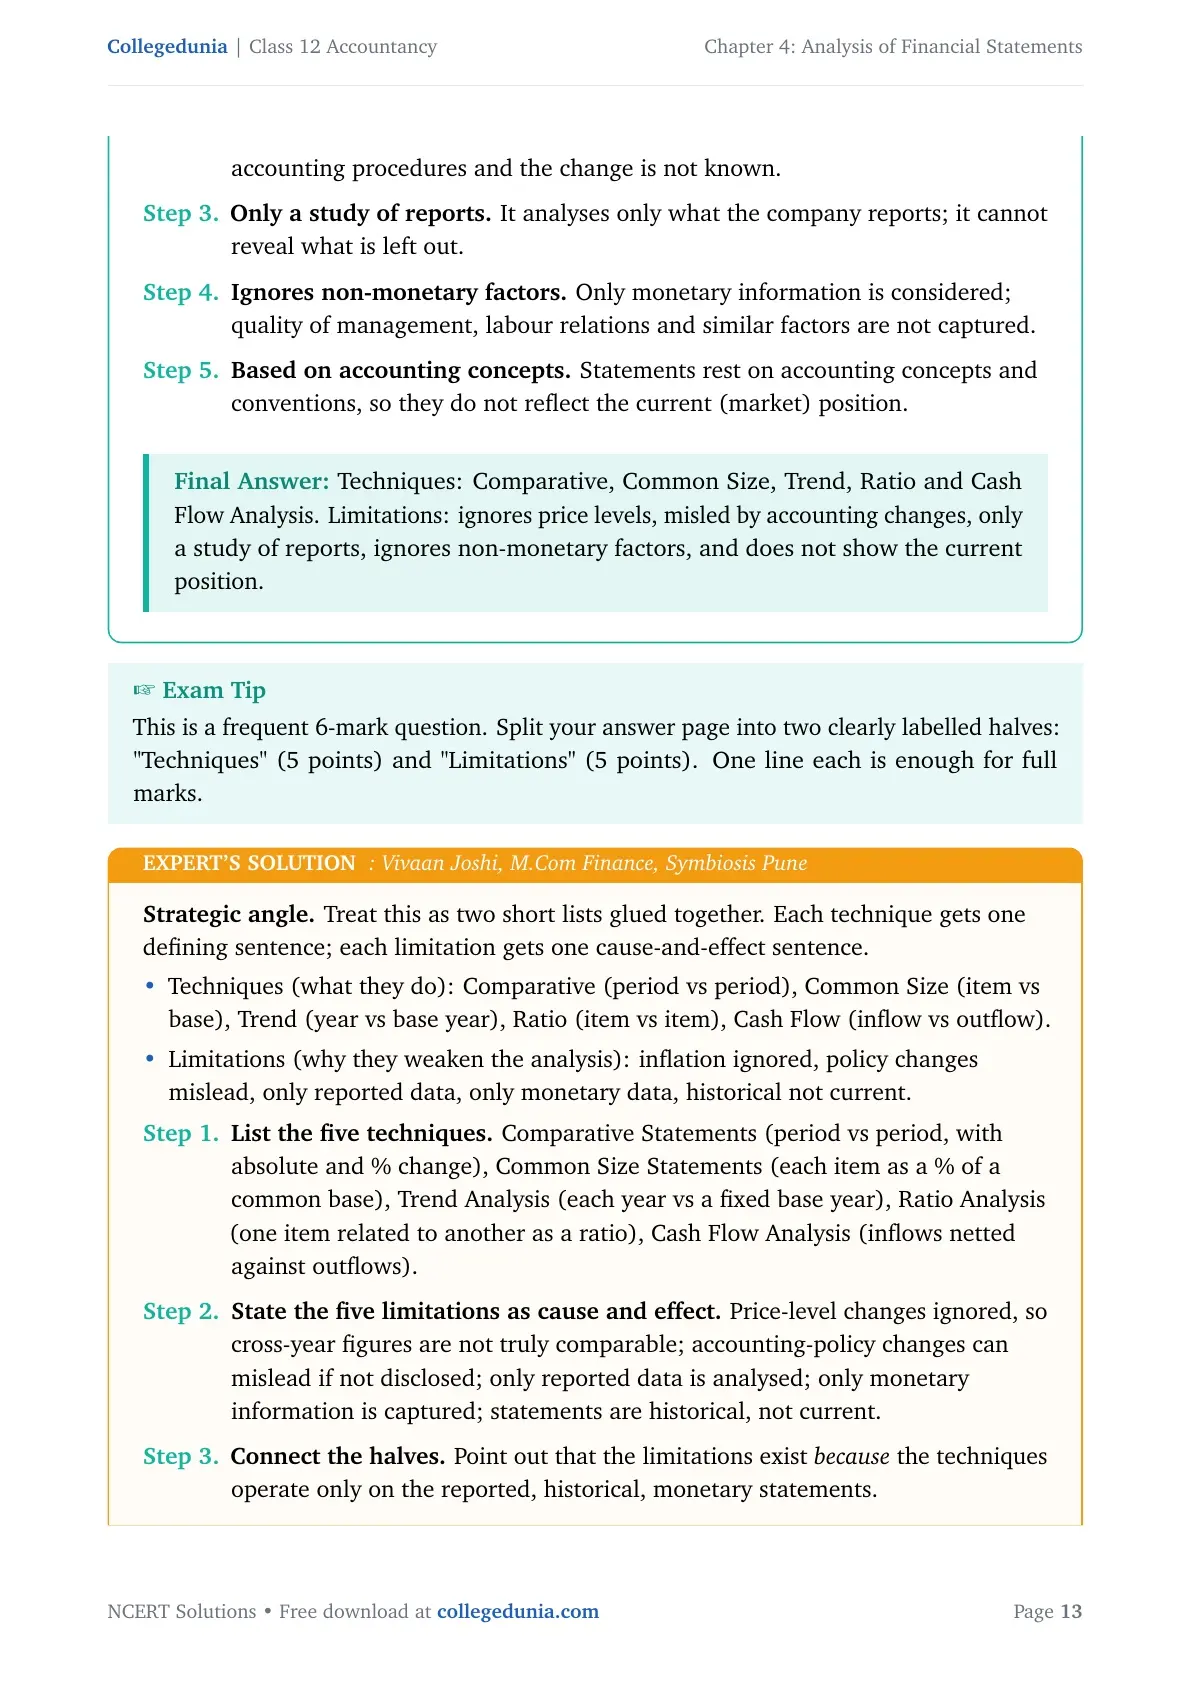
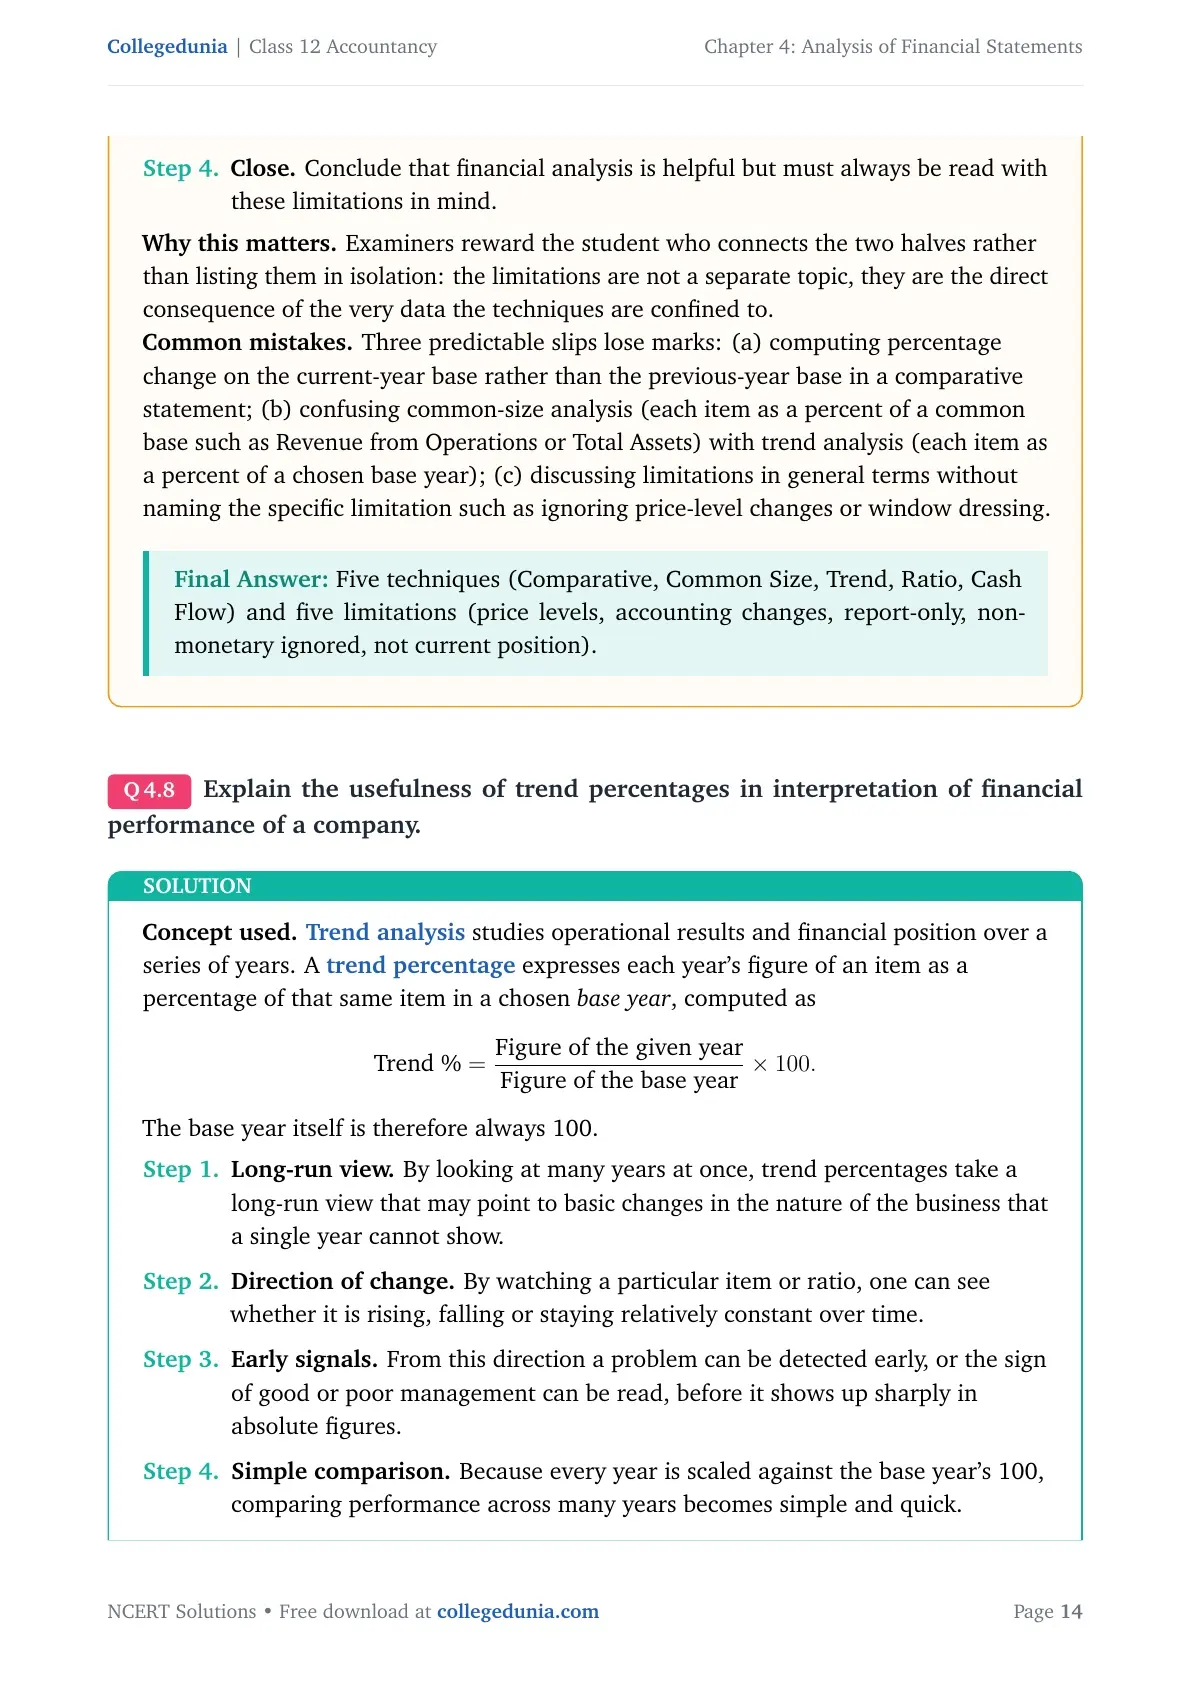
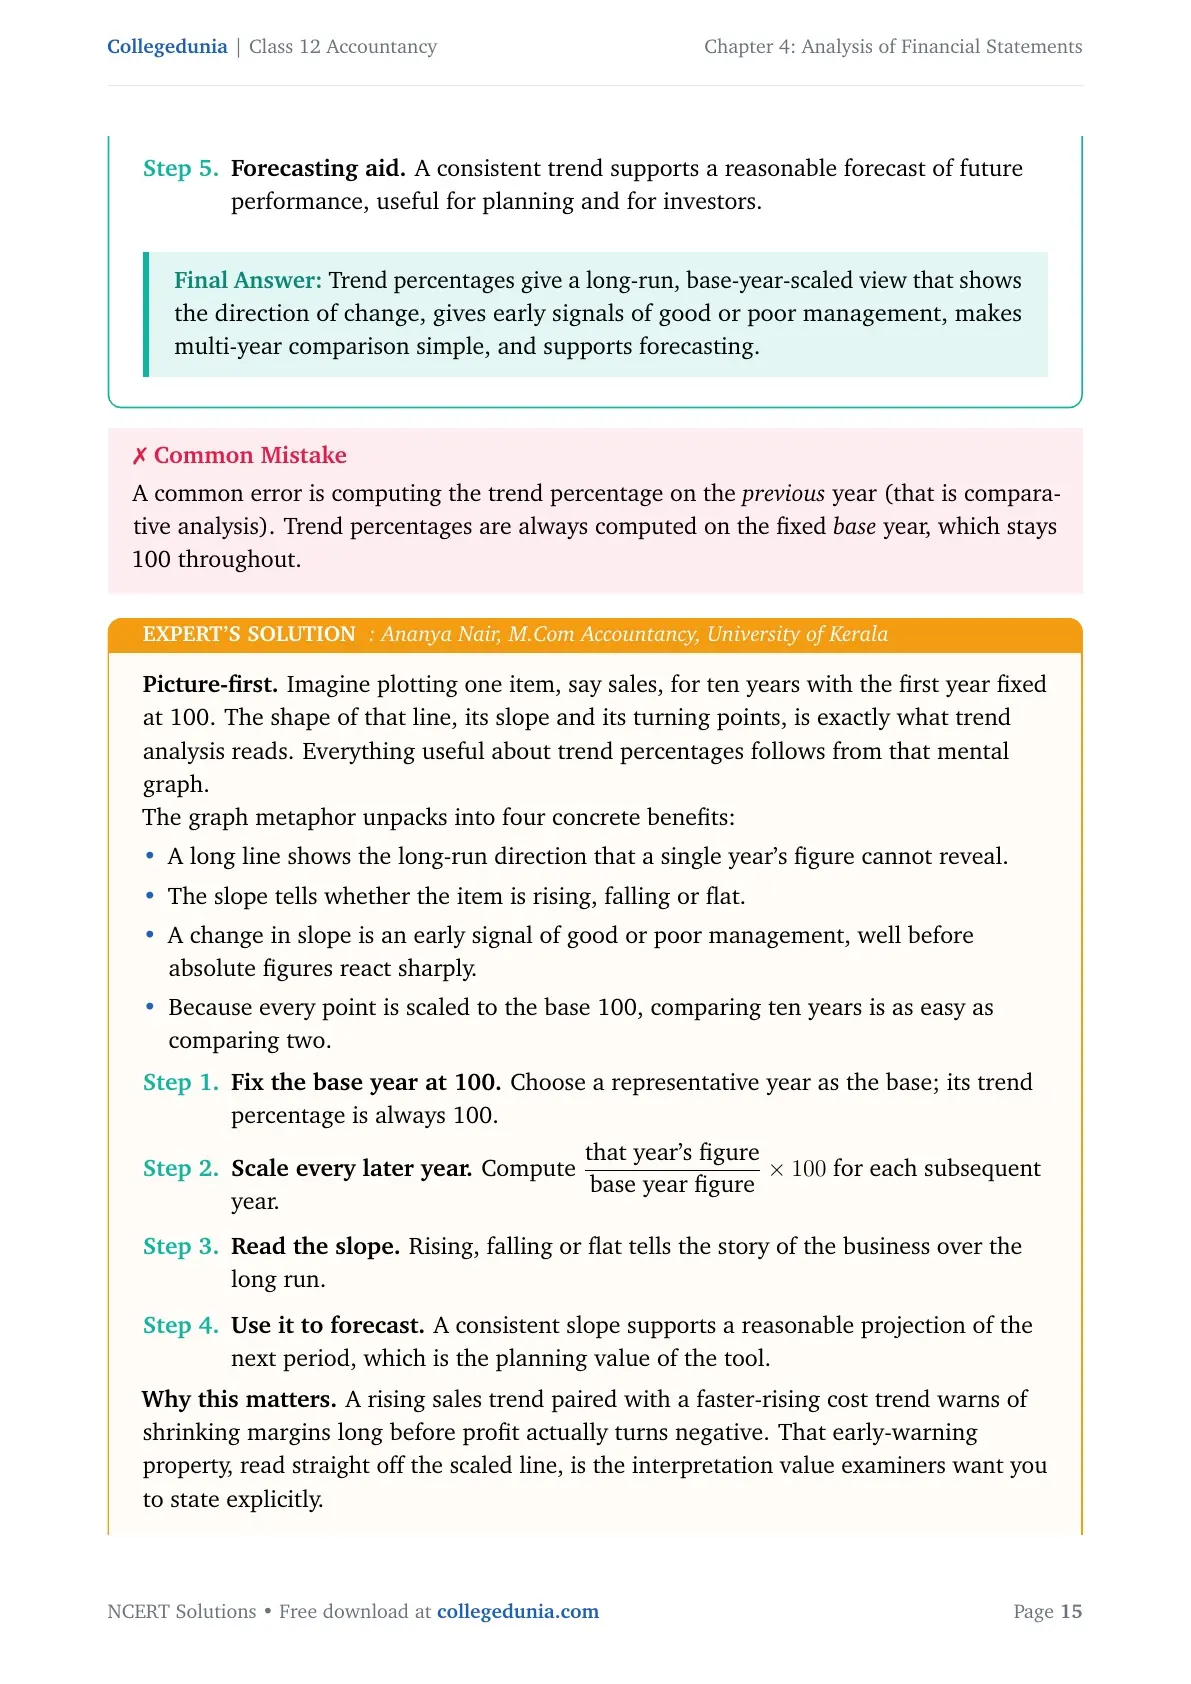
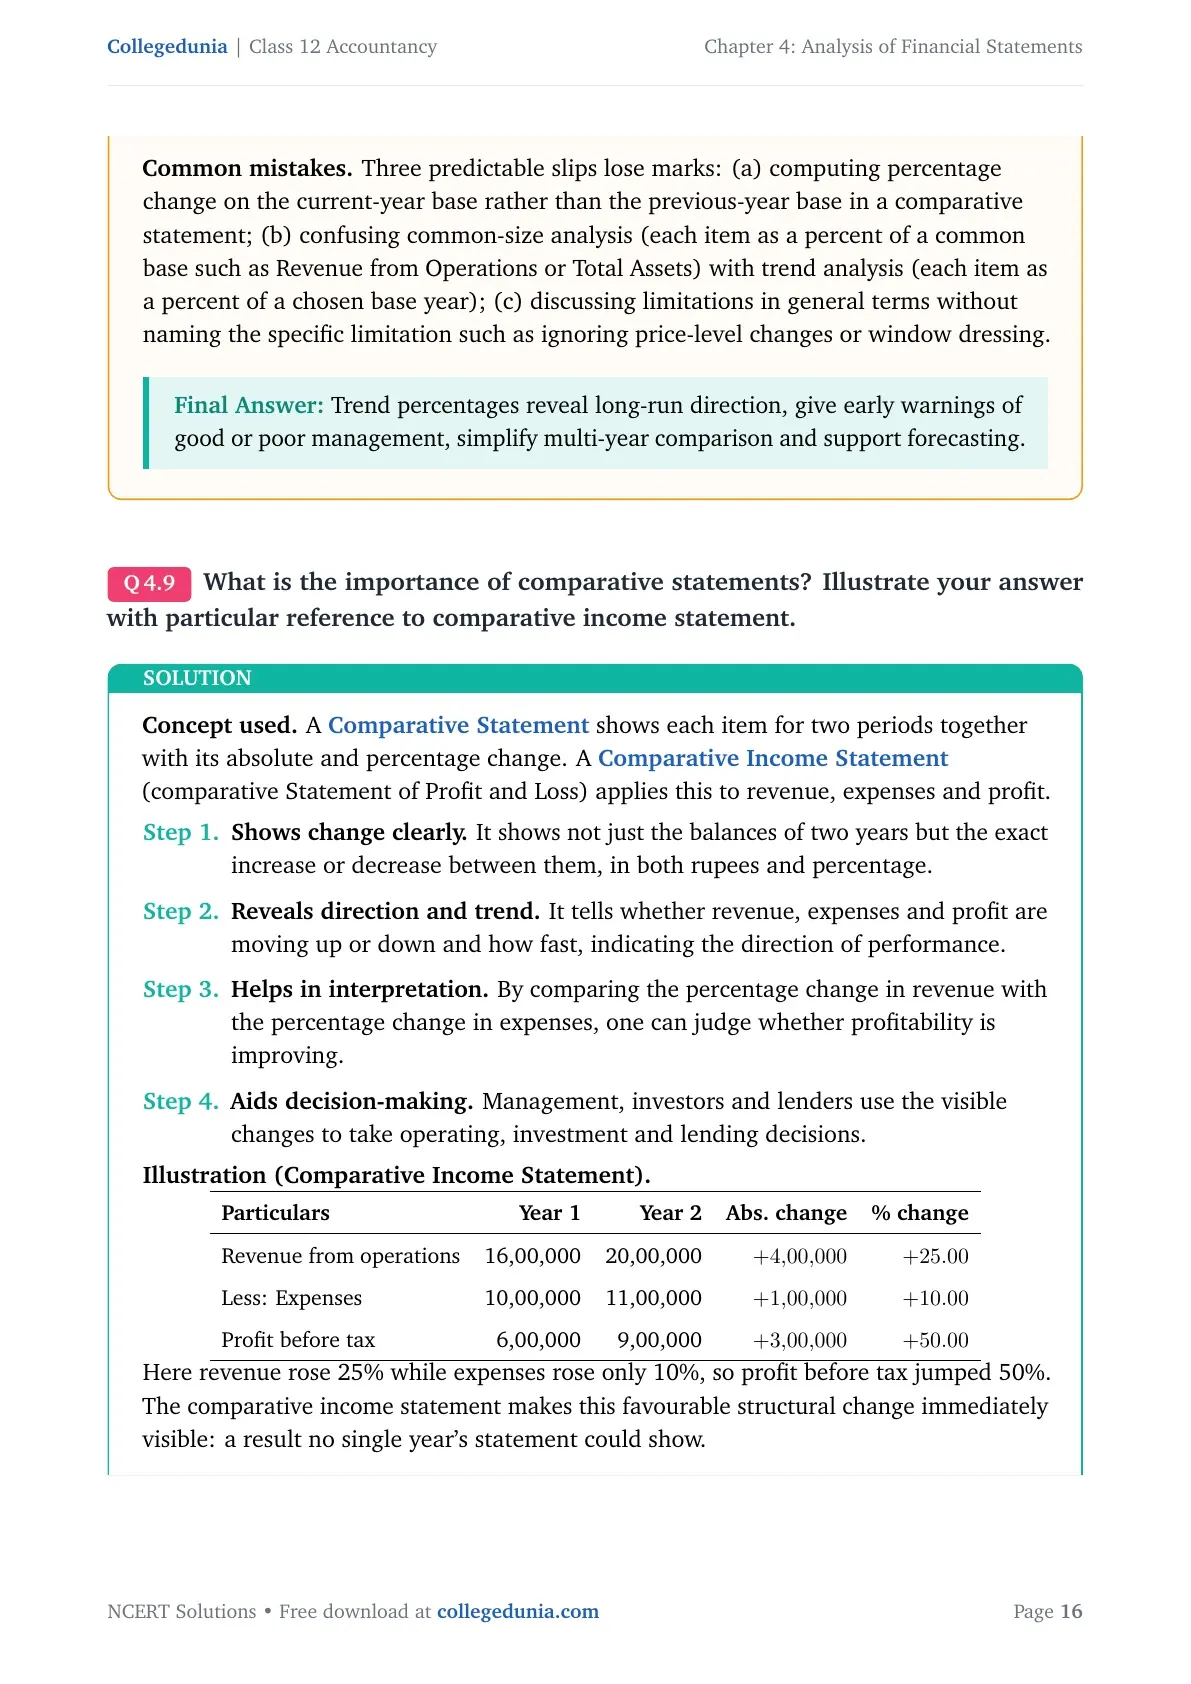
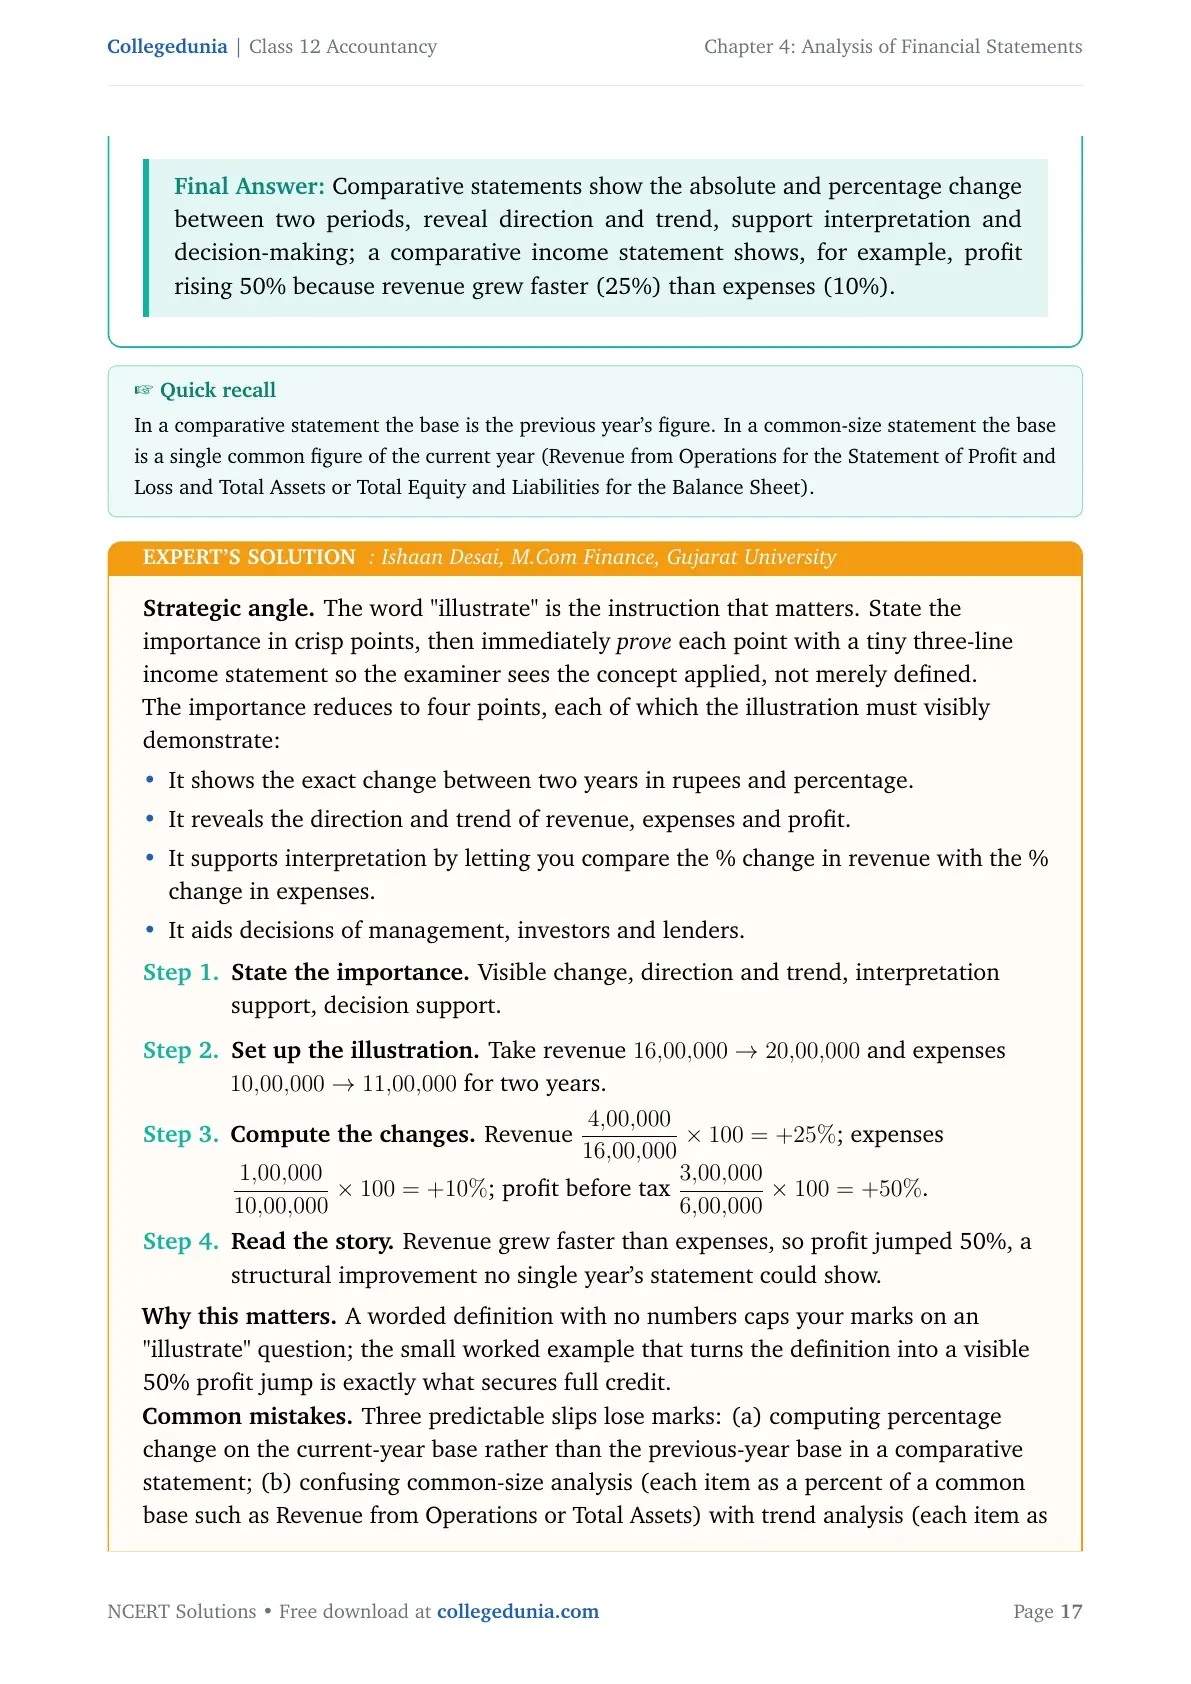
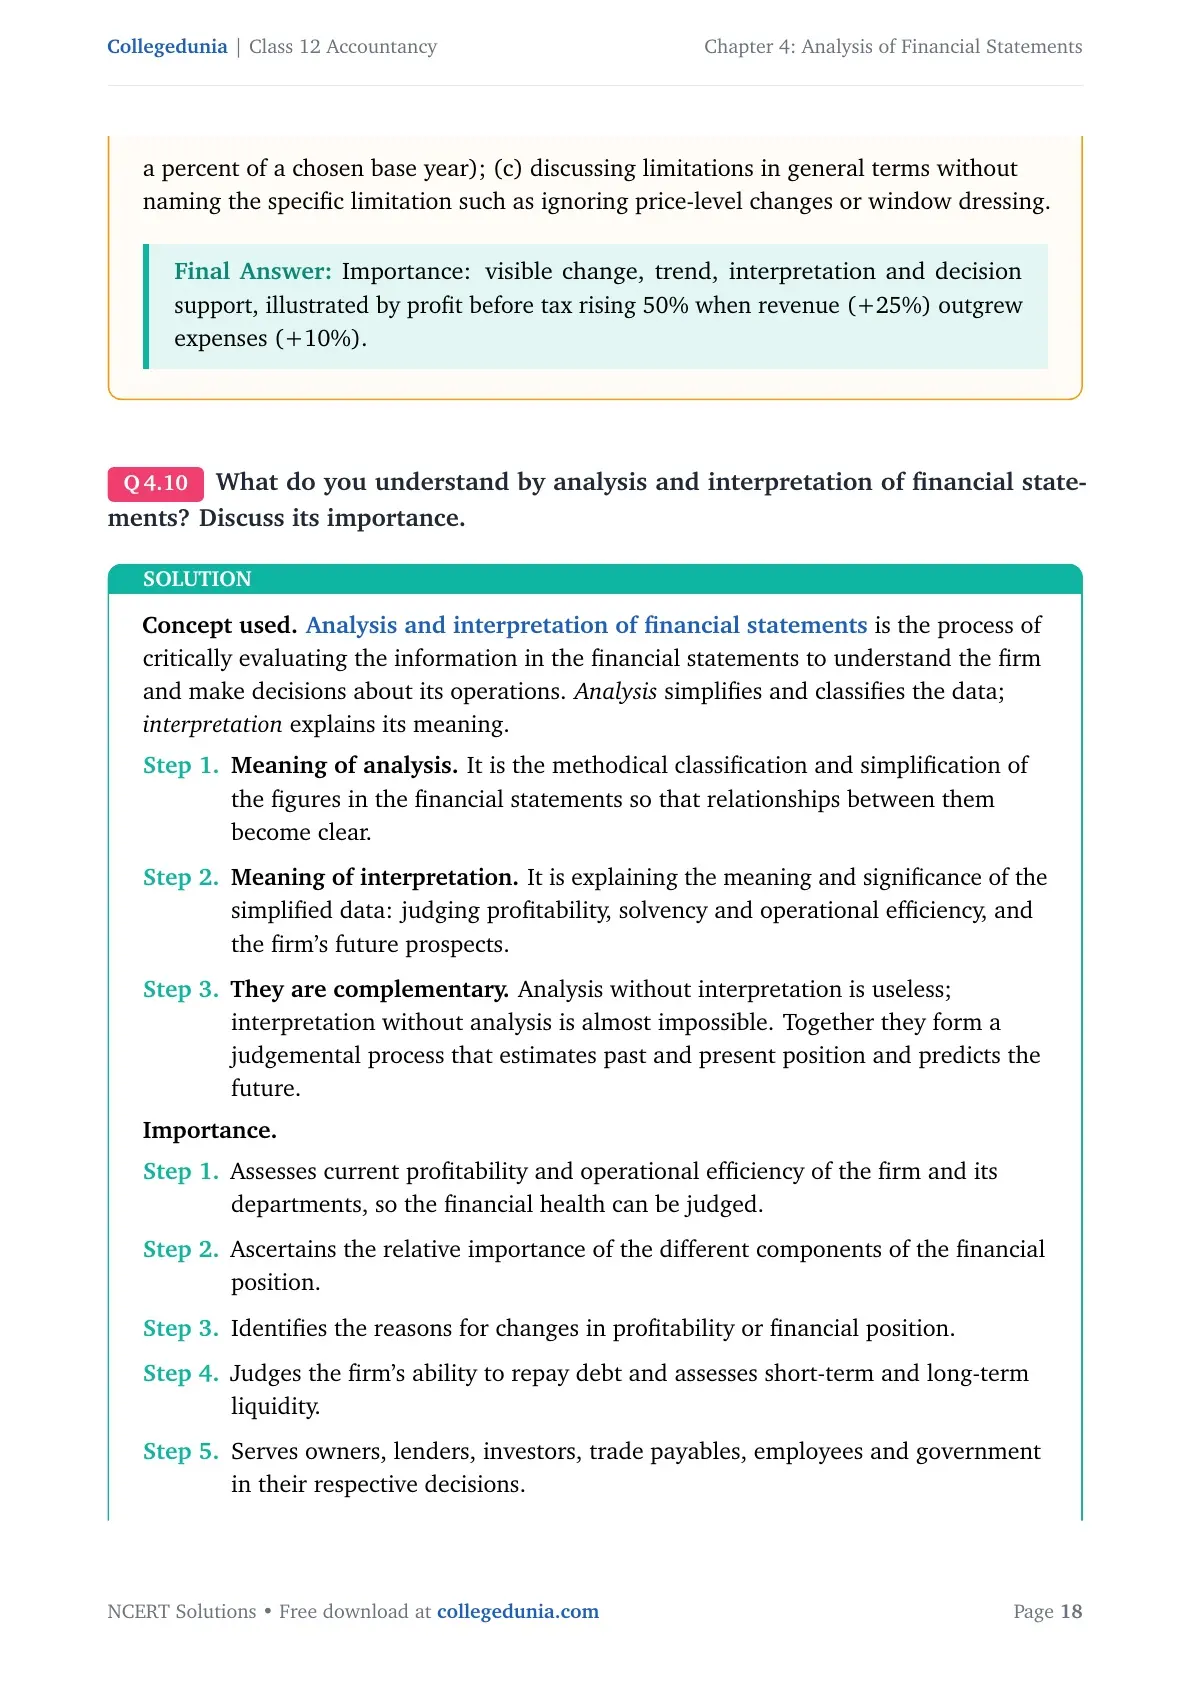
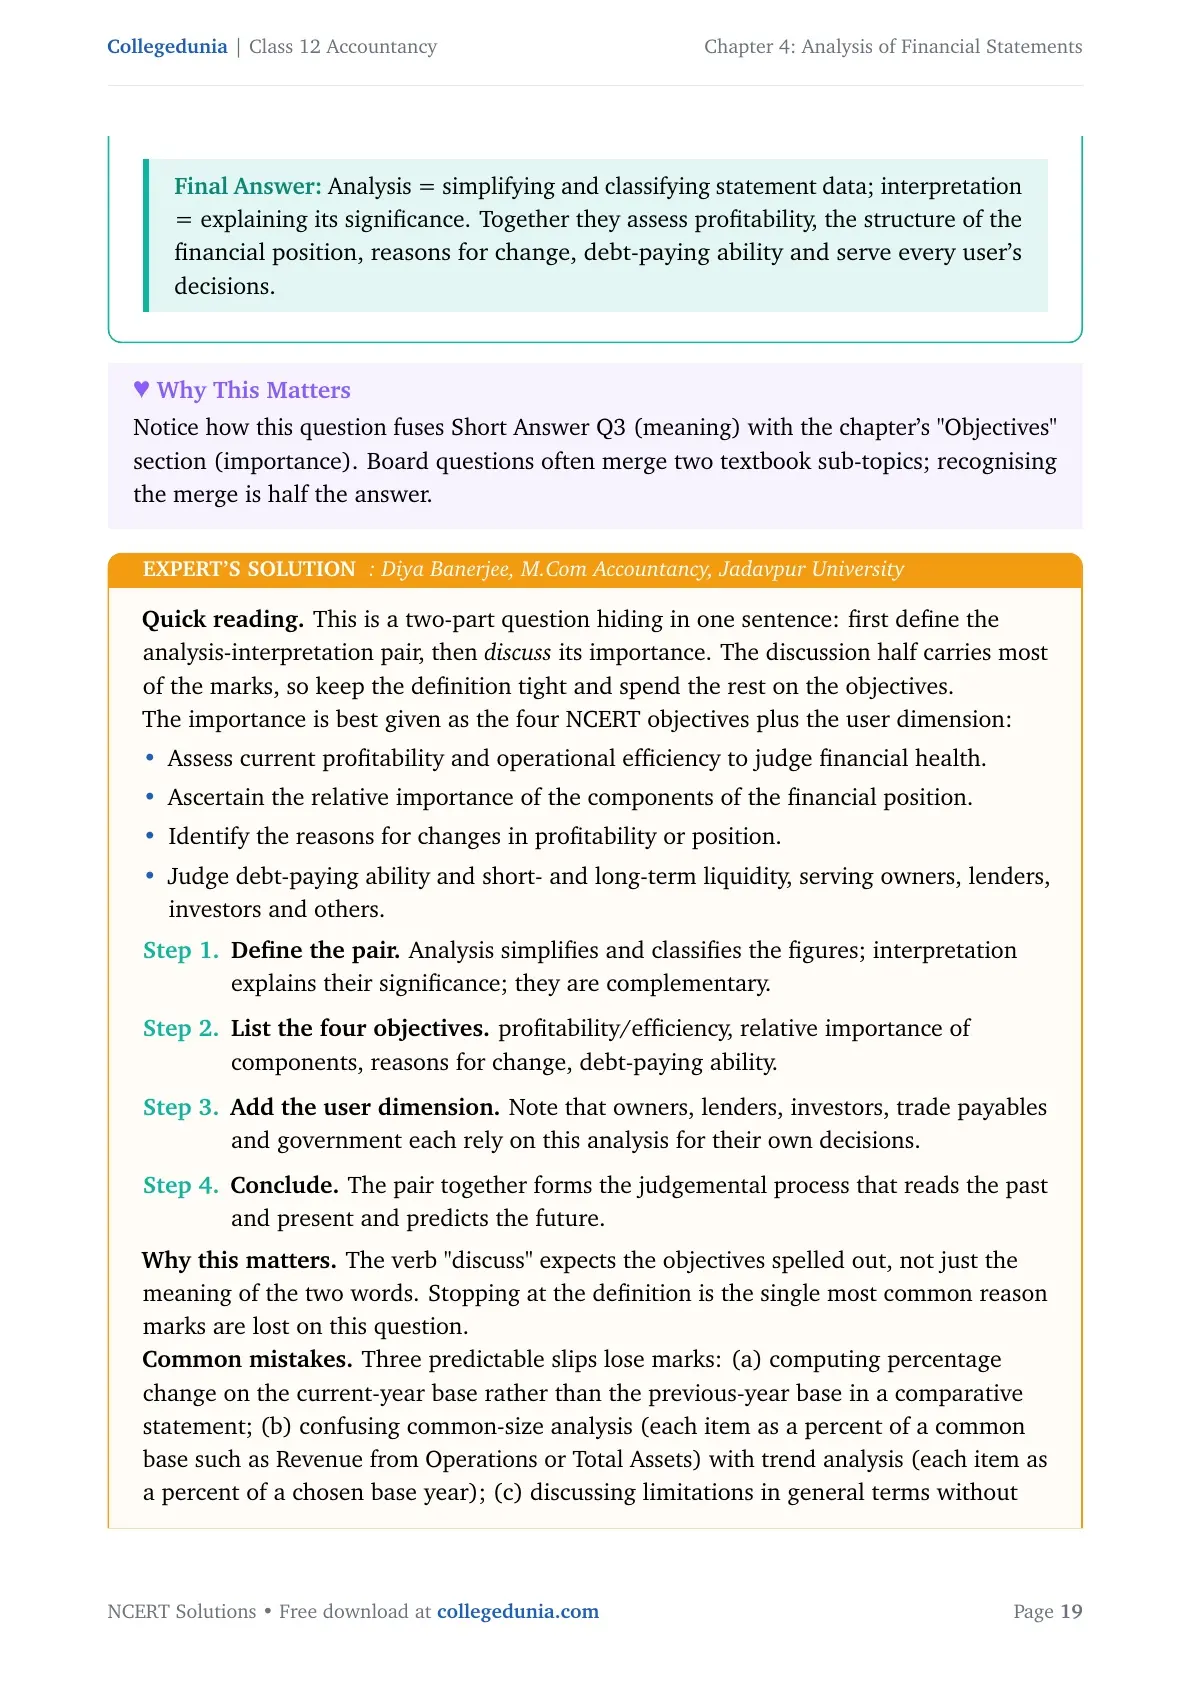
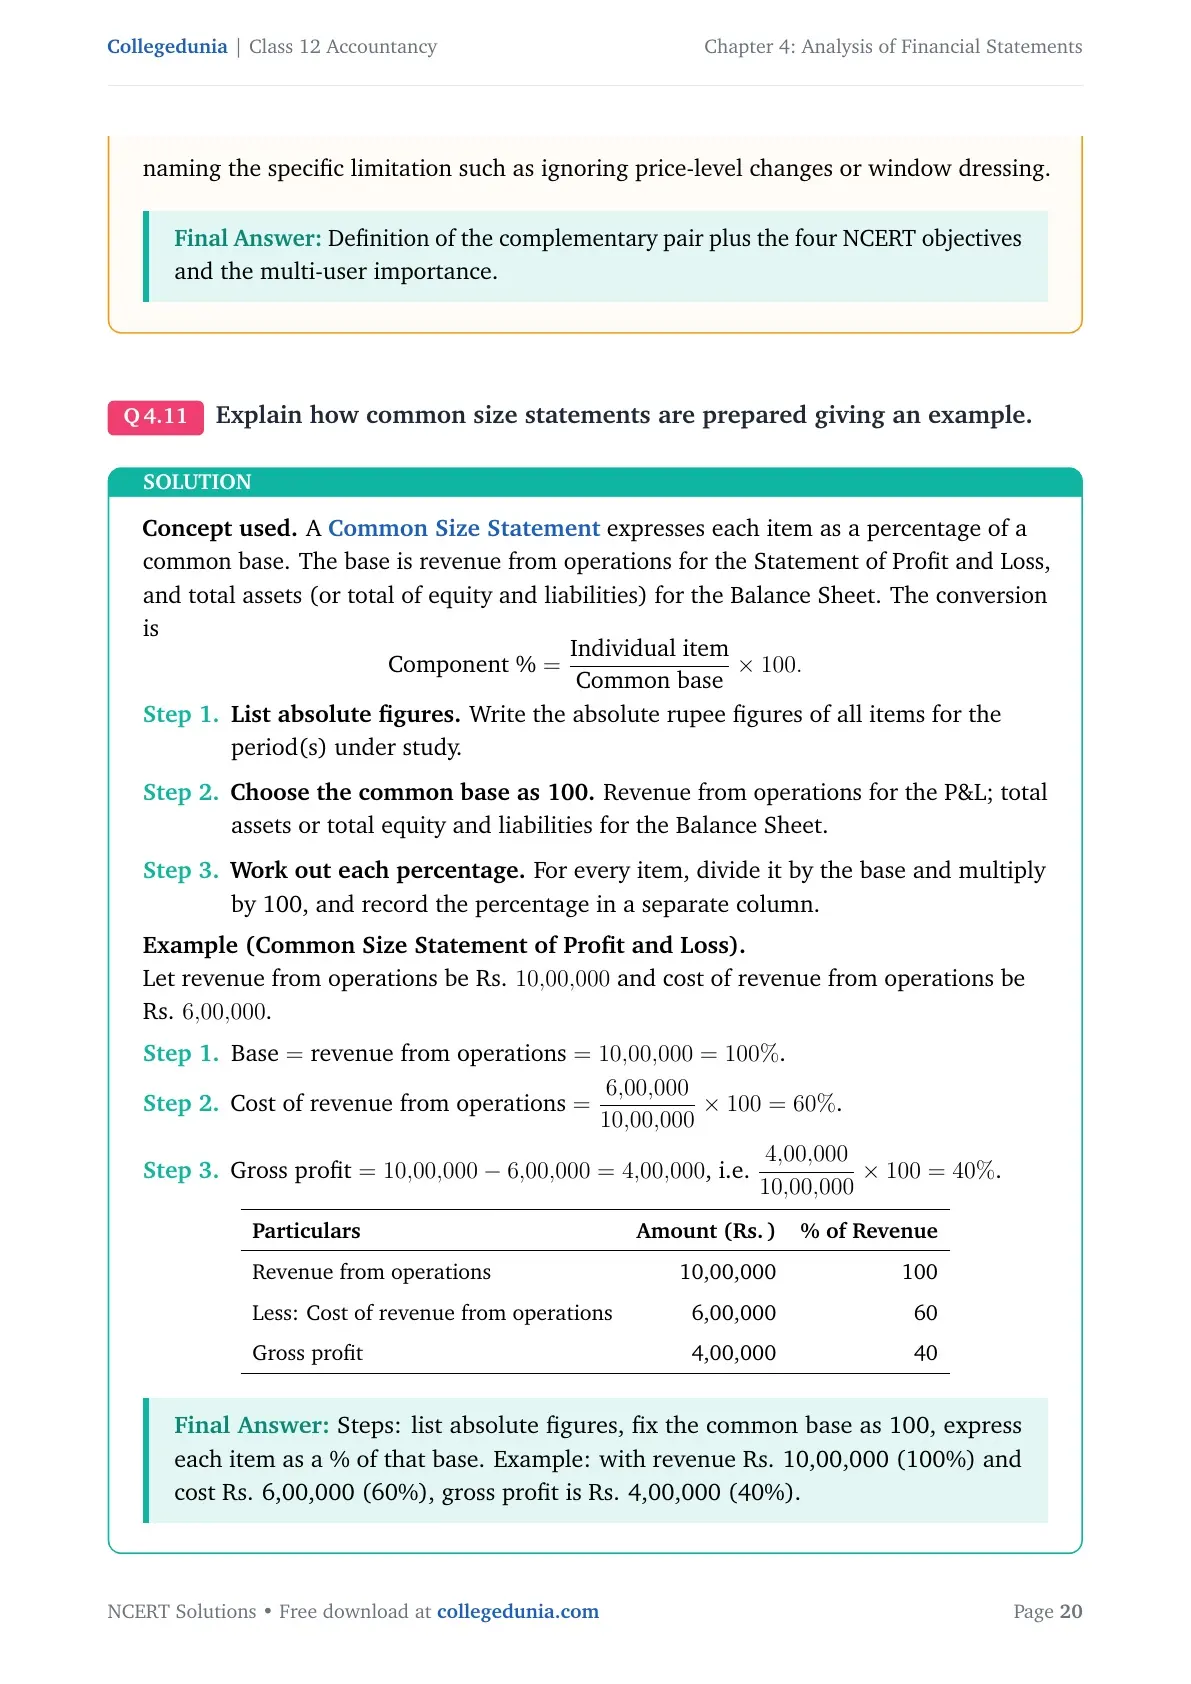
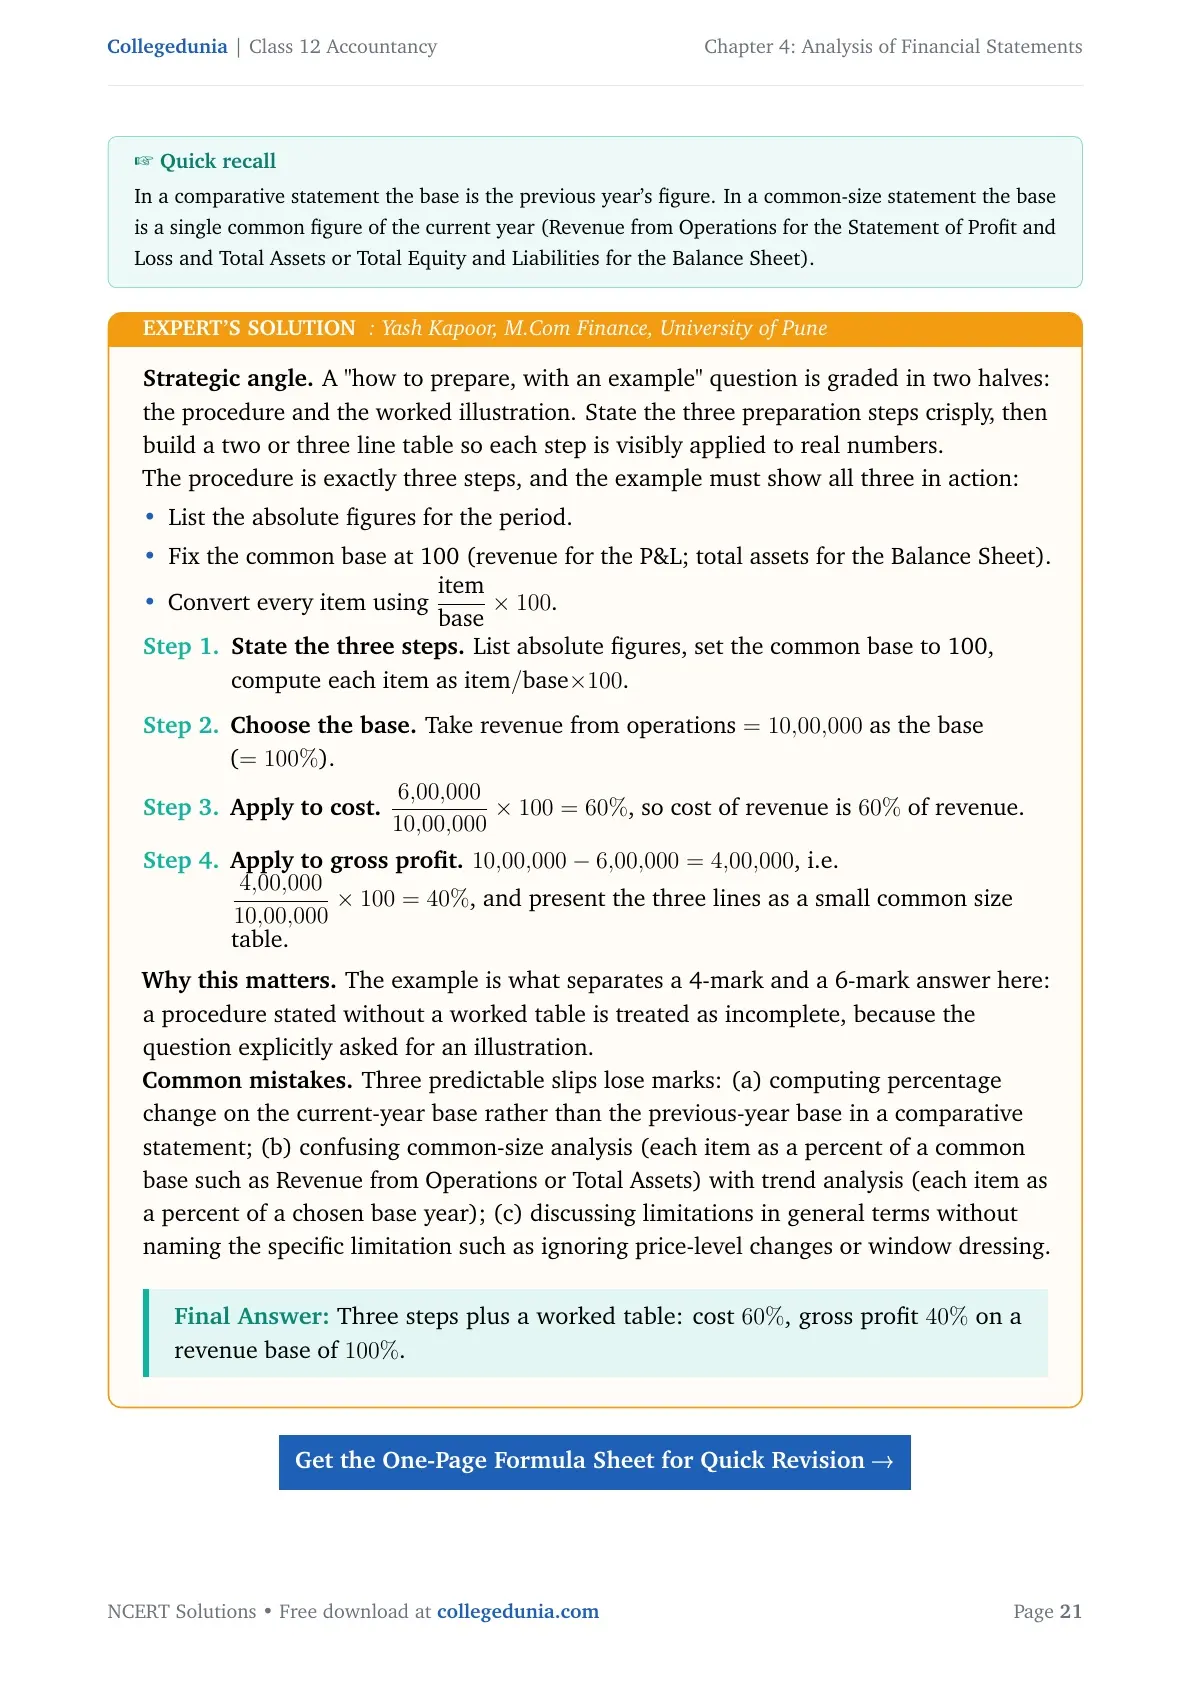
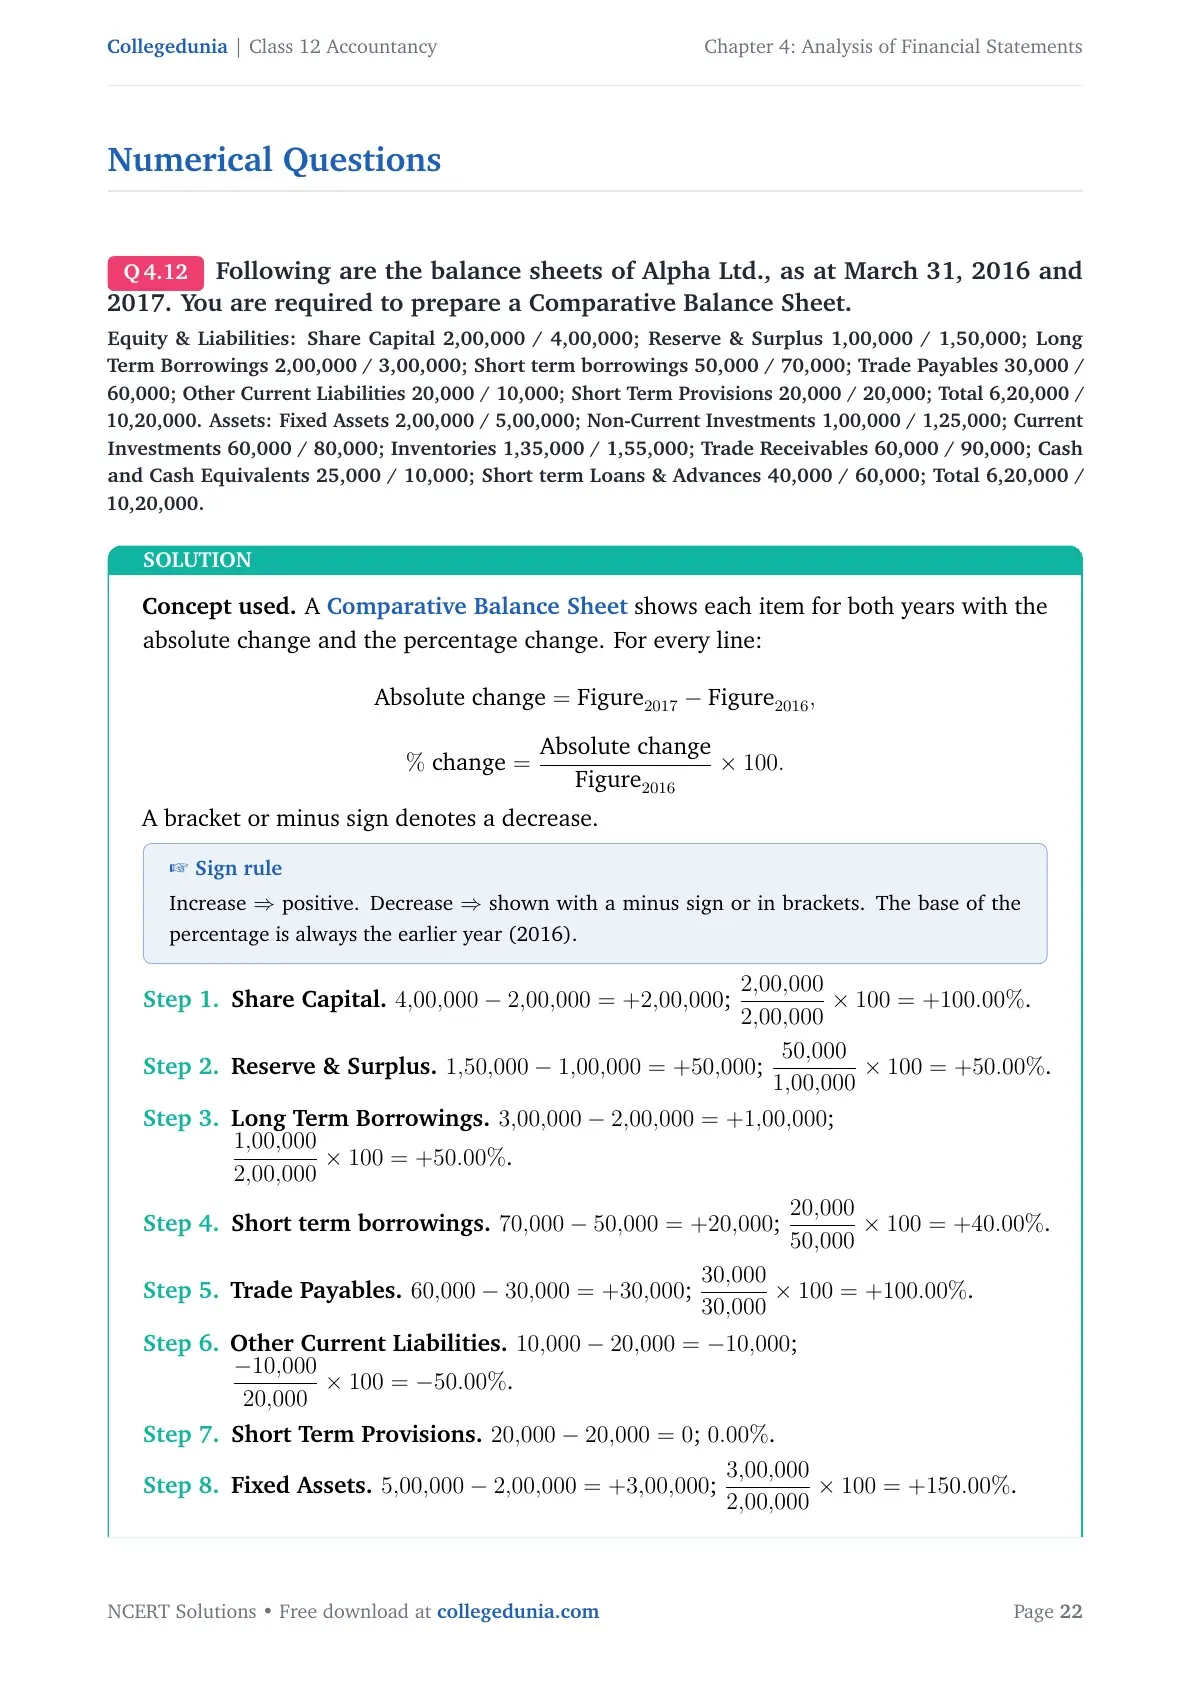
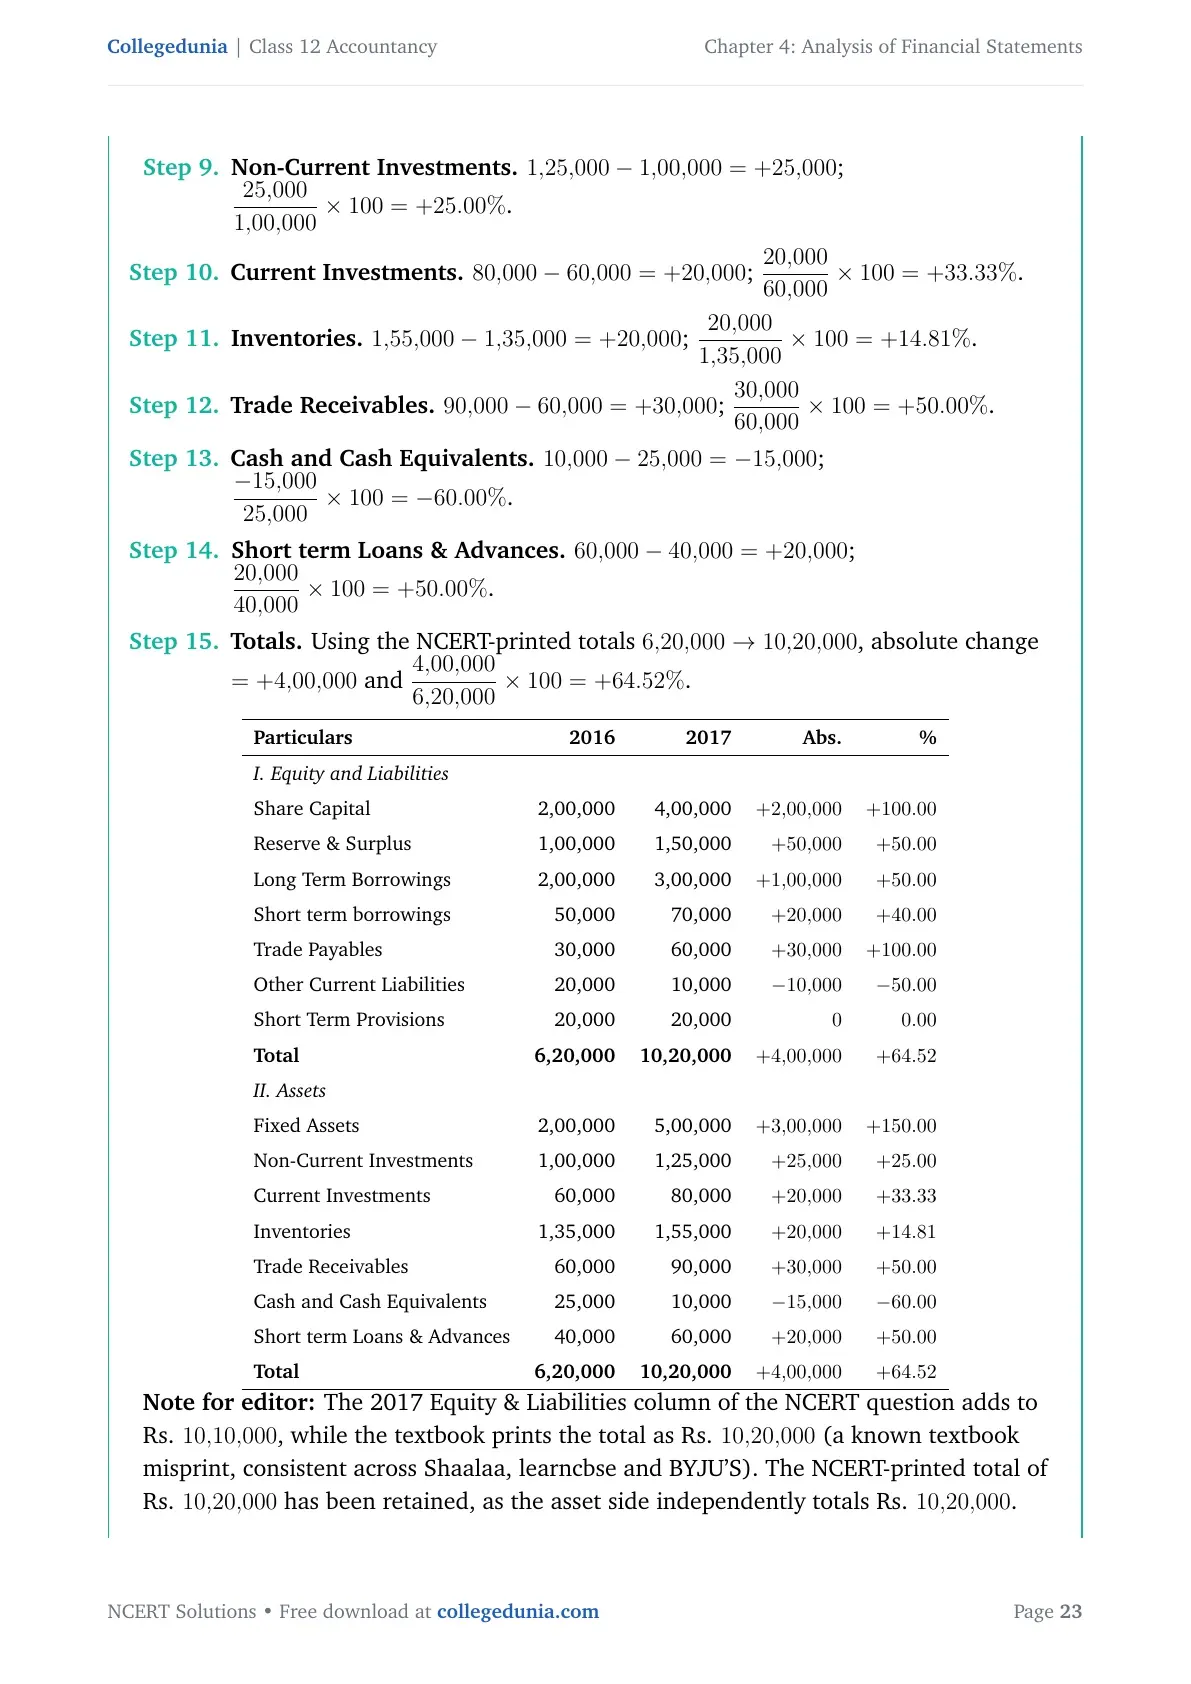
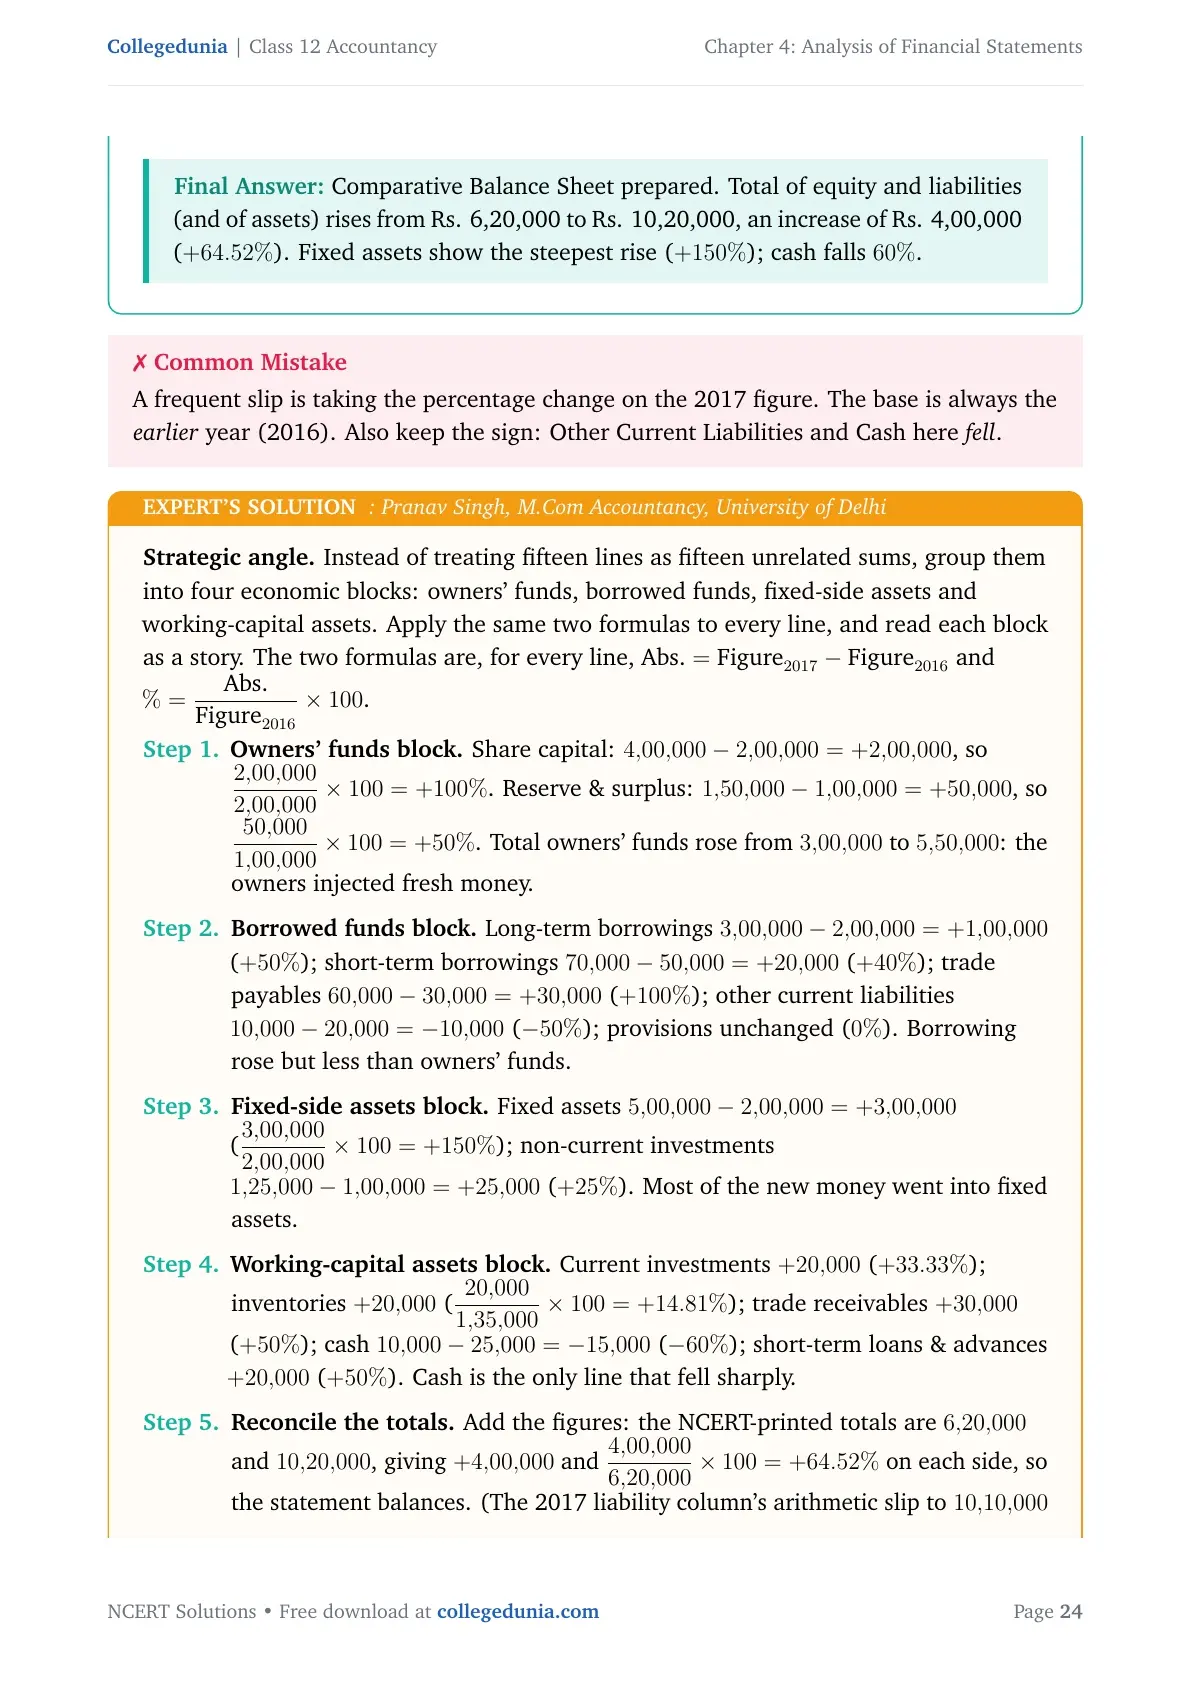
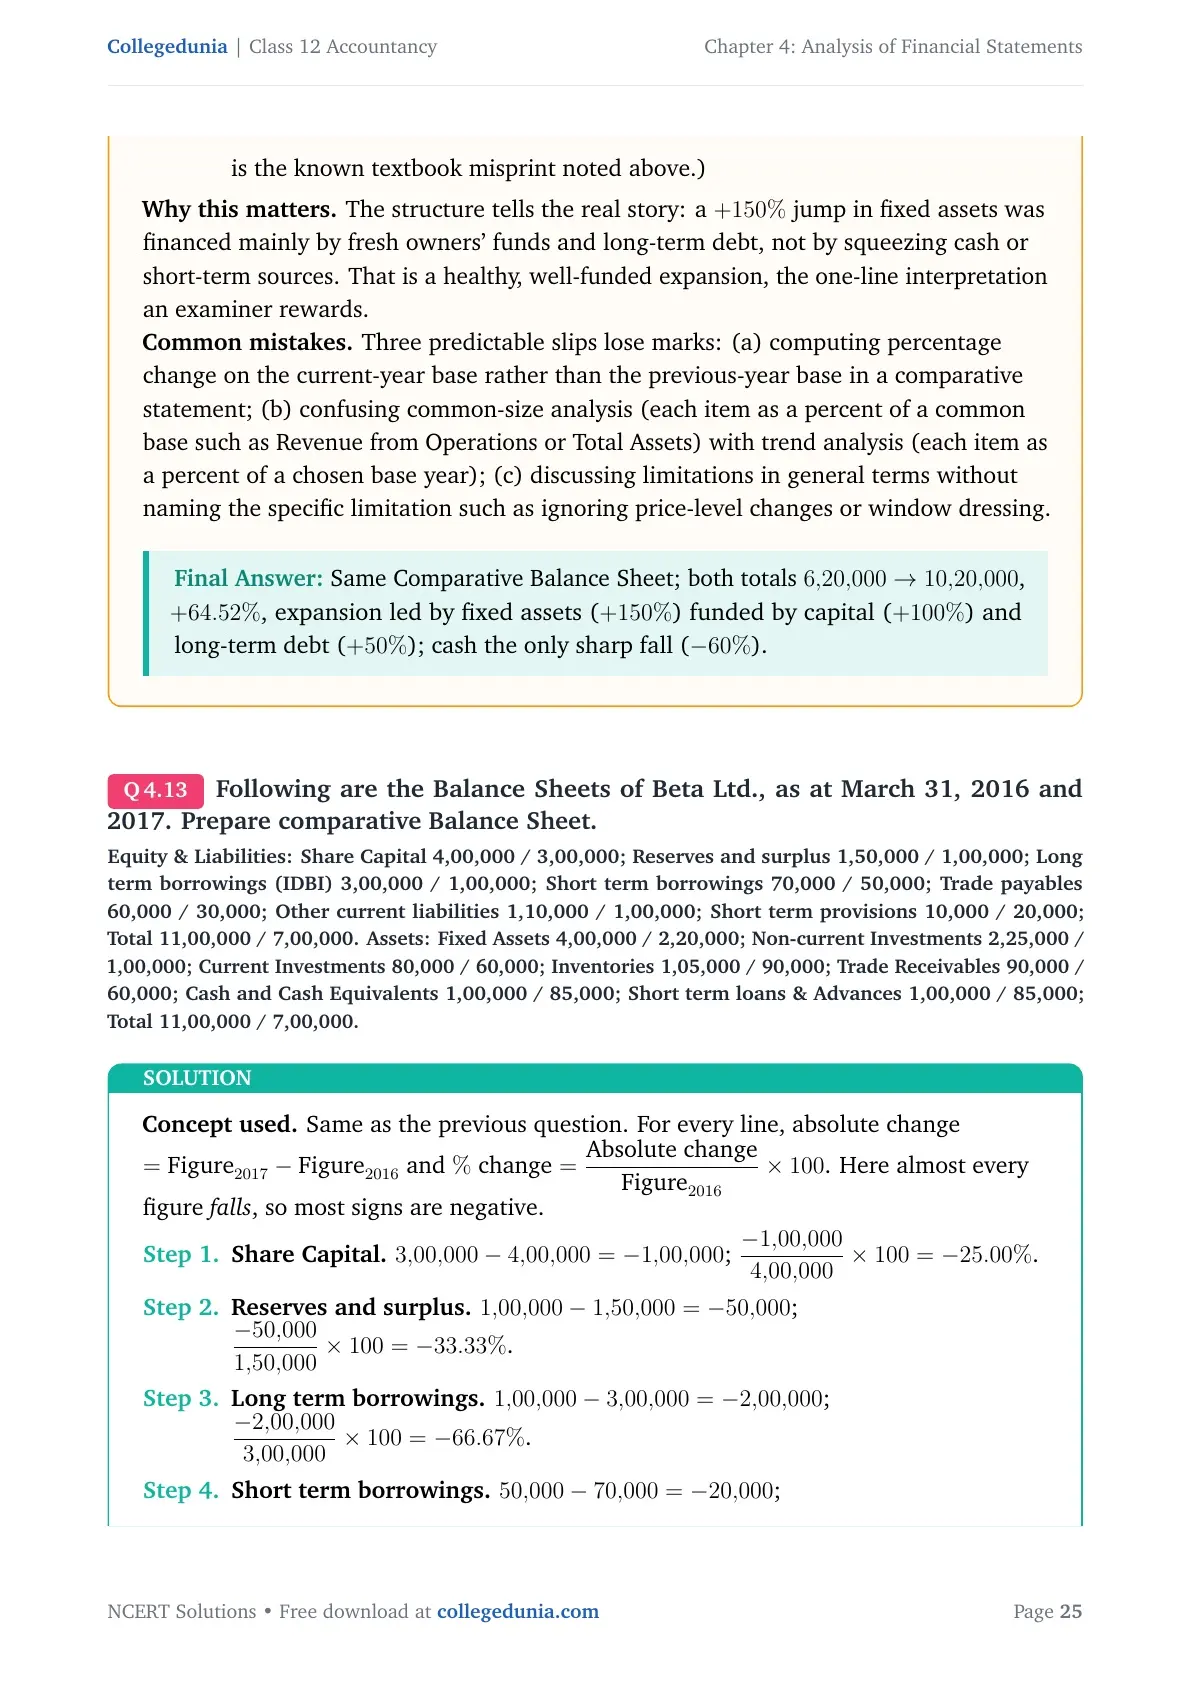
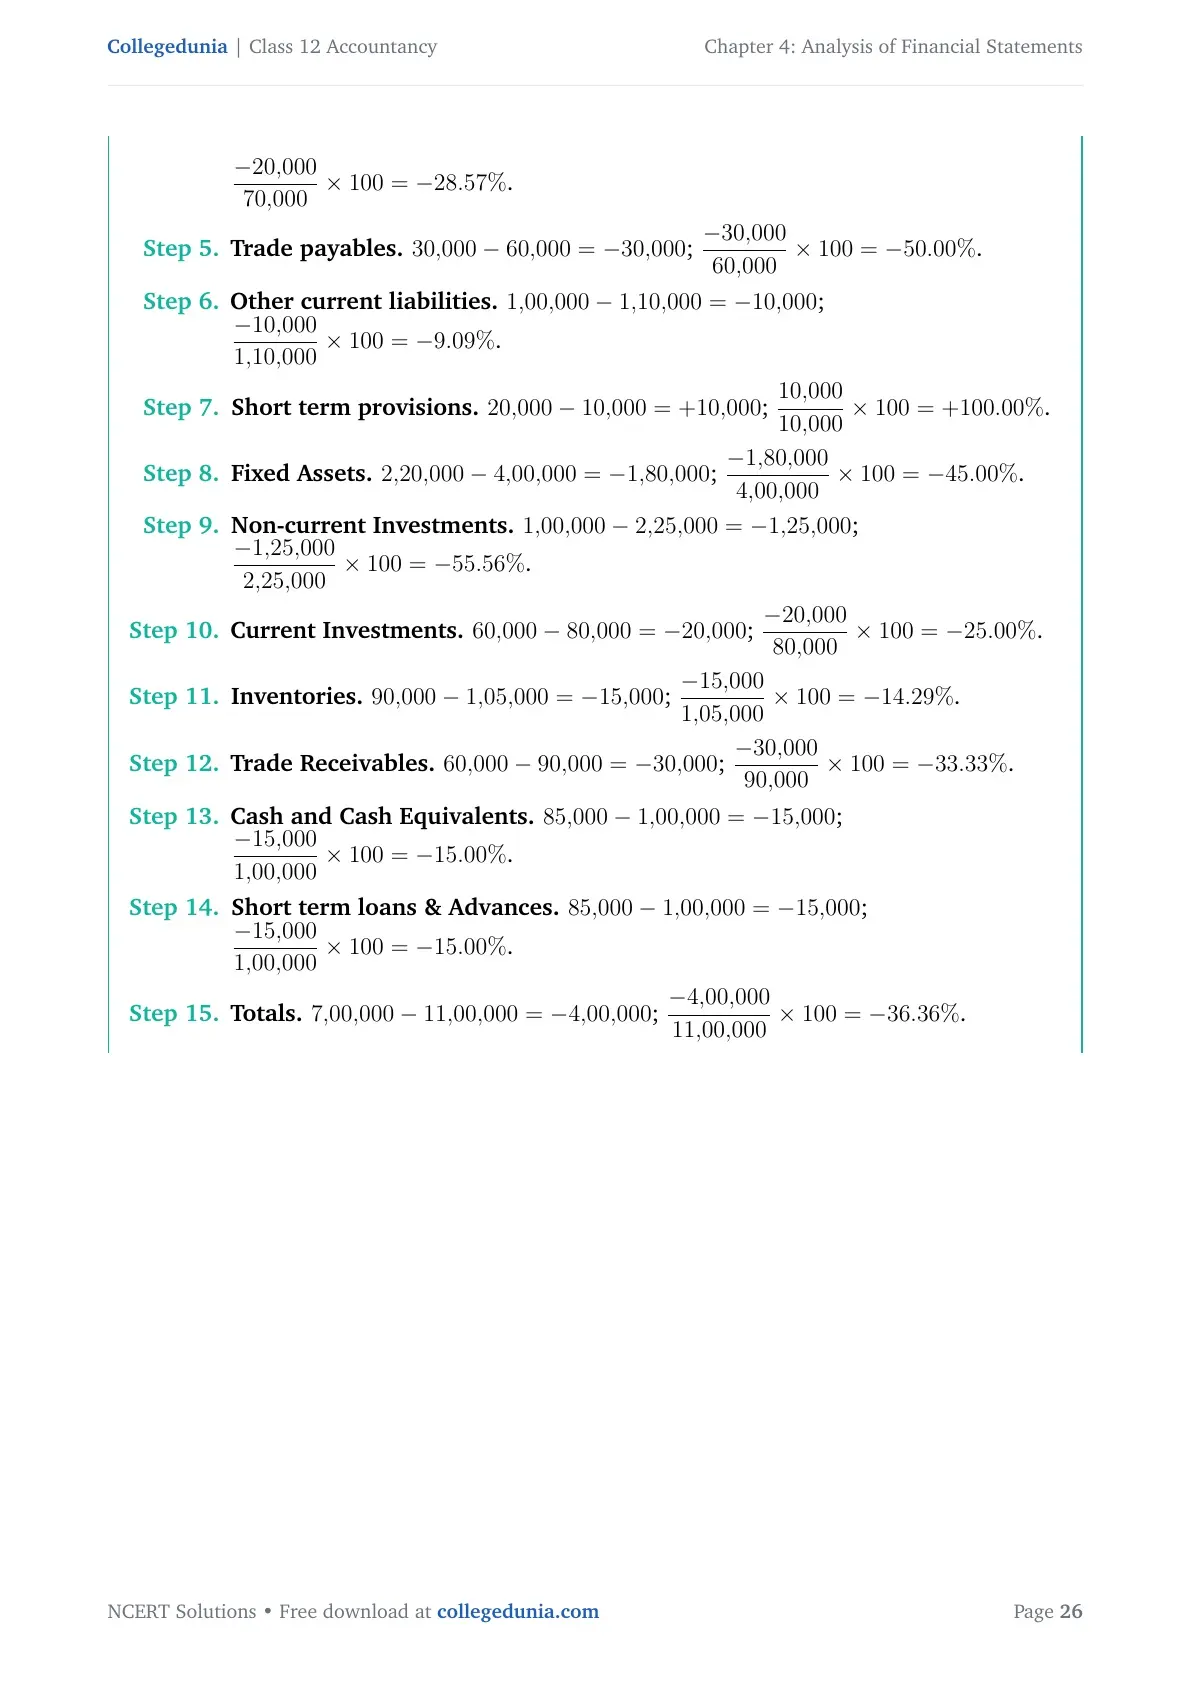
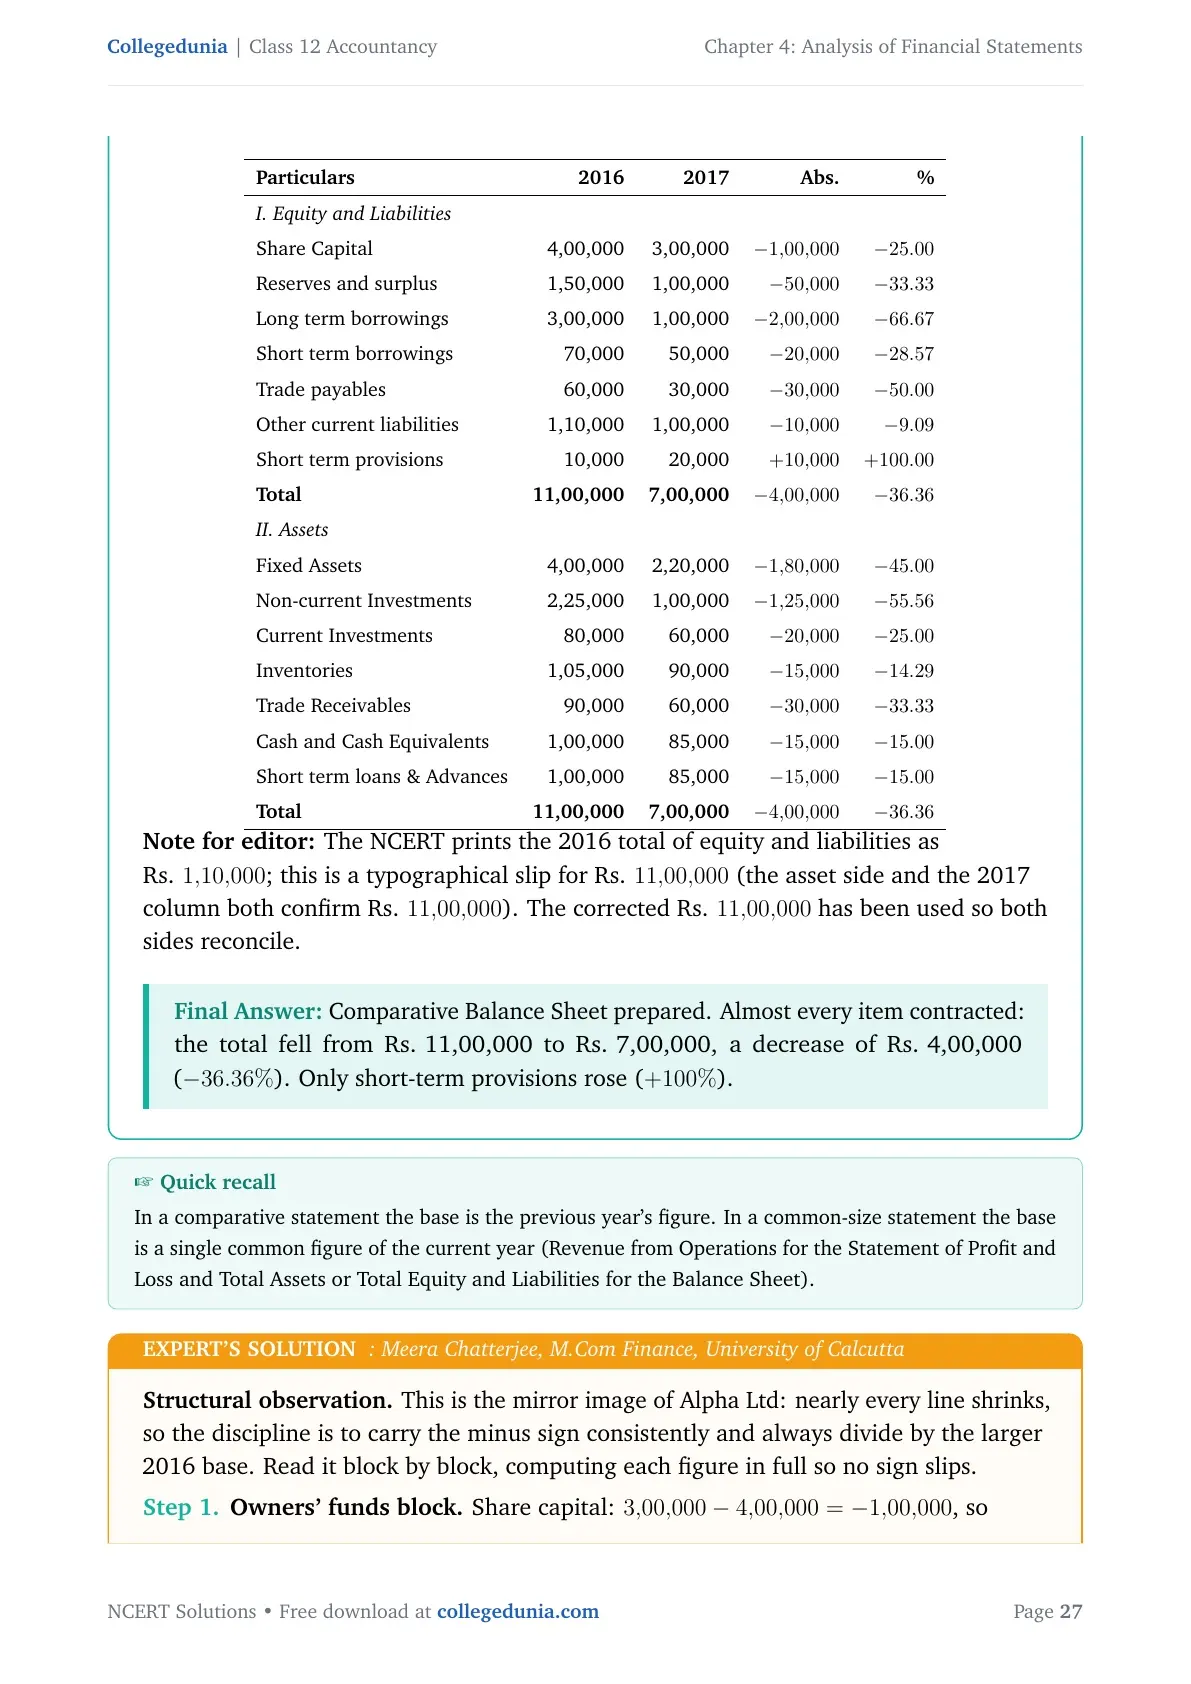
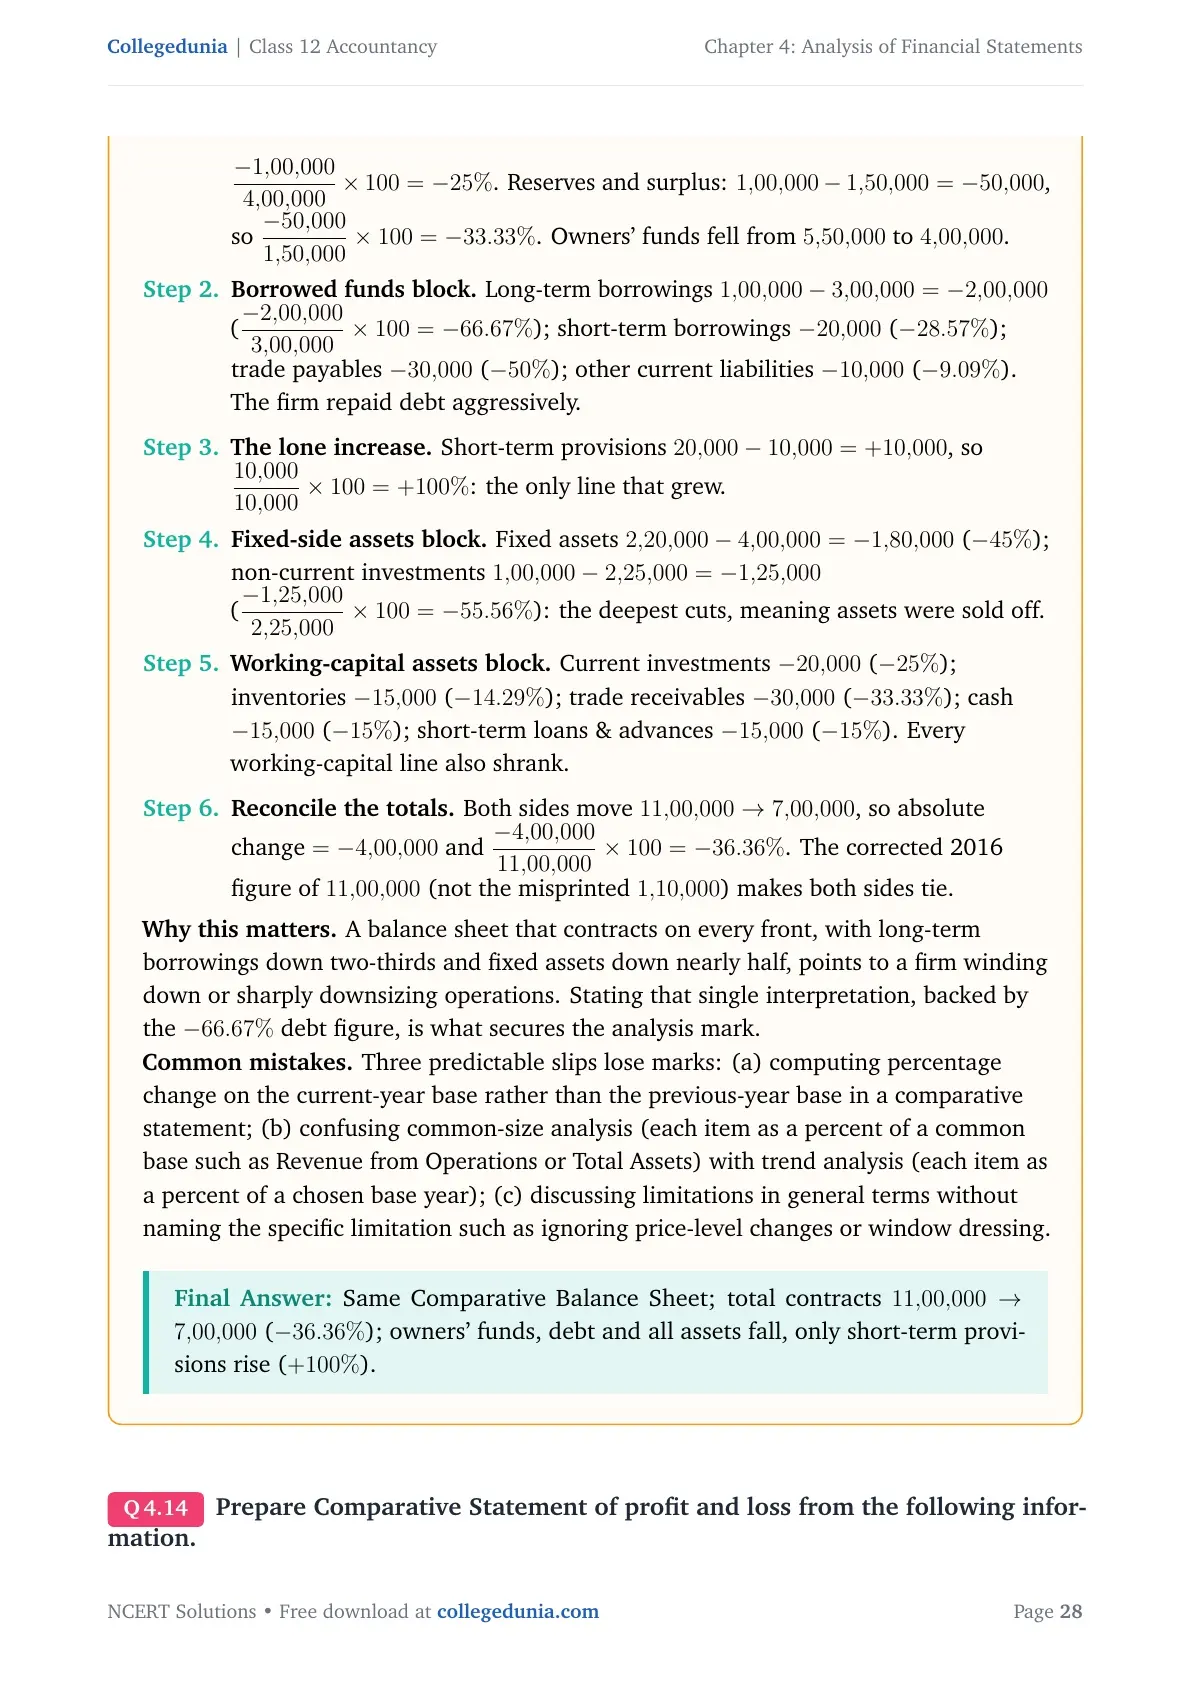
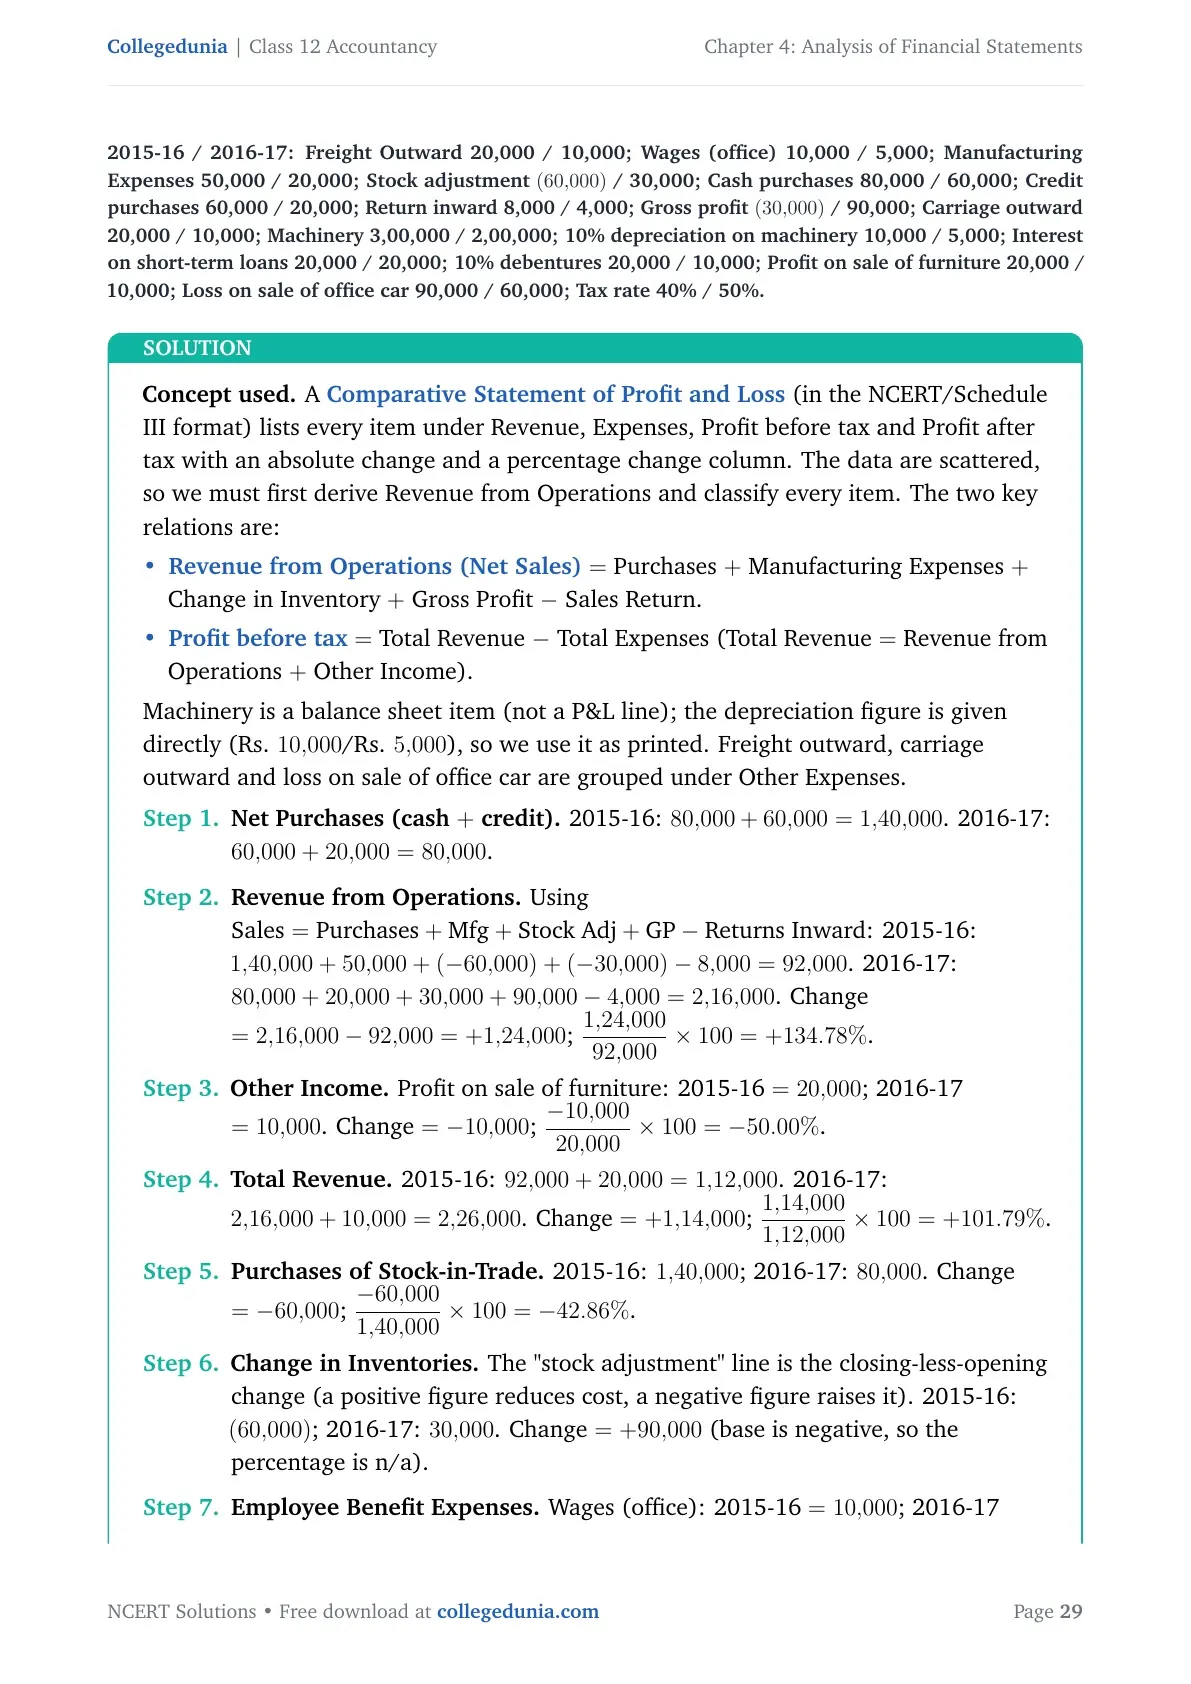
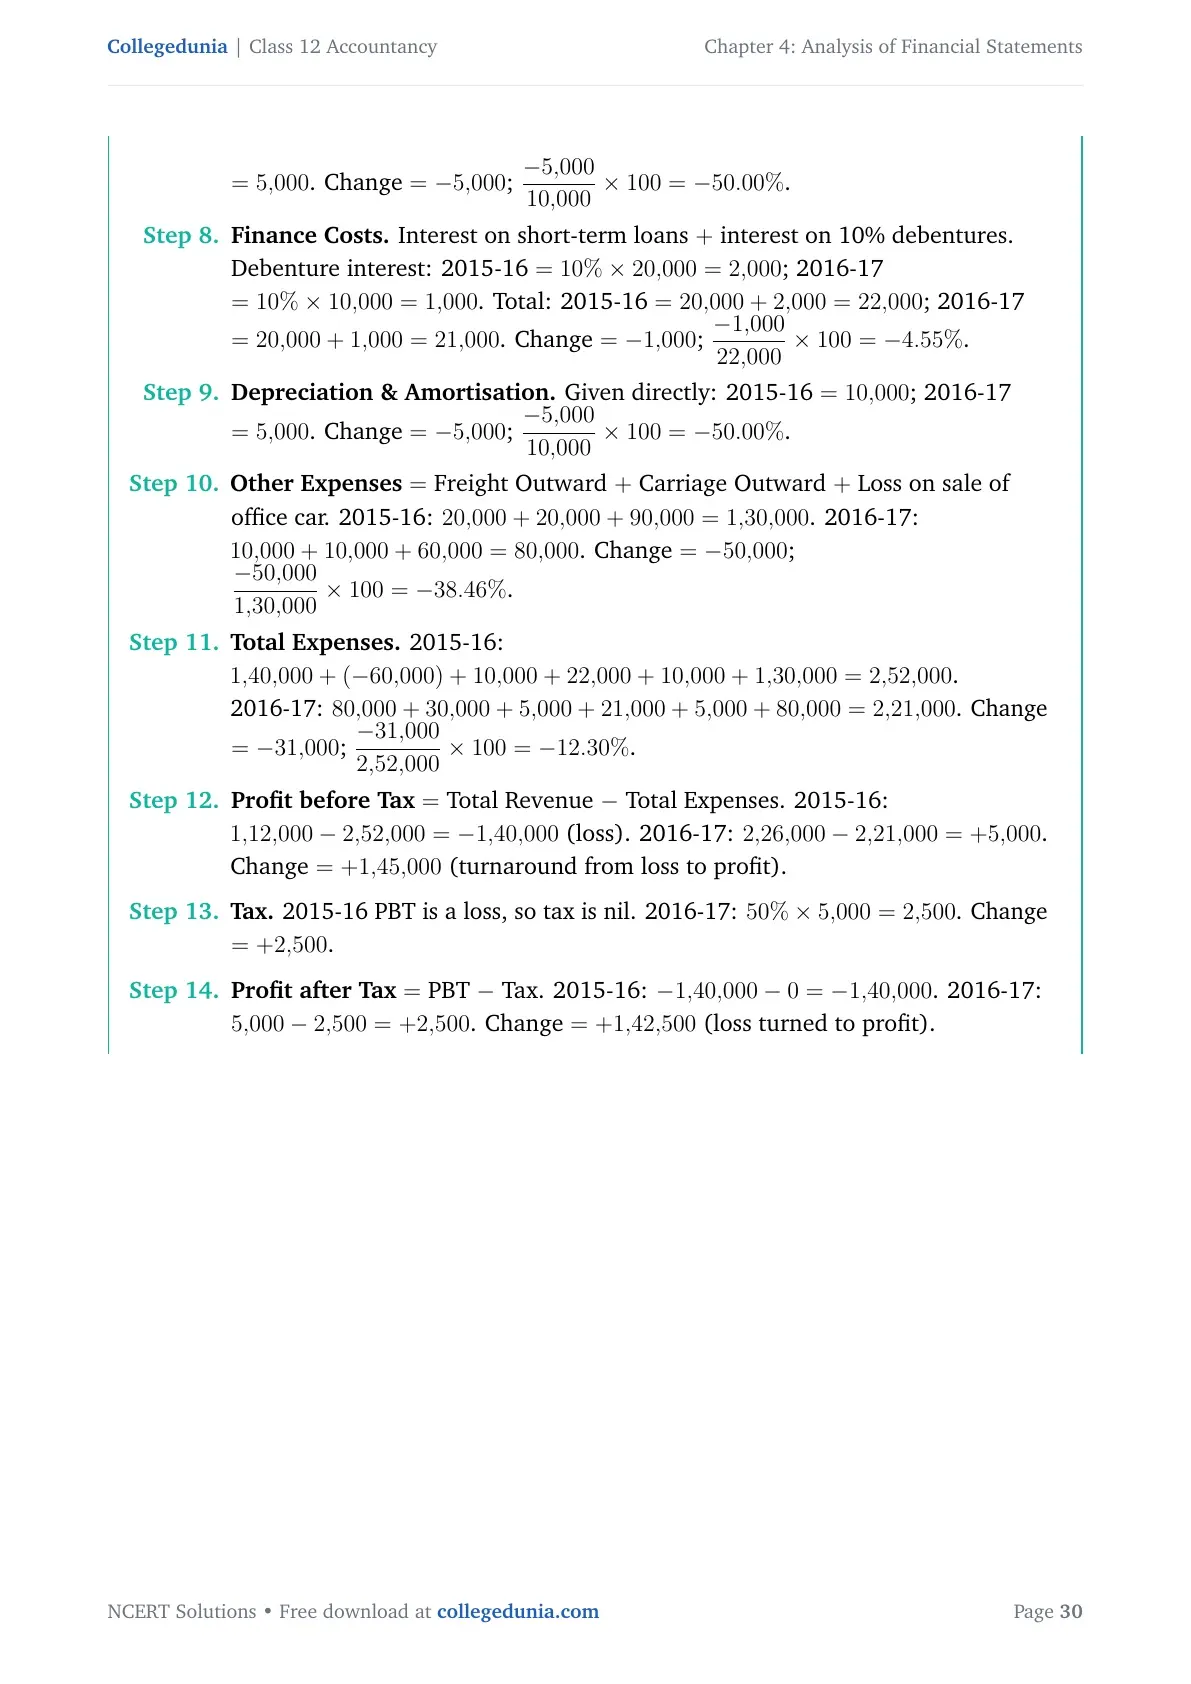
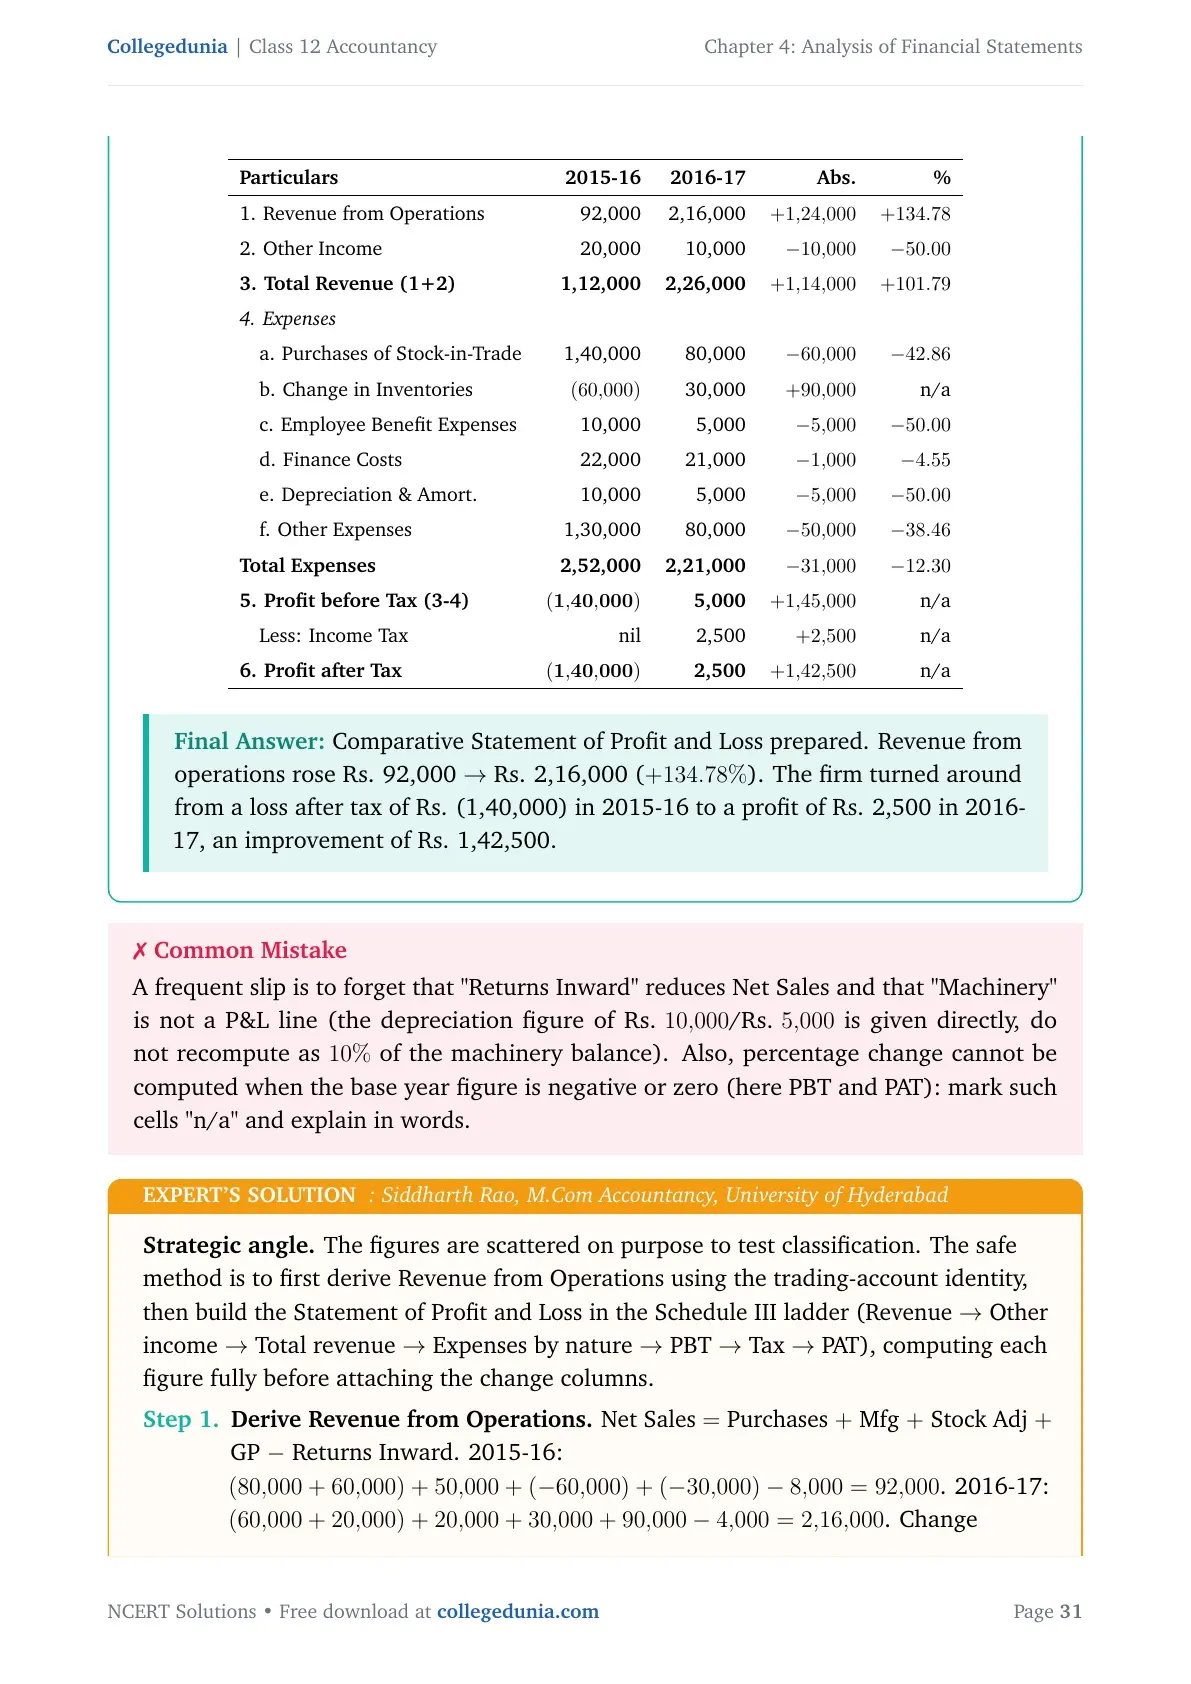
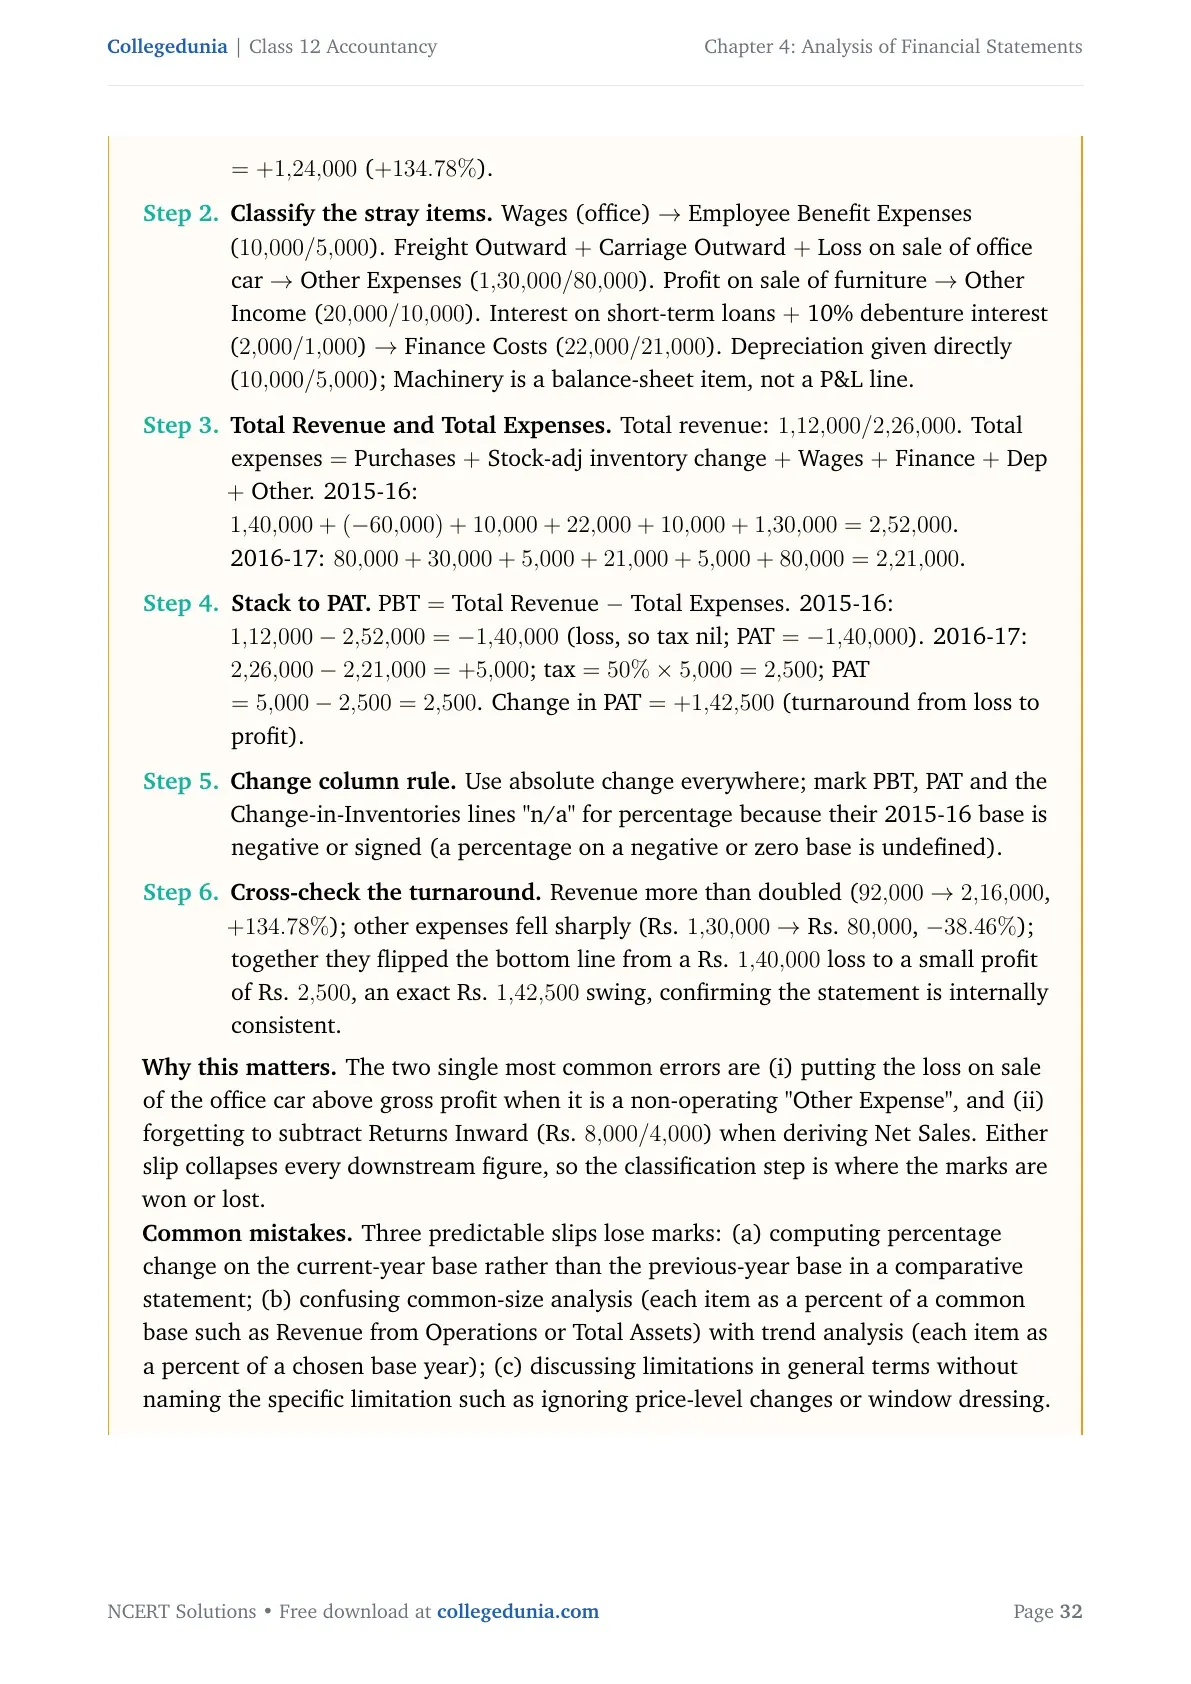
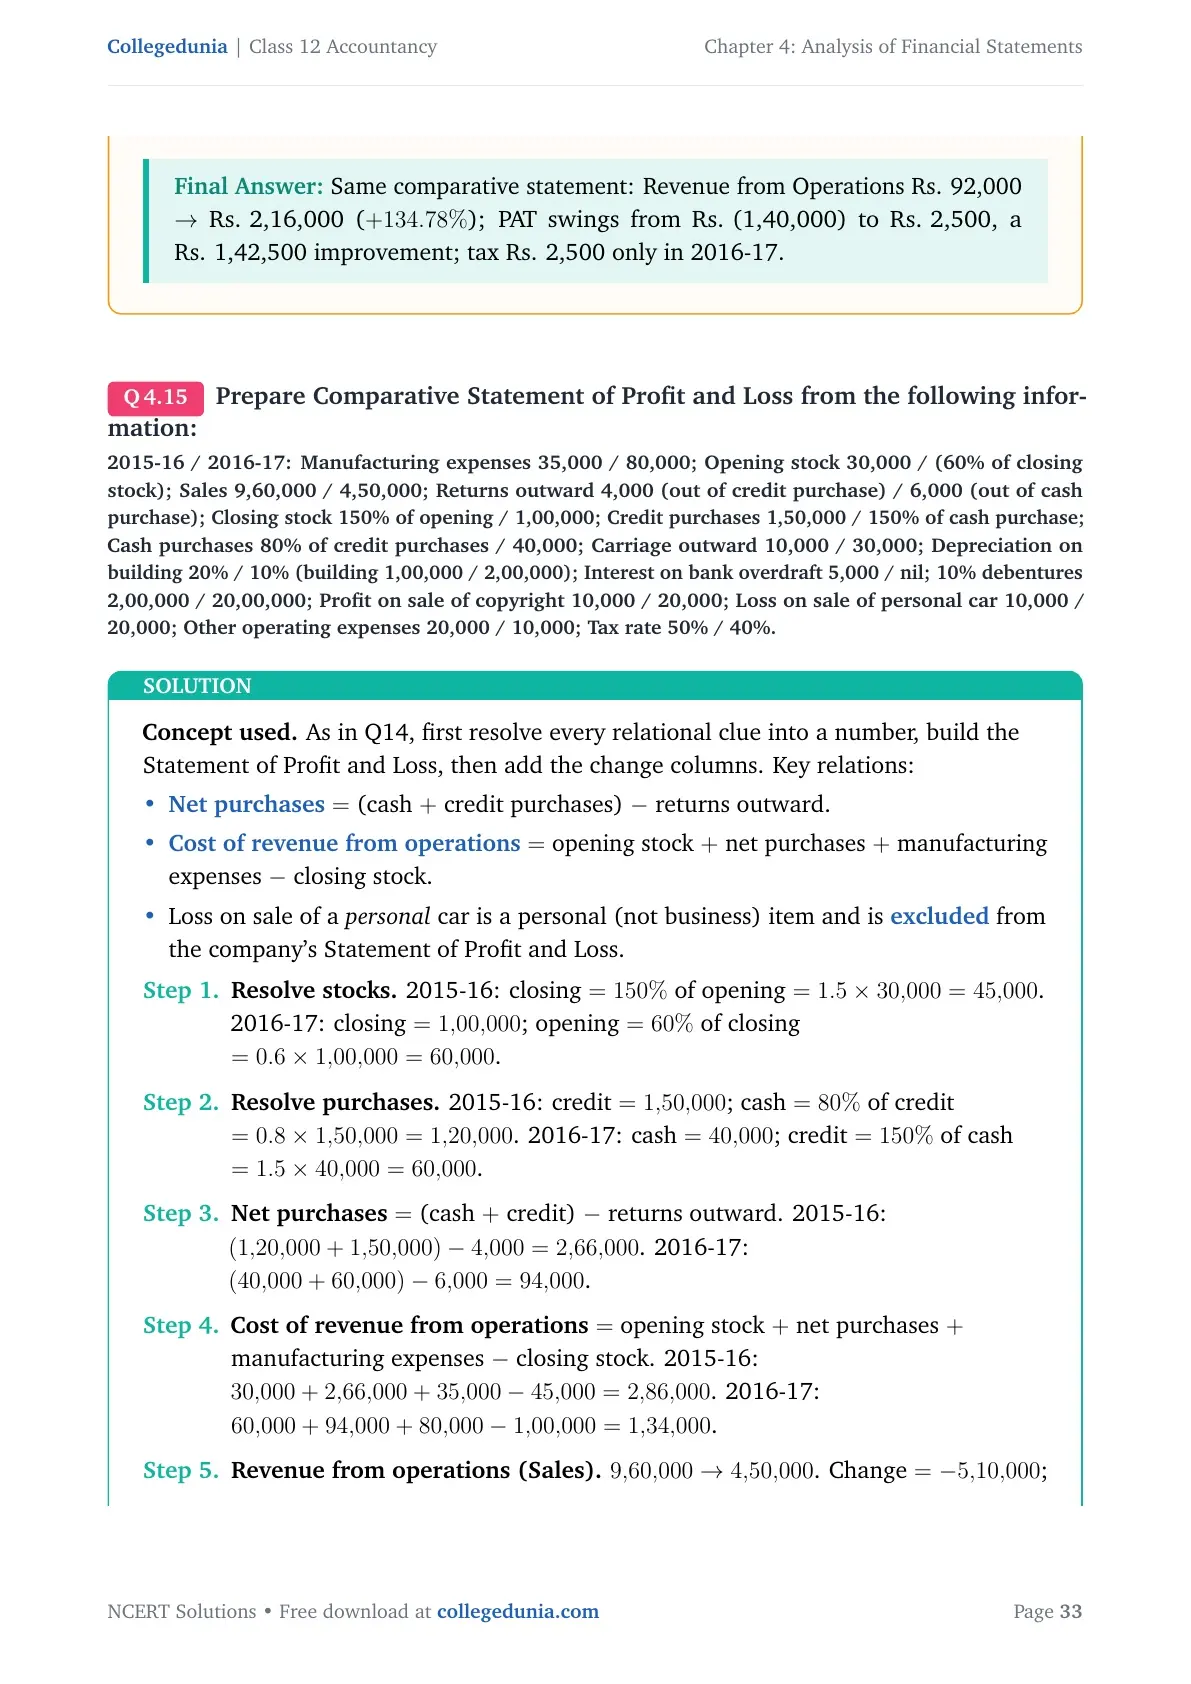
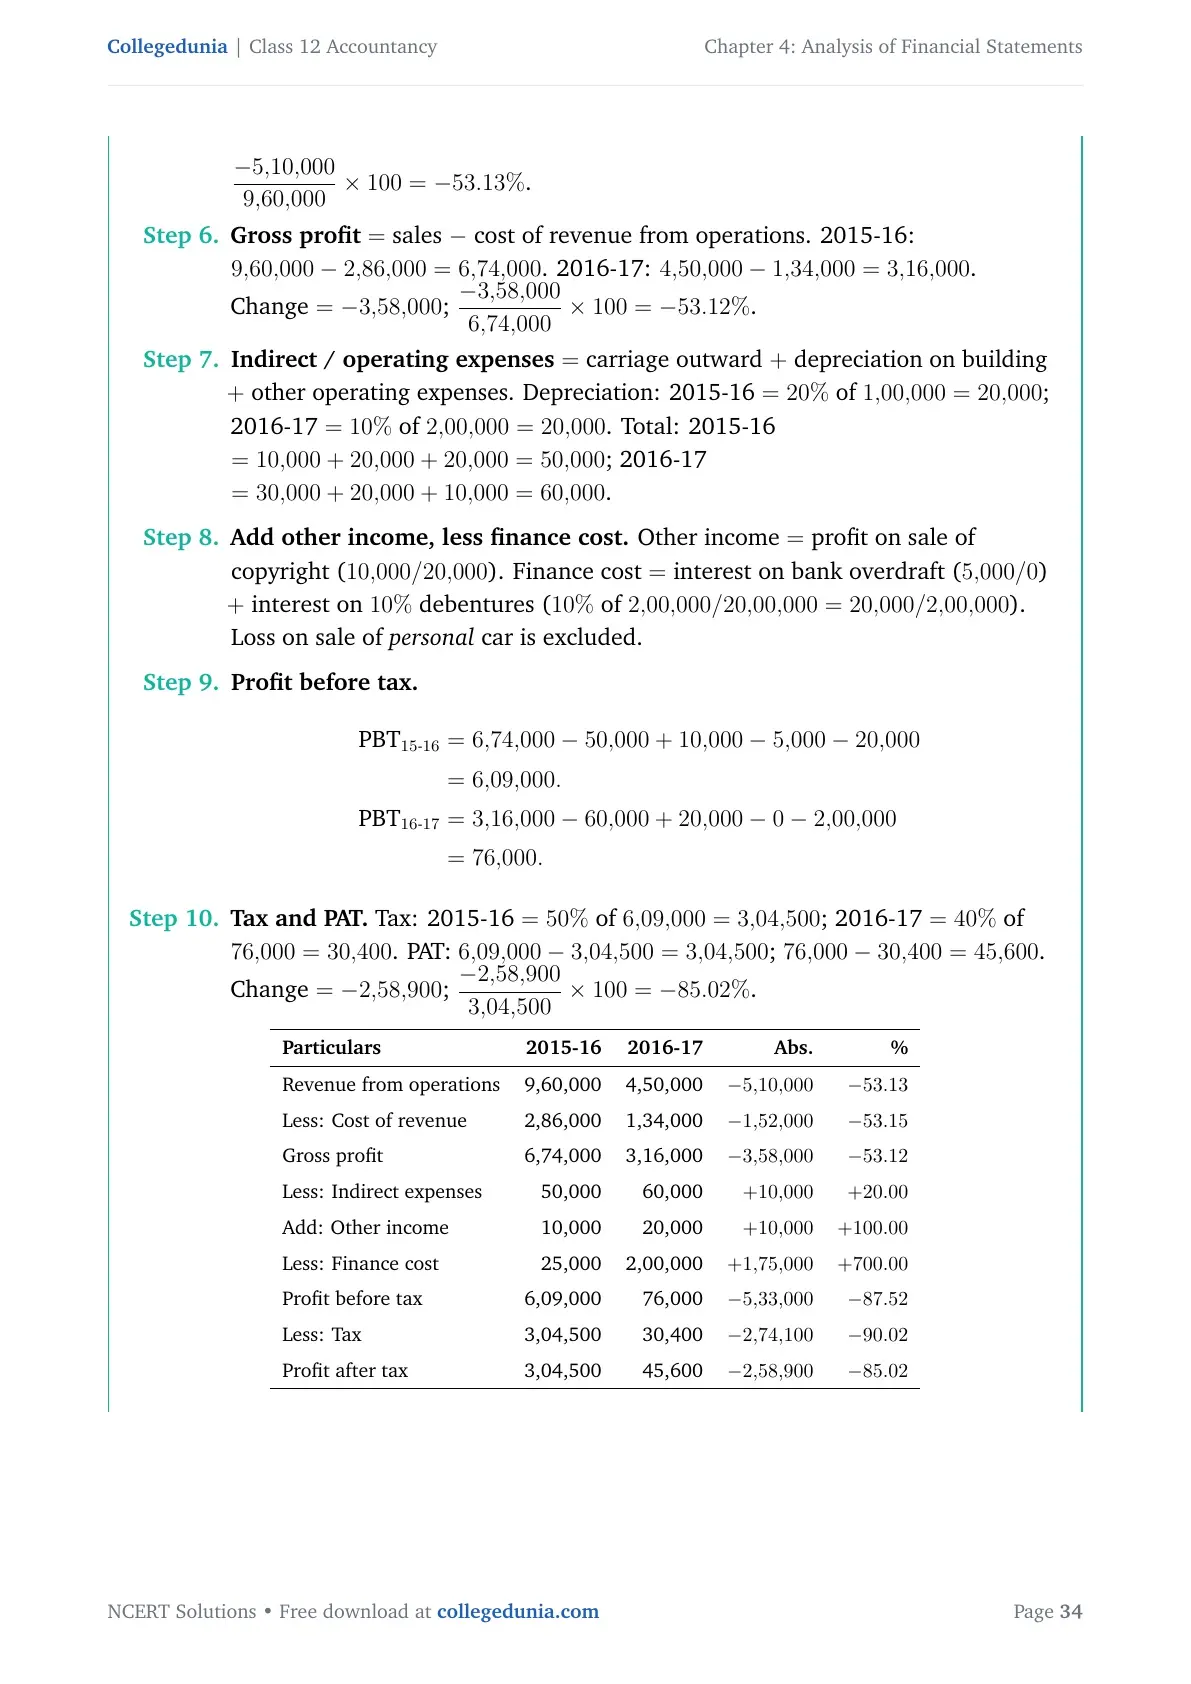
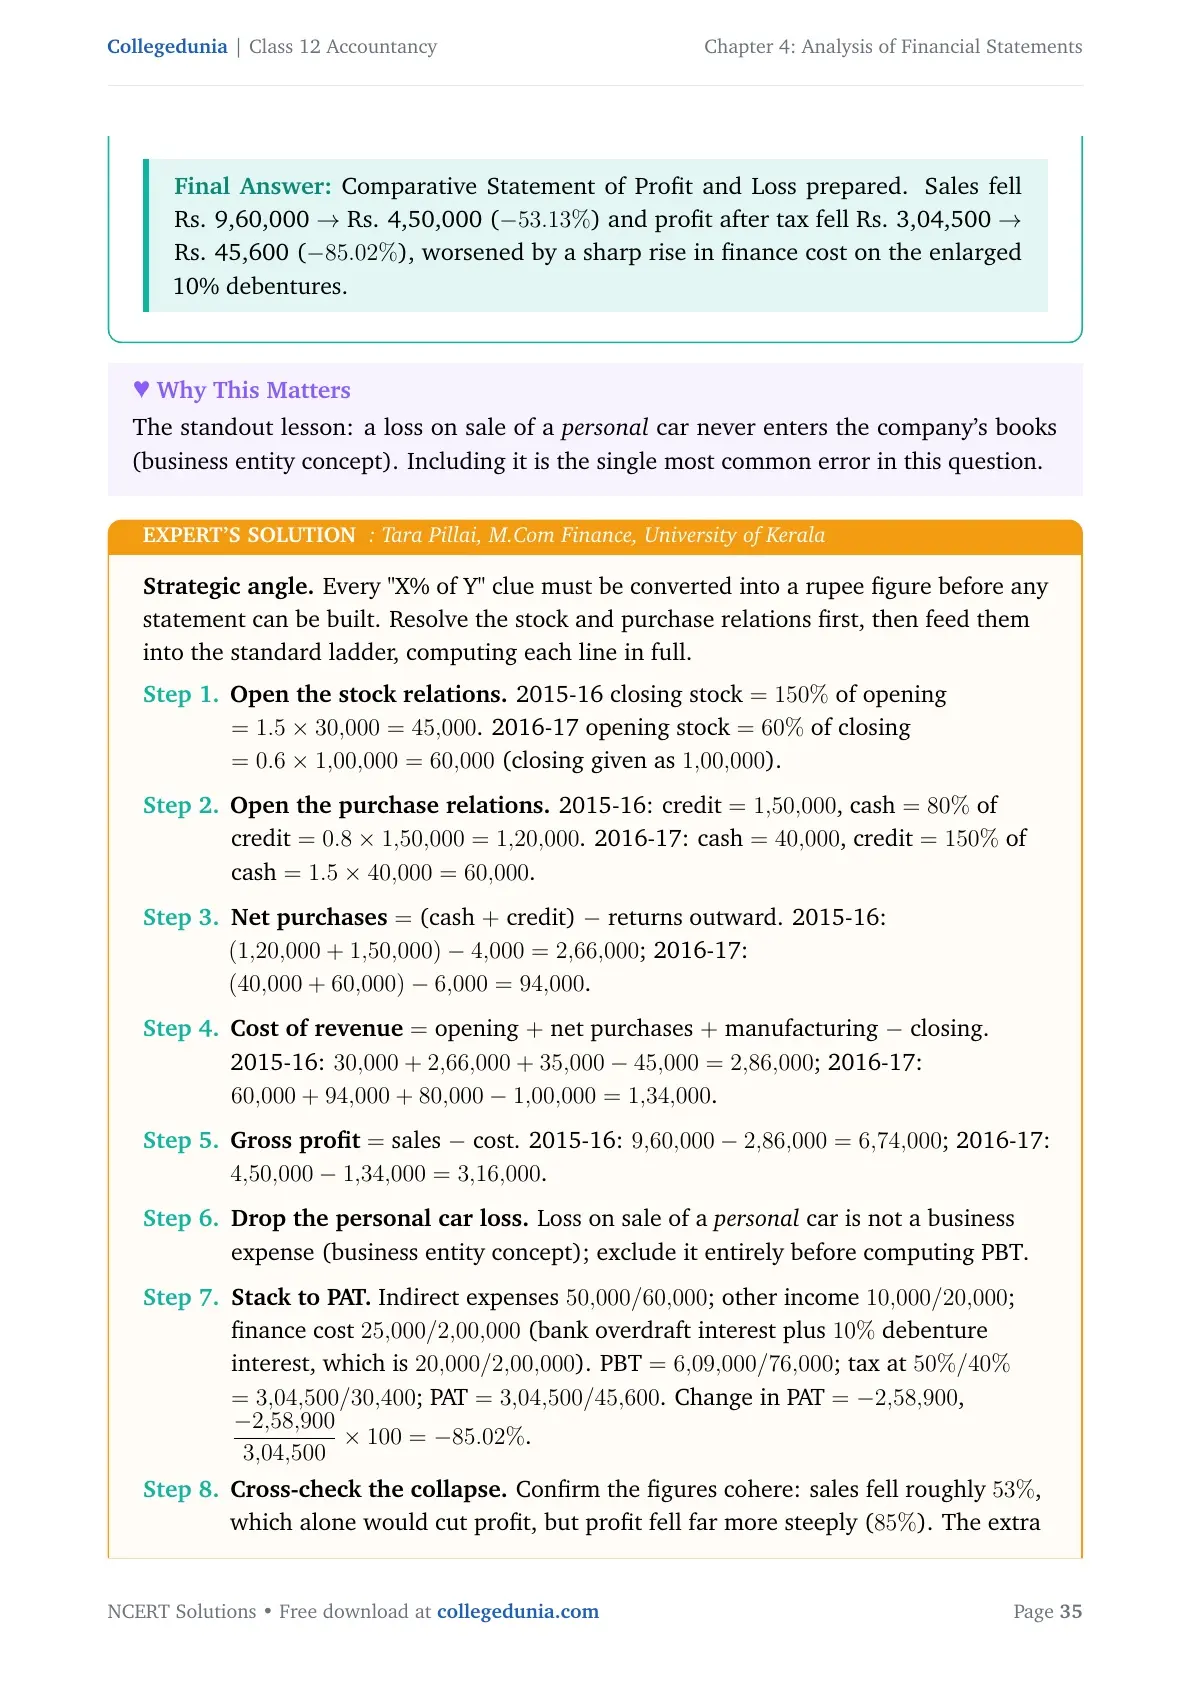
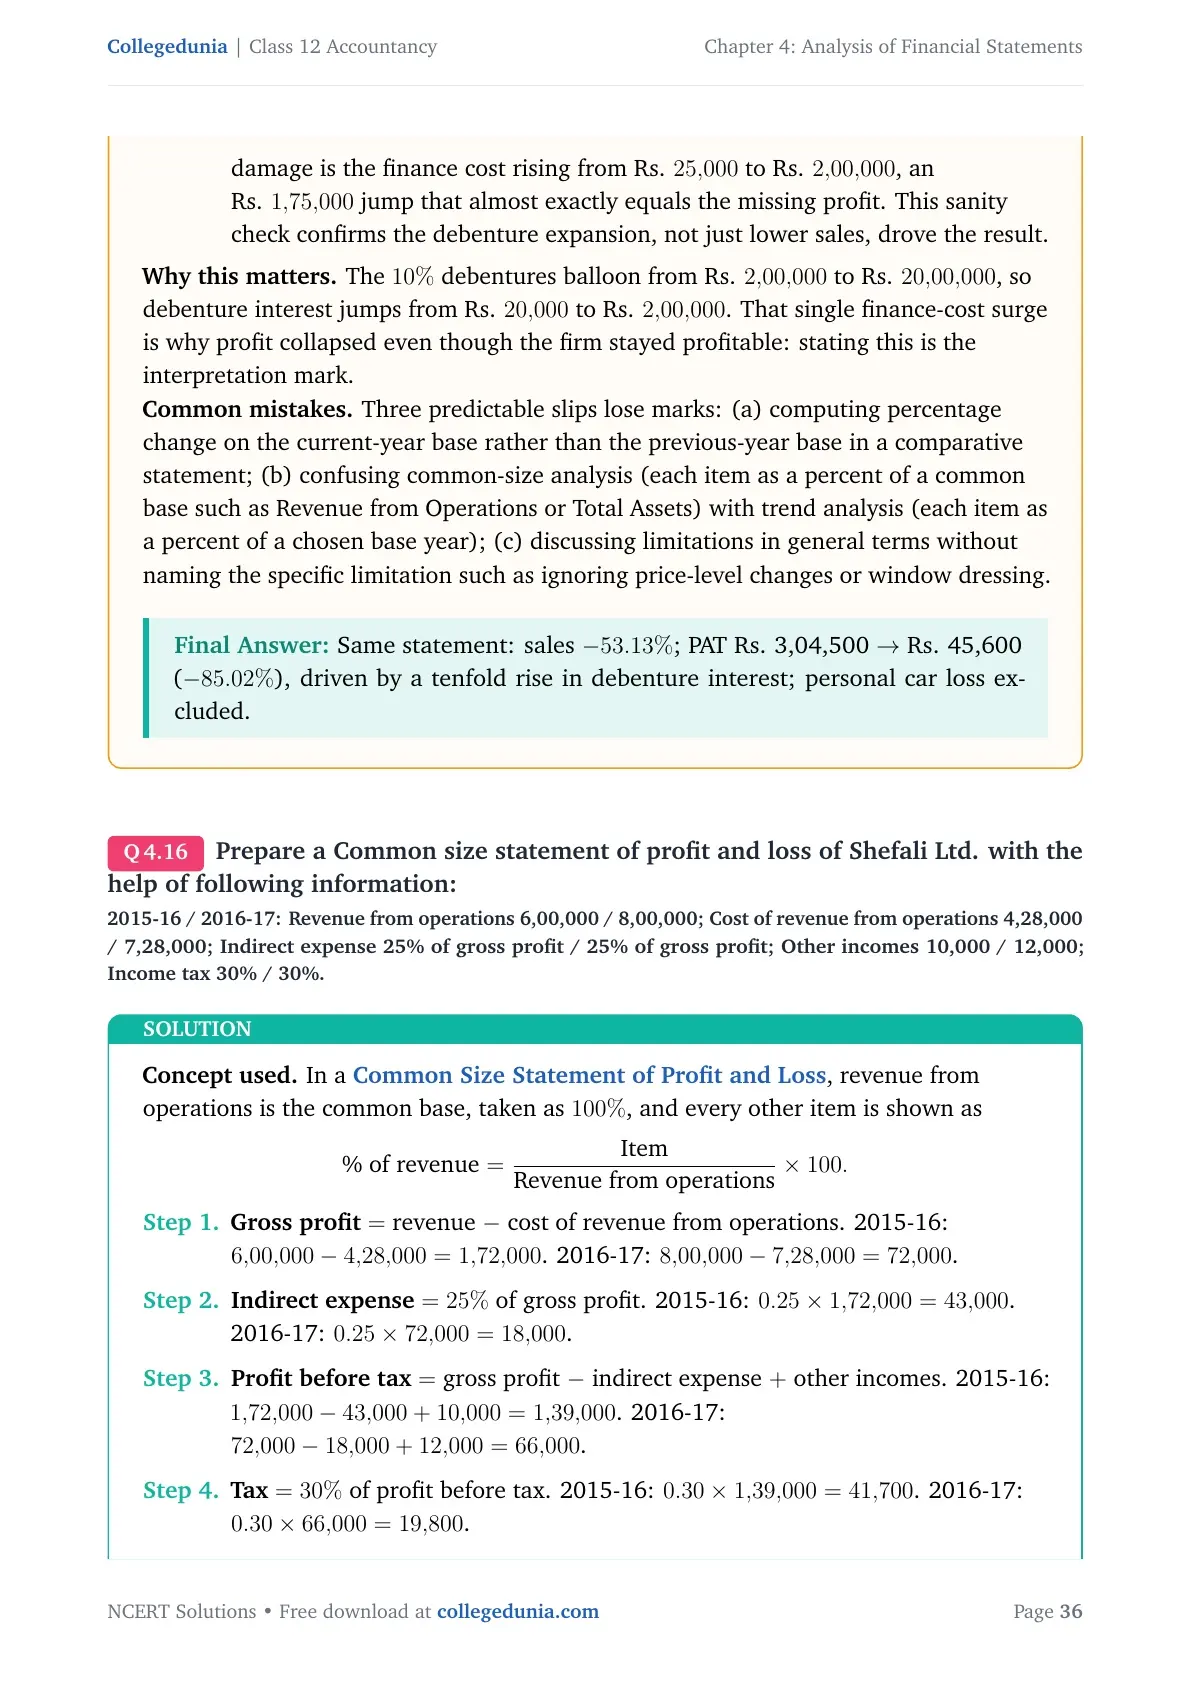
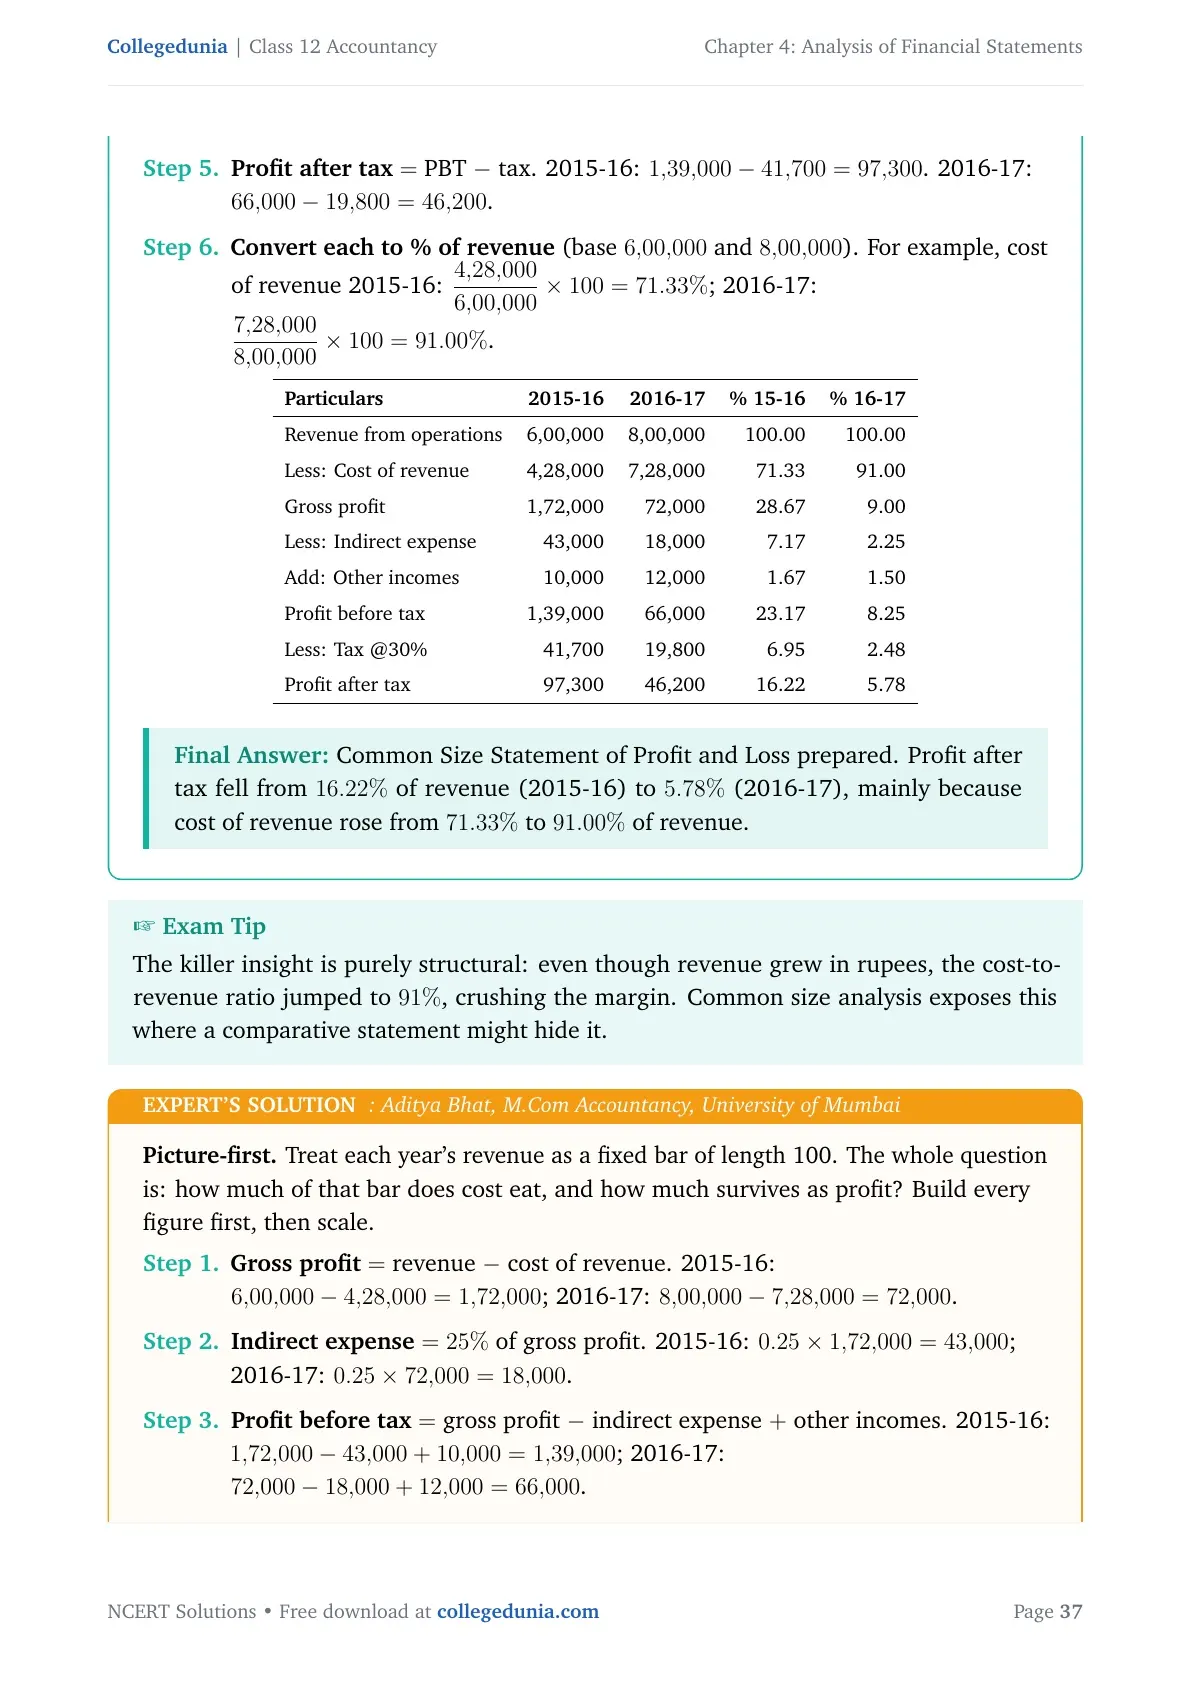
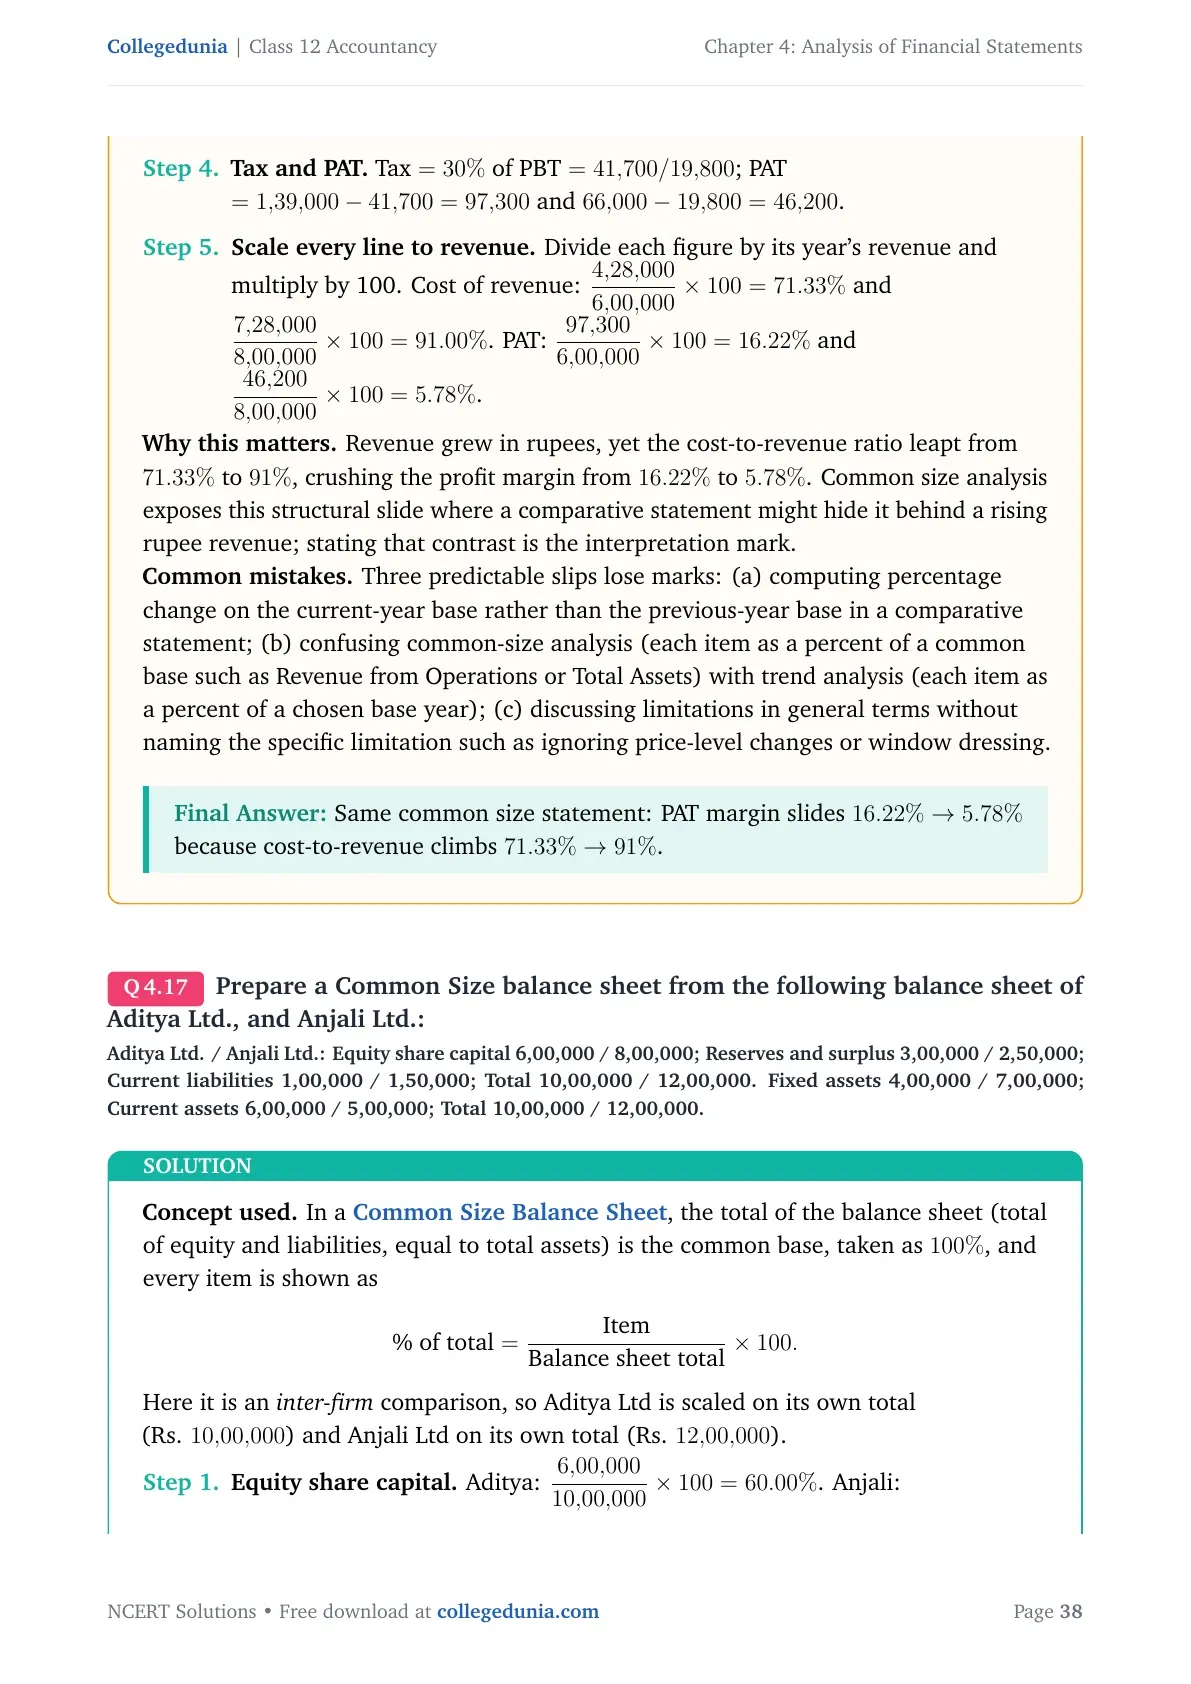
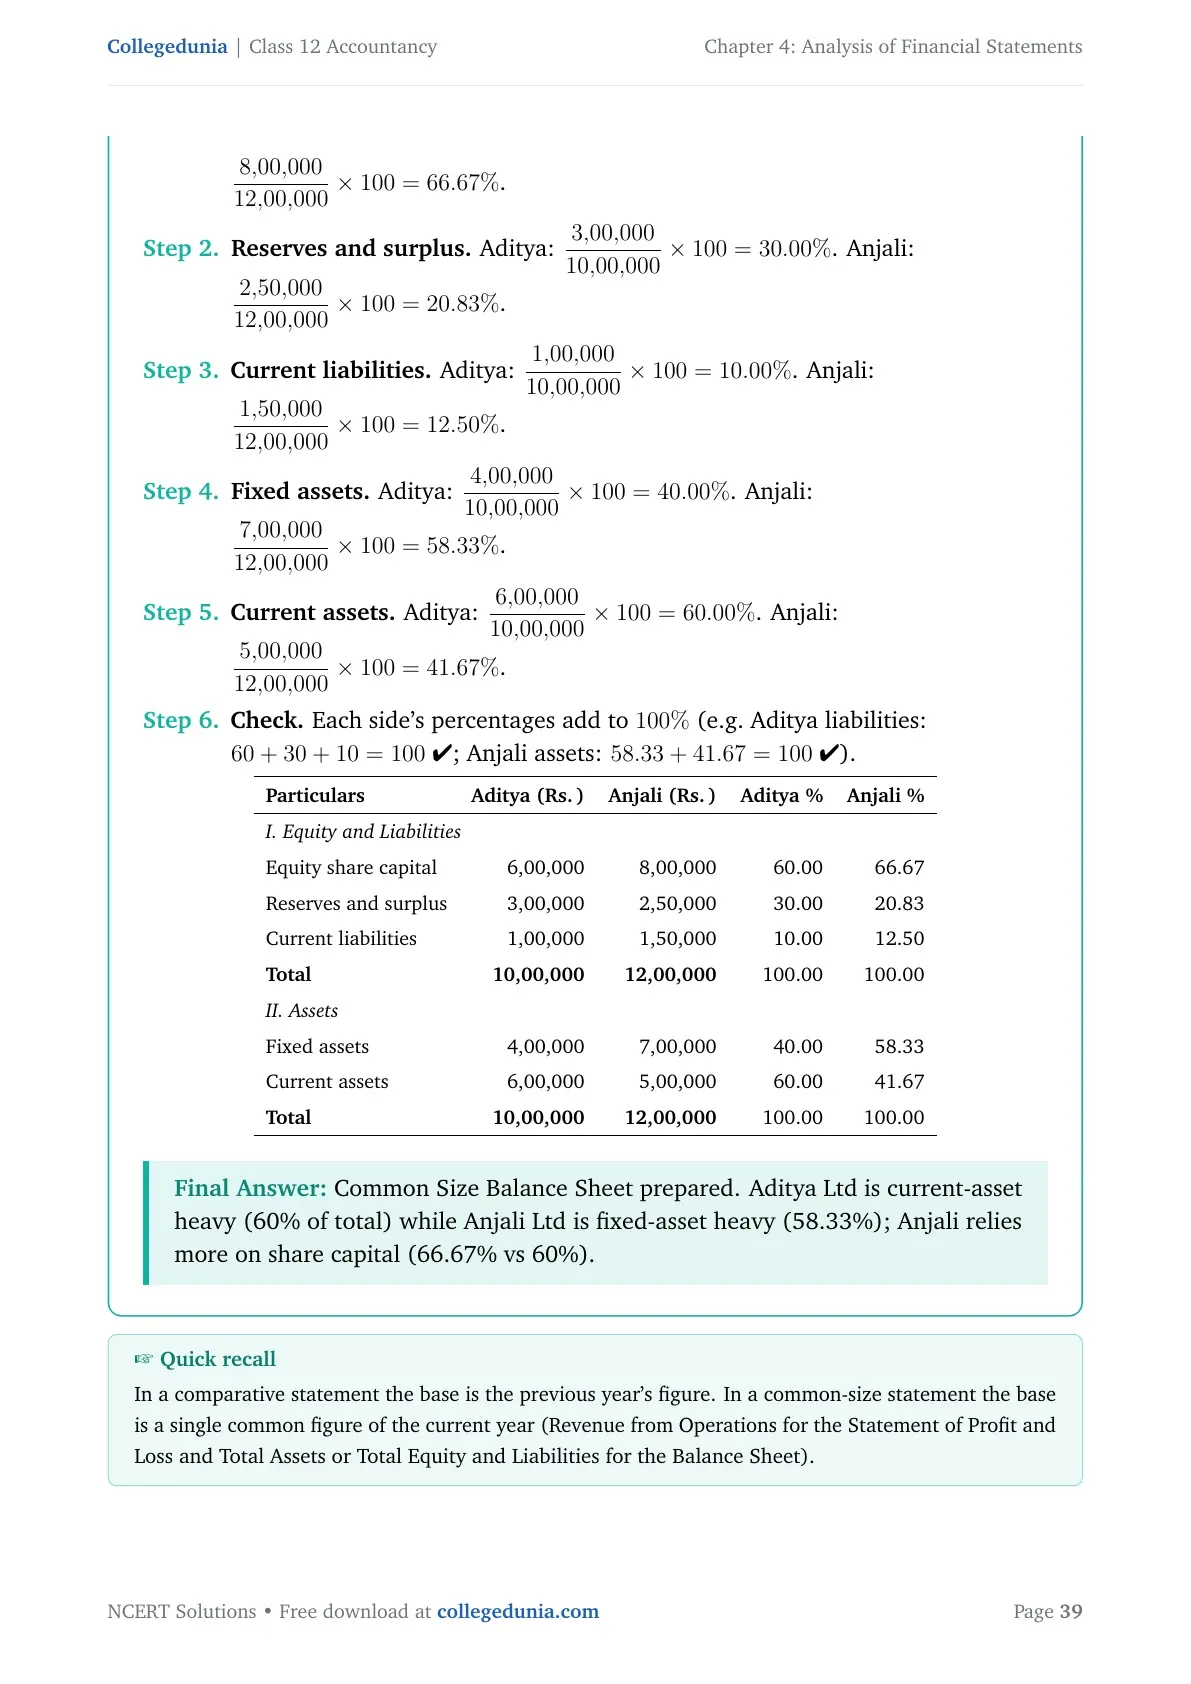
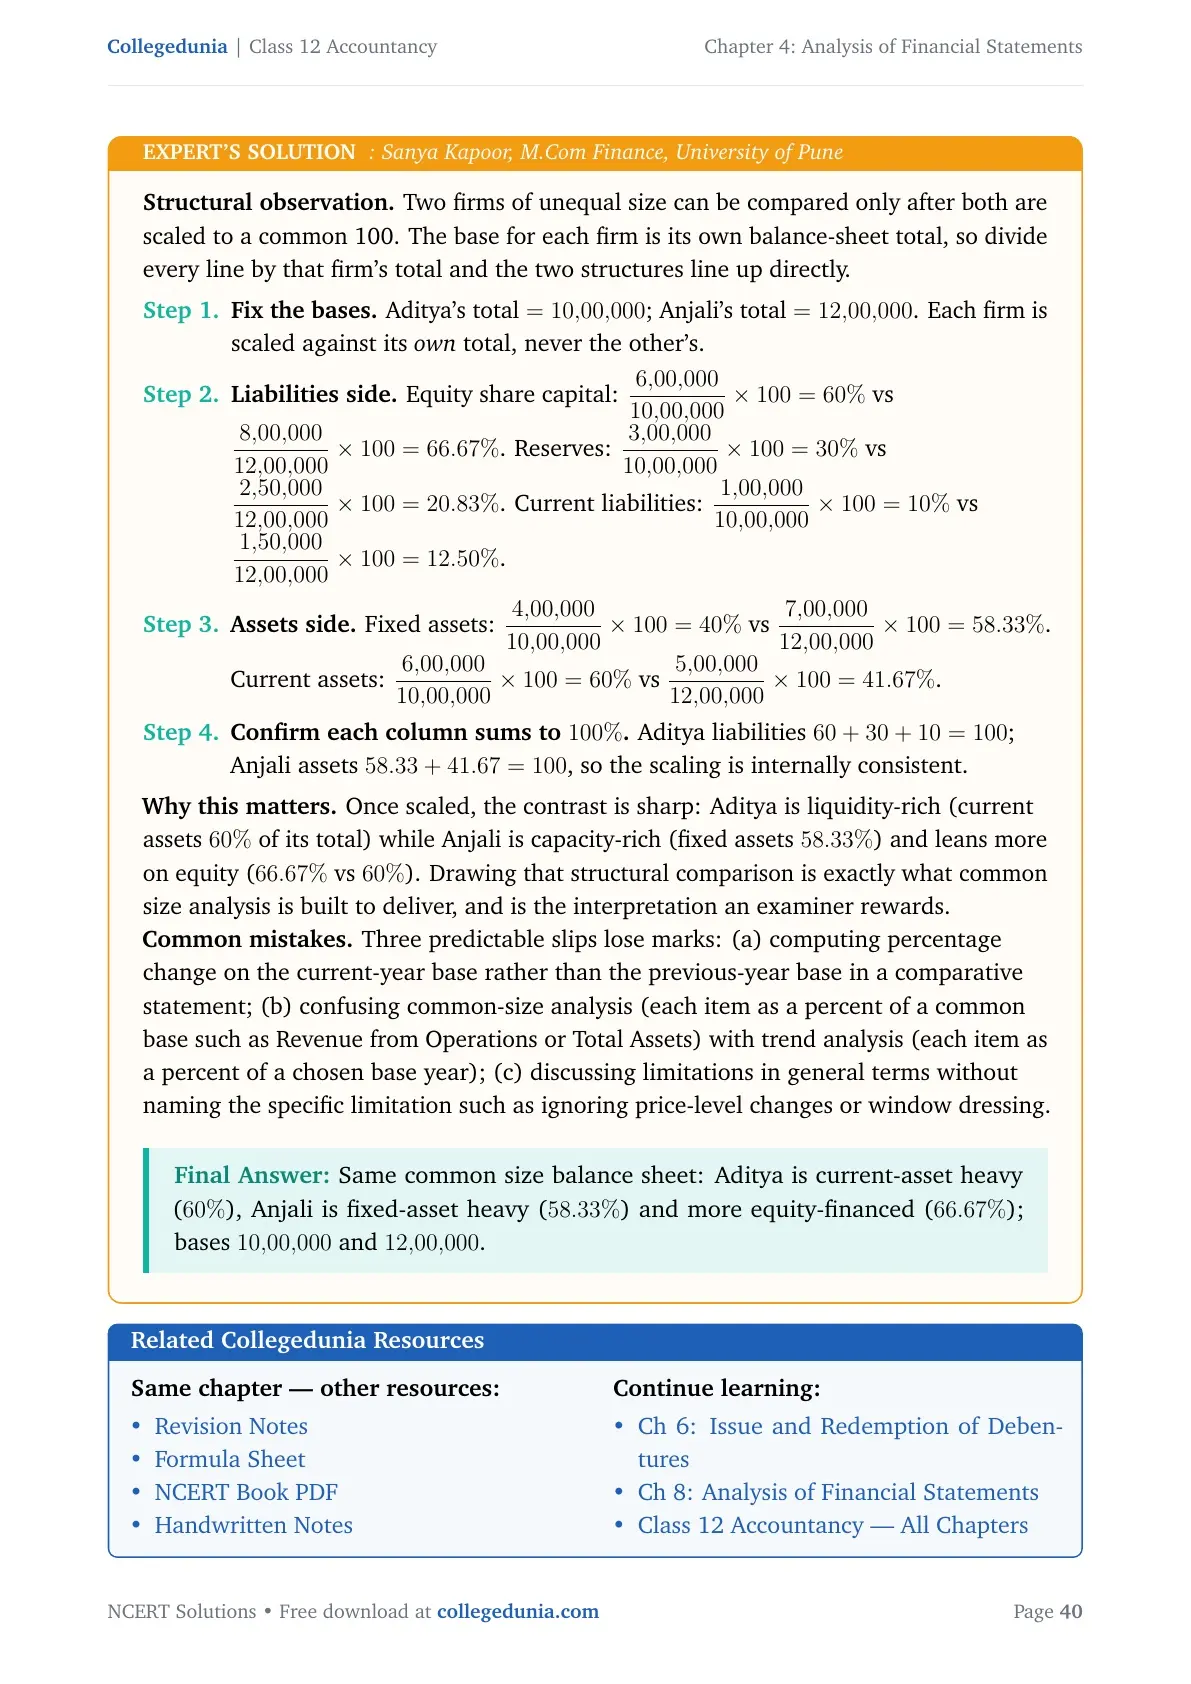
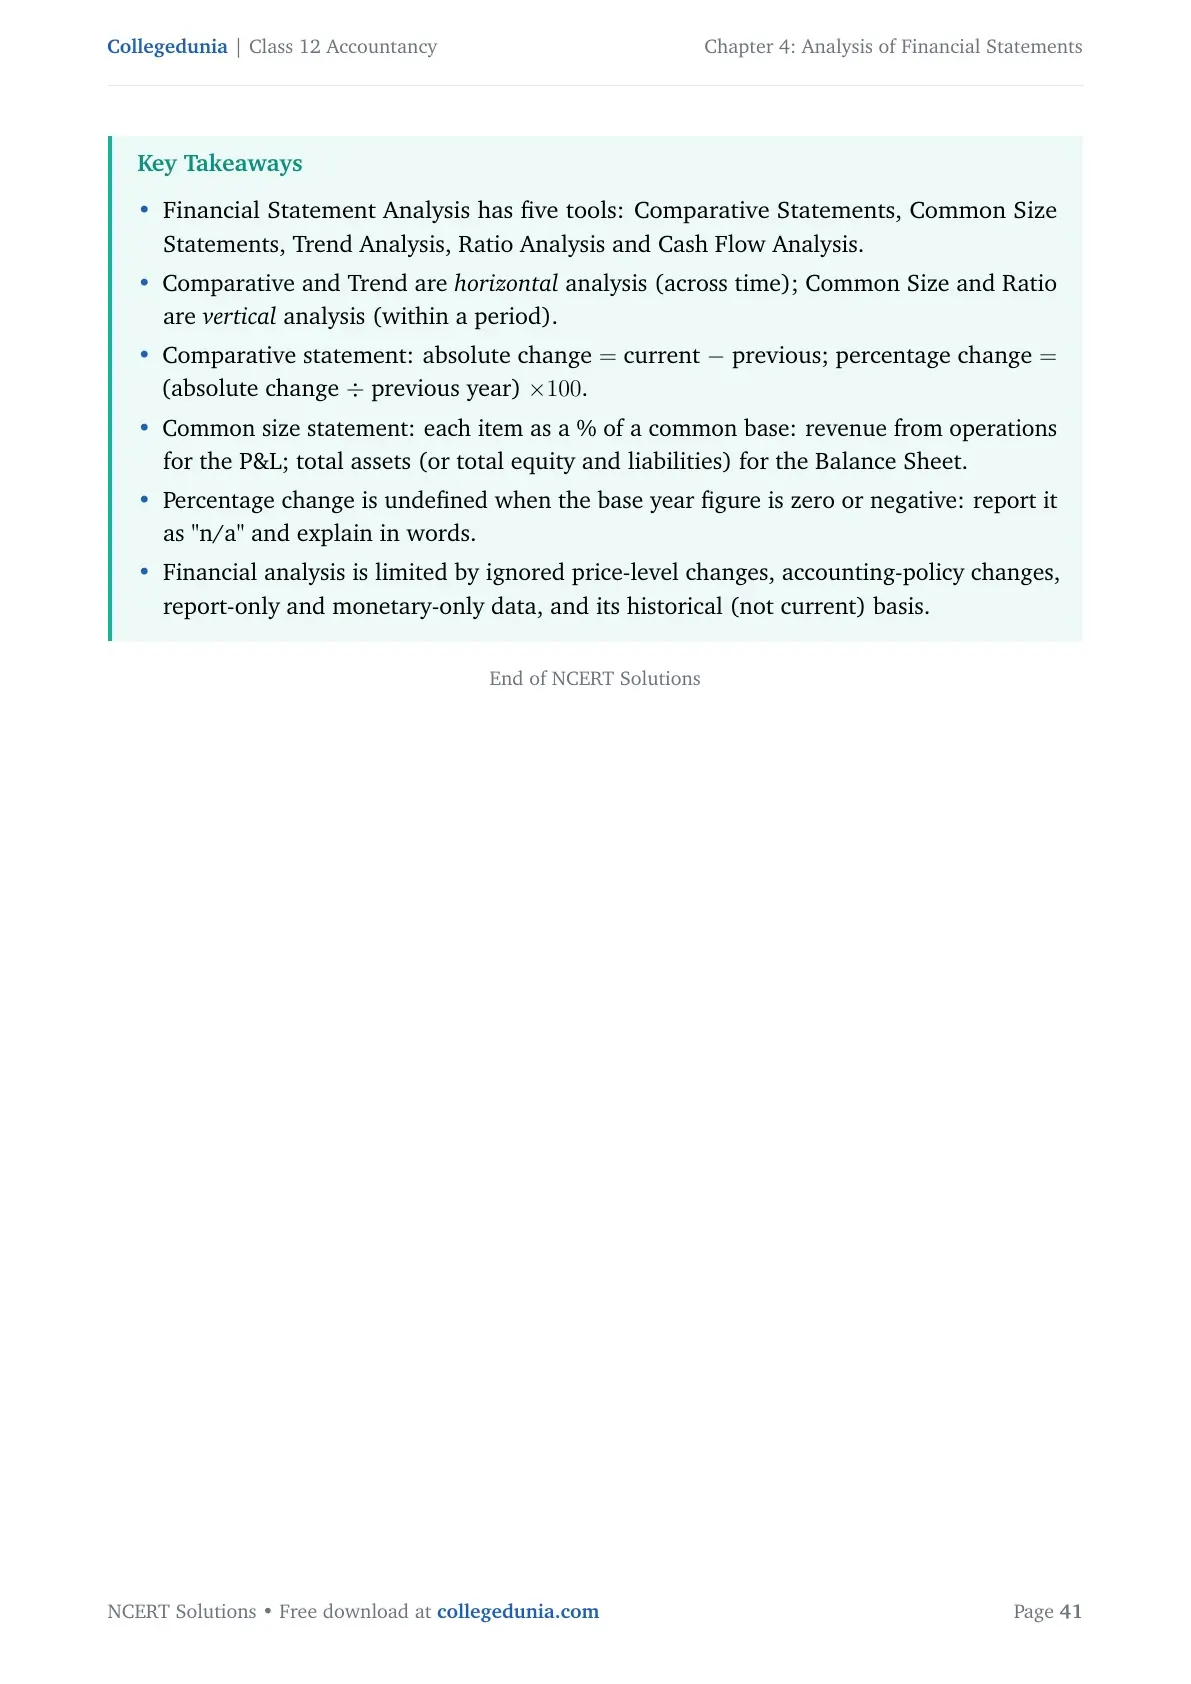
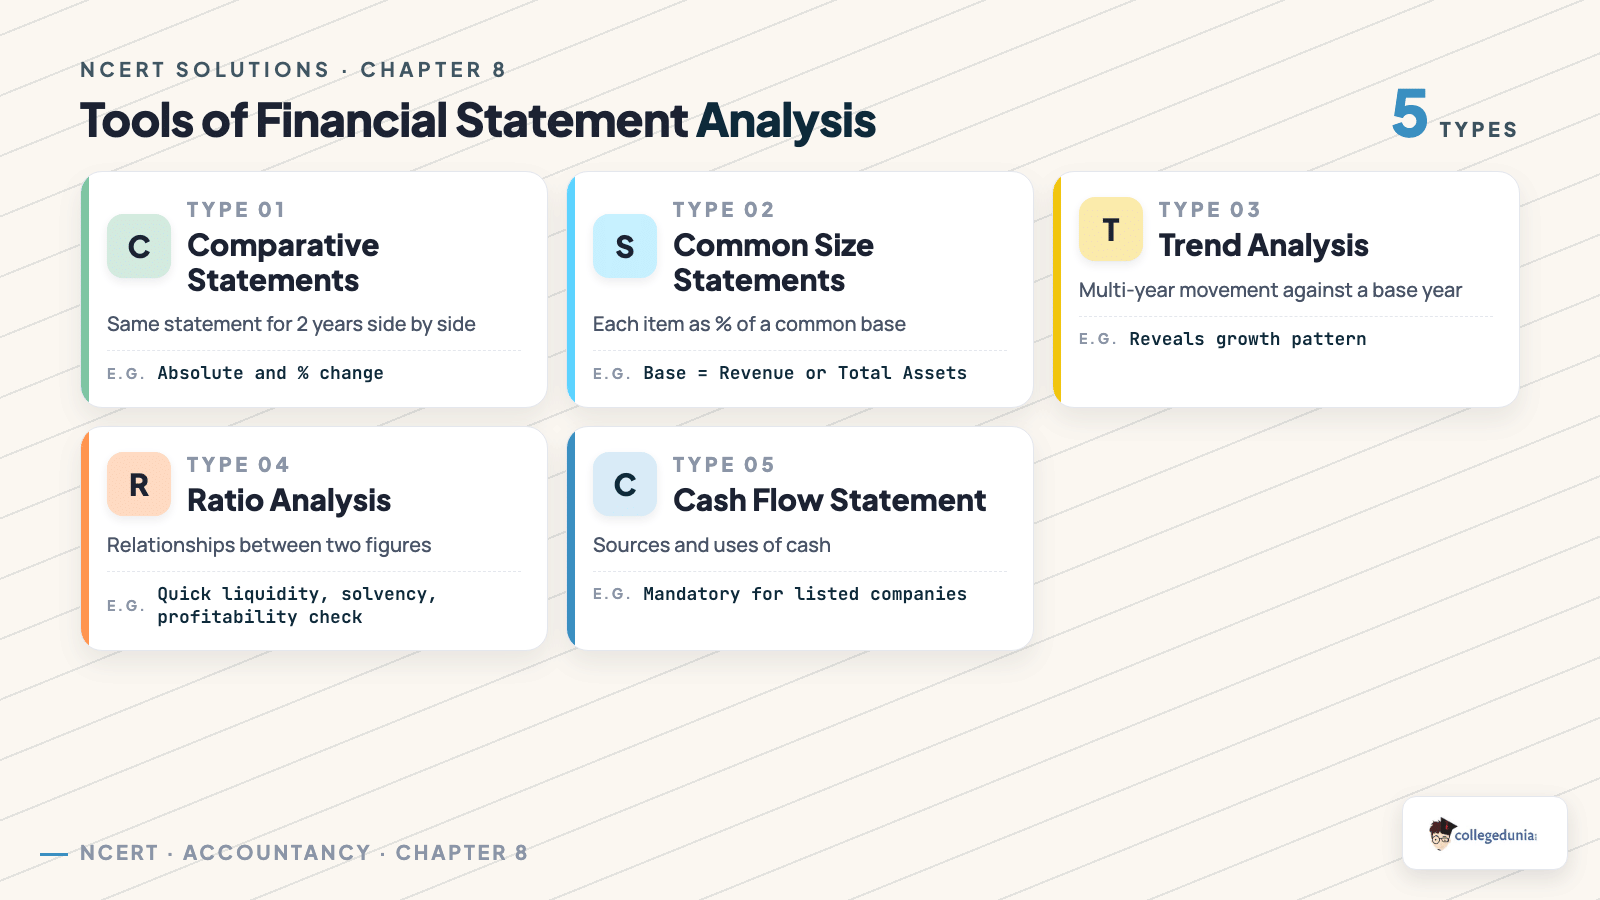



Comments