




The Class 12 Geography Practical Work in Geography Chapter 4 Spatial Information Technology textbook PDF is the official NCERT source for every board, CUET, and UPSC question on GIS, remote sensing, GPS, raster and vector data, overlay analysis, and buffer operations. It carries about 5 to 6 marks in the CBSE board exam and is the only chapter in the Practical Work in Geography book that deals with computer-based spatial tools.
- Official NCERT Practical Work in Geography Class 12 Chapter 4 PDF covering GIS components, spatial and non-spatial data, raster and vector formats, data editing, overlay analysis, and buffer operations.
- 5-6 marks CBSE board-paper weightage for Chapter 4; the official textbook is the only source CBSE references when it sets questions on spatial information technology.
- Pair with the matching NCERT Solutions, Notes and Handwritten Notes for full chapter coverage.
Student Feedback
In a 2026 Collegedunia poll of 8,700 Class 12 Geography students, 79% said reading this NCERT PDF directly improved their board answers on GIS and spatial technology. Students who worked through every concept averaged 4.6 out of 5 marks on questions from this chapter.
What This Chapter Covers in the NCERT Class 12 Book
The spatial information technology class 12 geography chapter introduces the digital tools geographers use to collect, store, analyse, and display spatial data. The official NCERT PDF is the only document CBSE references for questions on GIS, remote sensing, raster and vector data, and overlay analysis, so students preparing for the 2026-27 board paper should read it before any guide book. It covers the five components of a GIS (hardware, software, data, people, procedures), the two data formats (raster and vector), data editing and conversion, and two analysis operations: overlay and buffer. Every spatial technology concept tested in Class 12 Geography and UPSC Geography traces back to this single chapter.
Source: Esri on YouTube
Topics in the Chapter (Section-Wise Map of the NCERT PDF)
The table below maps each section of the practical work in geography class 12 chapter 4 PDF to its topic and the dominant exam concept students should extract from it.
| Section | NCERT Sub-topic | Dominant Exam Concept |
|---|---|---|
| Intro | What is Spatial Information Technology? | Definition; amalgamation of Remote Sensing, GPS, GIS, Digital Cartography, and DBMS |
| 4.1 | What is GIS? | Definition of GIS; capturing, storing, checking, integrating, manipulating, analysing, and displaying spatially referenced data |
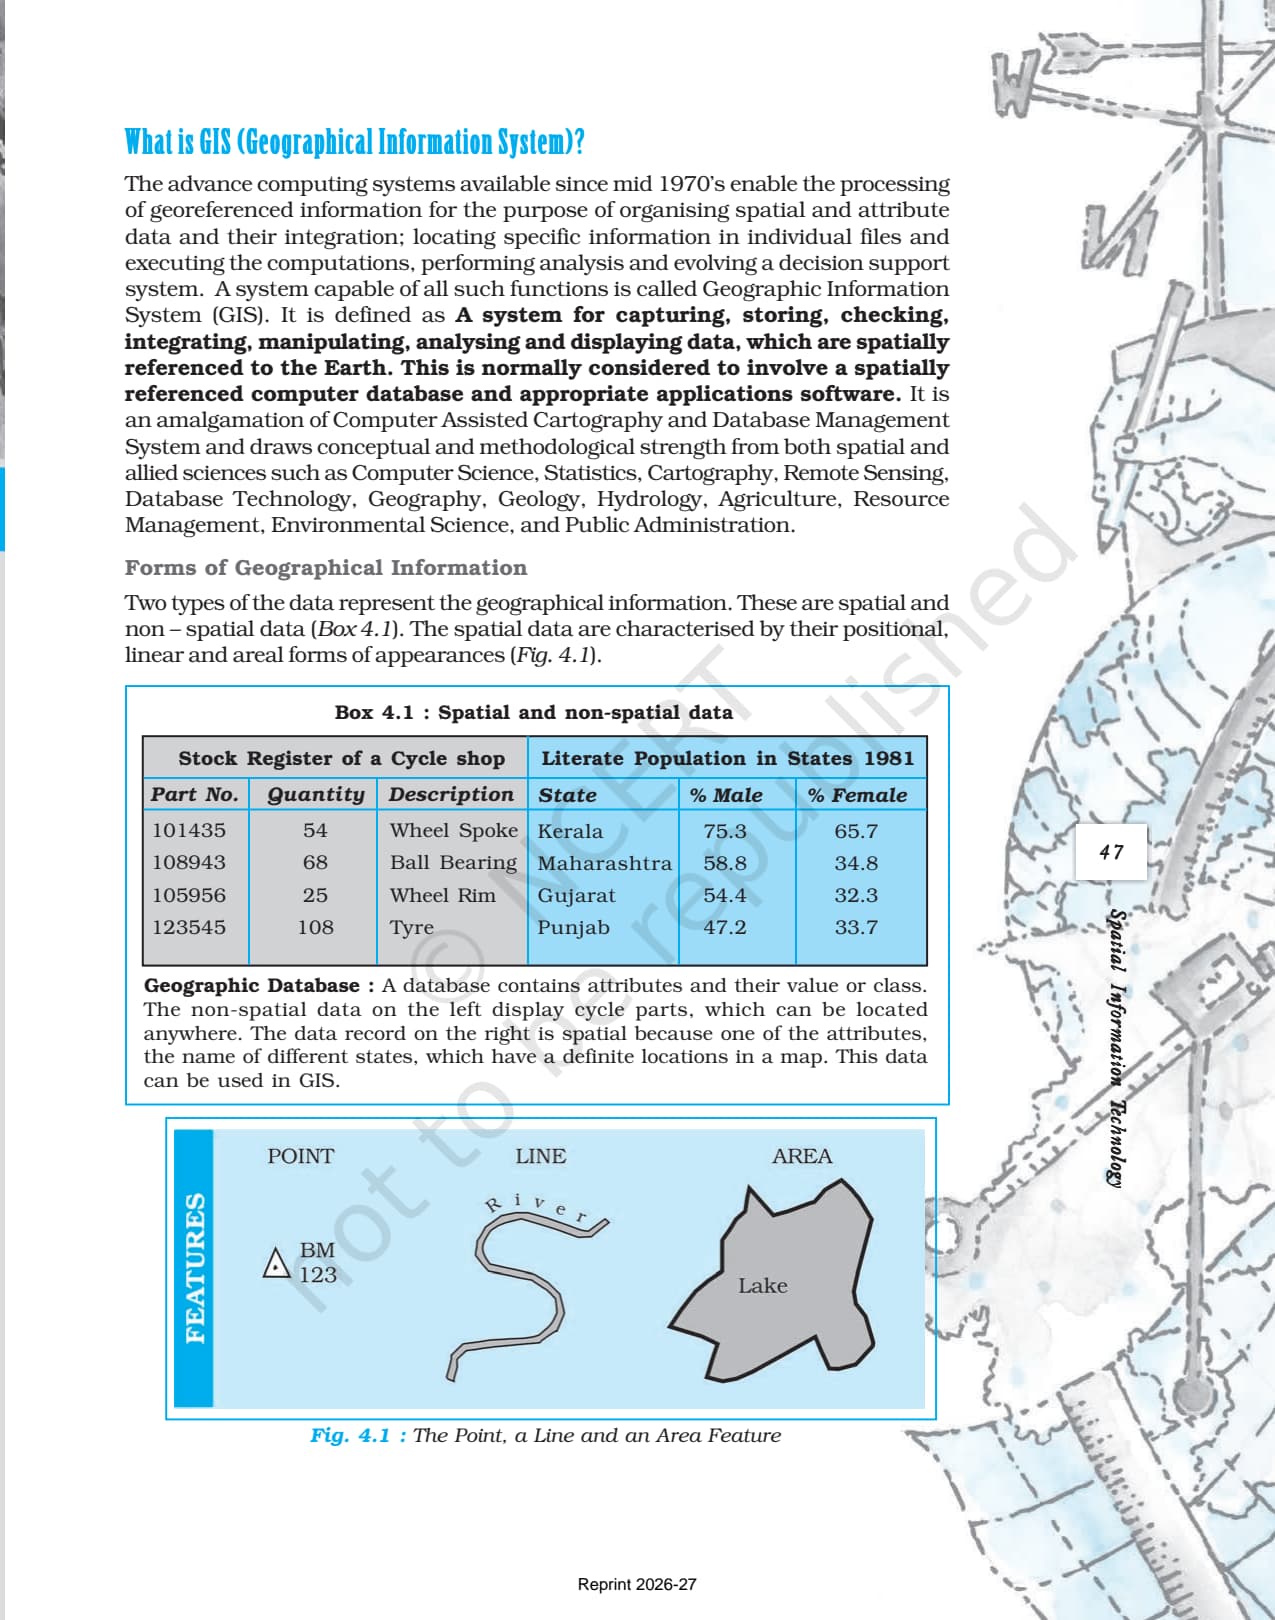
| 4.2 | Forms of Geographical Information | Spatial data (positional, linear, areal) vs non-spatial (attribute) data; Box 4.1 examples |
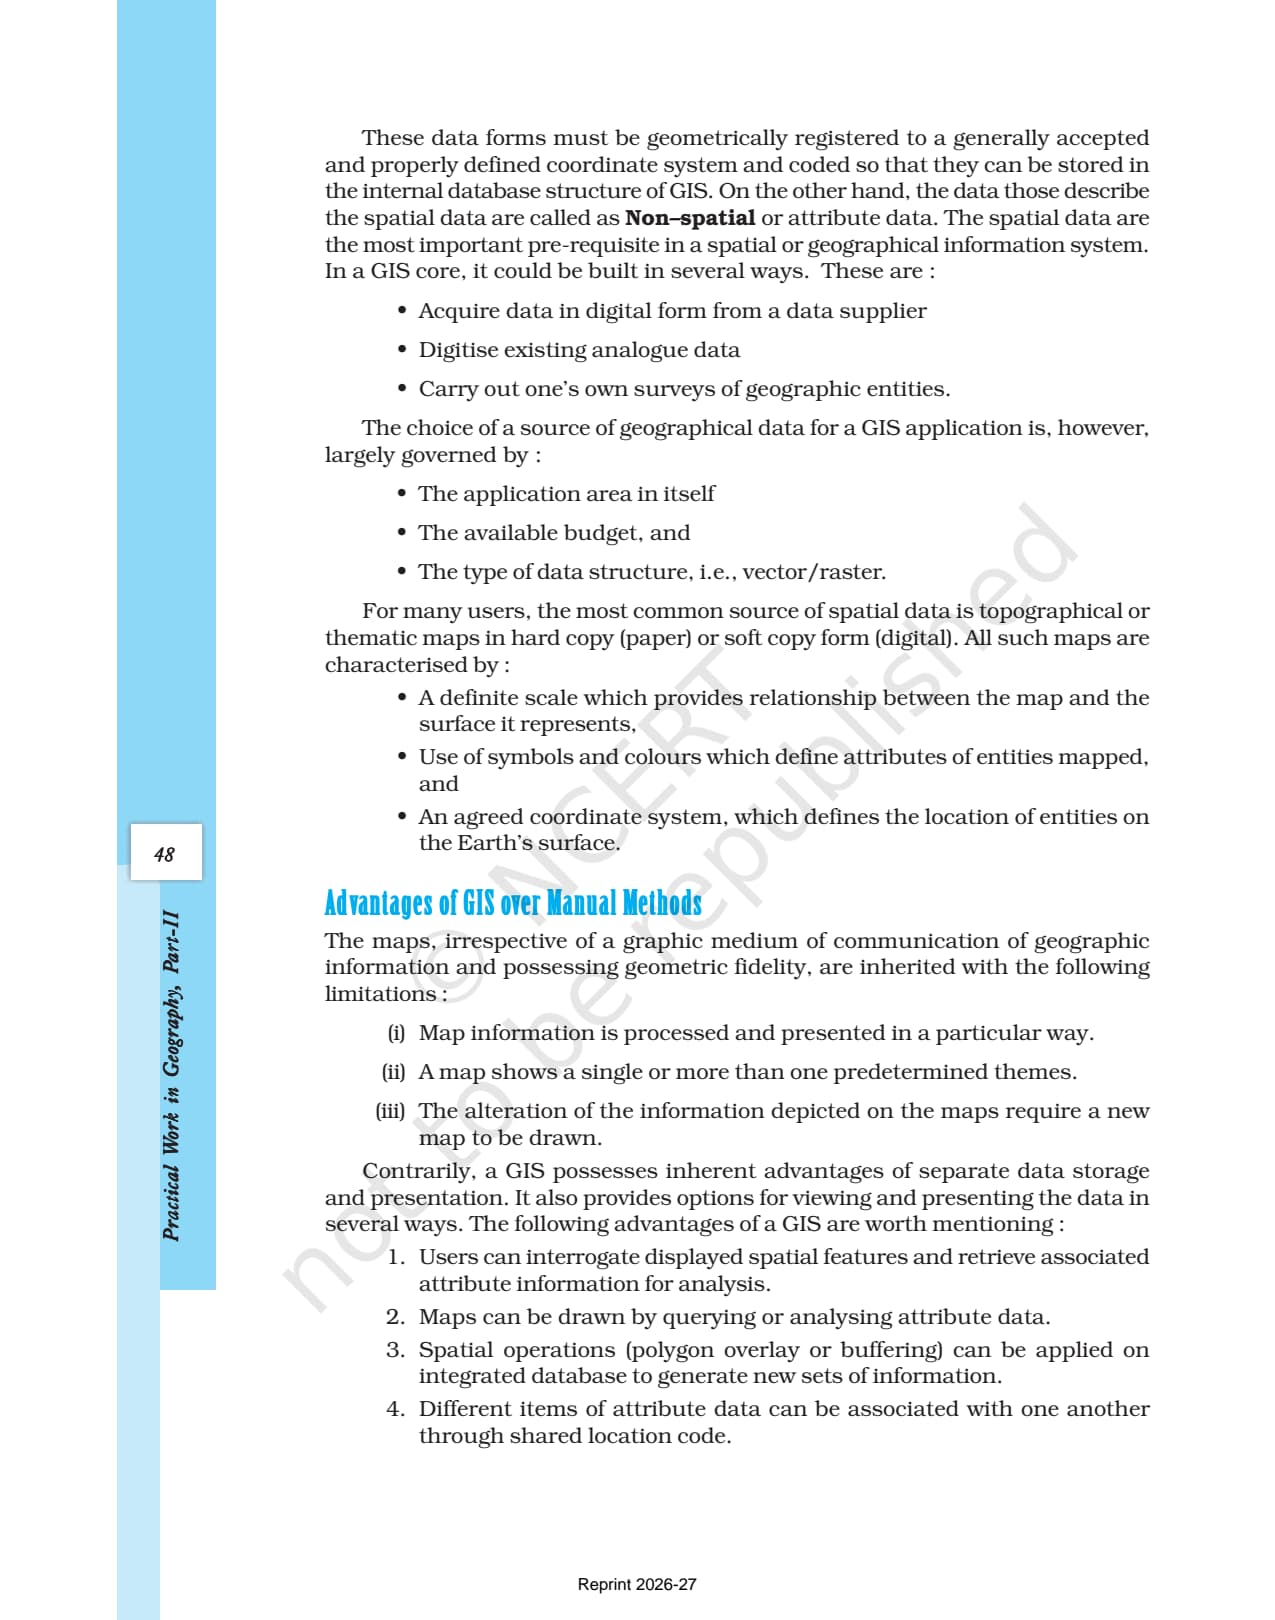
| 4.3 | Advantages of GIS over Manual Methods | Four advantages: querying, map-drawing from attributes, spatial operations (polygon overlay, buffering), linking via shared location code |
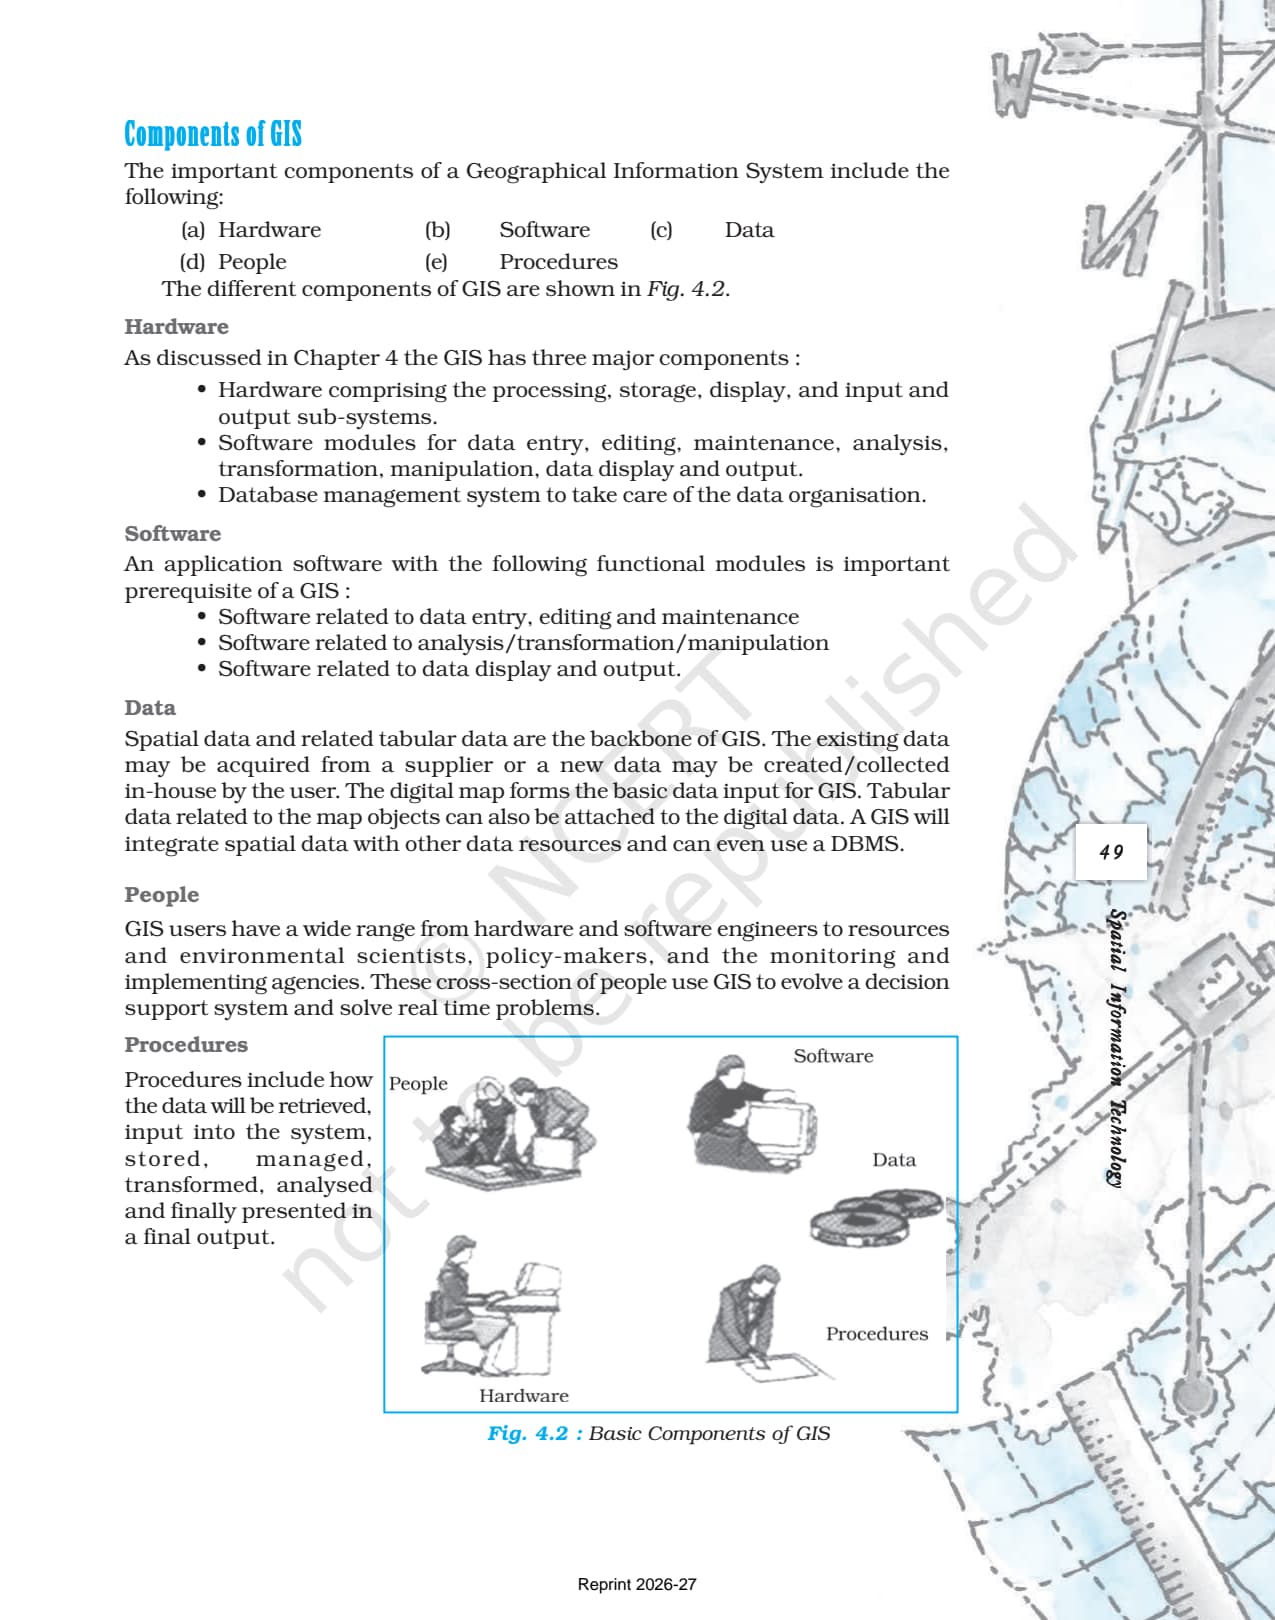
| 4.4 | Components of GIS | Five components: hardware, software, data, people, procedures; Fig. 4.2 |
| 4.5 | Spatial Data Formats | Raster vs vector; pixel, cell size, resolution; coordinates (X,Y,Z); topology; manual digitising |
| 4.6 | Data Entry and Editing | Sources of errors (registration, digitising, raster cell values); correction through GIS software; weeding algorithms |
| 4.7 | Data Conversion; Linkages and Matching | Vector-to-raster and raster-to-vector conversion; exact, hierarchical, and fuzzy matching |
| 4.8 | Spatial Analysis | Overlay analysis (polygon overlay, sieve mapping); buffer analysis (proximity analysis, point/line/area buffers) |
Spatial data formats (raster vs vector) and the two analysis operations (overlay and buffer) together contribute the largest share of board-paper questions, because they require students to both define and apply the concepts.
Key Concepts From the NCERT Class 12 Geography Textbook
Reproducing these NCERT definitions in the board paper is the fastest route to full marks on theory questions, because examiners award marks for exact textbook language.
What GIS Is and What It Does
The NCERT defines GIS as "A system for capturing, storing, checking, integrating, manipulating, analysing and displaying data, which are spatially referenced to the Earth." Every record has a location attached, so the system can answer "What is where?", "Why is it there?", and "What will happen if it moves?" The board paper often asks students to write this definition word for word, so memorising it is non-negotiable.
Spatial vs Non-Spatial Data
Spatial data have a definite, mappable location and appear in positional (point), linear (line), or areal (polygon) forms. Non-spatial or attribute data describe features but carry no location of their own. Box 4.1 makes this concrete: a cycle-shop stock register is non-spatial, while a table of literate females per Indian state is spatial. This contrast is a near-yearly two-mark question, and examiners expect the stock-register vs state-literacy example.
Raster vs Vector Data Formats
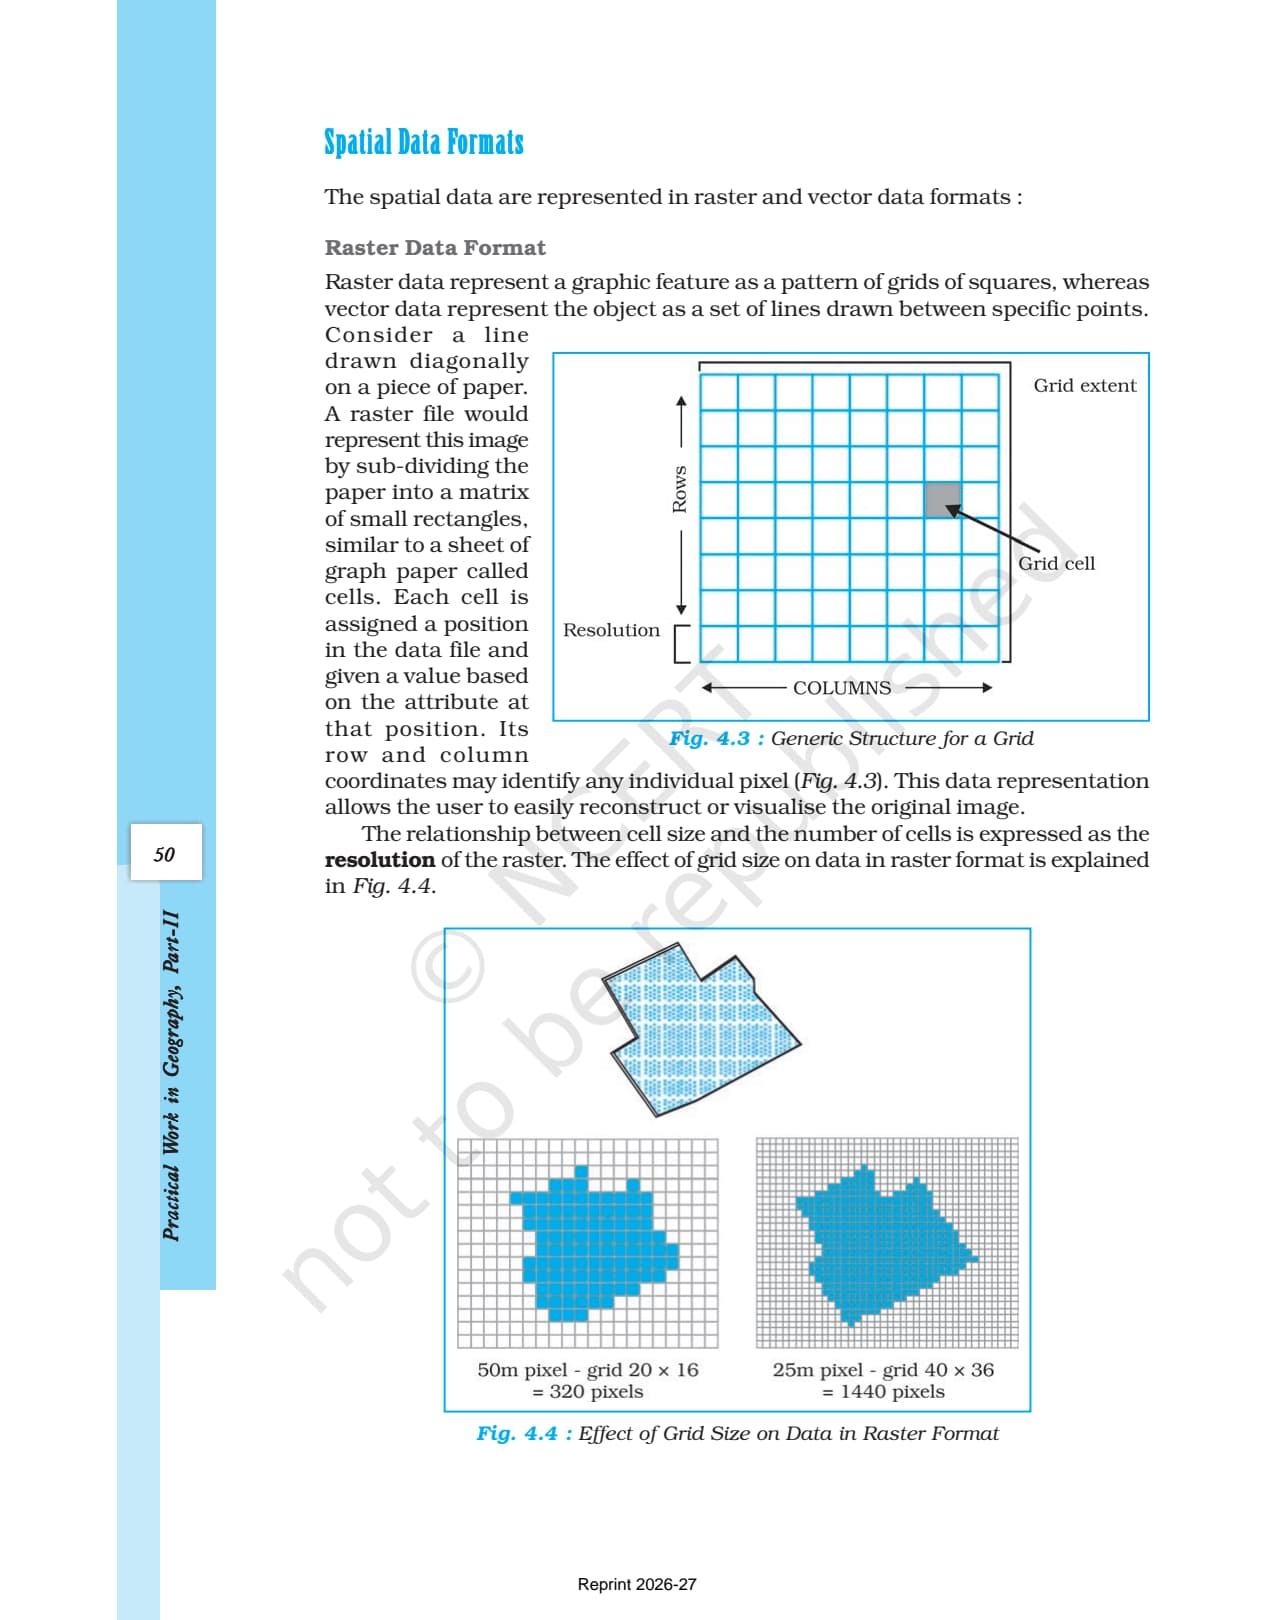
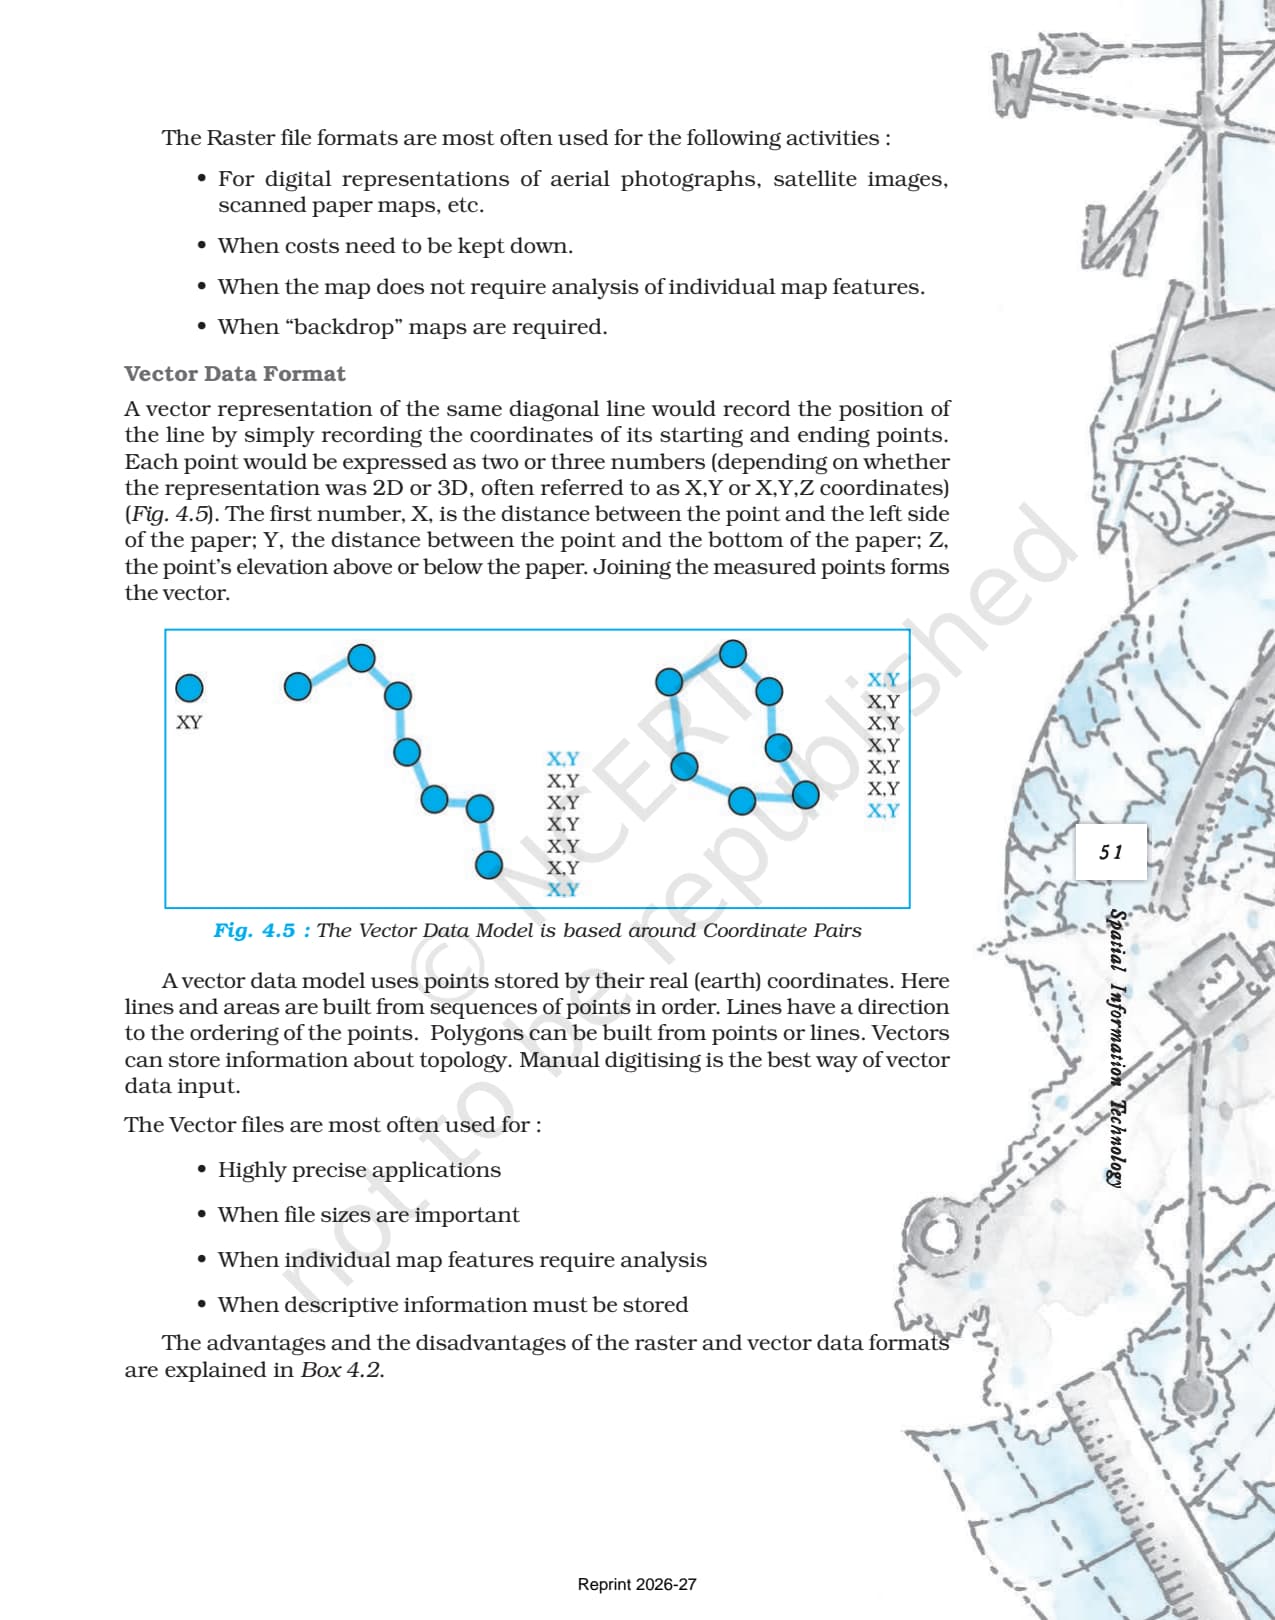
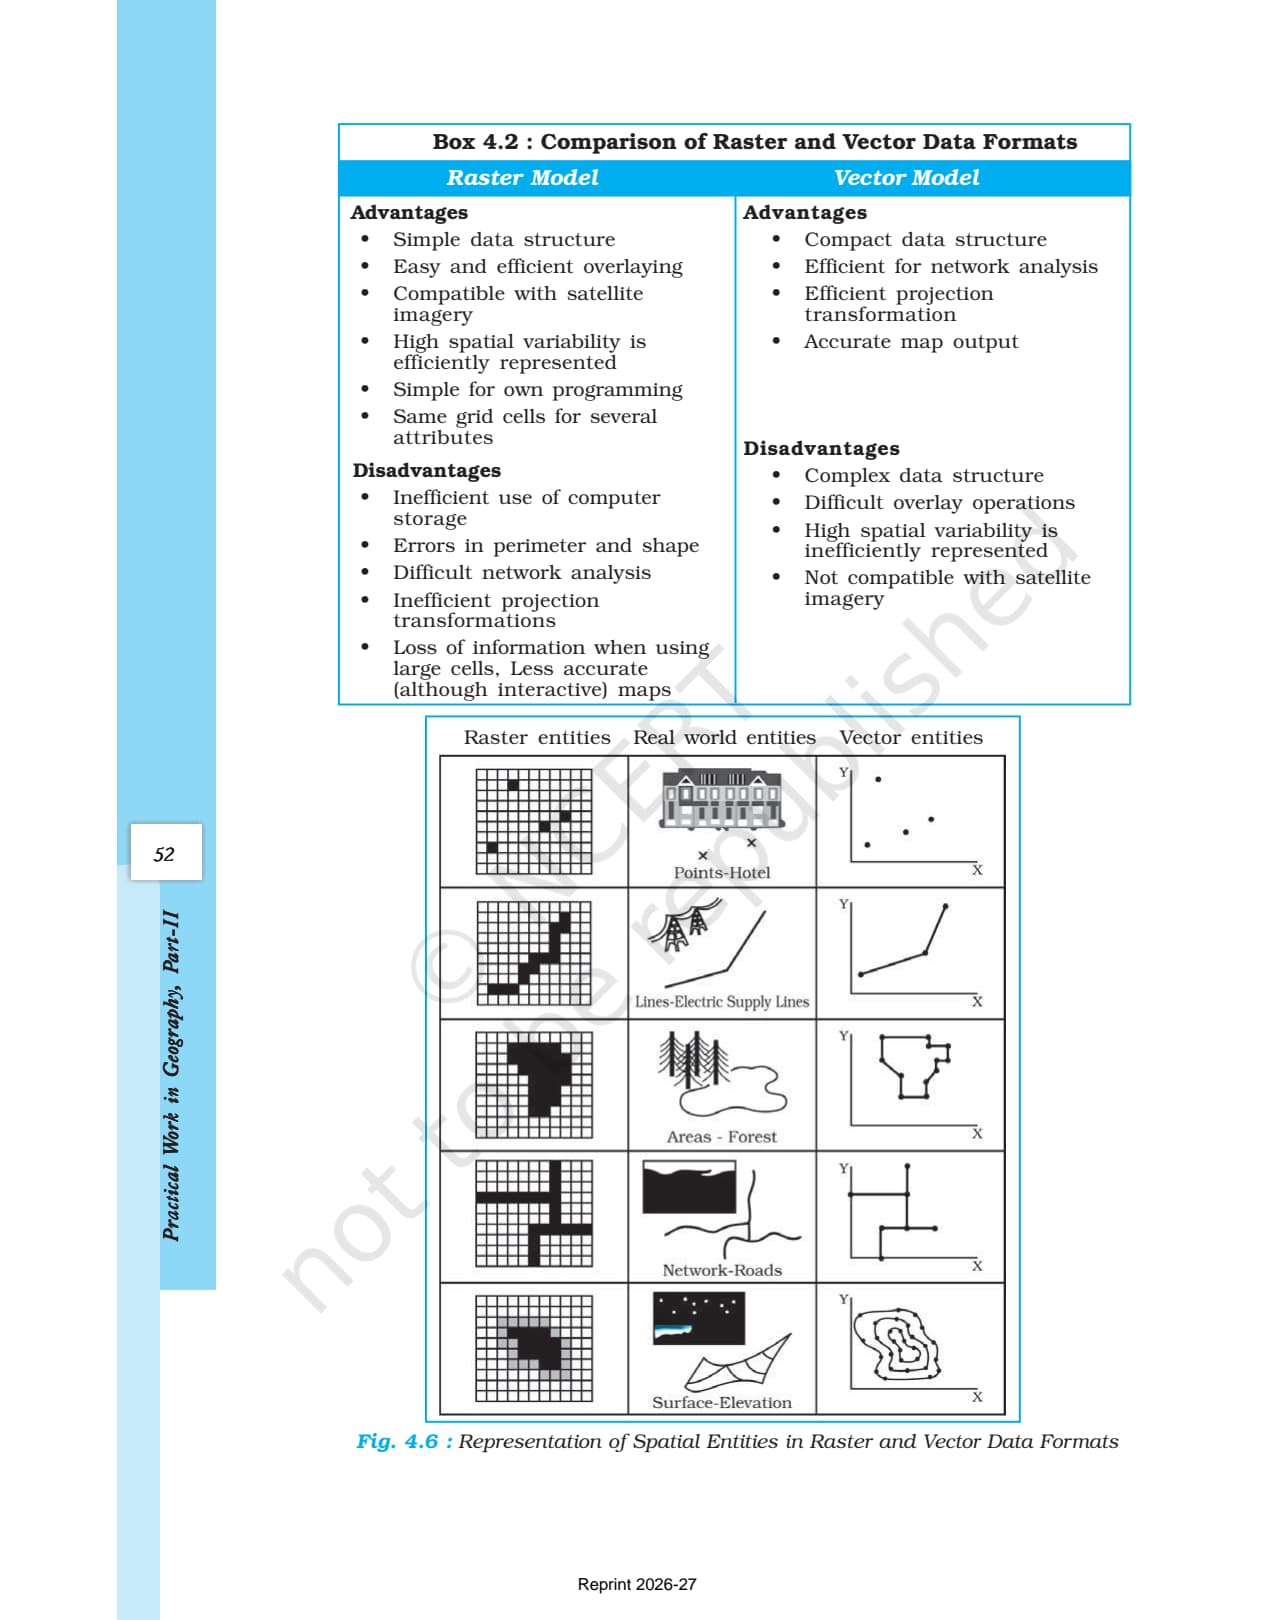
In the raster format, the map is divided into a grid of equal cells (pixels), each holding a value for that location; the cell size to cell number relationship is the resolution. Raster suits satellite images, aerial photos, and scanned maps. In the vector format, features are stored as points, lines, or polygons defined by X,Y (or X,Y,Z) coordinates, and it suits precise work such as land-use boundaries, road networks, and cadastral maps. Students should contrast the two using the NCERT diagonal-line example.
Overlay Analysis and Buffer Analysis
Overlay analysis integrates two or more map layers of the same area into a new layer, like laying tracing paper on a light table; the NCERT uses Aligarh City land-use maps of 1974 and 2001 to reveal urban sprawl. Buffer analysis creates a zone of a set distance around a point, line, or area to show what is served by or at risk from a feature; the NCERT example uses hospitals in six western Uttar Pradesh cities to show which areas have easy access. Both are regularly examined in two and three-mark define-and-apply questions.
Previous Year Question Trends From This Chapter
The class 12 geography practical work chapter 4 important questions follow a consistent pattern. This chapter has contributed 5 to 6 marks across recent board papers through MCQs, two-mark definitions, and longer explanatory questions, and the 2026-27 paper should look similar.
| Year | Marks | Question Types | Most Common Topic |
|---|---|---|---|
| 2025 | 5 | 1 MCQ + 1 two-mark + 1 three-mark | Raster vs vector data formats with examples |
| 2024 | 5 | 2 MCQs + 1 three-mark | Components of GIS; buffer analysis application |
| 2023 | 6 | 1 MCQ + 1 two-mark + 1 three-mark | Overlay analysis; advantages of GIS over manual methods |
| 2022 | 5 | 1 MCQ + 1 four-mark | Definition of GIS; spatial vs non-spatial data |
| 2020 | 5 | 2 MCQs + 1 three-mark | Raster vs vector; GIS definition |
The most repeated type is a three to five-mark question asking students to define GIS, list its components, or contrast raster and vector data. Students who have read the full PDF answer these from memory without dropping a component or using non-NCERT phrasing.
Connecting This Chapter to the Rest of Practical Work in Geography
Chapter 4 is the final chapter of the Practical Work in Geography book: data collected in Chapter 1, processed in Chapter 2, and mapped in Chapter 3 is here georeferenced and analysed spatially in a GIS, and the same concepts feed directly into UPSC Geography Paper I and Paper II.
| Related Chapter | Connection to Chapter 4 |
|---|---|
| Chapter 1: Data Its Source and Compilation | Primary and secondary data collected in Chapter 1 become the attribute tables and base maps that are entered into a GIS in Chapter 4 |
| Chapter 2: Data Processing | Statistically processed data from Chapter 2 feeds into GIS attribute databases; measures of dispersion help assess spatial variability in Chapter 4 analysis |
| Chapter 3: Graphical Representation of Data | Manual cartographic principles from Chapter 3 (scale, legend, coordinate system) are the foundation for the digital mapping principles of GIS in Chapter 4 |
Quick Glossary From the NCERT Chapter
Students should be able to define each term in one line for MCQs and short answers. Using textbook phrasing is the fastest route to full marks on theory questions.
- Spatial Information Technology: The technological inputs for collecting, storing, displaying, manipulating, and analysing spatial information; an amalgamation of Remote Sensing, GPS, GIS, Digital Cartography, and DBMS.
- GIS: A system for capturing, storing, checking, integrating, manipulating, analysing, and displaying data that are spatially referenced to the Earth.
- Spatial data: Data with positional, linear, and areal forms that are registered to a coordinate system.
- Non-spatial (attribute) data: Data that describe features but do not carry location information on their own.
- Raster data format: A grid of equal cells (pixels), each assigned a value based on the attribute at that location.
- Vector data format: Points, lines, or polygons defined by their X,Y (or X,Y,Z) coordinates.
- Overlay analysis: A GIS operation that integrates two or more map layers of the same area into a new combined layer.
- Buffer analysis: A GIS operation that creates a zone of a set distance around a feature to analyse proximity; also called proximity analysis.
Also Explore Other Resources for Class 12 Geography Chapter 4
| Resource | Link |
|---|---|
| NCERT Solutions | Class 12 Geography Chapter 4 PWG NCERT Solutions |
| Revision Notes | Class 12 Geography Chapter 4 PWG Notes |
| Handwritten Notes | Class 12 Geography Chapter 4 PWG Handwritten Notes |
| Subject Hub | Class 12 Geography All Chapters |
All Chapters: Class 12 Geography NCERT Book PDF (Practical Work in Geography)
| Chapter | NCERT Book PDF |
|---|---|
| Chapter 1 | Data: Its Source and Compilation NCERT Book PDF |
| Chapter 2 | Data Processing NCERT Book PDF |
| Chapter 3 | Graphical Representation of Data NCERT Book PDF |
| Chapter 4 | Spatial Information Technology NCERT Book PDF (You are here) |
Frequently Asked Questions on Class 12 Geography Chapter 4 PWG NCERT Book PDF
Ques. Where can students download the official NCERT Class 12 Geography Practical Work Chapter 4 PDF?
Ans. Students can download the official spatial information technology class 12 NCERT book PDF directly from the download card at the top of this page. The PDF is the single-chapter file from the Practical Work in Geography textbook, aligned to the 2026-27 CBSE syllabus and covering GIS components, raster and vector data formats, data editing, and spatial analysis operations.
Ques. What is the NCERT definition of GIS for Class 12 Geography?
Ans. According to the NCERT textbook, GIS (Geographical Information System) is defined as "A system for capturing, storing, checking, integrating, manipulating, analysing and displaying data, which are spatially referenced to the Earth." The system normally involves a spatially referenced computer database and appropriate applications software. It is an amalgamation of Computer Assisted Cartography and Database Management System, drawing conceptual and methodological strength from spatial and allied sciences such as Computer Science, Statistics, Cartography, Remote Sensing, Geography, Geology, Hydrology, Agriculture, and Public Administration.
Ques. What are the five components of GIS as listed in the NCERT Class 12 textbook?
Ans. The NCERT lists five components: (1) Hardware - the processing, storage, display, and input/output sub-systems; (2) Software - modules for data entry, editing, maintenance, analysis, transformation, manipulation, display, and output; (3) Data - spatial data and related tabular data forming the backbone of GIS; (4) People - a wide range from hardware and software engineers to environmental scientists and policy-makers; (5) Procedures - how data will be retrieved, input, stored, managed, transformed, analysed, and presented. Students who list only three components in a board answer typically miss People and Procedures and lose marks.
Ques. What is the difference between raster and vector data formats in GIS?
Ans. In the raster format, a geographic area is divided into a grid of equally sized cells (pixels), and each cell is assigned a value based on the attribute at that location. The resolution is the relationship between cell size and number of cells; smaller cells give higher resolution. Raster is used for satellite images, aerial photographs, and scanned maps. In the vector format, features are stored as points, lines, or polygons defined by their X,Y (or X,Y,Z) coordinates. A point is one coordinate pair; a line is an ordered set of coordinate pairs; a polygon is a closed sequence of lines. Vector is used for precise applications such as cadastral maps, land-use boundaries, and road networks.
Ques. What are the advantages of GIS over manual methods as stated in the NCERT?
Ans. The NCERT lists four advantages of GIS over manual mapping methods: (1) Users can interrogate displayed spatial features and retrieve associated attribute information for analysis. (2) Maps can be drawn by querying or analysing attribute data - not just by hand. (3) Spatial operations such as polygon overlay and buffering can be applied to integrated databases to generate new sets of information. (4) Different items of attribute data can be linked to one another through a shared location code. These advantages are contrasted with the three limitations of manual maps: fixed presentation, single or predetermined theme, and the need to draw a new map whenever information changes.
Ques. What is overlay analysis in GIS and what is it used for?
Ans. Overlay analysis is a GIS operation that integrates two or more thematic map layers of the same area to produce a new output layer. It is similar to sieve mapping - overlaying tracings of maps on a light table to make comparisons. One key application shown in the NCERT is the overlay of Aligarh City urban land-use maps from 1974 and 2001 to detect changes in urban land use and map the urban sprawl of the city over that period. Overlay analysis is also used in suitability analysis to determine which land is appropriate for a proposed use.
Ques. What is buffer analysis and what does the NCERT example demonstrate?
Ans. Buffer analysis (also called proximity analysis) creates a zone of a specified distance around any point, line, or area feature. The buffer polygon identifies the area or population within a given distance of a facility or hazard. The NCERT uses the example of six cities in western Uttar Pradesh (Saharanpur, Muzaffarnagar, Meerut, Ghaziabad, Gautam Budh Nagar, and Aligarh) that have major hospitals. Buffers of 2, 4, 6, 8, and 10 kilometres are created around these cities. The analysis shows that people living closer to these cities are better served by hospital facilities, while people living further away must travel long distances and are least benefitted.
Ques. What is the difference between spatial and non-spatial data in GIS?
Ans. Spatial data have a definite, mappable location. They appear as positional (point), linear (line), or areal (polygon) features on a map and are registered to a coordinate system. Non-spatial or attribute data describe the spatial features but carry no location information of their own. The NCERT uses Box 4.1 to illustrate: a stock register of a cycle shop (part numbers and quantities) is non-spatial because cycle parts can be located anywhere; a table showing the percentage of literate females in each Indian state is spatial because each state has a fixed location on a map, making it usable in a GIS.
Ques. What are the three types of data matching used in GIS as described in the NCERT?
Ans. The NCERT describes three types: (1) Exact matching - when the same geographic features appear in two files and can be joined using a common key such as a town name; (2) Hierarchical matching - when one dataset covers a larger area less frequently and another covers smaller areas more frequently; the smaller areas are summed until their groupings match the larger areas, then joined exactly; (3) Fuzzy matching - used when the boundaries of smaller areas do not match those of larger areas, such as when crop field boundaries do not align with soil-type boundaries; the two layers are overlaid and productivity is computed for each soil-type and crop combination.
Ques. What activities is the raster data format most suited for?
Ans. According to the NCERT, raster file formats are most often used for: digital representations of aerial photographs, satellite images, and scanned paper maps; when costs need to be kept down (raster is simpler to produce); when the map does not require analysis of individual map features; and when "backdrop" maps are required that serve only as a background reference. The vector format, by contrast, is preferred for highly precise applications where individual features need to be queried, edited, and analysed separately.
Ques. Is the Class 12 Geography Practical Work syllabus changing for 2026-27?
Ans. No major changes have been announced. The Practical Work in Geography textbook chapter structure remains the same for 2026-27, and the official NCERT PDF available on this page is aligned to the 2026-27 CBSE syllabus. CBSE marking schemes continue to reward exact NCERT phrasing in definition questions and well-structured explanations in application questions on GIS and spatial analysis.
Ques. What is the best order to use the NCERT PDF, Notes, and Solutions for Class 12 Geography Practical Work Chapter 4?
Ans. Read the NCERT PDF cold first, taking note of every technical term and the diagrams in Figs 4.1 to 4.13. Then open the Class 12 Geography Chapter 4 PWG Notes to review the GIS component model and raster-vs-vector comparison in condensed form. Attempt all three end-of-chapter exercises and verify against the NCERT Solutions. Use the handwritten notes the night before the exam to revise the GIS definition, the five components, and the two analysis operations.



Comments