




The Class 12 Geography Practical Work in Geography Chapter 1 Data: Its Source and Compilation textbook PDF is the official NCERT source for every board question on primary sources, secondary sources, tabulation, and statistical data presentation. It carries about 4 to 5 marks in the CBSE board exam and is the foundation for all practical geography skills taught in subsequent chapters.
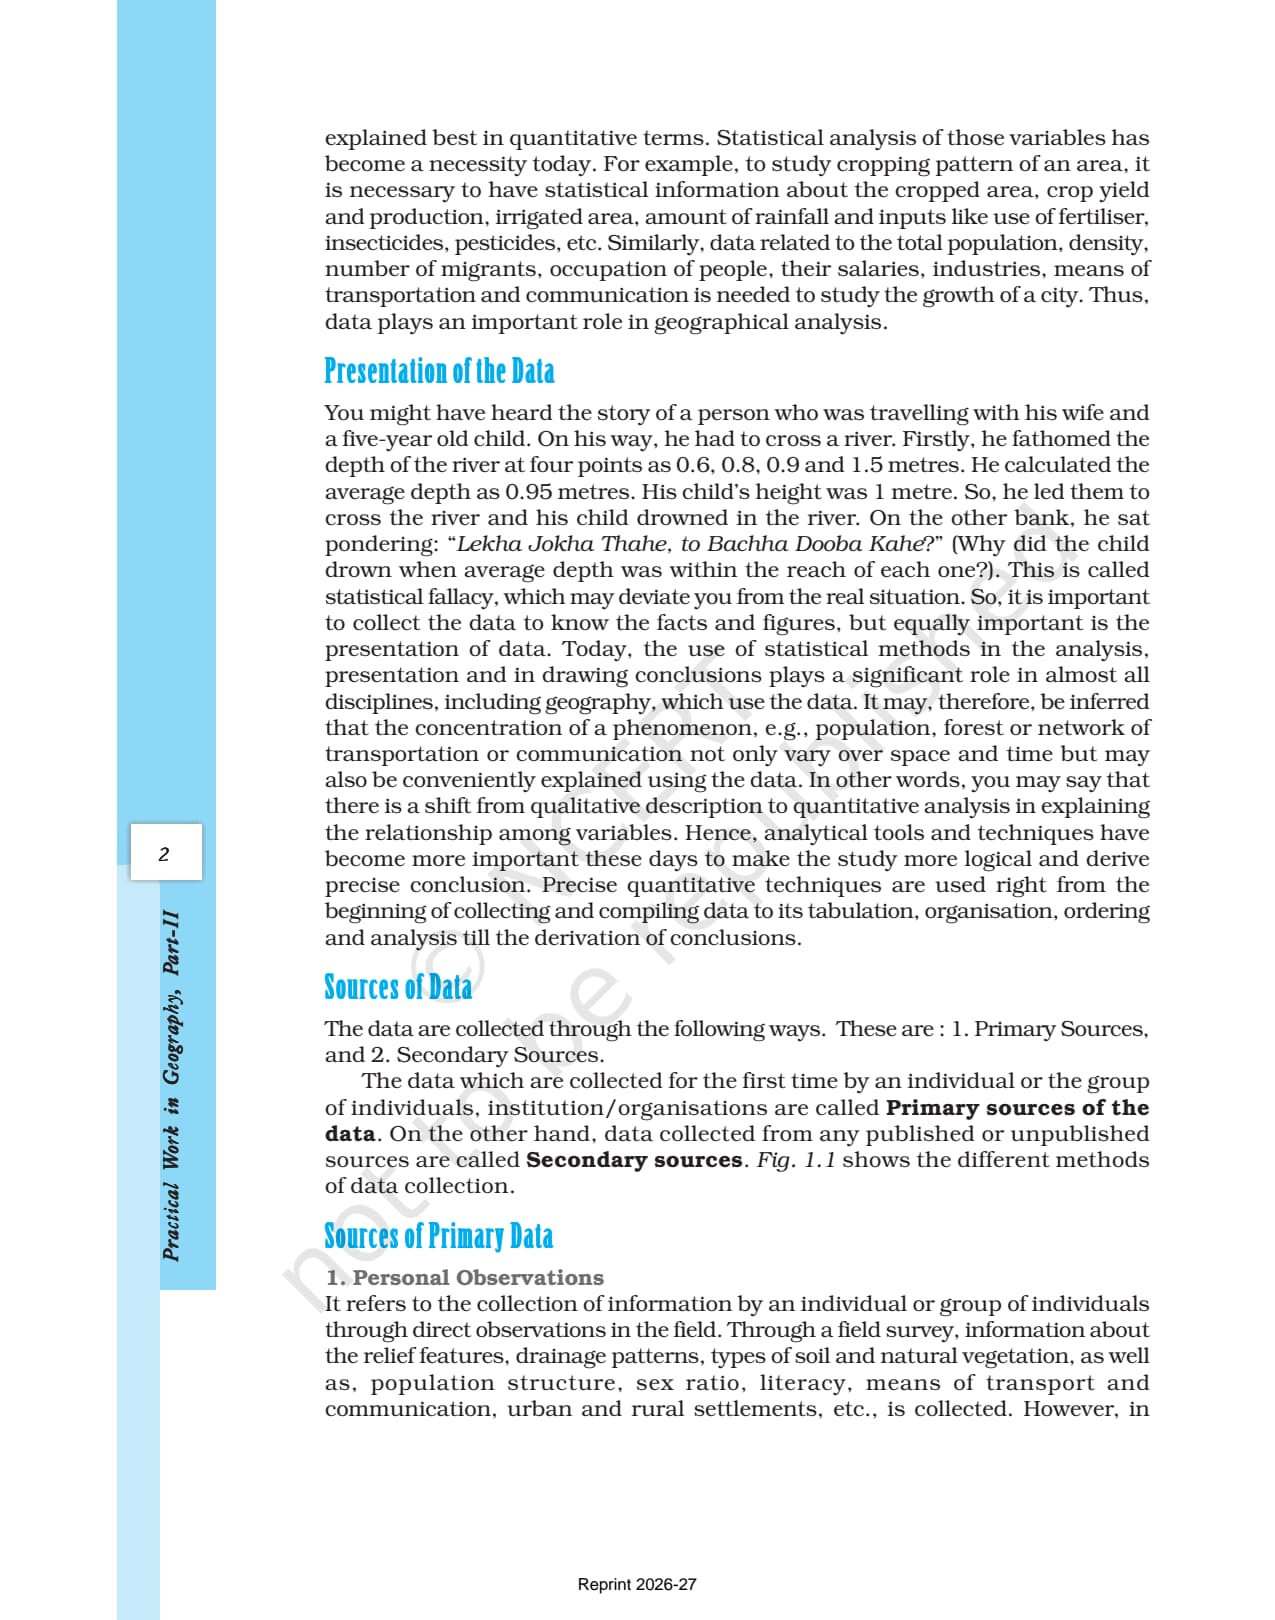
- Official NCERT Practical Work in Geography Class 12 Chapter 1 PDF covering data definition, primary and secondary sources, tabulation, classification, and frequency distribution.
- 4-5 marks CBSE board-paper weightage for Chapter 1; the official textbook is the only source CBSE references when it sets short-answer and practical questions.
- Pair with the matching NCERT Solutions, Notes and Handwritten Notes for full chapter coverage.
Student Feedback
In a 2026 Collegedunia poll of 8,700 Class 12 Geography students, 79% said reading the NCERT Practical Work in Geography chapter PDF directly improved their board-paper answers on data sources and tabulation more than any guide book. Students who read the full PDF averaged 4.5 out of 5 marks on questions from this chapter.
What This Chapter Covers in the NCERT Class 12 Book
The data its source and compilation class 12 chapter opens the Practical Work in Geography textbook and introduces every skill used in the rest of the book. The official NCERT PDF is the source CBSE uses to set short-answer and practical questions here, so read it before any guide book for the 2026-27 paper. It moves from a definition of data to its sources, then to compilation techniques like tabulation and frequency distribution.
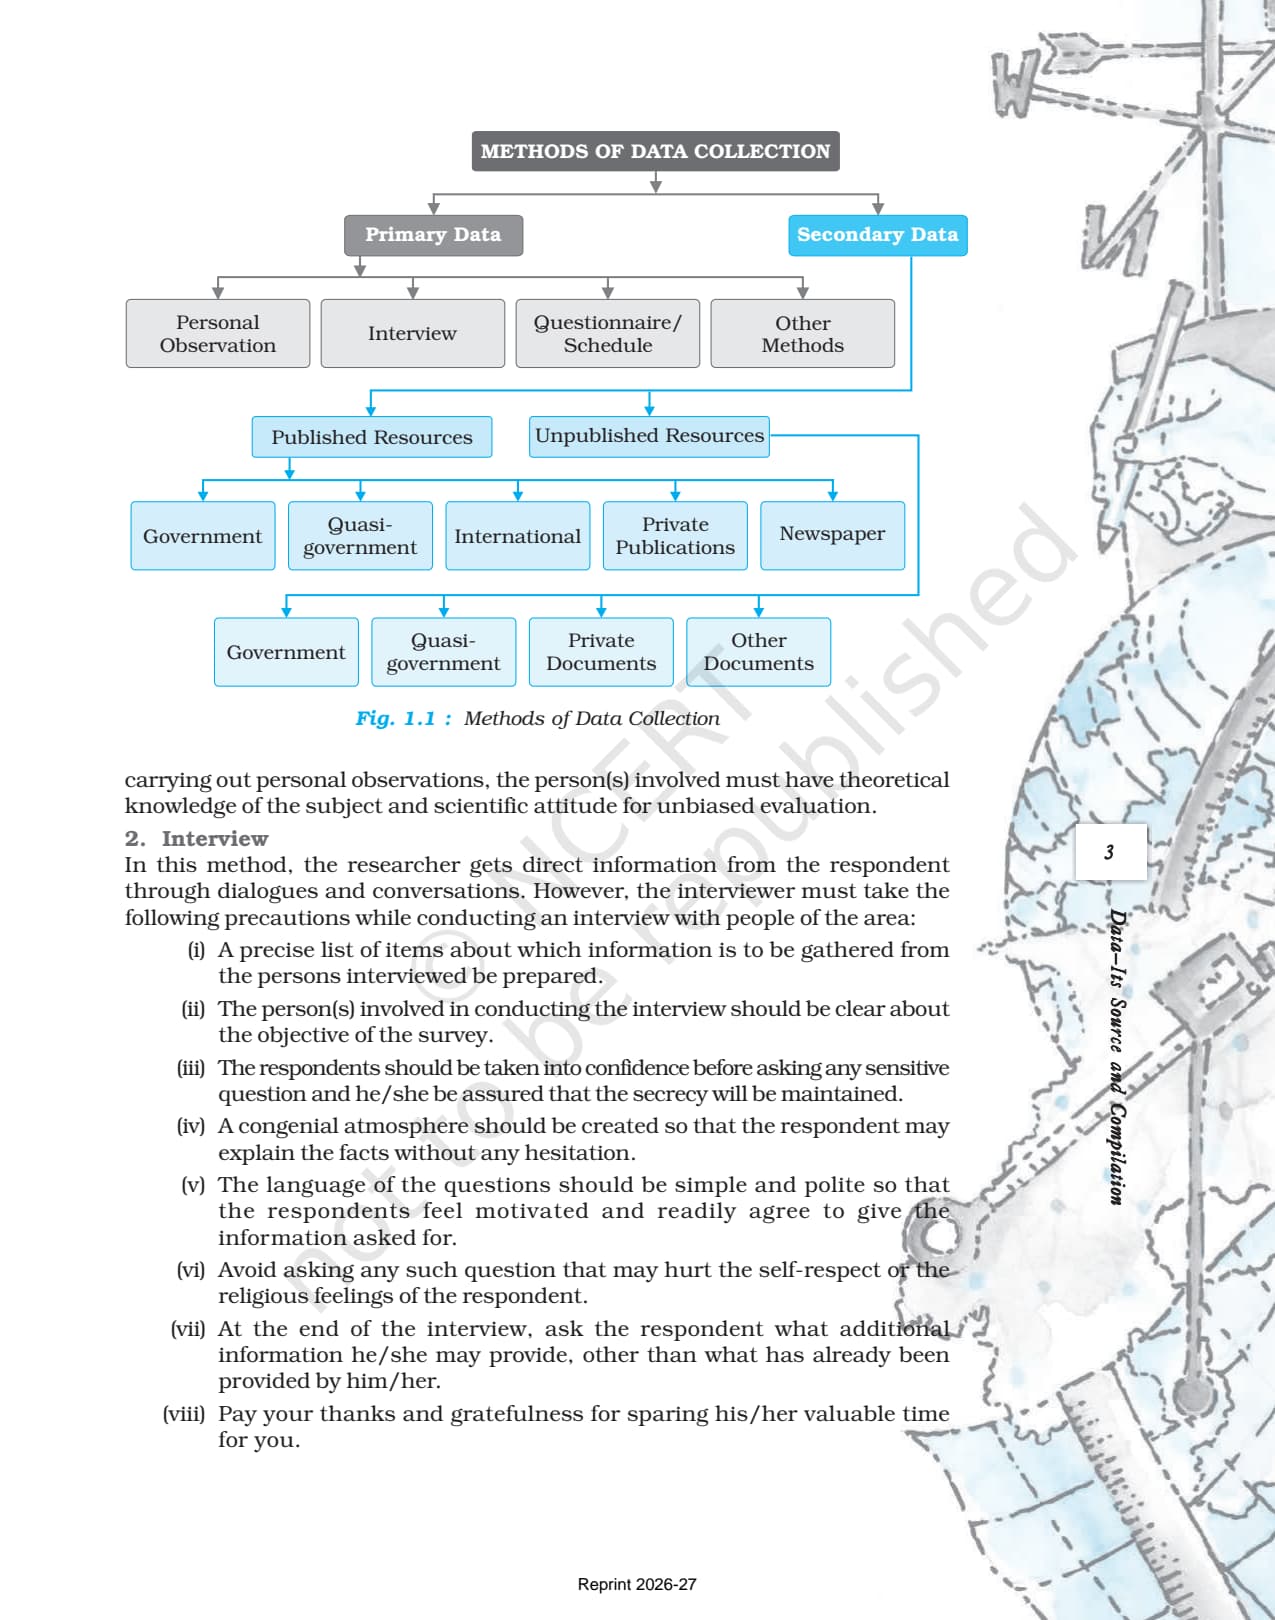
Data are defined as numbers that represent real-world measurements. The chapter classifies them into primary sources (personal observation, interview, questionnaire, and other field methods) and secondary sources (government publications, international agency reports, newspapers, and electronic media). Every later chapter builds on these definitions and methods.
Source: Examrace (UPSC, NET, NCERT, ICSE ...) on YouTube
Topics in the Chapter (Section-Wise Map of the NCERT PDF)
The PDF is organised into numbered sections. The table below maps each section to its main concept and the exam angle students should extract.
| Section | NCERT Sub-topic | Dominant Exam Concept |
|---|---|---|
| Intro | What is Data? | Definition of data and datum; numerical information from the real world |
| 1.1 | Need of Data | Role of data in geographical analysis; statistical analysis of variables |
| 1.2 | Presentation of Data | Statistical fallacy story; importance of correct data presentation |
| 1.3 | Sources of Primary Data | Personal observation, interview, questionnaire/schedule, field methods |
| 1.4 | Secondary Sources (Published) | Government, quasi-government, international, private publications, newspapers, electronic media |
| 1.5 | Secondary Sources (Unpublished) | Government documents, quasi-government records, private documents |
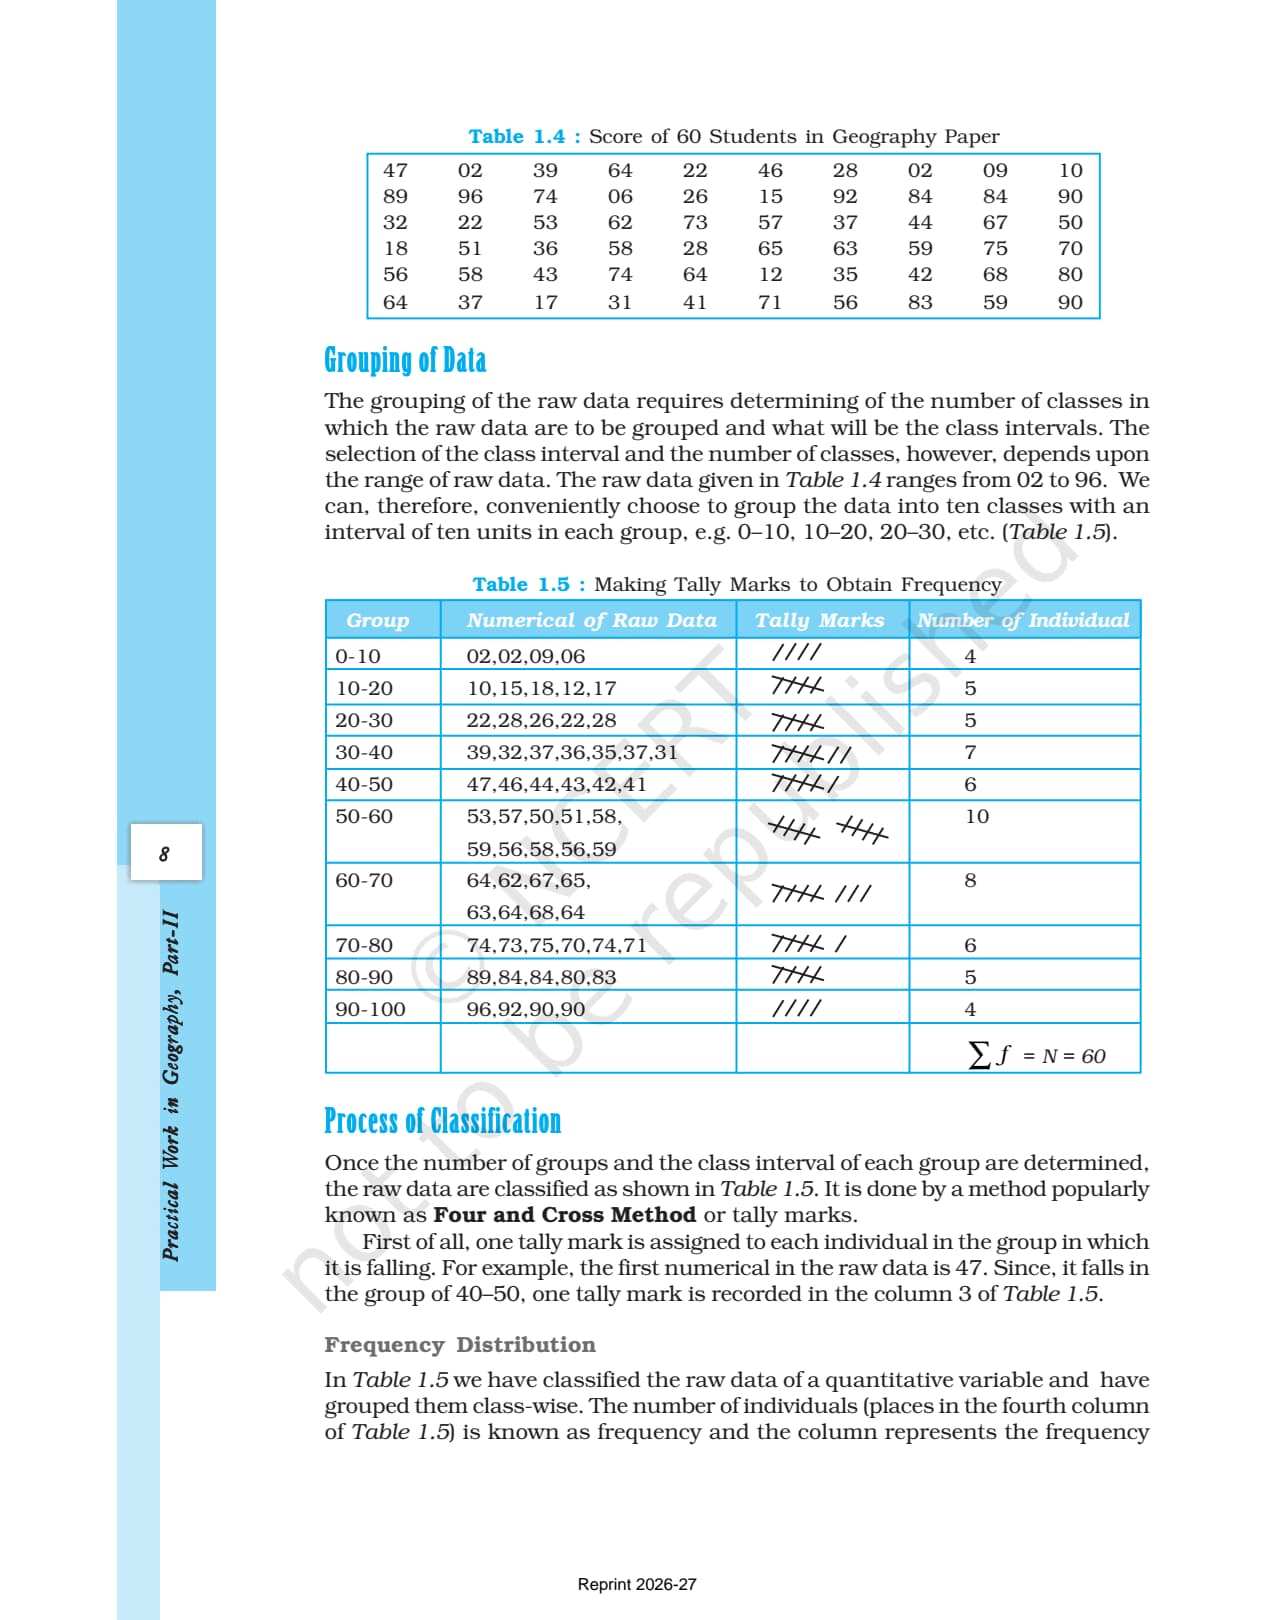
| 1.6 | Tabulation and Classification | Statistical table; raw data organisation; tally marks; frequency distribution |
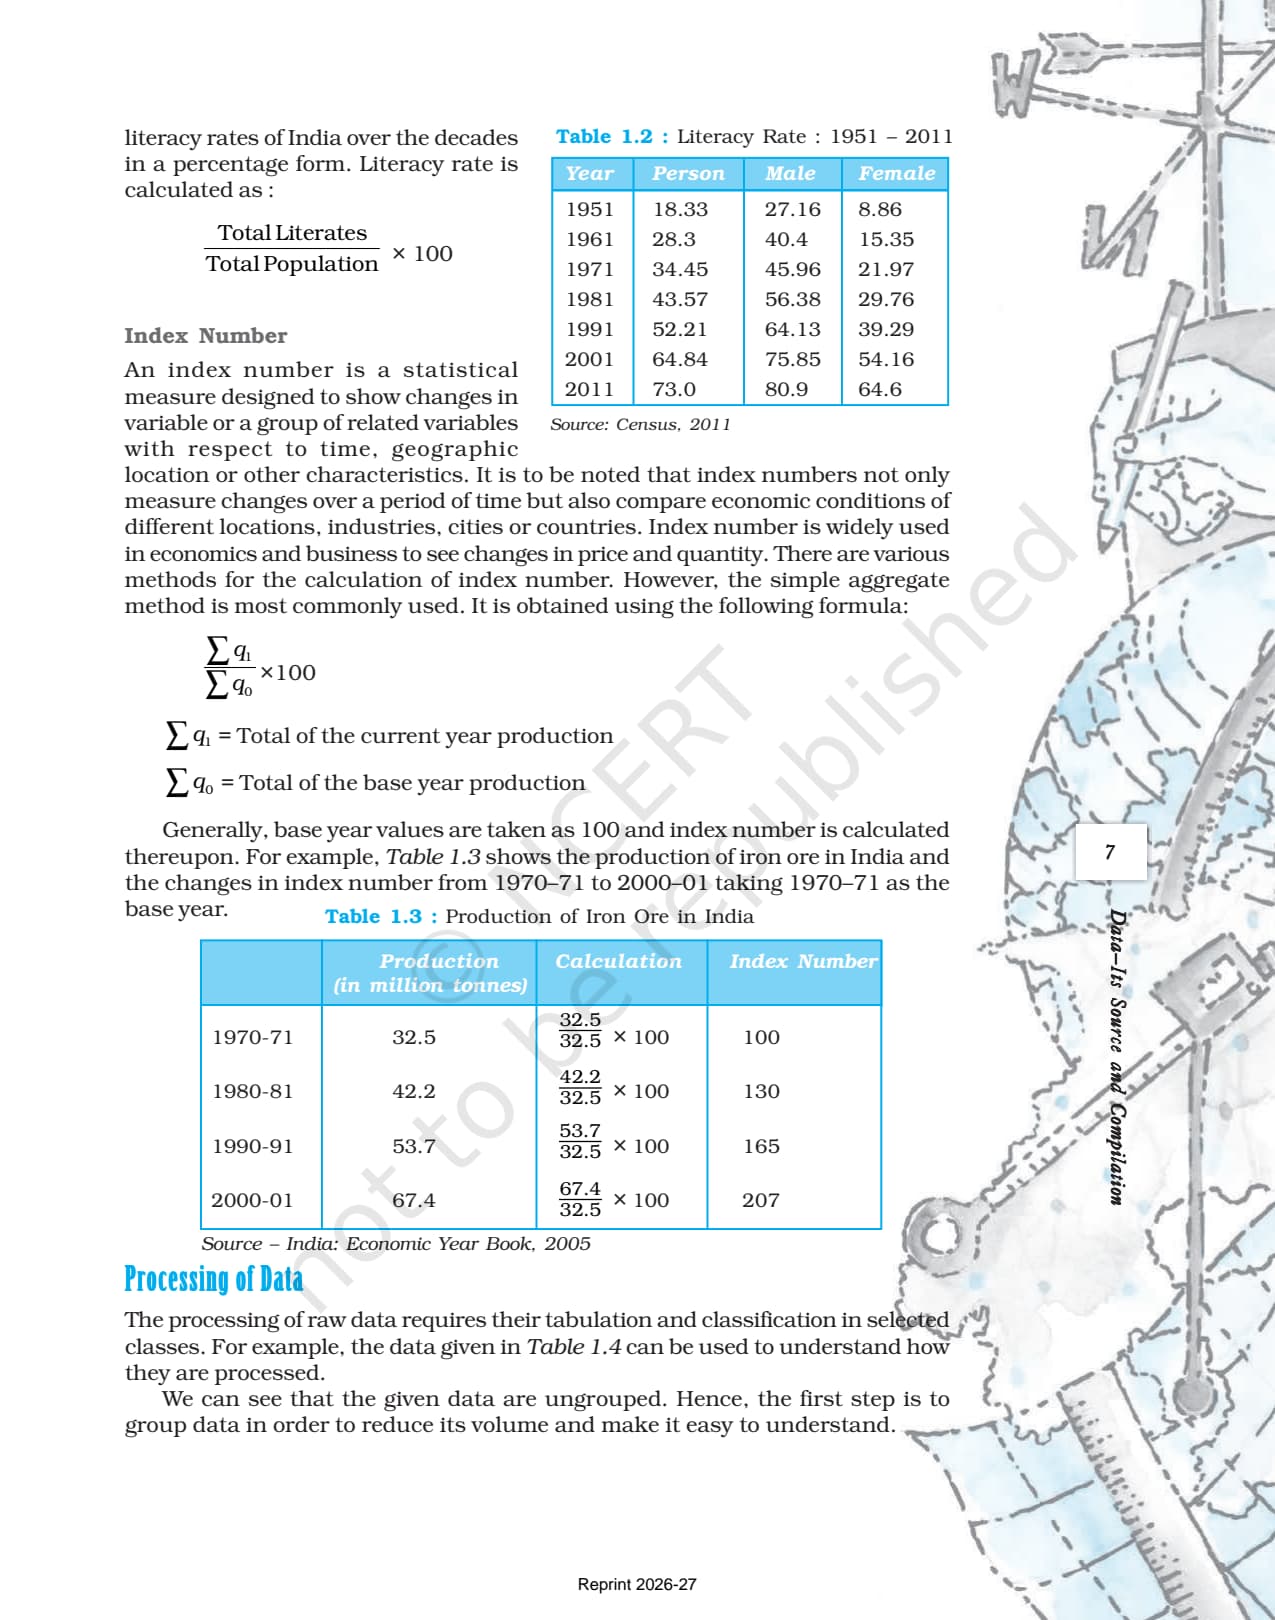
| 1.7 | Data Compilation and Presentation | Absolute data, percentage data, index numbers; exclusive and inclusive methods; Ogive |
The sections on primary and secondary sources contribute the largest share of board-paper questions, because naming the source types and their sub-types is the most testable skill in the chapter.
Key Concepts From the NCERT Class 12 Geography Textbook
Reproducing the NCERT's exact phrasing is the fastest route to full marks on theory questions. The four concept blocks below are taken directly from this chapter.
Primary Sources of Data
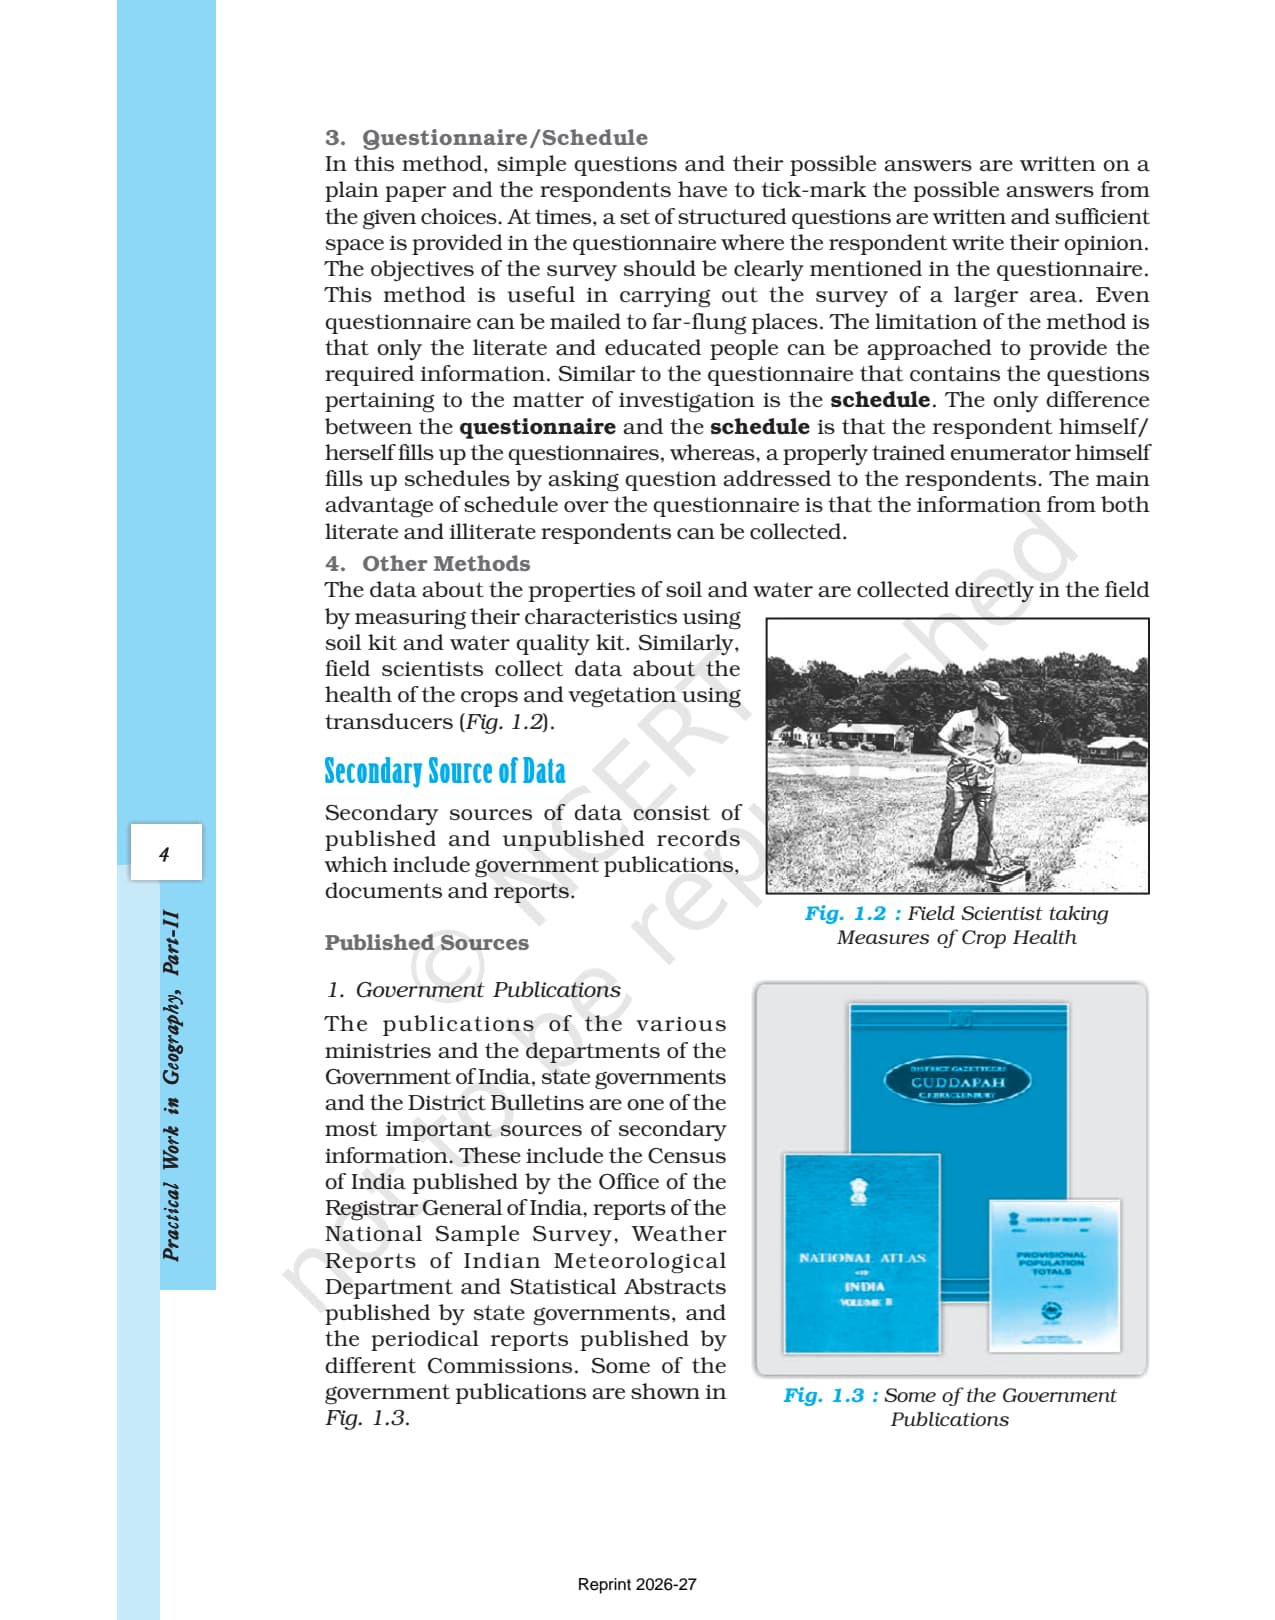
Primary data is data collected for the first time. The four methods are personal observation (field survey of relief, drainage, soil, vegetation), interview (information gathered through dialogue), questionnaire/schedule (structured questions), and other methods (field kits, transducers). The key difference: the surveyed person fills a questionnaire, while a trained enumerator fills a schedule, so a schedule can reach people who cannot read or write.
Secondary Sources of Data
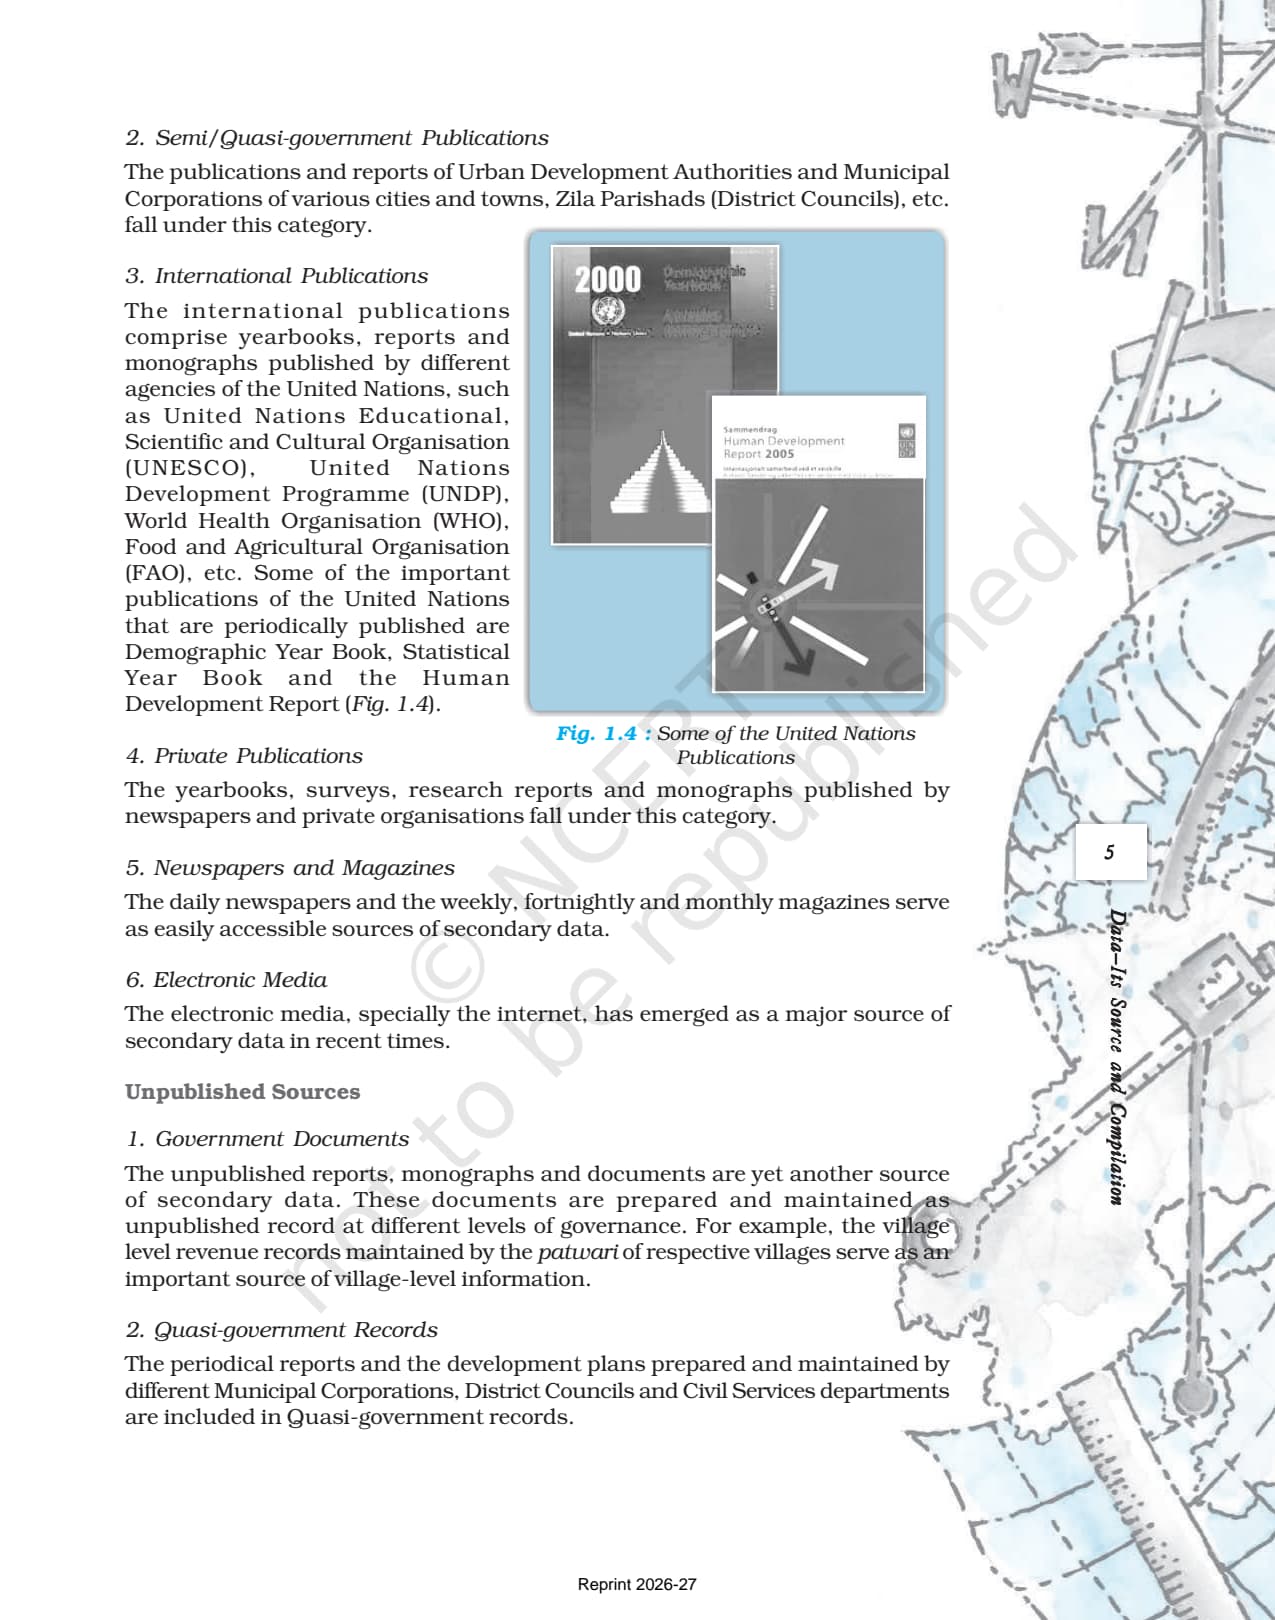
Secondary data comes from records that already exist. Published sources include government publications (Census of India, National Sample Survey, weather reports), quasi-government publications, international publications (UNESCO, UNDP, WHO, FAO), private publications, newspapers, and electronic media. Unpublished sources include government documents (patwari village records), quasi-government records, and private documents. Board questions often ask students to name any three secondary sources.
Tabulation and Statistical Tables
A statistical table is a systematic arrangement of data in columns and rows, with a title, sub-title, column headings, body, and footnotes. Tables simplify presentation and make comparison easy; CBSE sometimes asks for these components as a two-mark question. Tally marks (grouping by four and crossing the fifth) are the standard way to count raw data before a frequency distribution table.
Frequency Distribution and Ogive
The chapter introduces two methods of forming frequency class intervals. In the exclusive method, the upper limit of one class becomes the lower limit of the next class, so a value equal to the upper limit is excluded from that class and included in the next. In the inclusive method, both limits are included in the same class, so the upper limit of one class differs by 1 from the lower limit of the next. An Ogive is the curve plotted from cumulative frequency data: the less-than Ogive is a rising curve, and the more-than Ogive is a declining curve. A frequency polygon compares two or more distributions.
Previous Year Question Trends From This Chapter
This chapter has contributed 3 to 5 marks across recent board papers, mostly through short-answer and definition questions. Expect roughly the same distribution for 2026-27, as no structural change to the Geography paper has been announced.
| Year | Marks | Question Types | Most Common Topic |
|---|---|---|---|
| 2025 | 5 | 1 MCQ + 1 short answer + 1 five-mark question | Primary vs secondary sources with examples |
| 2024 | 4 | 1 MCQ + 1 short answer + 1 two-mark question | Questionnaire vs schedule distinction |
| 2023 | 5 | 2 MCQs + 1 three-mark question | Sources of secondary data (government publications) |
| 2022 | 3 | 1 MCQ + 1 short answer | Definition of data and datum |
| 2020 | 5 | 1 five-mark question + 1 MCQ | Precautions for conducting interviews |
The most repeated question asks students to distinguish primary from secondary sources, or to list the secondary published sources, both of which need the textbook classification.
What Students Should Avoid While Reading This NCERT PDF
Students make a few predictable mistakes when reading this chapter cold. The costliest is memorising source names without understanding each definition and distinction, since CBSE asks students to "explain" a method or "state the difference".
- Do not skip the eight interview precautions. They appear as five-mark questions and require knowing the full list from the NCERT PDF.
- Do not confuse questionnaire with schedule. The NCERT makes a precise distinction based on who fills it; getting this wrong costs marks in one-mark questions.
- Do not skip the statistical fallacy story. It is the textbook's illustration of why correct data presentation matters and appears in "explain with example" questions.
- Do not read the chapter only once. The chapter has many named categories and sub-categories; two passes spread a week apart work better than one sitting.
Connecting This Chapter to the Rest of Practical Work in Geography
This chapter is the foundation for the remaining three chapters. Roughly 40% of the Practical Work in Geography paper depends on skills introduced here, because every later chapter assumes students know how raw data is collected and organised.
| Later Chapter | Concept Inherited From Chapter 1 |
|---|---|
| Chapter 2: Data Processing | Measures of central tendency and dispersion applied to tabulated data from Chapter 1 |
| Chapter 3: Graphical Representation of Data | Frequency polygon and Ogive from Chapter 1 extended into bar graphs, pie charts, and histograms |
| Chapter 4: Spatial Information Technology | Geographic data from primary and secondary sources processed through GIS systems |
Quick Glossary From the NCERT Chapter
Students should be able to define each term in a single line for one-mark MCQs and two-mark short answers. The glossary below lists the most testable terms.
- Data: Numbers that represent measurements from the real world.
- Datum: A single measurement from the real world.
- Primary data: Data collected for the first time by an individual or institution through direct observation or inquiry.
- Secondary data: Data collected from any published or unpublished sources that already exist.
- Questionnaire: A set of structured questions that the surveyed person fills in themselves; limited to those who can read and write.
- Schedule: A set of structured questions filled in by a trained enumerator; can reach people who cannot read or write.
- Raw data: Data in its original collected form before tabulation or classification.
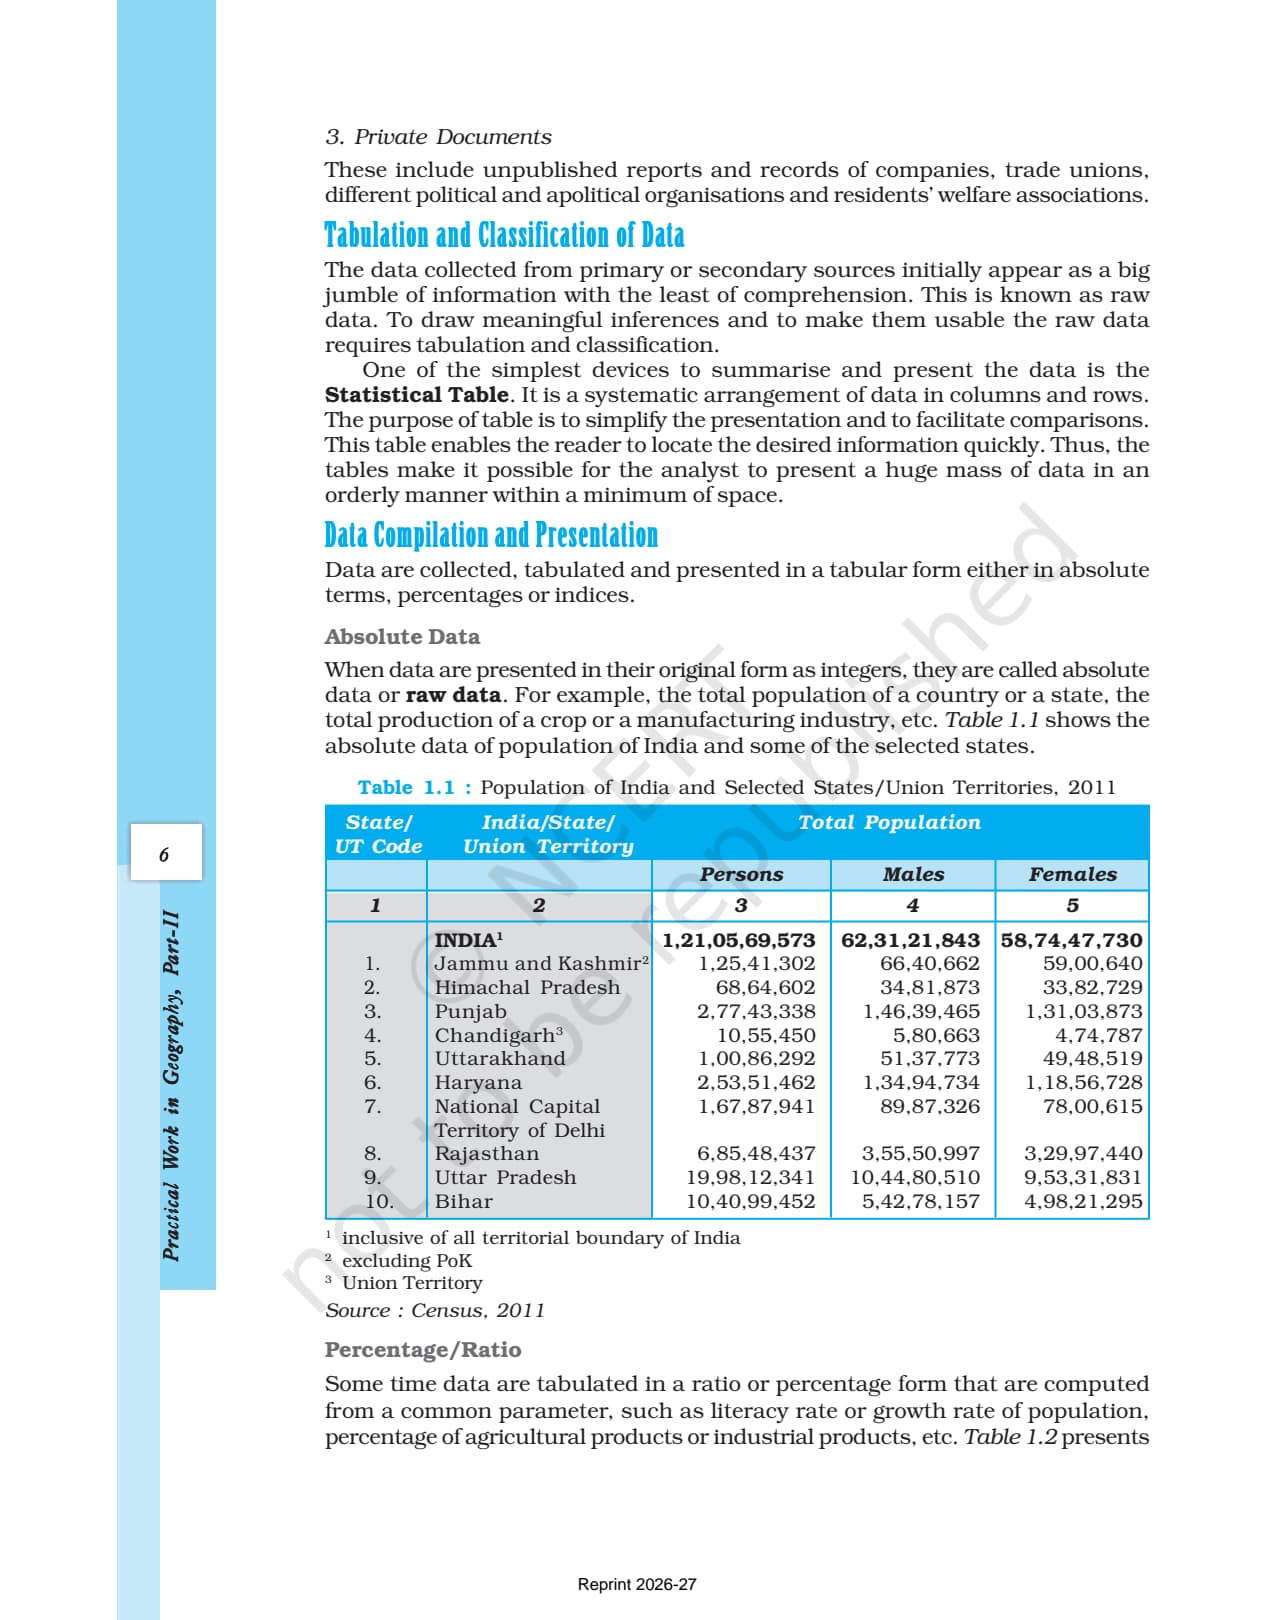
- Statistical table: A systematic arrangement of data in columns and rows to simplify presentation and facilitate comparisons.
- Frequency distribution: A table showing the number of times each value or group of values occurs in a data set.
- Ogive: A curve plotted from cumulative frequency data; less-than Ogive is a rising curve, more-than Ogive is declining.
Also Explore Other Resources for Class 12 Geography Chapter 1
| Resource | Link |
|---|---|
| NCERT Solutions | Class 12 Geography Chapter 1 PWG NCERT Solutions |
| Revision Notes | Class 12 Geography Chapter 1 PWG Notes |
| Handwritten Notes | Class 12 Geography Chapter 1 PWG Handwritten Notes |
| Subject Hub | Class 12 Geography All Chapters |
All Chapters: Class 12 Geography NCERT Book PDF (Practical Work in Geography)
| Chapter | NCERT Book PDF |
|---|---|
| Chapter 1 | Data: Its Source and Compilation NCERT Book PDF (You are here) |
| Chapter 2 | Data Processing NCERT Book PDF |
| Chapter 3 | Graphical Representation of Data NCERT Book PDF |
| Chapter 4 | Spatial Information Technology NCERT Book PDF |
Frequently Asked Questions on Class 12 Geography Chapter 1 PWG NCERT Book PDF
Ques. Where can students download the official NCERT Class 12 Geography Practical Work Chapter 1 PDF?
Ans. Students can download the official data its source and compilation class 12 NCERT book PDF directly from the download card at the top of this page. The PDF is the single-chapter file from the Practical Work in Geography textbook, aligned to the 2026-27 CBSE syllabus.
Ques. What is the difference between primary and secondary sources of data according to NCERT?
Ans. Primary data is collected for the first time by an individual or institution through direct methods like personal observation, interview, or questionnaire. Secondary data is collected from any already-existing published or unpublished sources, such as government publications, UN reports, newspapers, or private documents. The key difference is originality: primary data has never been collected before, while secondary data already exists somewhere.
Ques. What is the difference between a questionnaire and a schedule in the NCERT Class 12 Geography textbook?
Ans. In a questionnaire, the surveyed person fills in the answers themselves, which means it can only reach those who can read and write. In a schedule, a trained enumerator visits the person and fills in the answers on their behalf, so it can reach both literate and illiterate people. This is the main advantage of a schedule over a questionnaire, as stated in the NCERT textbook.
Ques. What are the four methods of collecting primary data in NCERT Class 12 Geography?
Ans. The four methods are: (1) Personal Observation - direct field survey of physical and human features; (2) Interview - direct information obtained through dialogue with people in the area; (3) Questionnaire or Schedule - structured written questions filled by the person being surveyed or by a trained enumerator; (4) Other Methods - using field kits to measure soil and water properties, and transducers to measure crop health.
Ques. What is an Ogive in the context of Class 12 Geography Chapter 1?
Ans. An Ogive (pronounced "ojive") is a curve obtained by plotting cumulative frequencies. It is constructed using either the less-than method (cumulative frequencies plotted against upper class limits, giving a rising curve) or the more-than method (cumulative frequencies plotted against lower class limits, giving a declining curve). Both curves can be plotted together to get a comparative picture of the data distribution.
Ques. What are the published secondary sources of data listed in the NCERT textbook?
Ans. The published secondary sources listed in the NCERT textbook are: (1) Government publications - Census of India, National Sample Survey, Indian Meteorological Department reports, state Statistical Abstracts; (2) Quasi-government publications - Urban Development Authorities, Municipal Corporations, Zila Parishads; (3) International publications - UNESCO, UNDP, WHO, FAO yearbooks and reports; (4) Private publications - newspapers and private organisation research reports; (5) Electronic media - especially the internet.
Ques. What is the statistical fallacy story in the NCERT Class 12 Geography Chapter 1?
Ans. The NCERT tells the story of a traveller who fathomed the depth of a river at four points as 0.6, 0.8, 0.9, and 1.5 metres and calculated the average as 0.95 metres. His child was 1 metre tall, so he led his family to cross the river. His child drowned in the deeper part. The story illustrates that presenting data only as an average can be misleading when the variation within the data set matters. This is called statistical fallacy.
Ques. What is the difference between the exclusive and inclusive methods of frequency distribution?
Ans. In the exclusive method, the upper limit of one class is excluded from that class and becomes the lower limit of the next class, so class intervals appear continuous (for example, 0-10, 10-20, 20-30). In the inclusive method, both limits are included in the same class, so the upper limit of one class differs by 1 from the lower limit of the next (for example, 0-9, 10-19, 20-29). Both methods spread values over the same number of units within each class.
Ques. Is the Class 12 Geography Practical Work syllabus changing for 2026-27?
Ans. No major changes have been announced. The Practical Work in Geography textbook chapter structure remains the same for 2026-27, and the official NCERT PDF available on this page is aligned to the 2026-27 CBSE syllabus. CBSE marking schemes continue to reward textbook phrasing in theory questions and correct method identification in practical questions.
Ques. How does CUET test Class 12 Geography Practical Work Chapter 1?
Ans. CUET Geography tests this chapter through MCQs on the definition of data, classification of primary and secondary sources, the questionnaire vs schedule distinction, types of frequency distribution, and the Ogive. Questions are drawn directly from the NCERT textbook, so reading the official PDF is the most effective preparation for both CUET and the CBSE board exam.
Ques. What is the best order to use the NCERT PDF, Notes, and Solutions for Class 12 Geography Practical Work Chapter 1?
Ans. Read the NCERT PDF cold first, marking the four primary source types and the six secondary source categories as you go. Then open the Class 12 Geography Chapter 1 PWG Notes alongside the PDF and write key distinctions in your own words. Attempt all exercise questions and verify them against the NCERT Solutions. Use the handwritten notes for last-mile revision the night before the exam.



Comments