




The NCERT Book for Class 10 Maths Chapter 13 Statistics is the official CBSE textbook chapter, free to read and download for 2026-27. It builds on the data-handling from earlier classes. You learn to find the mean, median and mode of grouped data and to draw cumulative frequency curves (ogives).
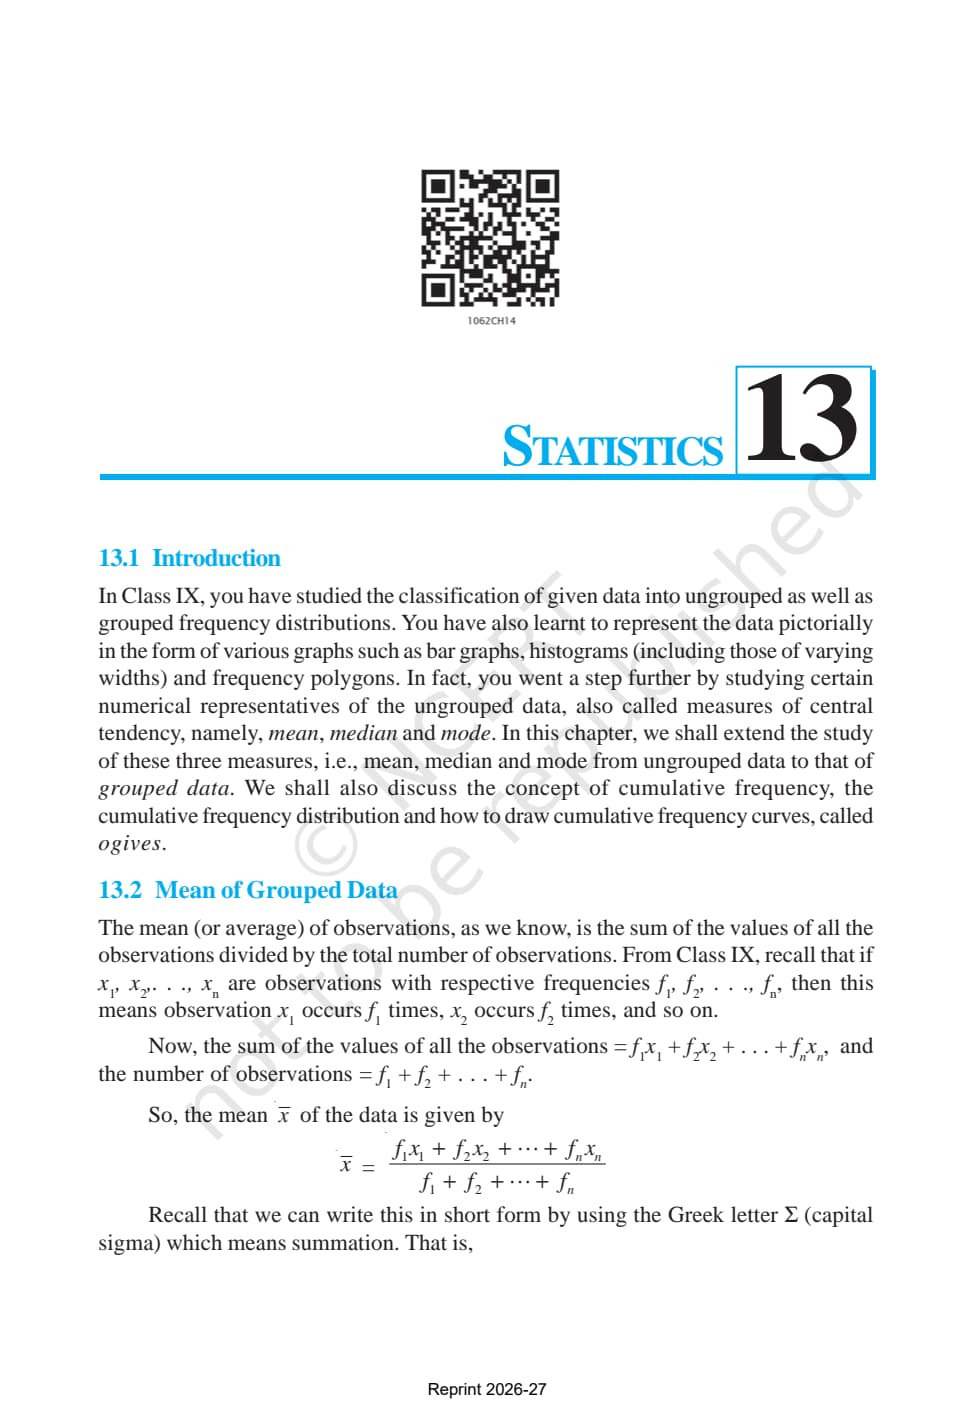
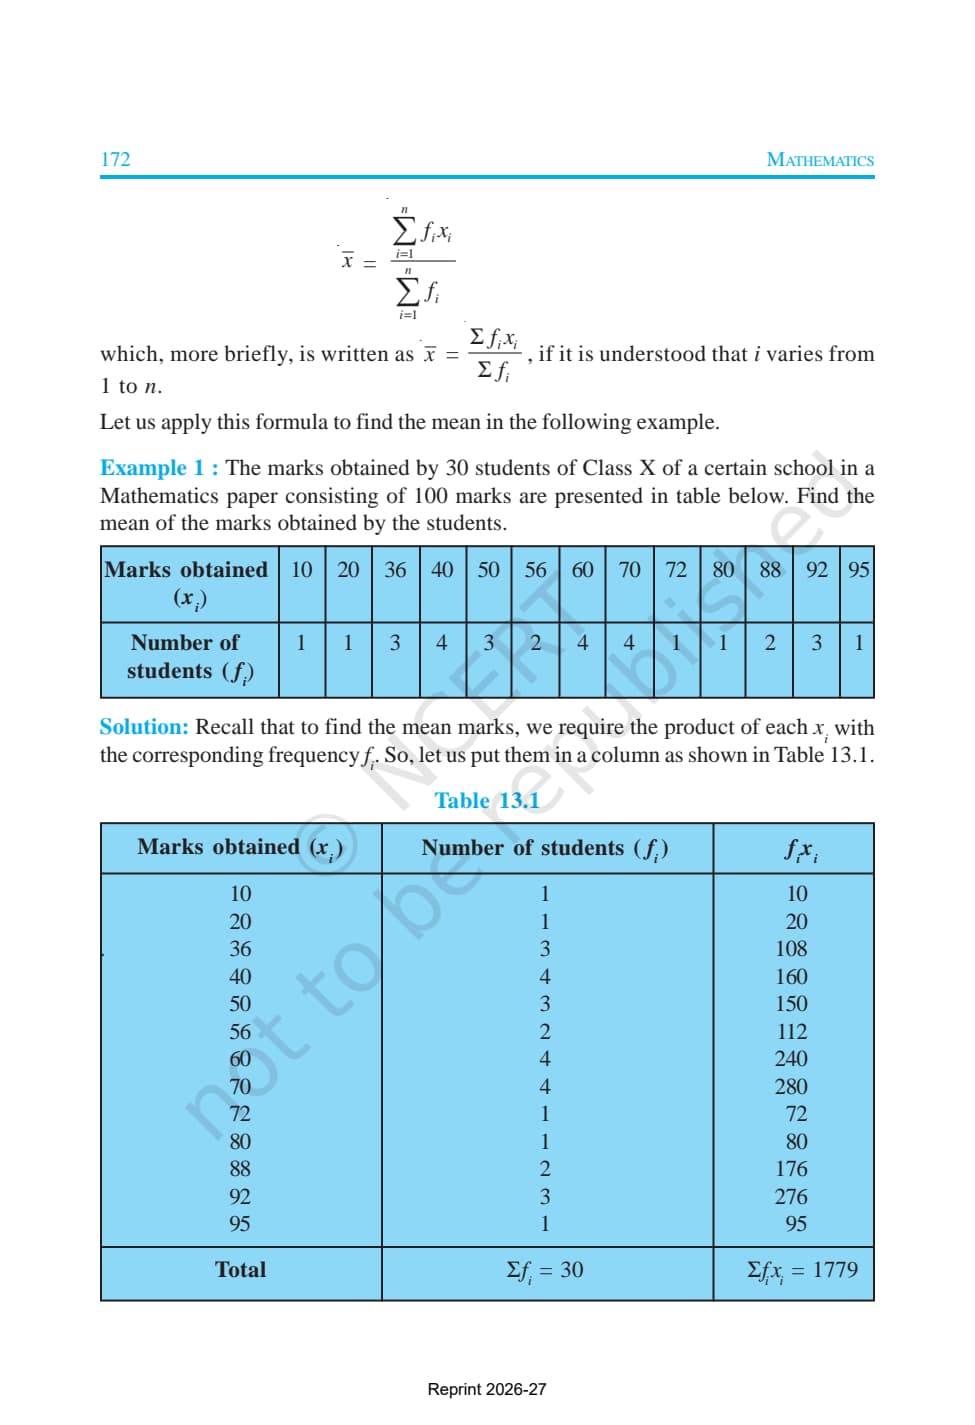
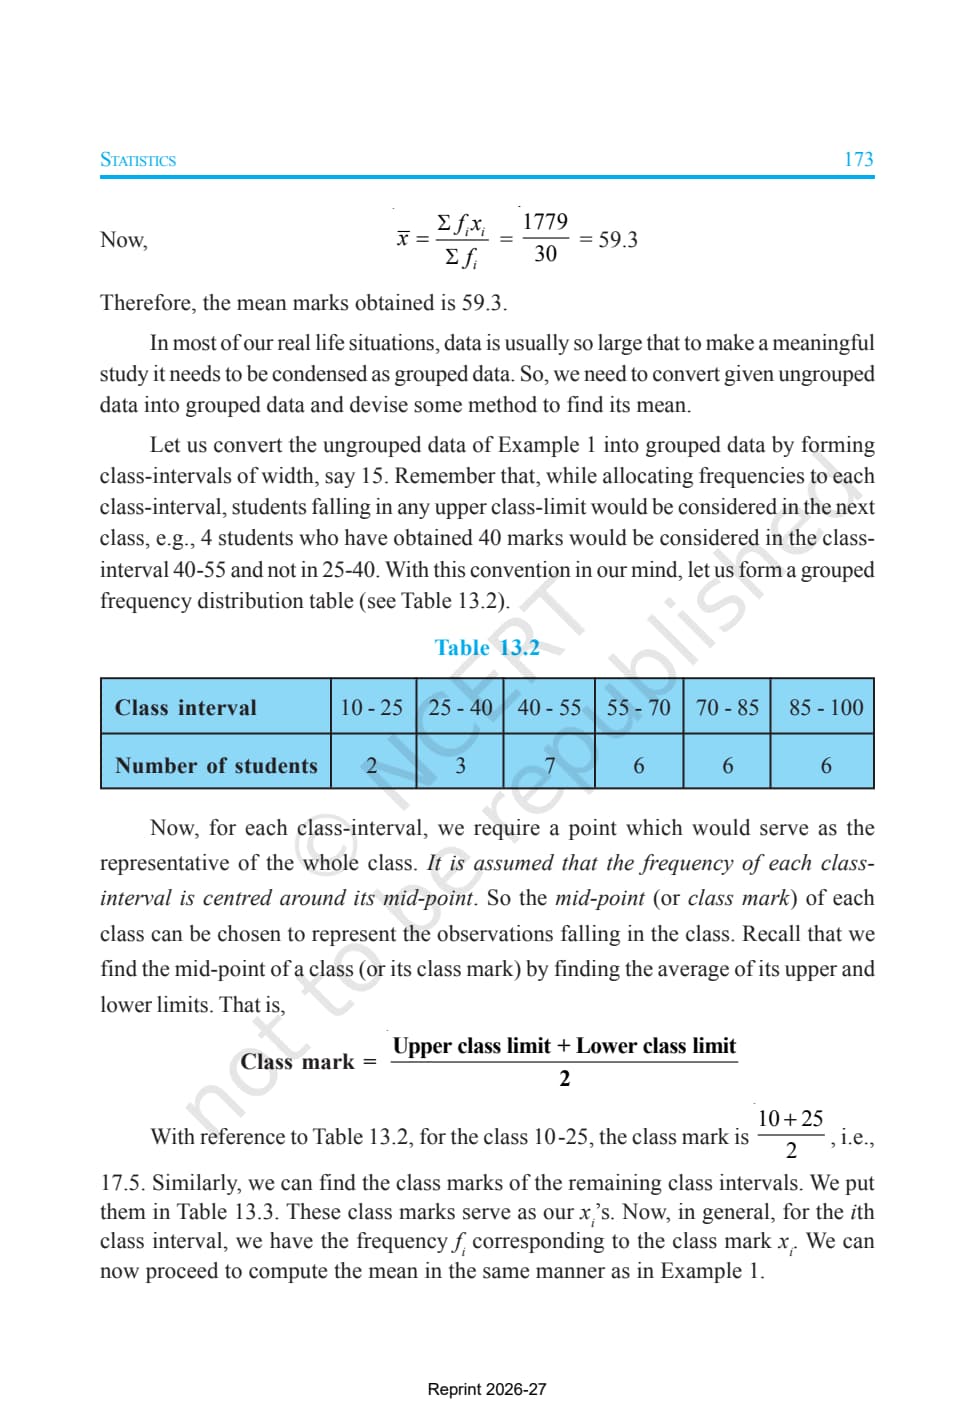
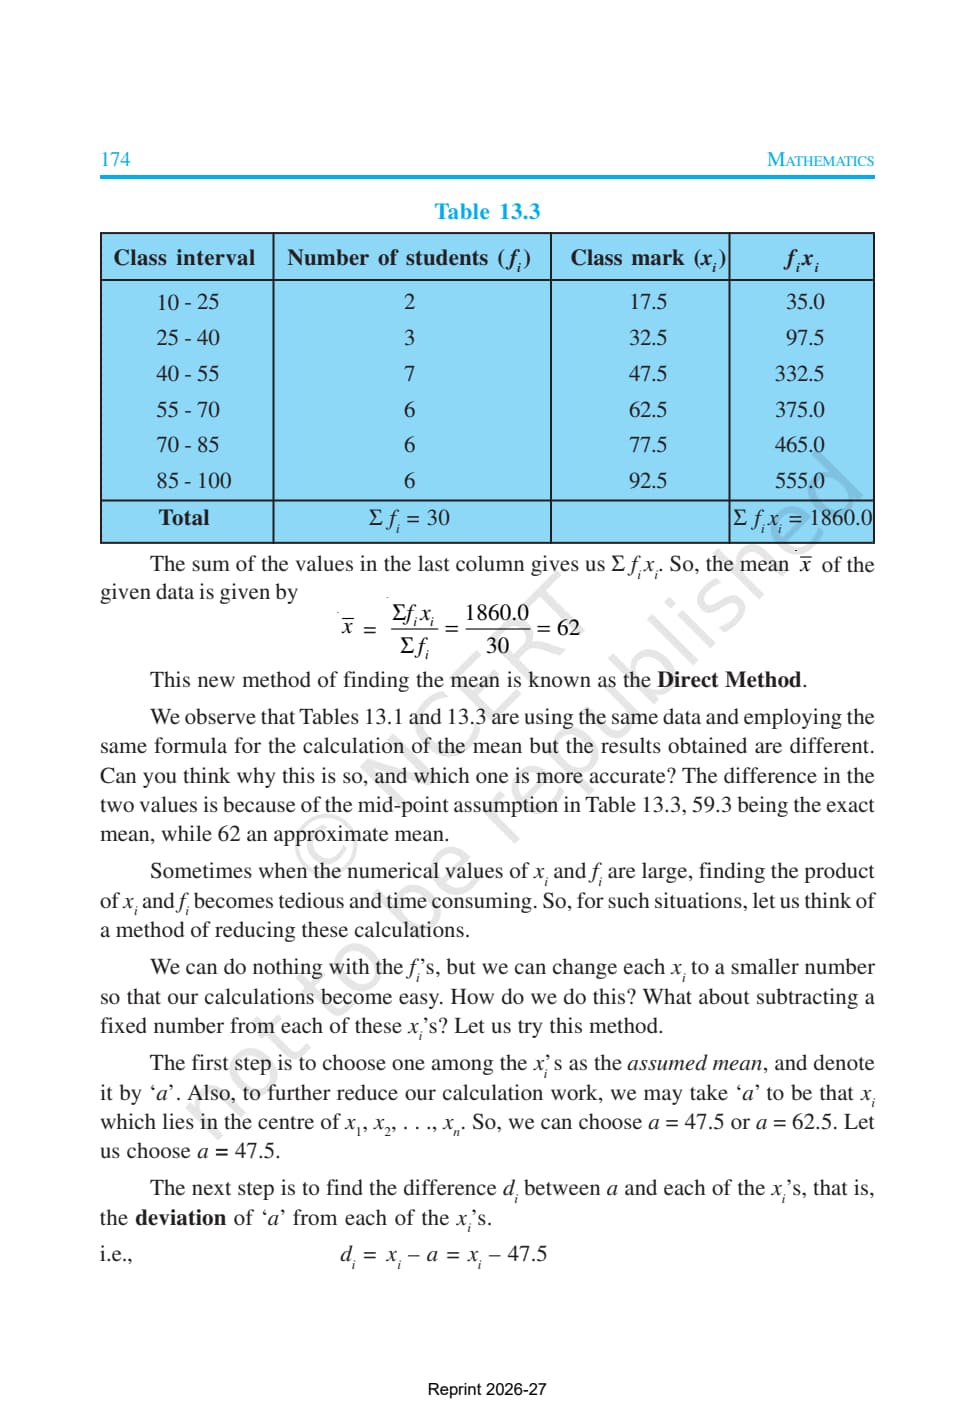
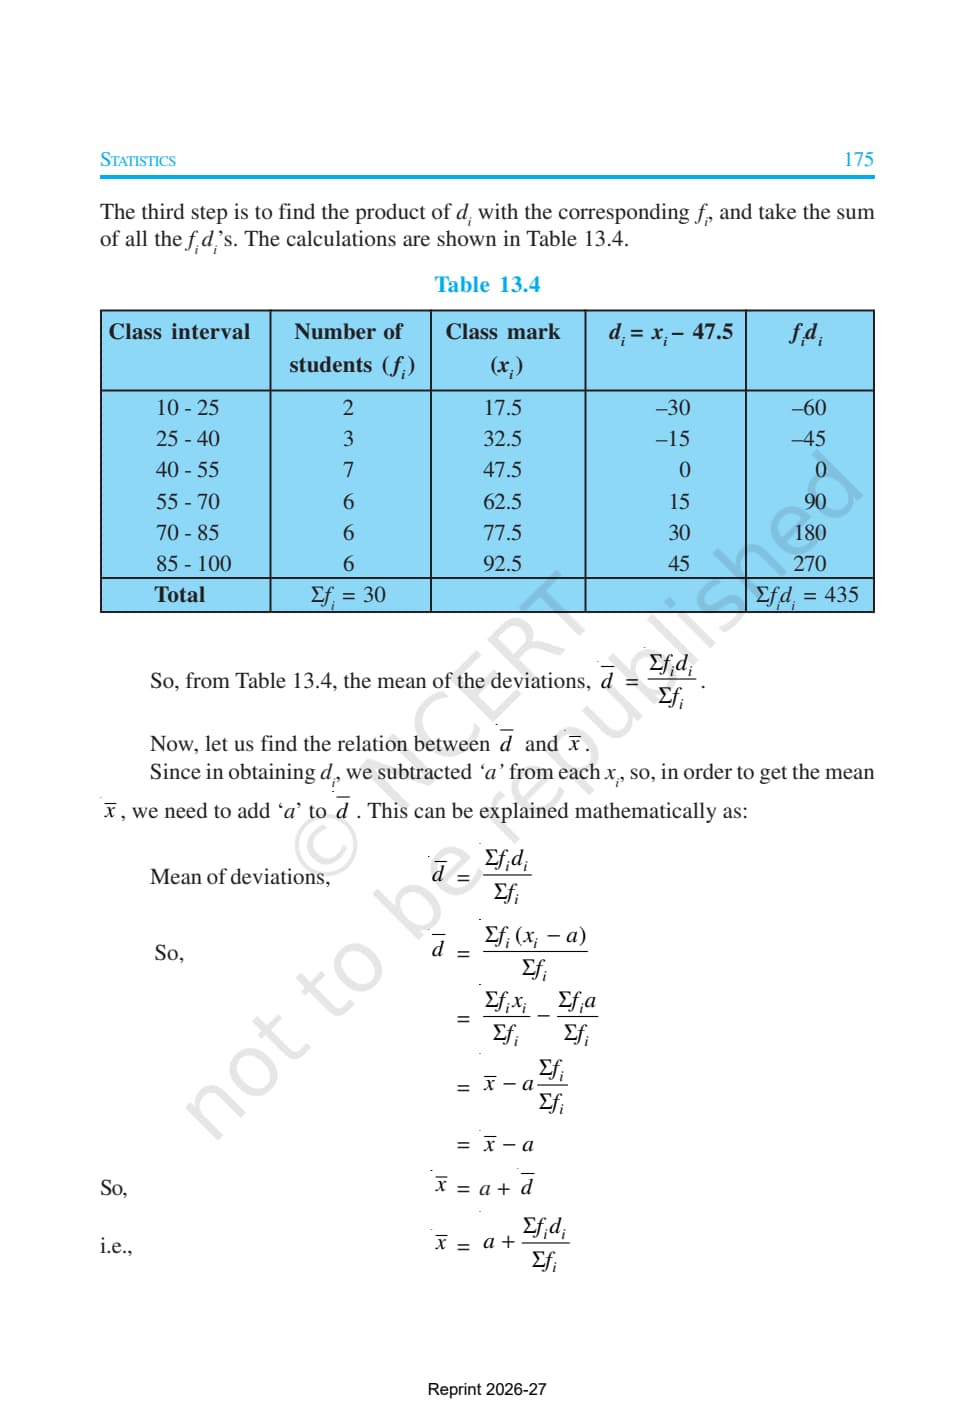
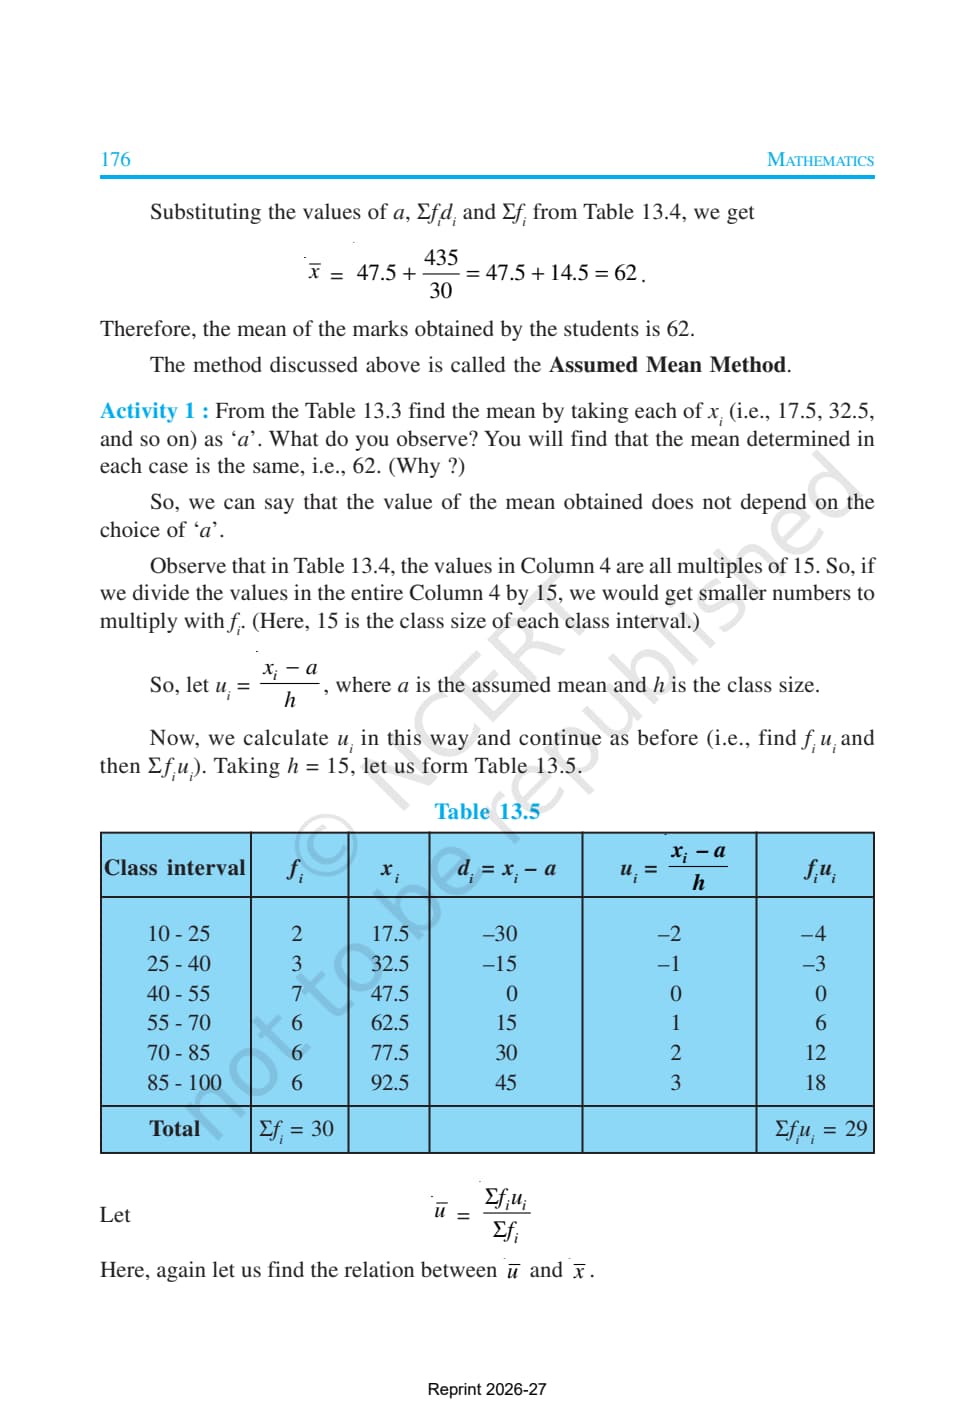
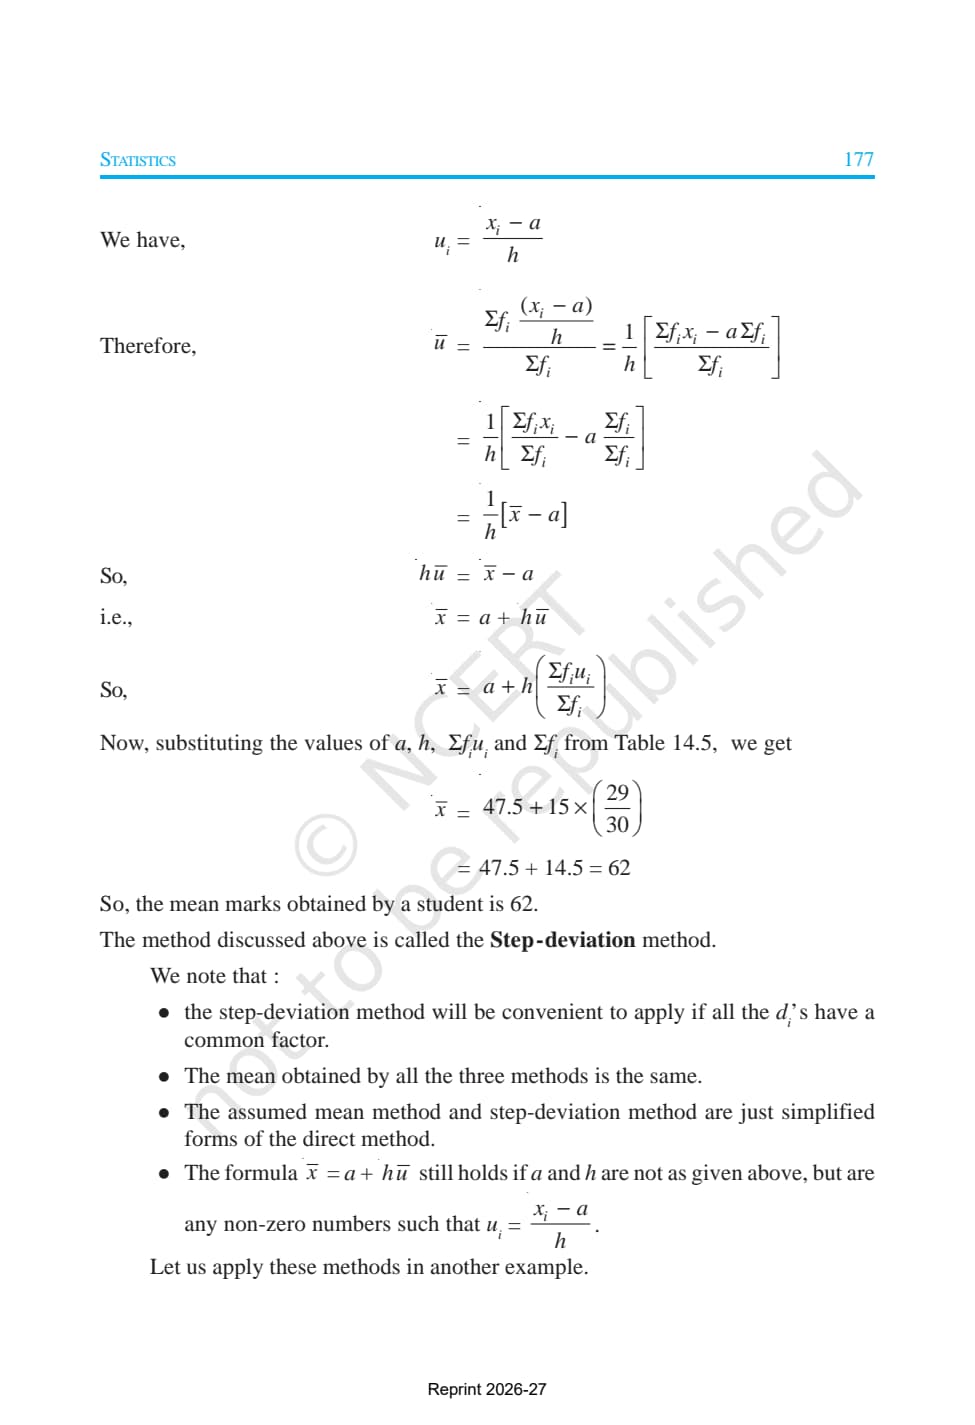
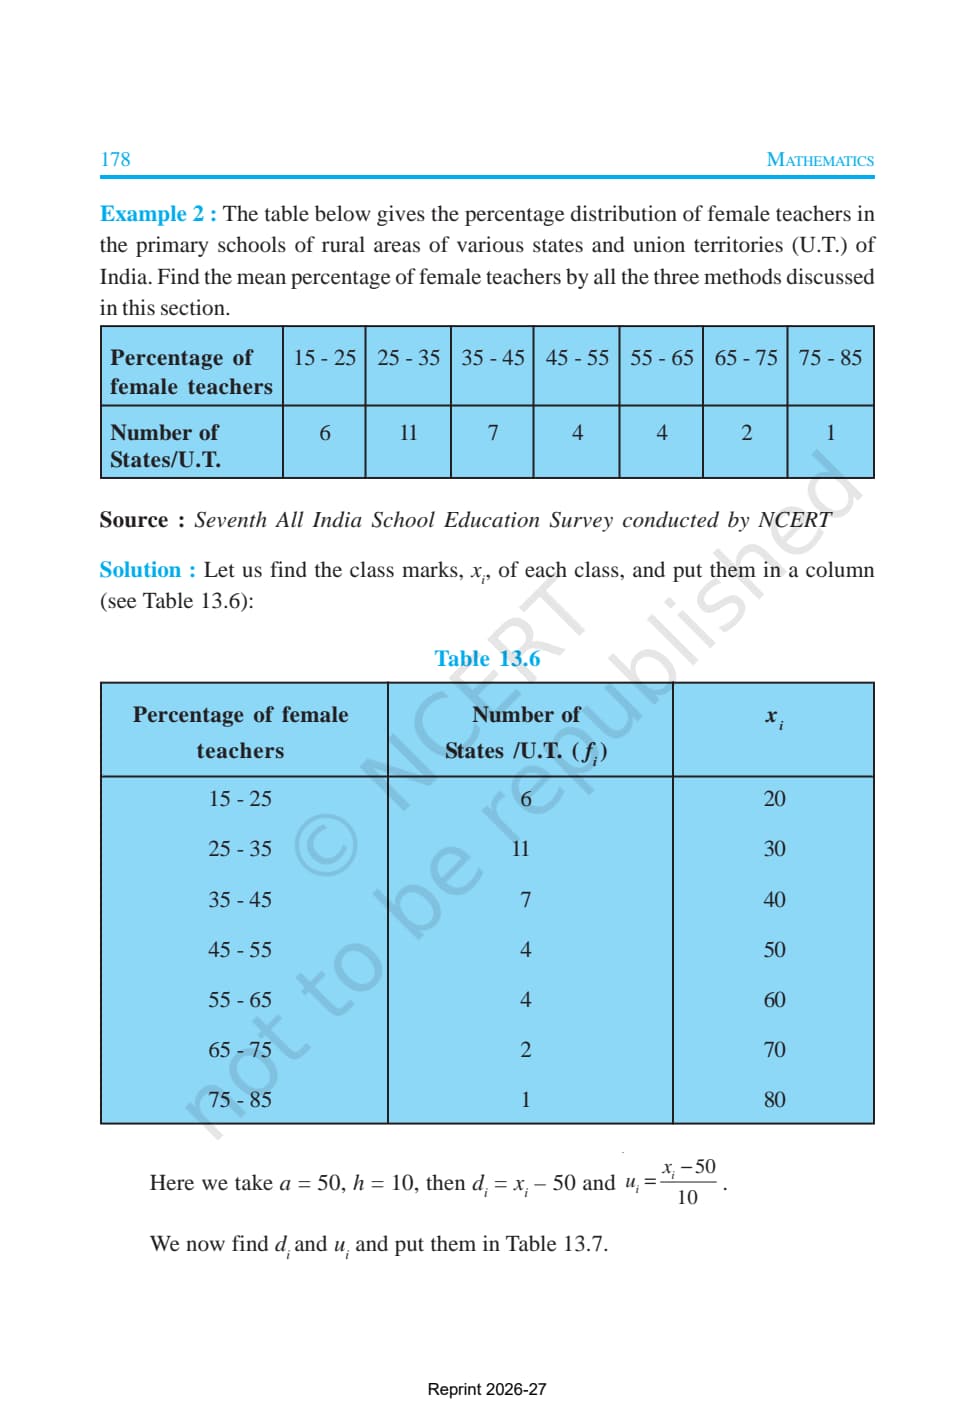
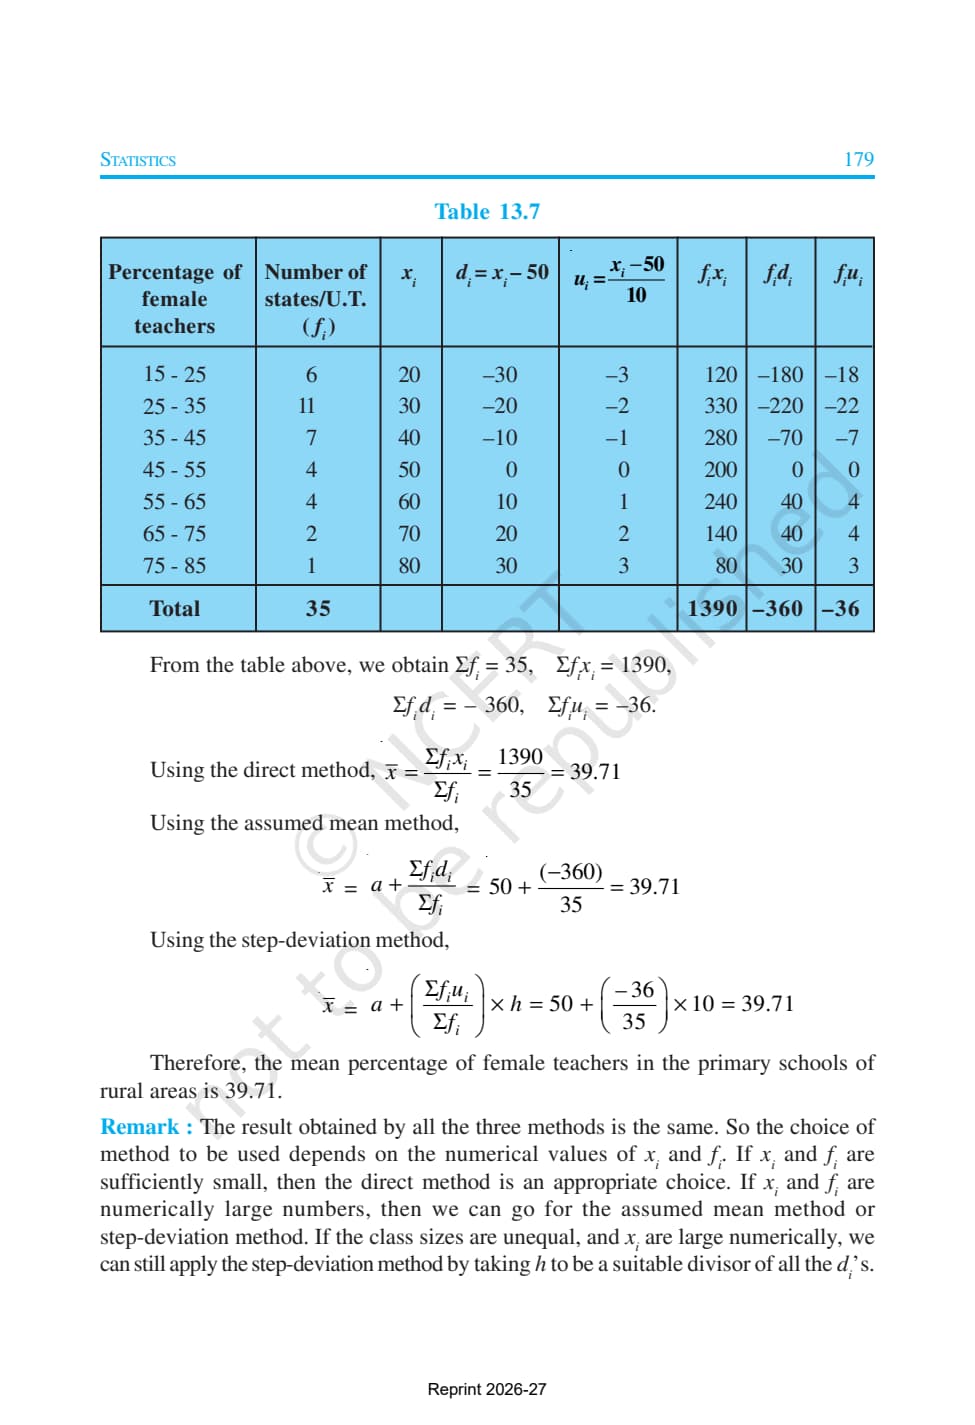
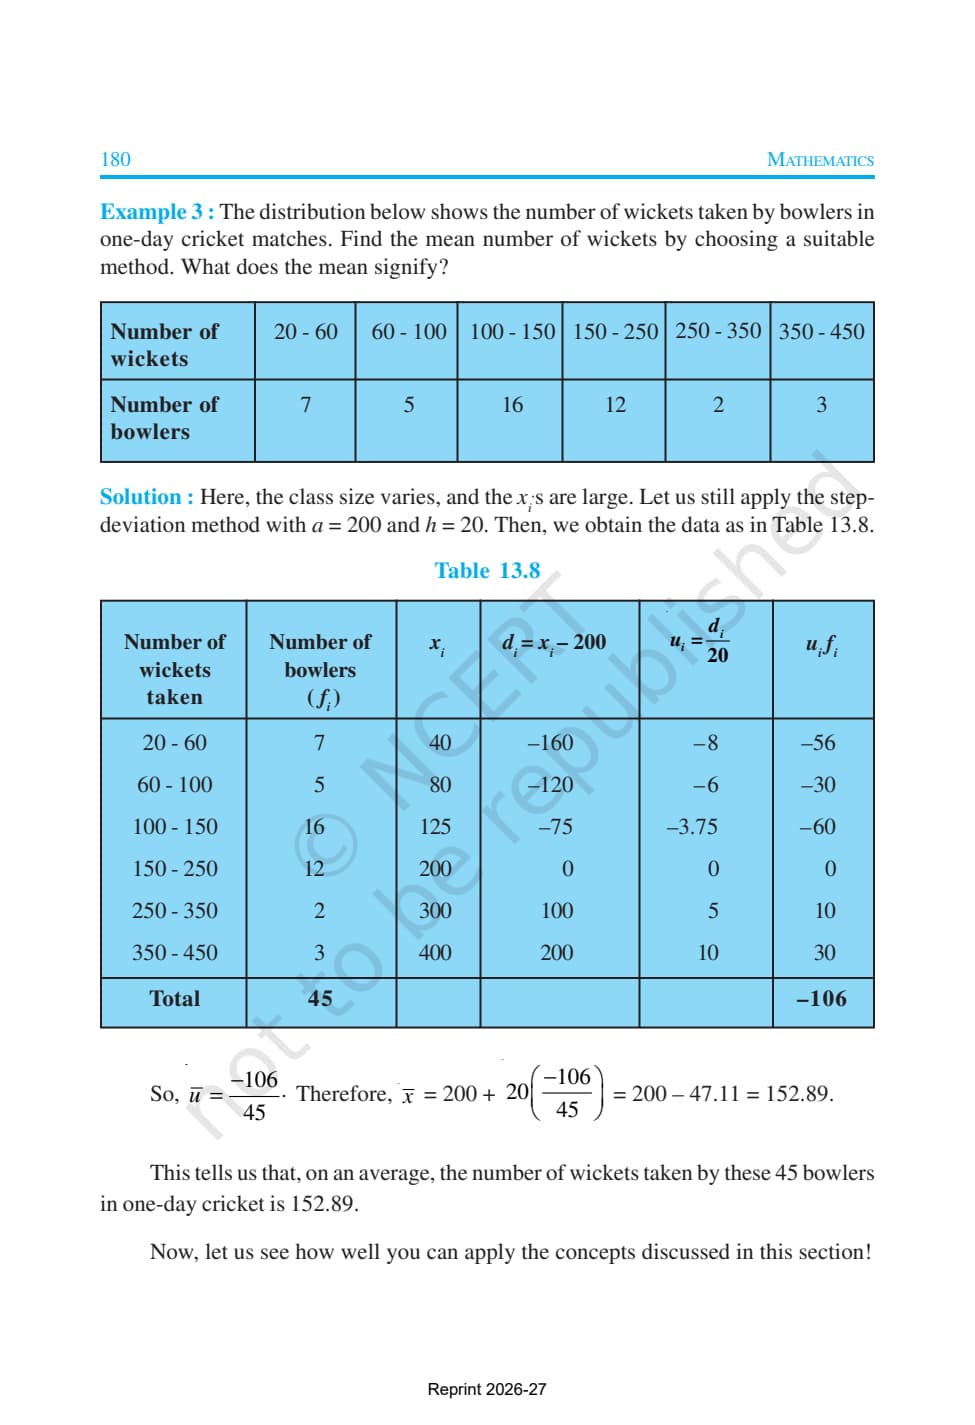
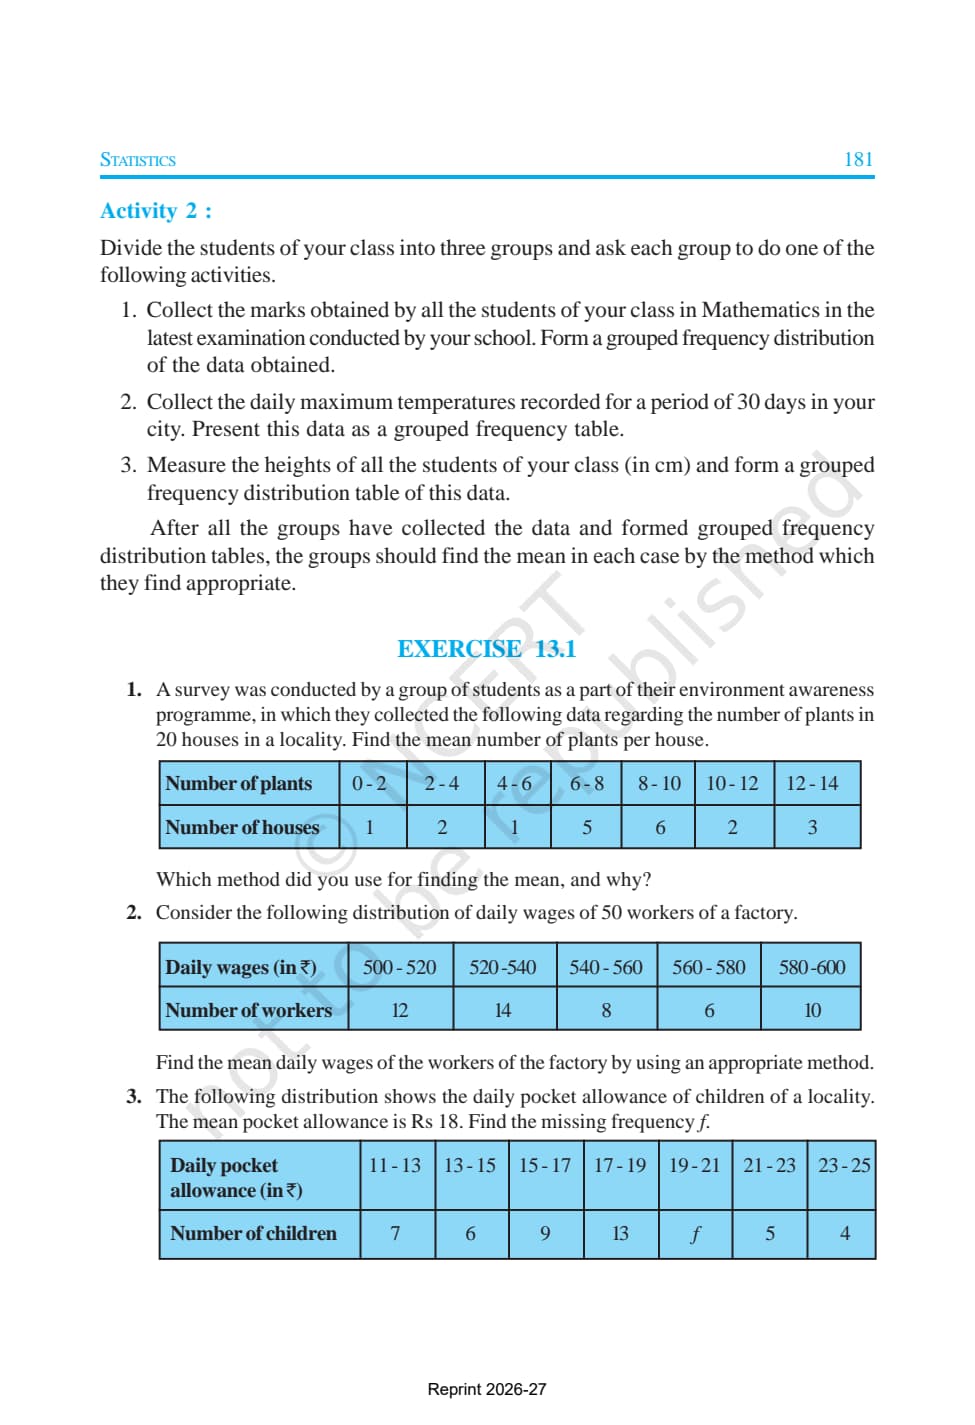
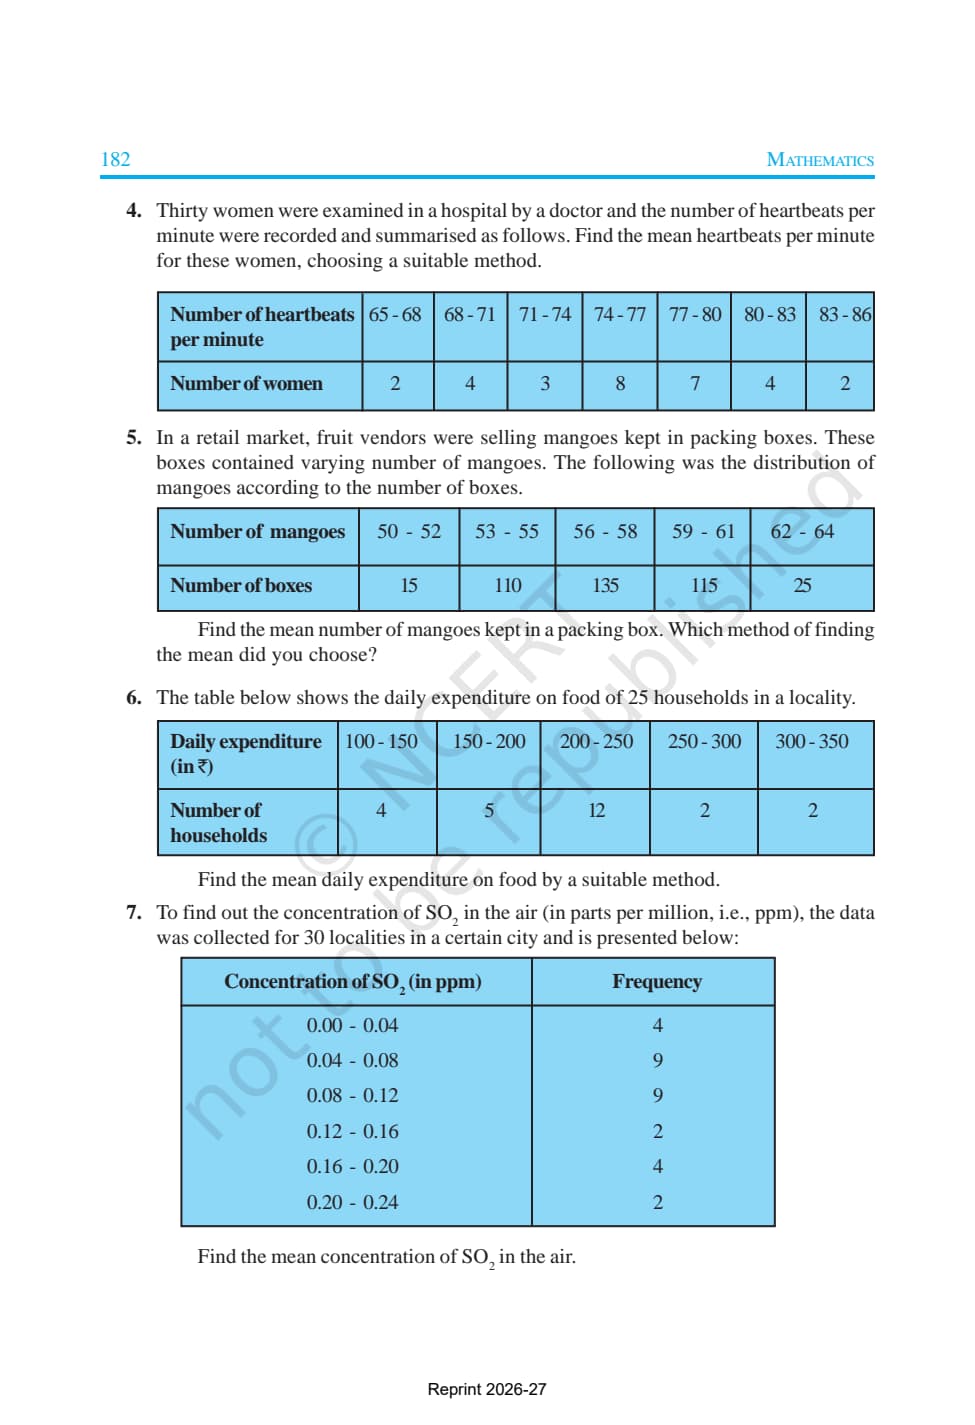
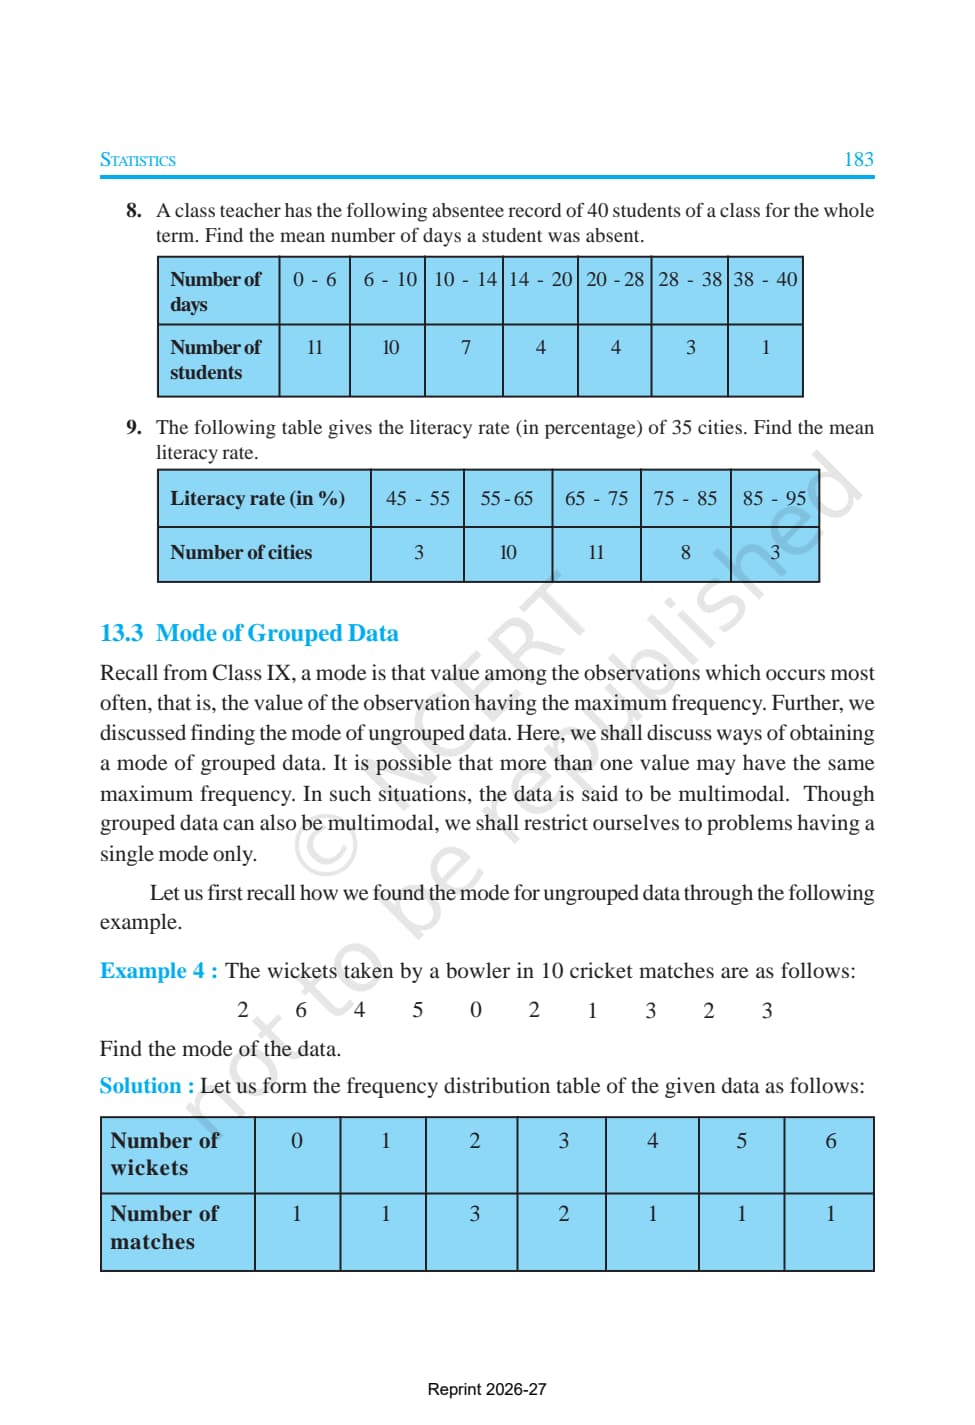
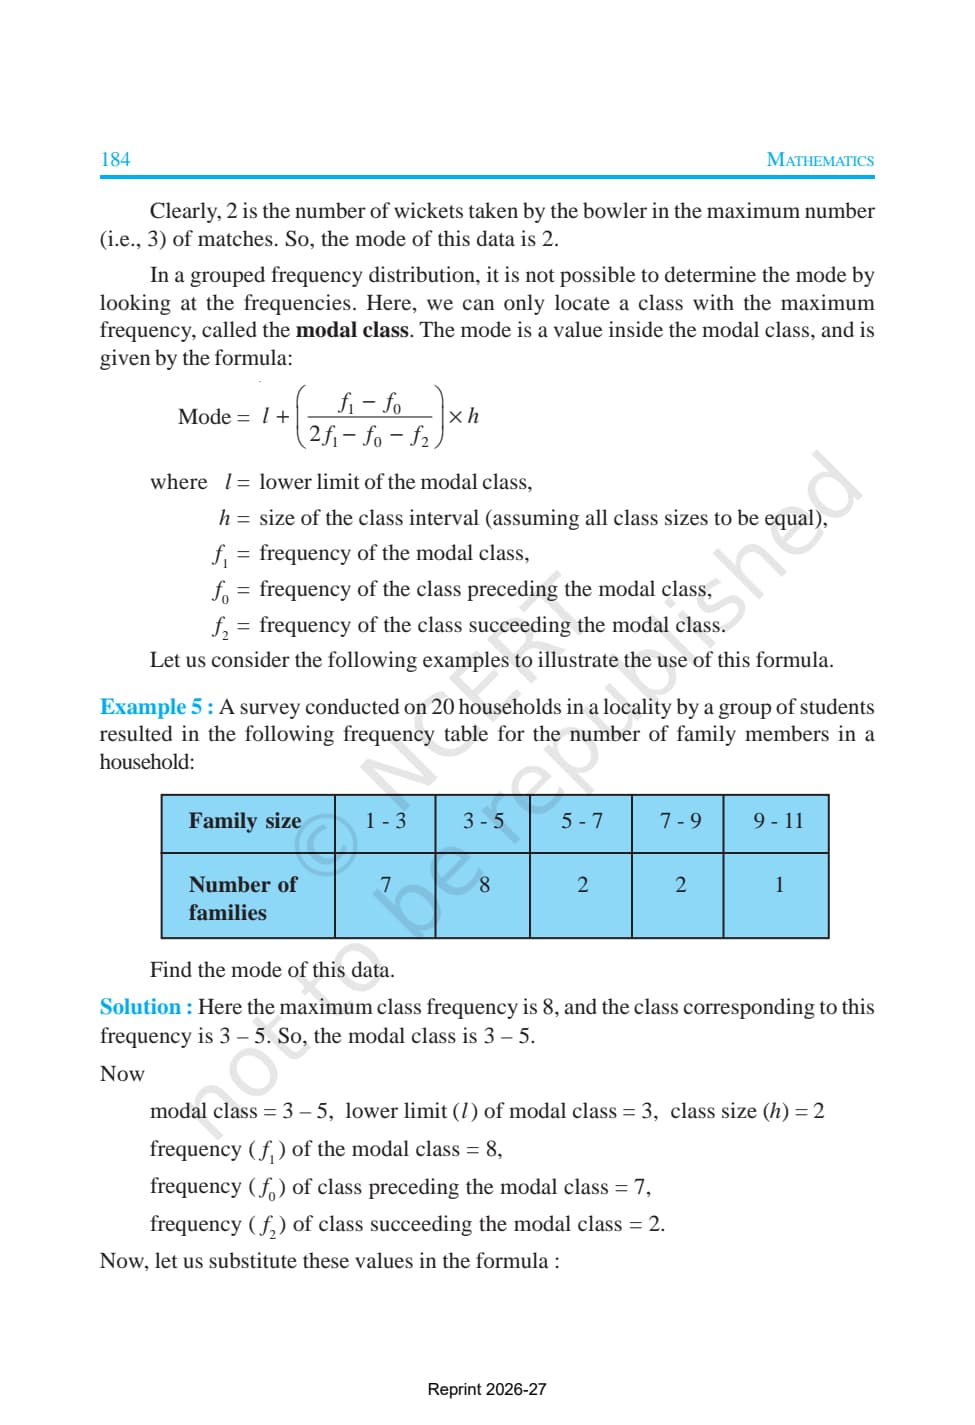
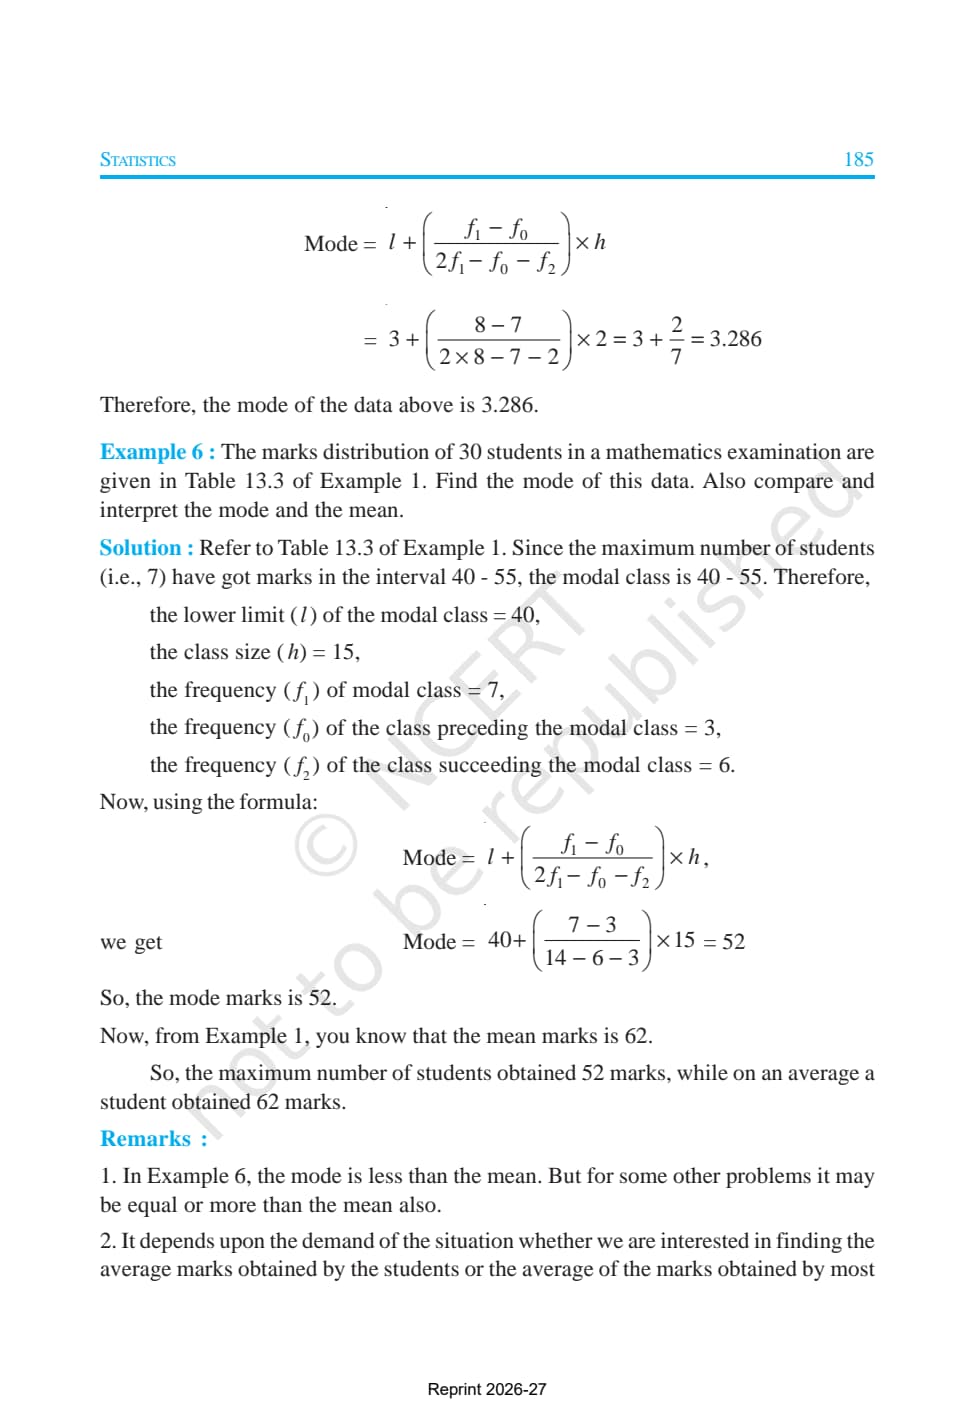
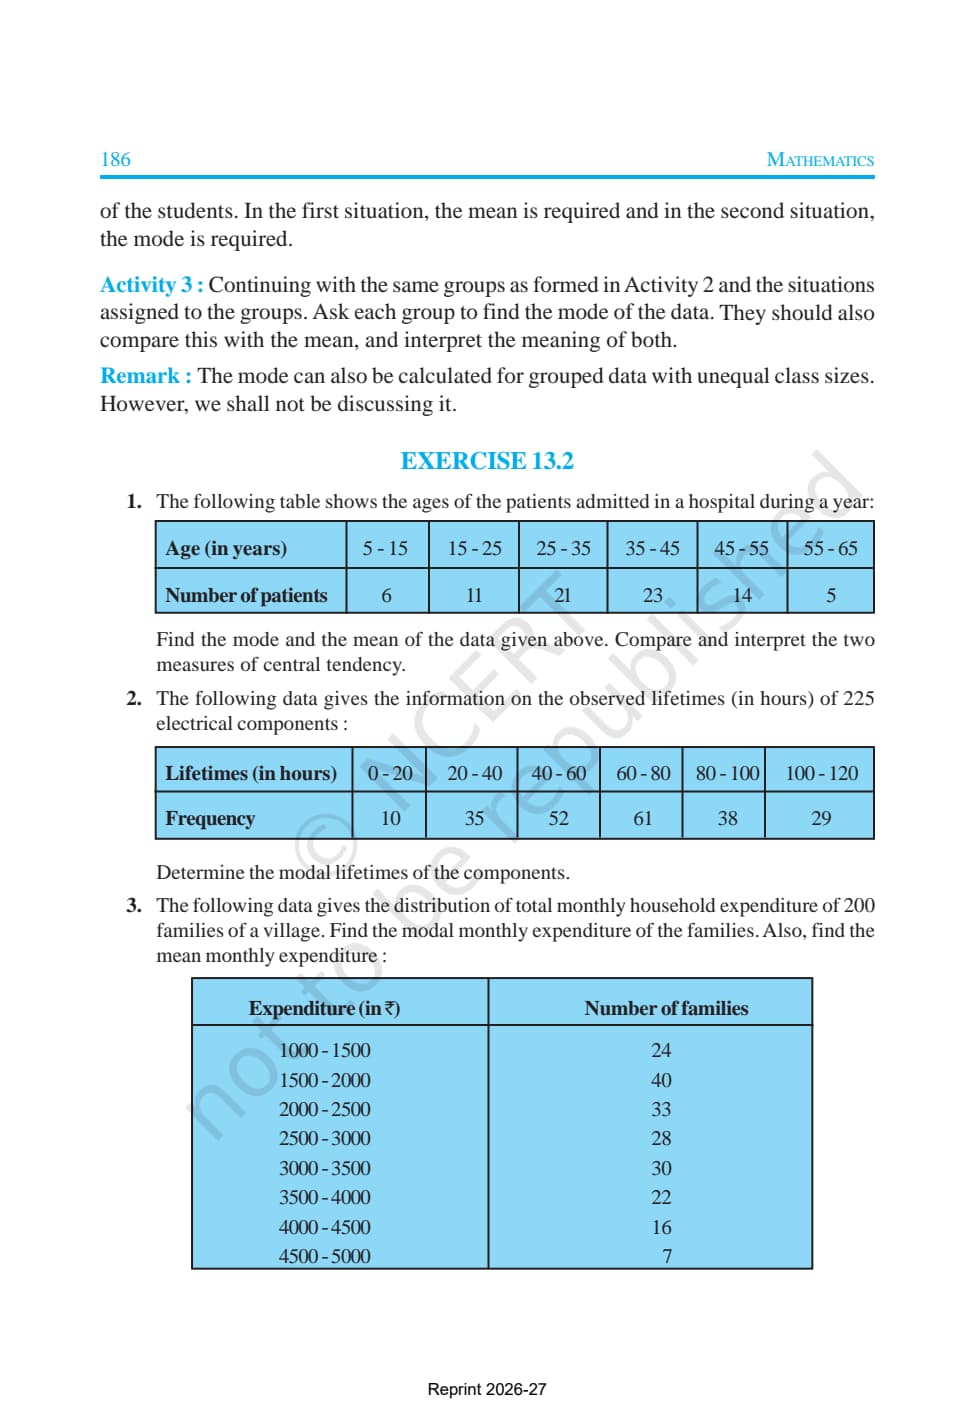
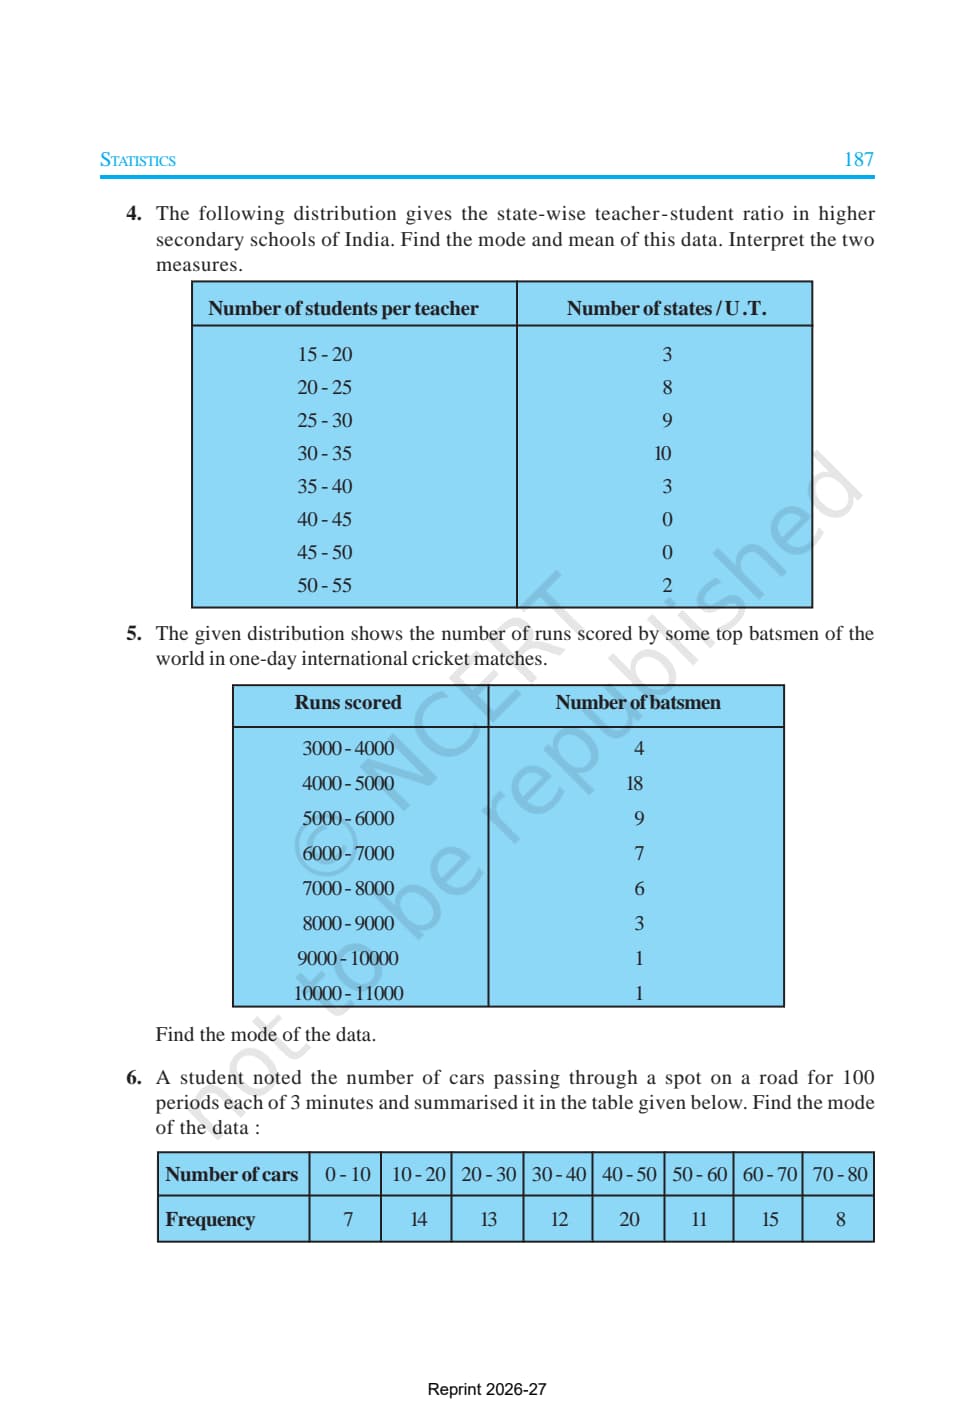
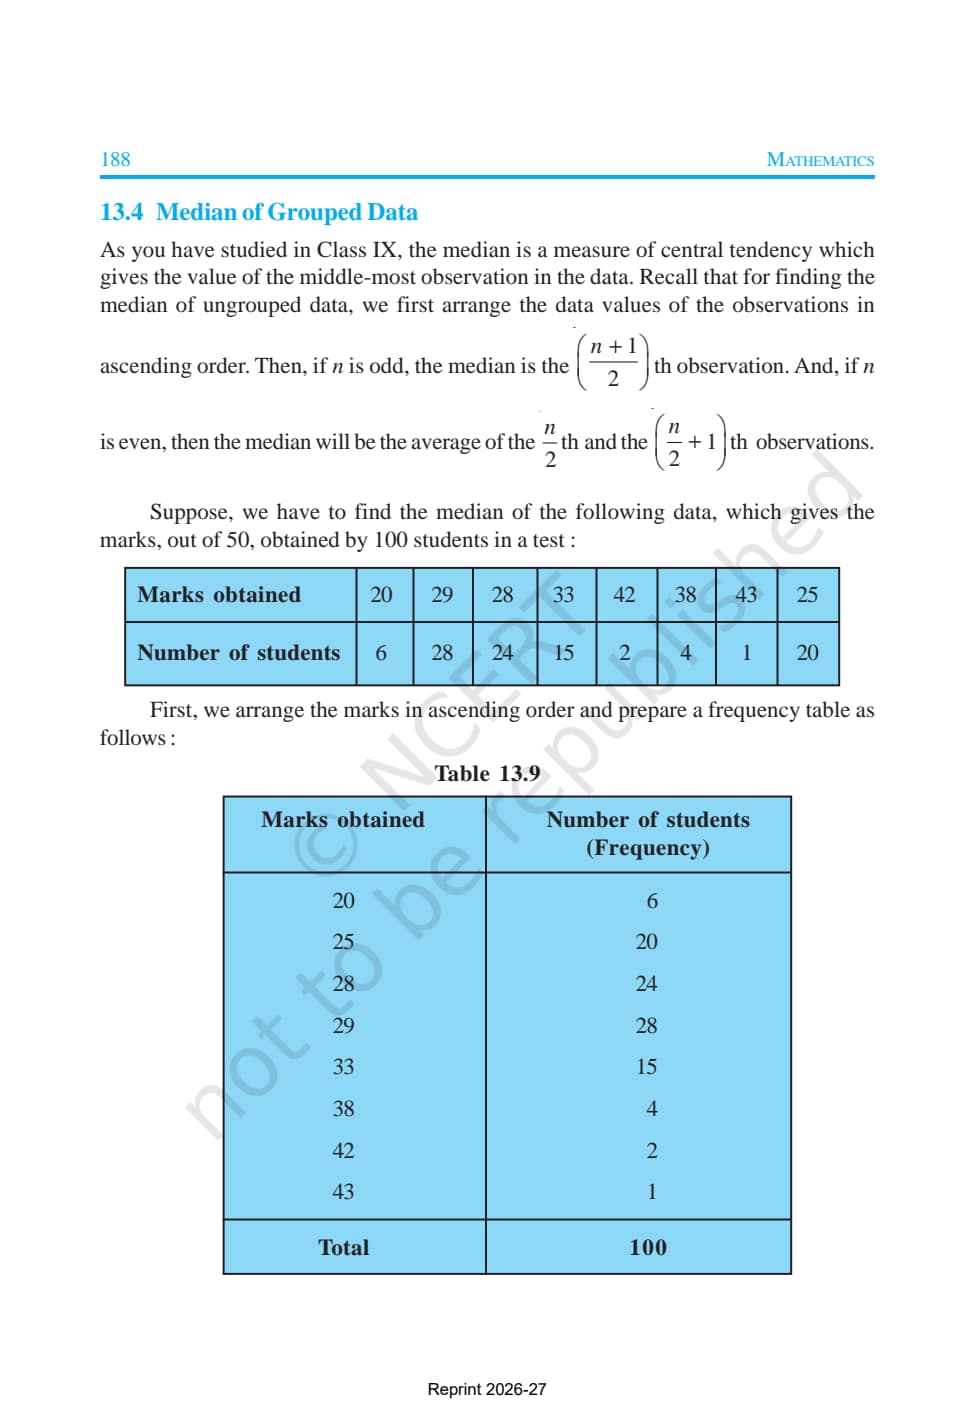
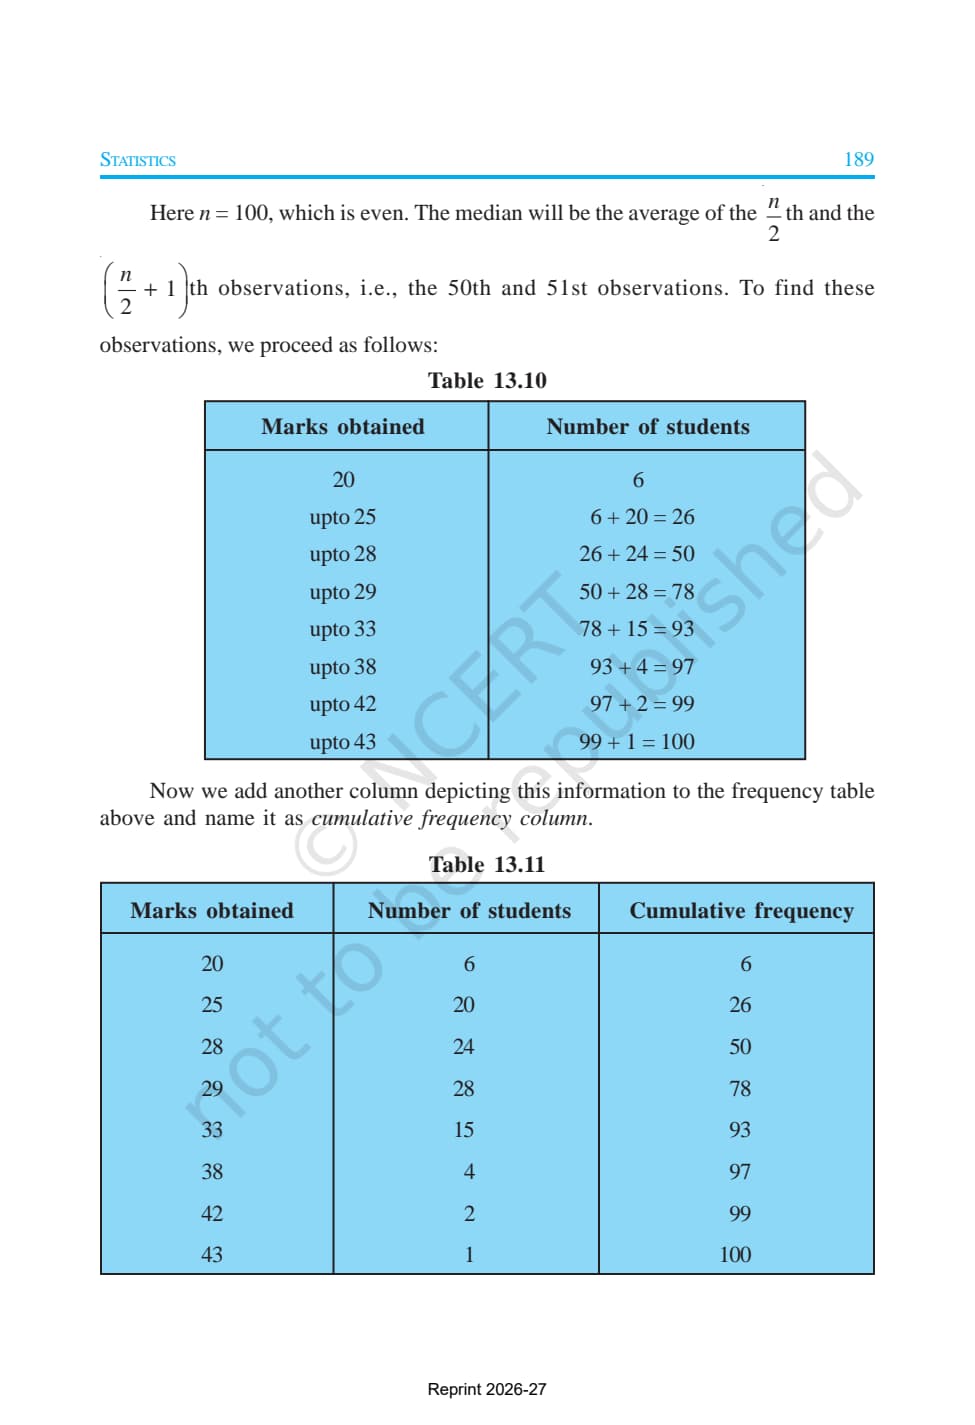
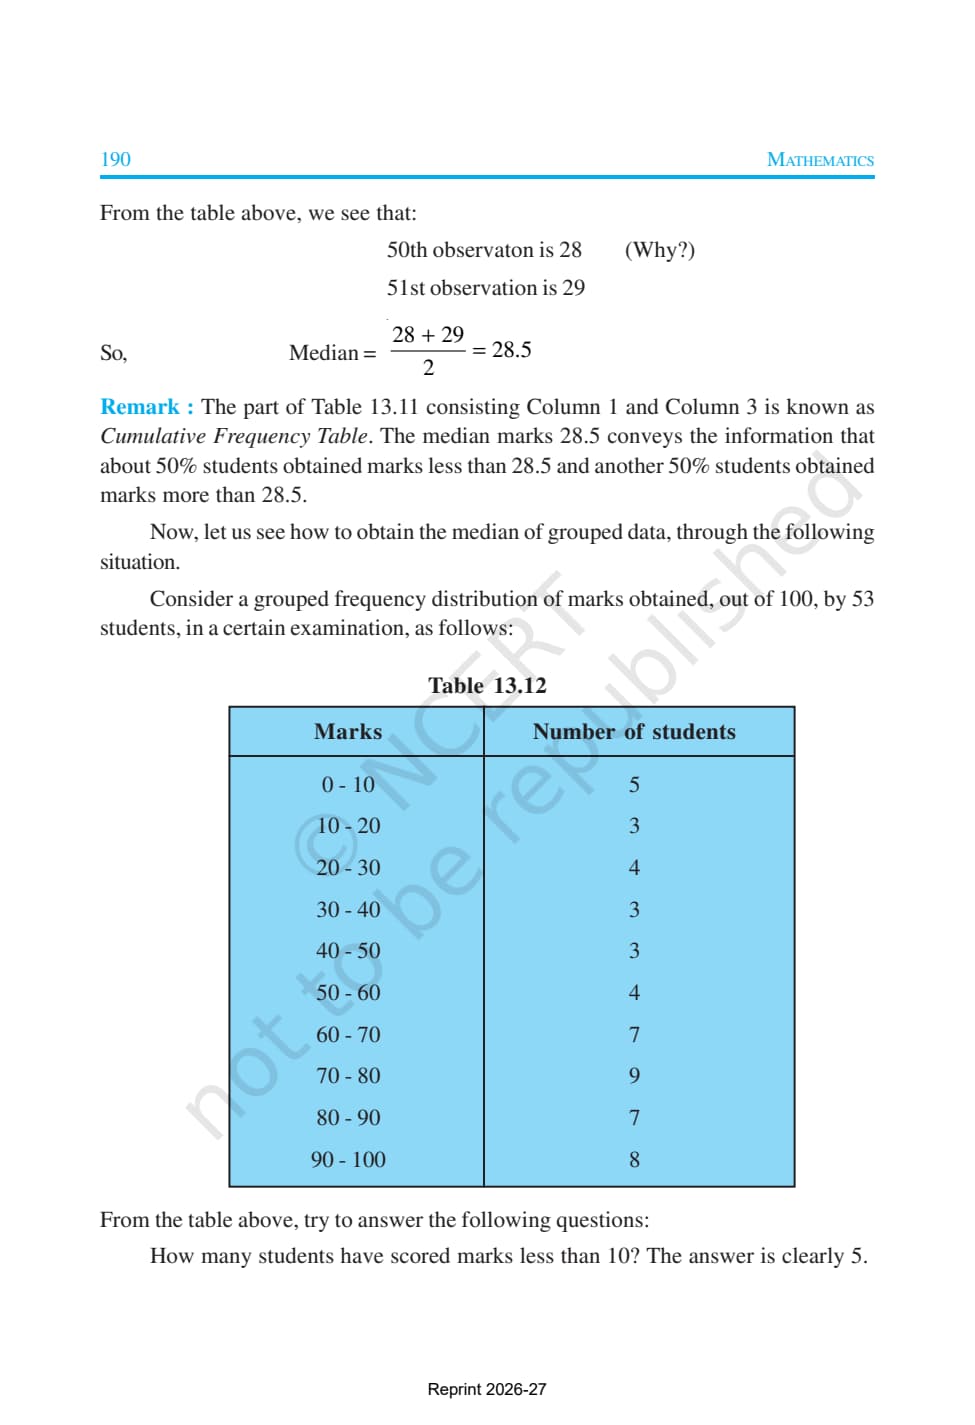
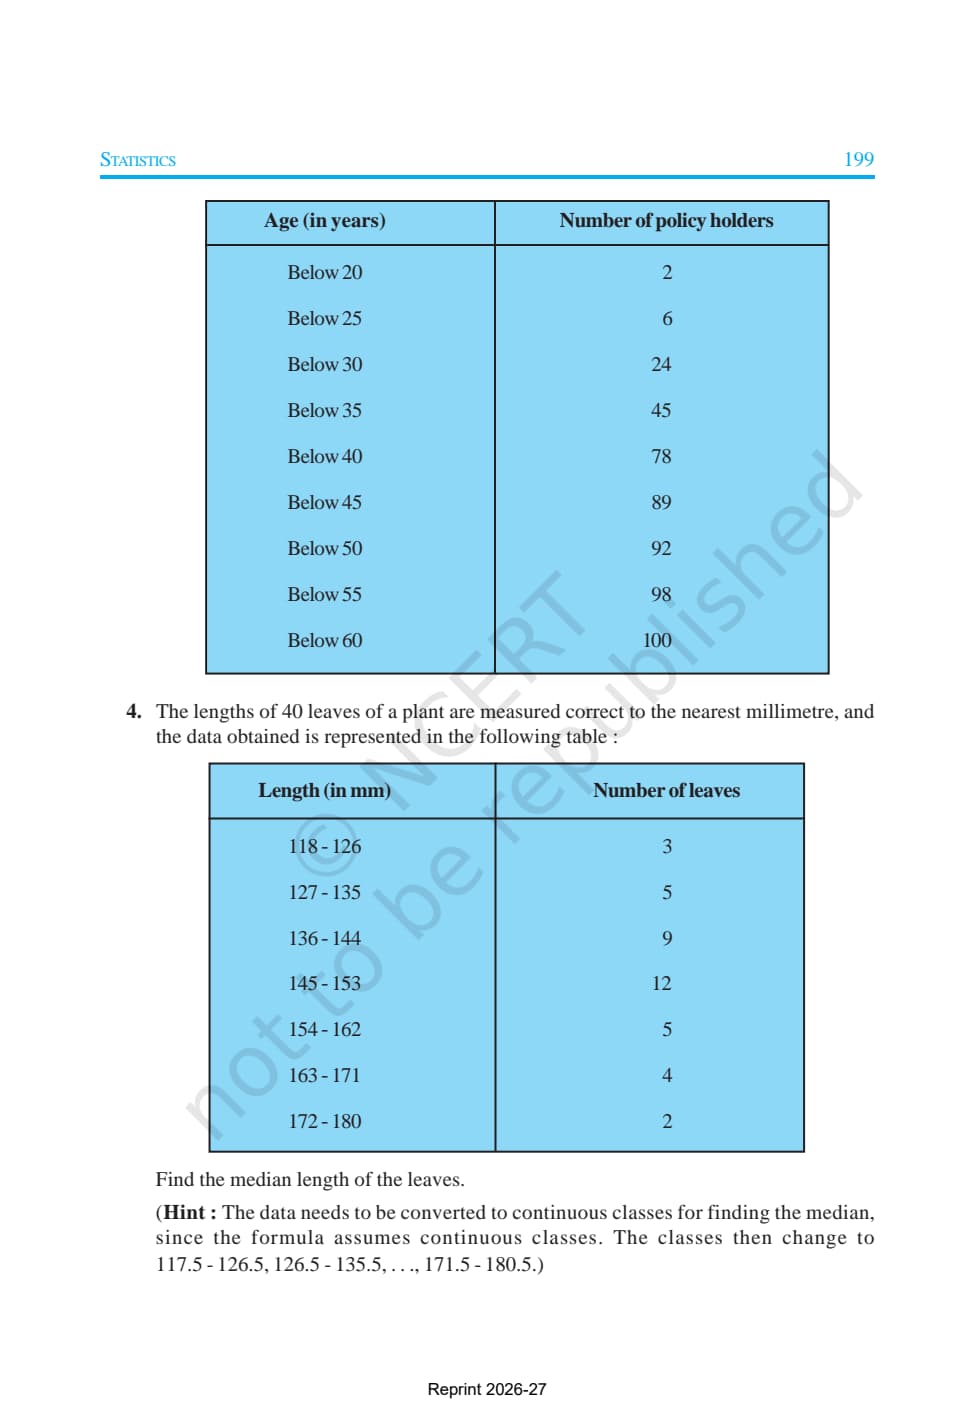
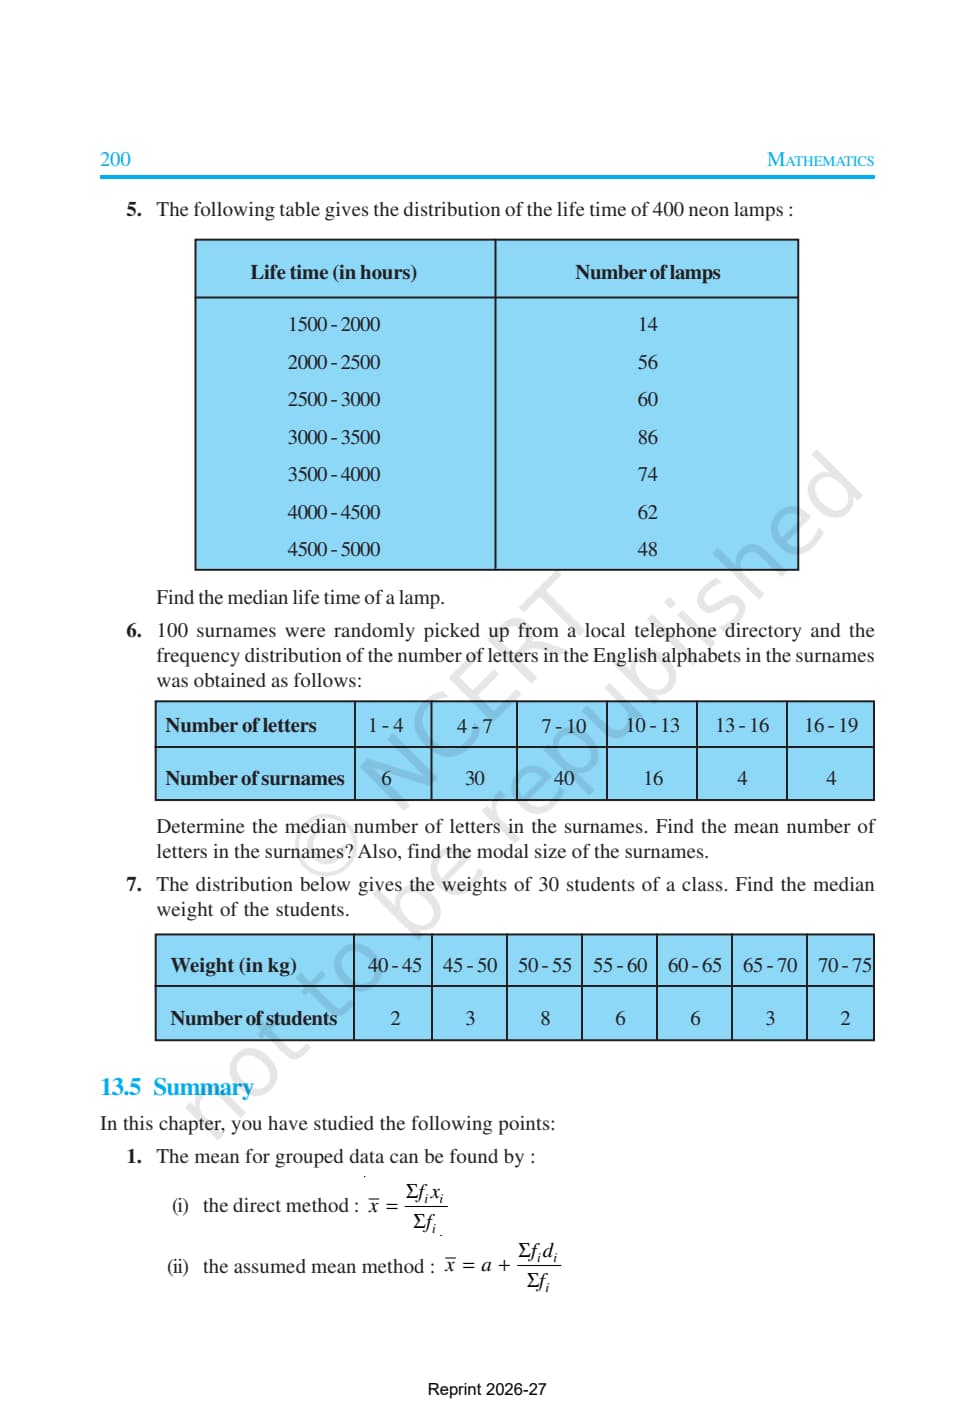
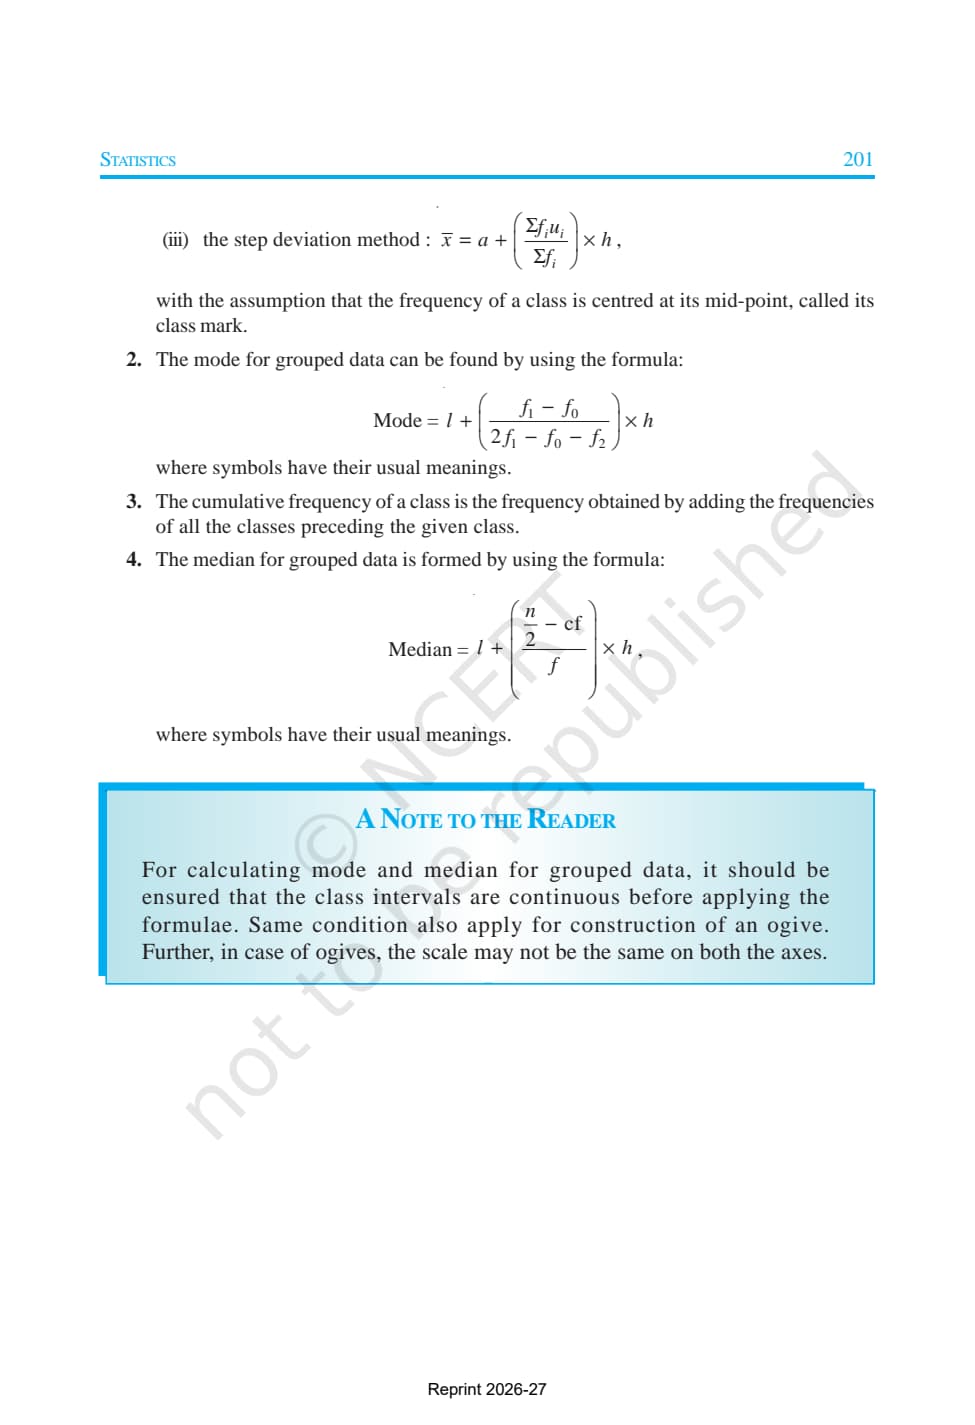
- Official textbook PDF with every theorem, solved example, and exercise exactly as printed.
- Covers mean by three methods, mode and median of grouped data, and less-than and more-than ogives.
- Follows the 2026-27 CBSE syllabus; the base text for the NCERT Solutions and notes.
This page hosts the official NCERT Class 10 Maths textbook chapter, mapped to the 2026-27 CBSE syllabus and checked page by page against the printed Statistics chapter.
Student Feedback: What 9,200 students told us about this chapter
68% of Class 10 students said choosing the right method for mean (direct, assumed mean, or step-deviation) was the most confusing part of this chapter in class tests. 4 out of 5 students told us working through the NCERT solved examples line by line helped them understand when to use each method.
Students reported spending on average 2 to 3 hours on the full chapter across the first read and revision. High scorers said keeping the official book open while drawing ogives helped them avoid mixing up the less-than and more-than cumulative frequency tables under exam pressure.
Source: 2026-27 Class 10 Maths student poll. Sample of 9,200 students from CBSE schools across 14 states, taken before the 2026 board exams.
Watch Statistics Class 10 Maths Explained
Source: Magnet Brains on YouTube
What the NCERT Book Chapter Covers
The PDF above is the complete official NCERT chapter from the 2026-27 textbook. Chapter 13 moves from ungrouped data to grouped data with class intervals, where individual values are unavailable, so you use class midpoints to estimate central tendency. Read it in order, as each solved example models the layout CBSE expects.
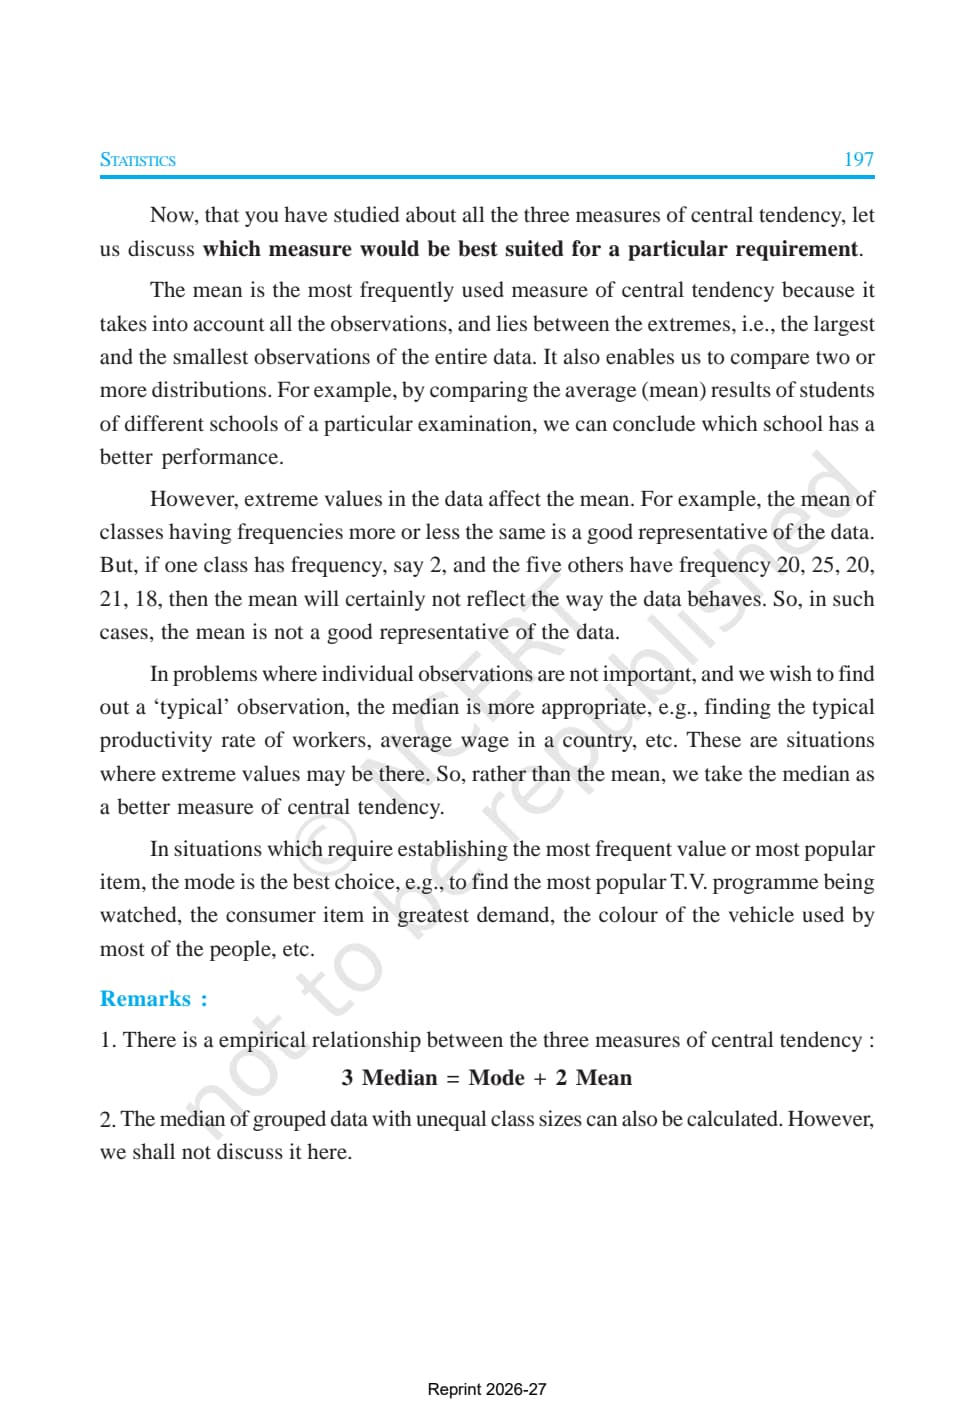
- Mean of grouped data: direct, assumed mean, and step-deviation methods; all give the same answer, but the latter two keep the numbers smaller.
- Mode of grouped data: defines the modal class and gives the formula using the modal class and its neighbours.
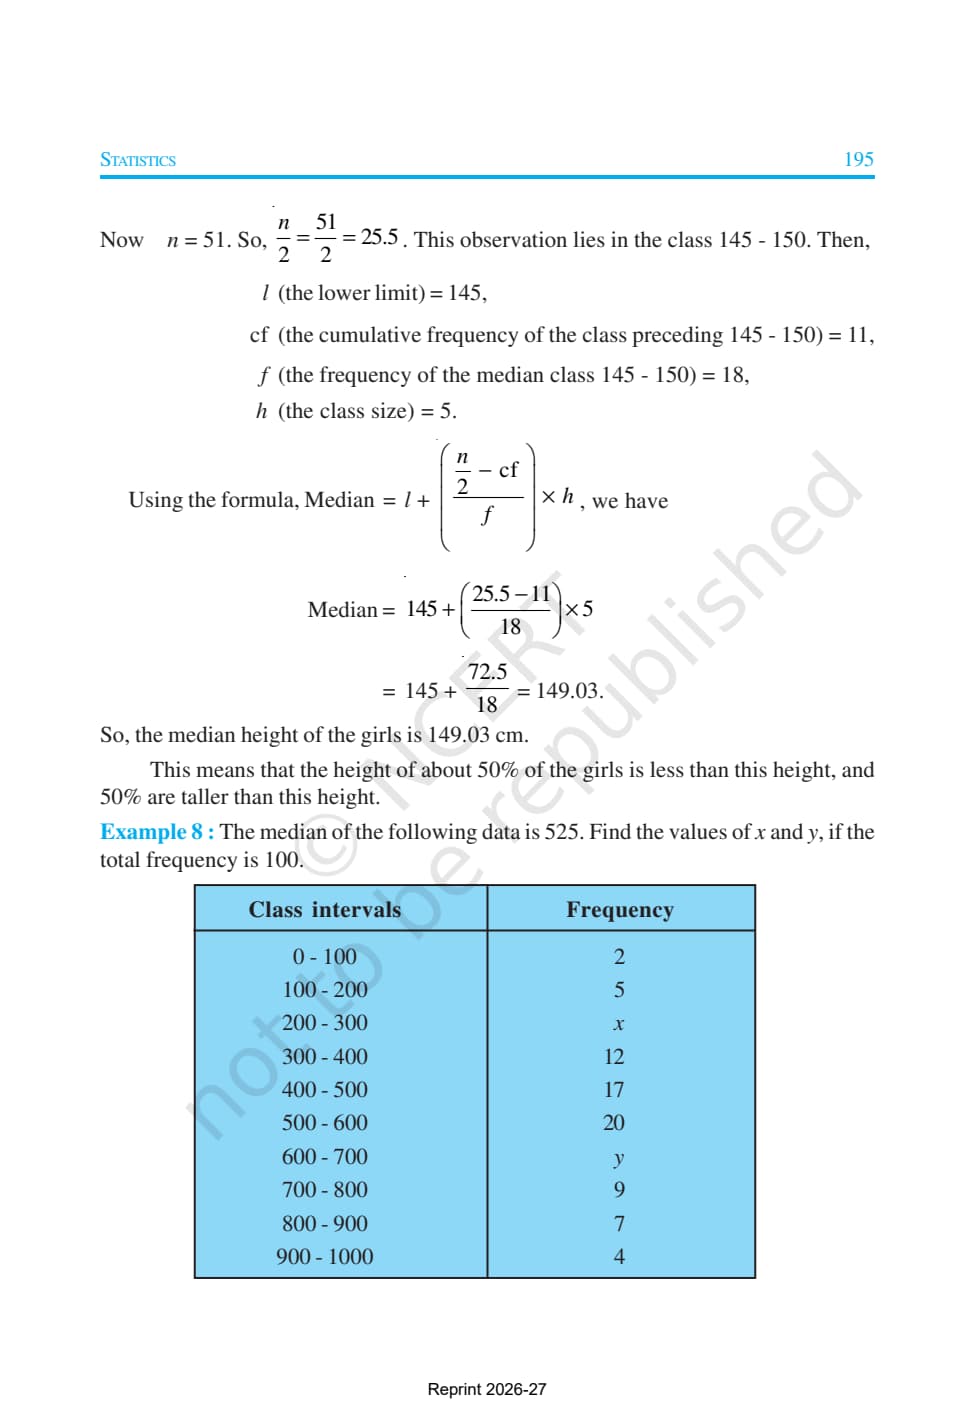
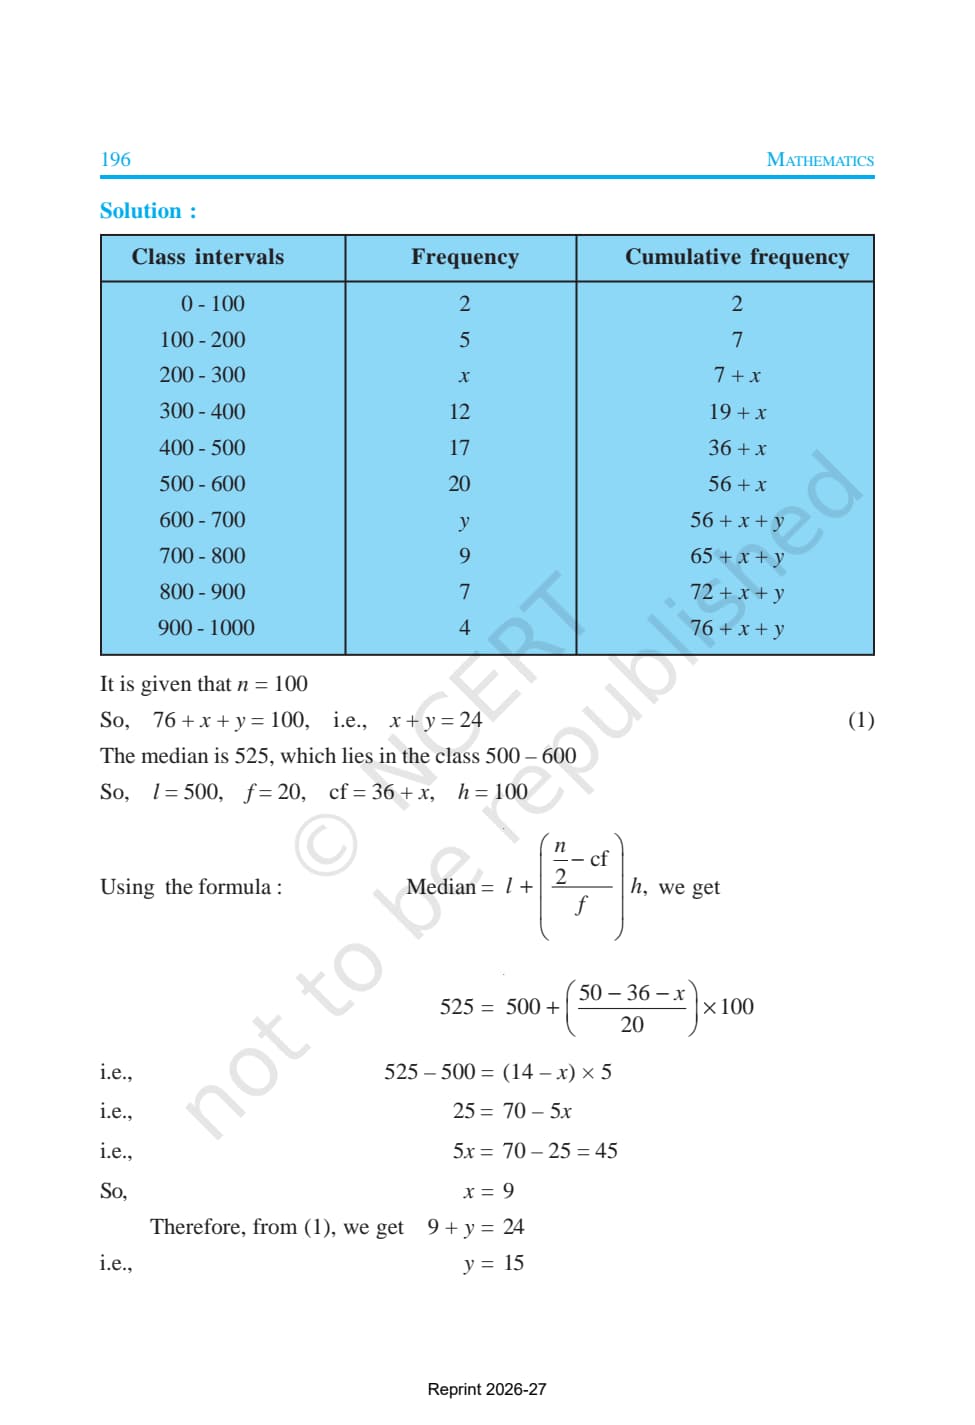
- Median of grouped data: locates the median class via cumulative frequency and applies the median formula.
- Graphical representation: less-than and more-than ogives drawn to find the median graphically.
Mean of Grouped Data: Direct, Assumed Mean & Step-Deviation
The chapter covers three methods for the mean of grouped data, all giving the same value. The assumed mean and step-deviation methods reduce intermediate numbers, lowering arithmetic errors. Let xi = midpoint and fi = frequency of each class.
| Method | Key step | Formula | Best used when |
|---|---|---|---|
| Direct method | Multiply each midpoint by its frequency | Mean = Σfixi / Σfi | Midpoints are small numbers |
| Assumed mean method | Calculate deviations di = xi - a from an assumed mean a | Mean = a + (Σfidi / Σfi) | Midpoints are large numbers |
| Step-deviation method | Further divide deviations by class width h: ui = di/h | Mean = a + h (Σfiui / Σfi) | All class widths are equal |
The assumed mean a is usually the midpoint of the middle class; a central choice keeps deviations small. For step-deviation, the class width h must be constant across all classes.
Mode of Grouped Data
The mode of grouped data is not simply the midpoint of the modal class. The NCERT formula adjusts the lower boundary using the frequencies of the classes just before and after it. Let:
f1 = frequency of the modal class
f0 = frequency of the class before the modal class
f2 = frequency of the class after the modal class
h = class width
Mode = l + ((f1 - f0) / (2f1 - f0 - f2)) × h
The modal class is the class with the highest frequency. If two classes tie, the data is bimodal and the formula does not apply directly; CBSE questions always have a single modal class.
- l is the lower class boundary, not the lower class limit in the table.
- The denominator 2f1 - f0 - f2 is positive when the modal class truly has the highest frequency.
- A common mistake is using f0 and f2 in the wrong order; the class before is f0, the class after is f2.
Median of Grouped Data Explained for CBSE Class 10 Maths
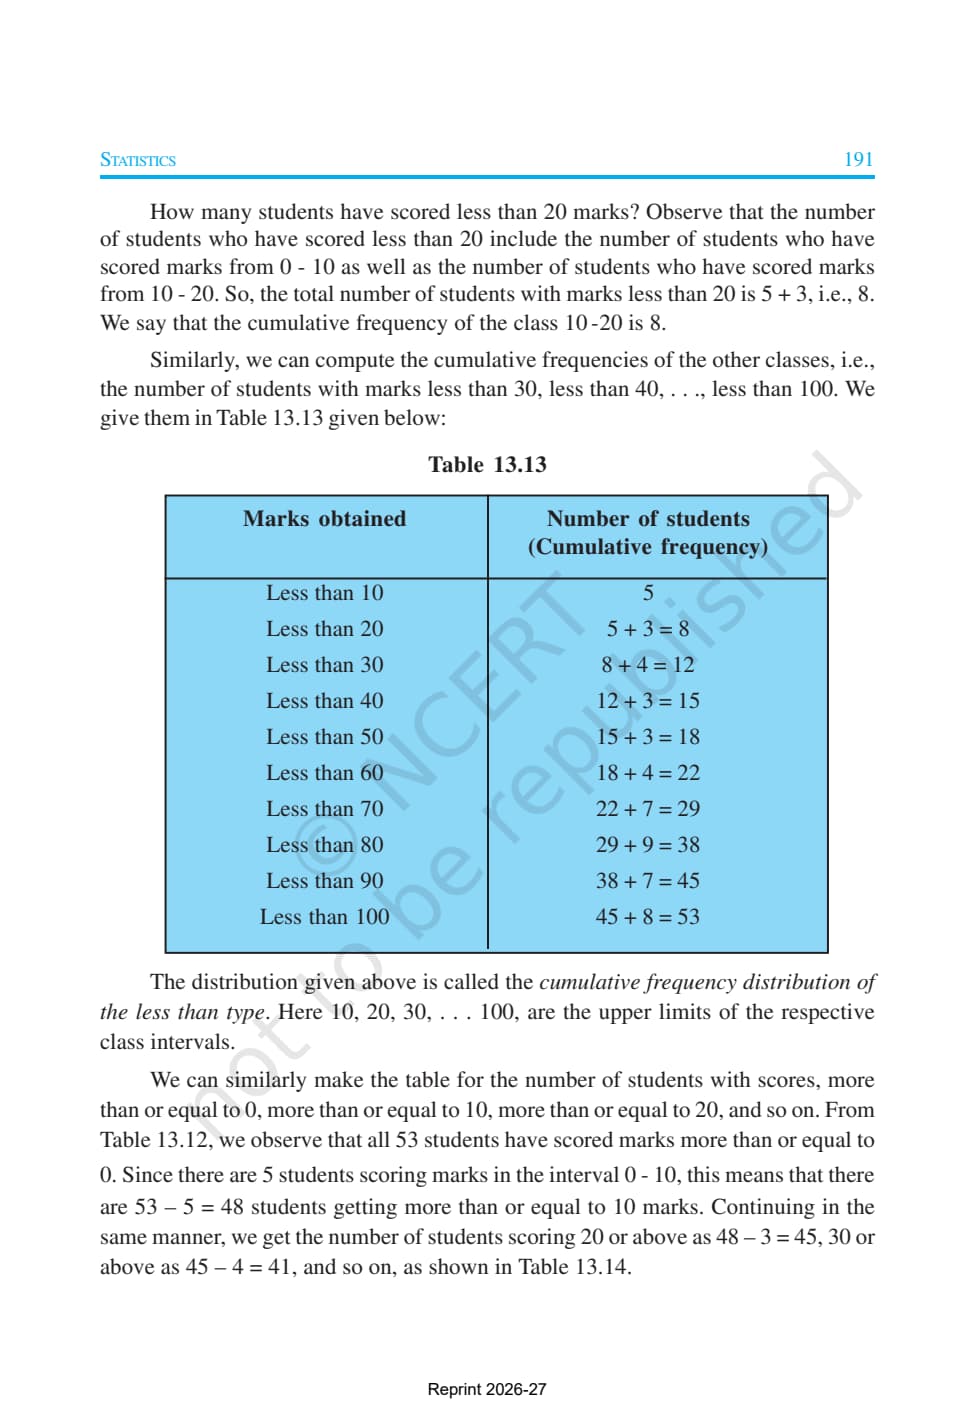
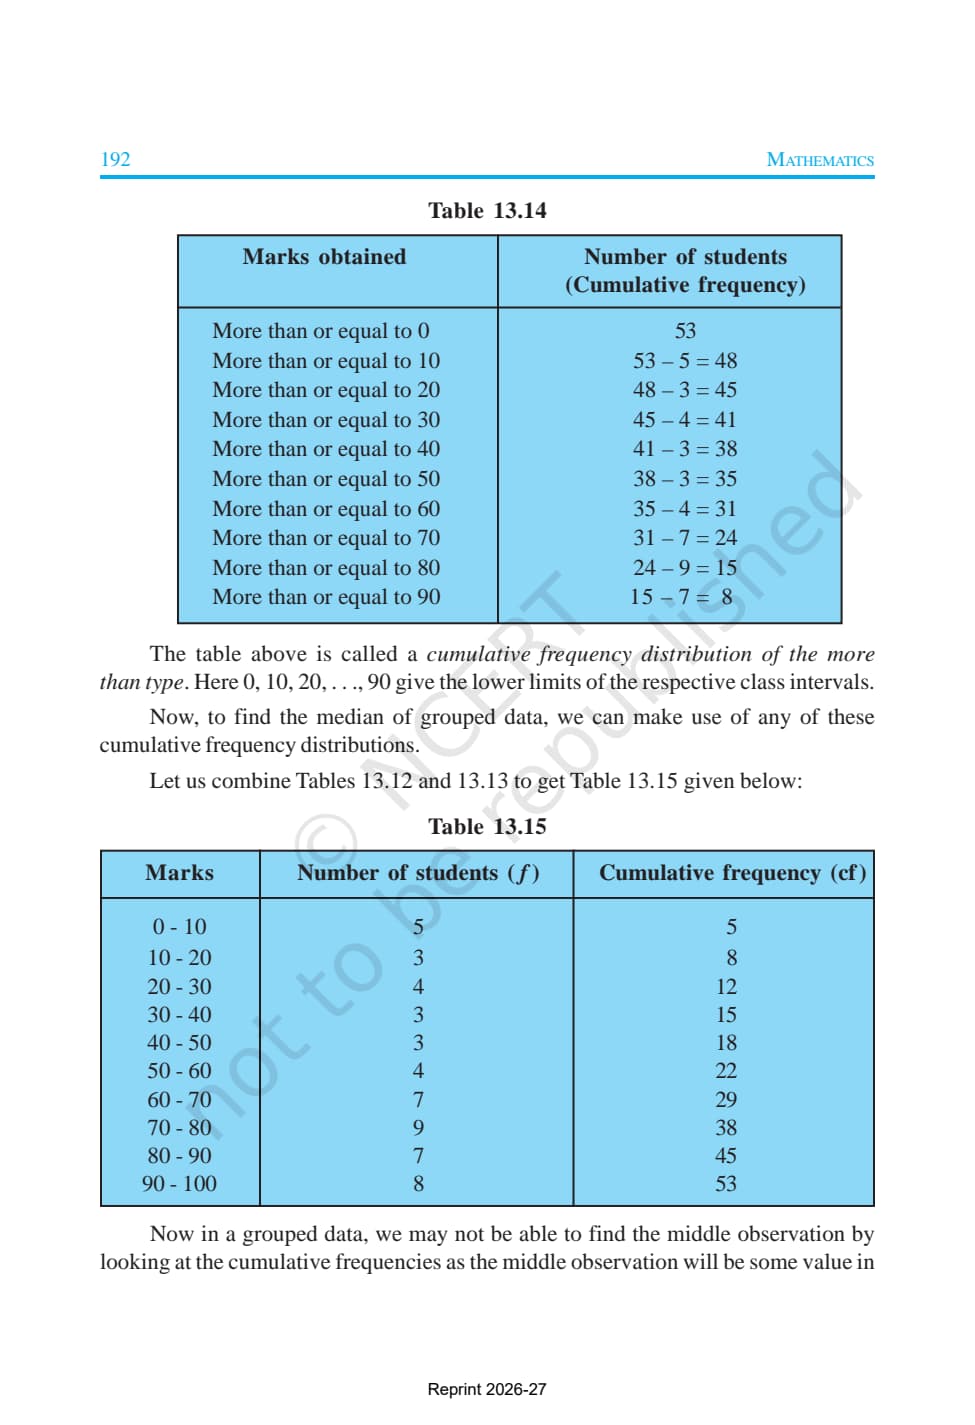
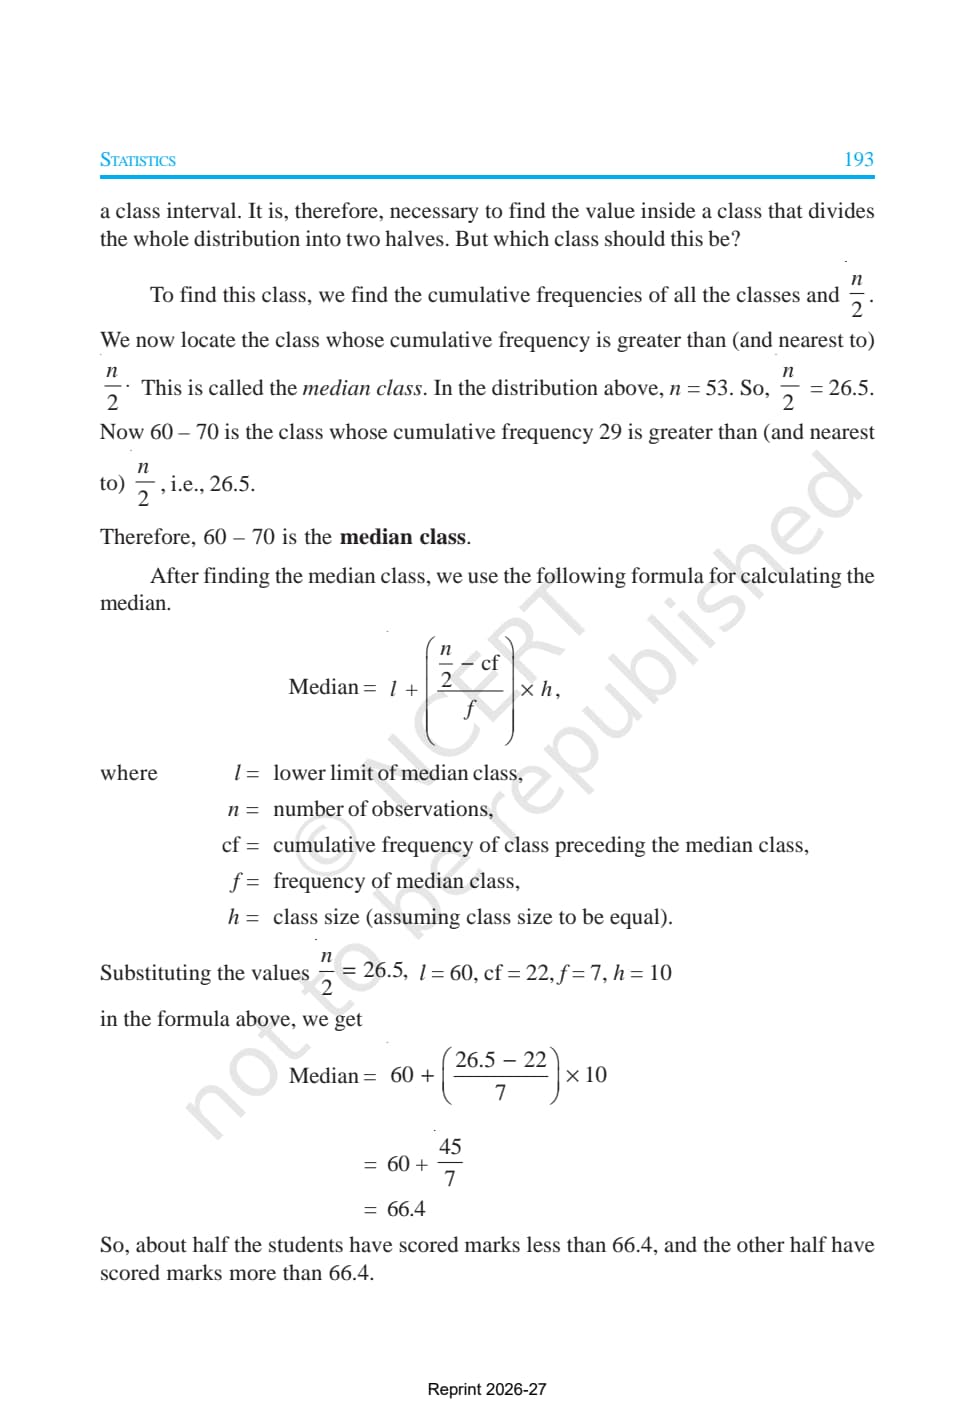
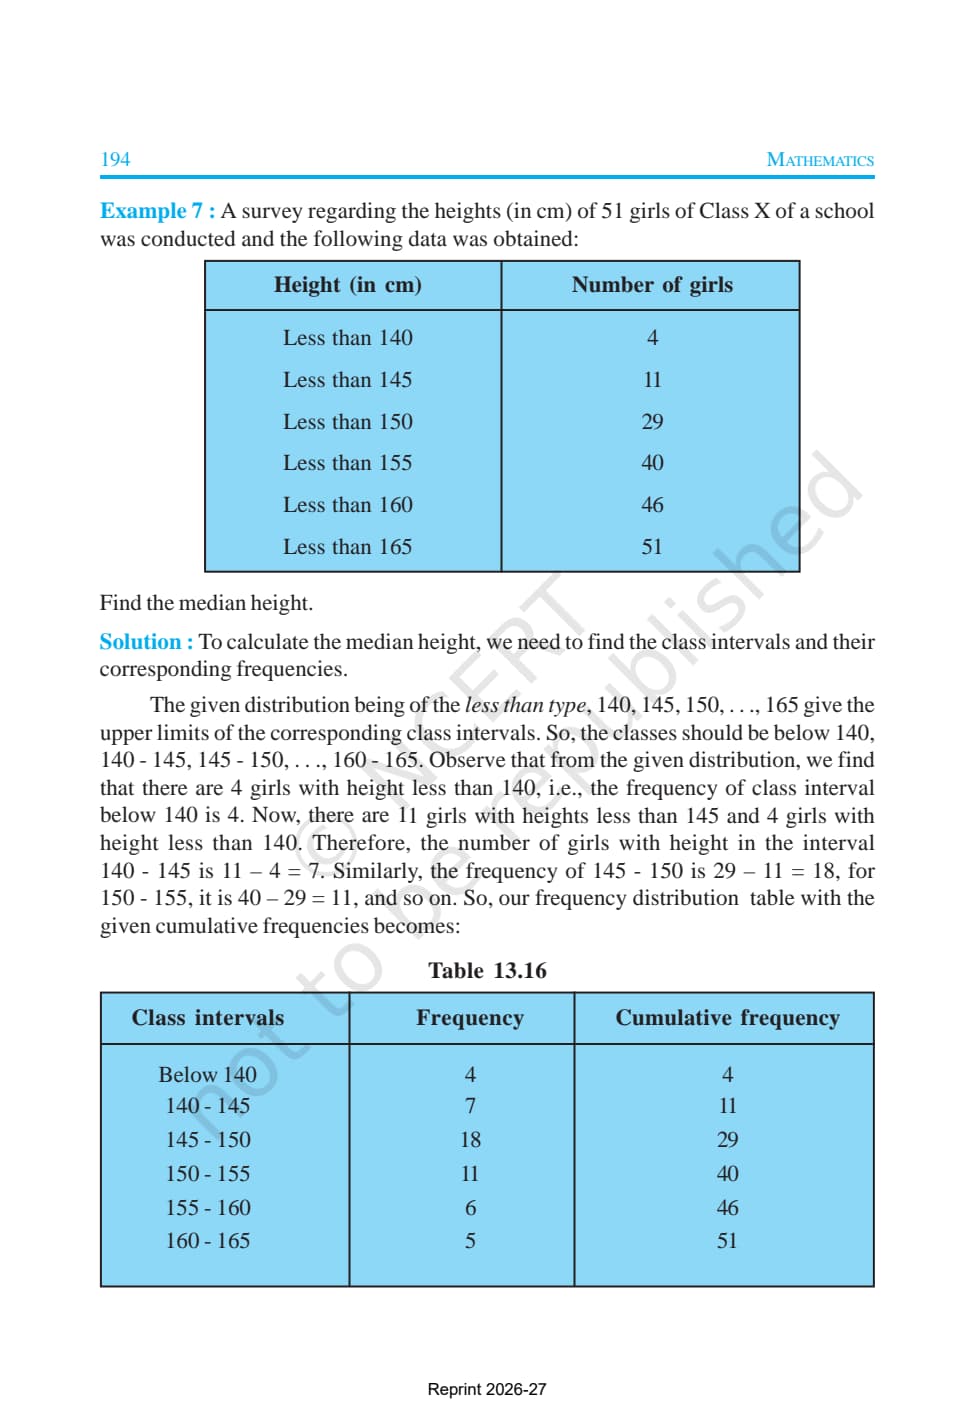
Finding the median of grouped data is a two-step process: first build a cumulative frequency table, then locate the median class and apply the median formula. The median class is the class that contains the (n/2)th observation, where n is the total number of observations. Once you have the median class, the NCERT formula is:
Where:
l = lower boundary of the median class
n = total frequency (Σfi)
cf = cumulative frequency of the class before the median class
f = frequency of the median class
h = class width
Students often lose marks using the cumulative frequency of the median class itself instead of the class before it. The cf is the running total just before the median class starts. Draw the full table and mark the median class before substituting.
- Calculate n/2 first. Compare it with the cumulative frequencies to find which class it falls in.
- The median class is the first class whose cumulative frequency is greater than or equal to n/2.
- The cf value used in the formula belongs to the class just above the median class in the cumulative table, not the median class itself.
Cumulative Frequency and Ogives in NCERT Chapter 13
An ogive is a smooth curve drawn by plotting cumulative frequencies against the upper (or lower) class boundaries. Chapter 13 covers two types. The less-than type ogive plots cumulative frequency against the upper boundary of each class. The more-than type ogive plots cumulative frequency against the lower boundary of each class. Both ogives for the same data intersect at a point whose x-coordinate gives the graphical estimate of the median.
| Type of ogive | x-axis value used | y-axis value | Direction of curve |
|---|---|---|---|
| Less-than type | Upper boundary of each class | Cumulative frequency up to that boundary | Rises from left to right (S-shape) |
| More-than type | Lower boundary of each class | Cumulative frequency from that boundary onwards | Falls from left to right (reverse S-shape) |
To find the median graphically, draw both ogives on the same axes and drop a perpendicular from their intersection to the x-axis; that x-value is the median. It matches the formula answer (within rounding) and is a common 3 to 4-mark board question.
Exercises and Solved Examples in NCERT Book Chapter 13
Chapter 13 has solved examples before each exercise, modelling the layout and rounding CBSE expects. Study every solved example before the exercises, as board questions closely follow these types.
| Section | What it covers | Type of question |
|---|---|---|
| Solved examples (Mean) | Direct, assumed mean, and step-deviation methods on frequency-distribution tables | Multi-step with a grouped data table |
| Solved examples (Mode and Median) | Mode formula application, cumulative frequency tables, and median formula | Formula substitution with justification |
| Solved examples (Ogives) | Drawing less-than and more-than type ogives and reading the median from them | Graph-based with a smooth curve |
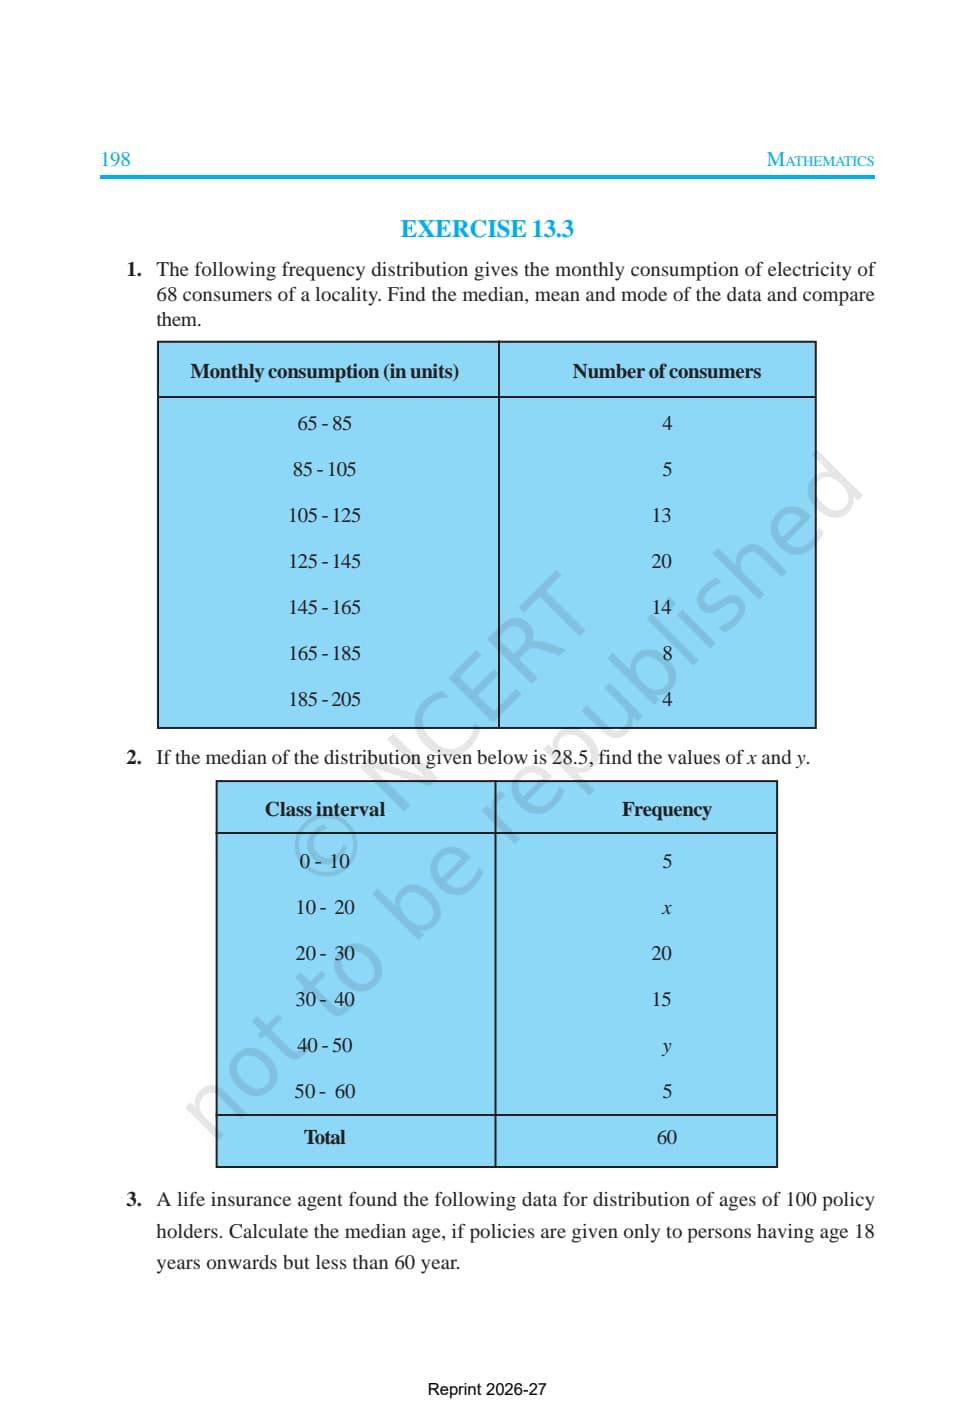
| Exercise 13.1 | Mean of grouped data by all three methods | Short and long answer, CBSE-style |
| Exercise 13.2 | Mode and median of grouped data | Formula application with frequency tables |
| Exercise 13.3 | Cumulative frequency distribution and ogive drawing | Graph-based and median-from-graph questions |
A popular Exercise 13.1 example finds the mean monthly expenditure of 50 families by step-deviation. The trick is a central assumed mean and equal class widths. Board questions follow this with data on heights, weights, ages, or marks.
Also Check:
- Class 10 Maths Chapter 13 Statistics NCERT Solutions
- Class 10 Maths Chapter 13 Statistics Formula Sheet
How to Use the NCERT Book PDF for Board Revision in Statistics
The official textbook is the safest source. Use this PDF in two reading passes, paired with the matching solutions and notes linked below.
First pass: read each solved example and follow the working
Read the theory for each method, then cover a solved example and work it yourself before checking. Note how NCERT arranges the frequency table columns, as the board marks the table too. For mode and median, write the formula before substituting; this protects your step marks.
Second pass: attempt all three exercises unaided
Solve every question in Exercises 13.1, 13.2, and 13.3 without looking at answers. For 13.3, plot the ogive points on graph paper, draw a smooth curve, and read the median at the intersection. Check against the NCERT Solutions. If your ogive median differs from the formula median by more than a rounding gap, check the cumulative frequency table.
CBSE board angle
Statistics sits in the Statistics and Probability unit, around 11 marks. Mean by any method, mode, median, and ogive drawing all appear regularly. Practising all three exercises prepares students well.
Other Resources for Statistics
Read the official NCERT Book chapter above, then revise with the matching NCERT Solutions, revision notes, formula sheet, and handwritten notes. All resources for Class 10 Maths Chapter 13 are linked in the table below.
| Resource | What it covers | Open |
|---|---|---|
| NCERT Book PDF | Official Class 10 Maths Chapter 13 textbook, with every solved example and exercise. | You are here |
| NCERT Solutions | Step-by-step answers to all exercise questions of Chapter 13. | Class 10 Maths Chapter 13 NCERT Solutions |
| Notes | Concept-first revision notes on mean, mode, median, and ogives. | Class 10 Maths Chapter 13 Notes |
| Formula Sheet | Quick reference of all key Statistics formulas for fast board revision. | Class 10 Maths Chapter 13 Formula Sheet |
| Handwritten Notes | Scanned-style handwritten pages for last-minute board revision. | Class 10 Maths Chapter 13 Handwritten Notes |
| Exemplar Solutions | Worked solutions to NCERT Exemplar problems for deeper practice. | Class 10 Maths Chapter 13 Exemplar Solutions |
| Exemplar Book PDF | Official NCERT Exemplar chapter PDF for additional problem practice. | Class 10 Maths Chapter 13 Exemplar Book PDF |
NCERT Book for Class 10 Maths: All Chapters
Related Links: Use the table below to open the official NCERT Book PDF for the other chapters of Class 10 Maths. Every chapter ships with the same official textbook PDF, chapter overview, and board-ready FAQ.
| Chapter | NCERT Book PDF link |
|---|---|
| Chapter 1 | Real Numbers NCERT Book PDF |
| Chapter 2 | Polynomials NCERT Book PDF |
| Chapter 3 | Pair of Linear Equations in Two Variables NCERT Book PDF |
| Chapter 4 | Quadratic Equations NCERT Book PDF |
| Chapter 5 | Arithmetic Progressions NCERT Book PDF |
| Chapter 6 | Triangles NCERT Book PDF |
| Chapter 7 | Coordinate Geometry NCERT Book PDF |
| Chapter 8 | Introduction to Trigonometry NCERT Book PDF |
| Chapter 9 | Some Applications of Trigonometry NCERT Book PDF |
| Chapter 10 | Circles NCERT Book PDF |
| Chapter 11 | Areas Related to Circles NCERT Book PDF |
| Chapter 12 | Surface Areas and Volumes NCERT Book PDF |
| Chapter 13 | Statistics NCERT Book PDF (You are here) |
| Chapter 14 | Probability NCERT Book PDF |
Statistics Class 10 Maths Chapter 13 NCERT Book FAQs
Ques. What does Chapter 13 Statistics cover in the Class 10 Maths NCERT Book?
Ans. Chapter 13 of the Class 10 Maths NCERT Book covers the calculation of mean, mode, and median of grouped data and the graphical representation of cumulative frequency using ogives. For the mean, the chapter explains three methods: the direct method, the assumed mean method, and the step-deviation method, all of which give the same answer but differ in calculation convenience. The mode section introduces the modal class concept and a formula using the frequencies of neighbouring classes. The median section uses cumulative frequency to locate the median class and applies a formula to find the exact median. Finally, the chapter teaches students to draw less-than type and more-than type ogives and find the median graphically from the intersection of both curves. The chapter has three exercises aligned with the 2026-27 CBSE syllabus.
Ques. What are the three methods to find the mean of grouped data in Class 10 Maths?
Ans. The NCERT Chapter 13 teaches three methods. The direct method uses the formula Mean = sum of (frequency times midpoint) divided by total frequency. The assumed mean method chooses a convenient value a near the centre of the data and computes deviations d = midpoint minus a for each class; Mean = a + sum of (f times d) divided by sum of f. The step-deviation method goes one step further and divides the deviations by the class width h to get u = d divided by h; Mean = a + h times sum of (f times u) divided by sum of f. All three methods give the same result. The assumed mean and step-deviation methods make arithmetic easier when the midpoints are large numbers.
Ques. What is the formula for the mode of grouped data in Class 10 Maths?
Ans. The mode formula for grouped data given in the NCERT Chapter 13 is: Mode = l + ((f1 minus f0) divided by (2f1 minus f0 minus f2)) times h. Here l is the lower boundary of the modal class (the class with the highest frequency), f1 is the frequency of the modal class, f0 is the frequency of the class just before the modal class, f2 is the frequency of the class just after it, and h is the class width. The first step is always to identify the modal class by finding which class has the highest frequency. In CBSE board questions, the data is always designed so that exactly one class has the highest frequency, making the modal class unambiguous.
Ques. How do you find the median of grouped data using the NCERT formula?
Ans. To find the median of grouped data using the NCERT method, first make a cumulative frequency column by adding each frequency to the running total. Then find n divided by 2, where n is the total frequency. The median class is the class whose cumulative frequency is the first to reach or exceed n divided by 2. Apply the formula: Median = l + ((n/2 minus cf) divided by f) times h. Here l is the lower boundary of the median class, cf is the cumulative frequency of the class just before the median class, f is the frequency of the median class, and h is the class width. The most common error is using the cumulative frequency of the median class itself instead of cf, which is the total from all classes before the median class.
Ques. What are less-than and more-than type ogives in Statistics?
Ans. An ogive is a smooth cumulative frequency curve. The less-than type ogive is drawn by plotting the upper boundary of each class on the x-axis against the cumulative frequency up to that boundary on the y-axis. The points are joined with a smooth S-shaped curve that rises from left to right. The more-than type ogive is drawn by plotting the lower boundary of each class on the x-axis against the cumulative frequency from that boundary onwards on the y-axis. This curve falls from left to right. When both ogives for the same data are drawn on the same axes, they intersect at one point. The x-coordinate of that intersection is the graphical estimate of the median of the data. The NCERT chapter uses this method as an alternative to the formula approach.
Ques. Is the Class 10 Maths Chapter 13 NCERT Book PDF free to download for 2026-27?
Ans. Yes. The official NCERT Book PDF for Class 10 Maths Chapter 13 Statistics is free to read and download on this page for the 2026-27 session. It is the complete chapter exactly as printed in the CBSE textbook, including all the solved examples and Exercises 13.1, 13.2, and 13.3. You can pair the book PDF with the NCERT Solutions and revision notes for the same chapter, both linked on this page, so you can read, practise, and revise from one place without needing to search multiple sites.
Ques. How is Statistics Chapter 13 important for the CBSE Class 10 Maths board exam?
Ans. Statistics is part of the Statistics and Probability unit in CBSE Class 10 Maths, which typically carries around 11 marks in the board exam. Questions on mean by the step-deviation method, mode formula application, median formula, and the ogive drawing question appear most years. Students who practise all three exercises, understand the difference between the three mean-finding methods, and can draw both types of ogives accurately are well prepared for the board exam questions from this chapter. The NCERT solved examples follow the exact format and level of difficulty expected in the board paper.



Comments