




Class 12 Biology Chapter 13 covers Biodiversity and Conservation - a number-heavy chapter in the 2026-27 NCERT syllabus. It packs in 34 hotspots, the species-area equation, the Evil Quartet, and India's 14 / 90 / 448 protected network. Students can download the free PDF of Collegedunia's scanned handwritten notes - 22 ruled pages with hand-drawn diagrams - right here.
- CBSE Weightage: 4 to 6 marks (one 3-mark question on hotspots or species-area plus a 2-marker on the Evil Quartet is the standard CBSE pattern)
- NEET Weightage: 2 to 4 questions per paper (consistent 3 to 5 percent of NEET Biology, drawn most often from hotspots and patterns of biodiversity)
How Collegedunia's Handwritten Notes Help Students Revise Biodiversity and Conservation Class 12 Biology
This chapter packs 34 hotspots, 12 mega-diversity nations, z-values, and India's 14 / 90 / 448 protected network. Hand-drawn pairings encode numbers as spatial memory - how MCQs are recalled.
- Hand-drawn pattern graphs: Species-area curve on linear and log-log axes, with z = 0.15 and z = 0.9 both marked.
- Indian hotspot map: Western Ghats - Sri Lanka, Himalaya, and Indo-Burma shaded on a hand-drawn South Asia outline - the exact 3-mark CBSE diagram.
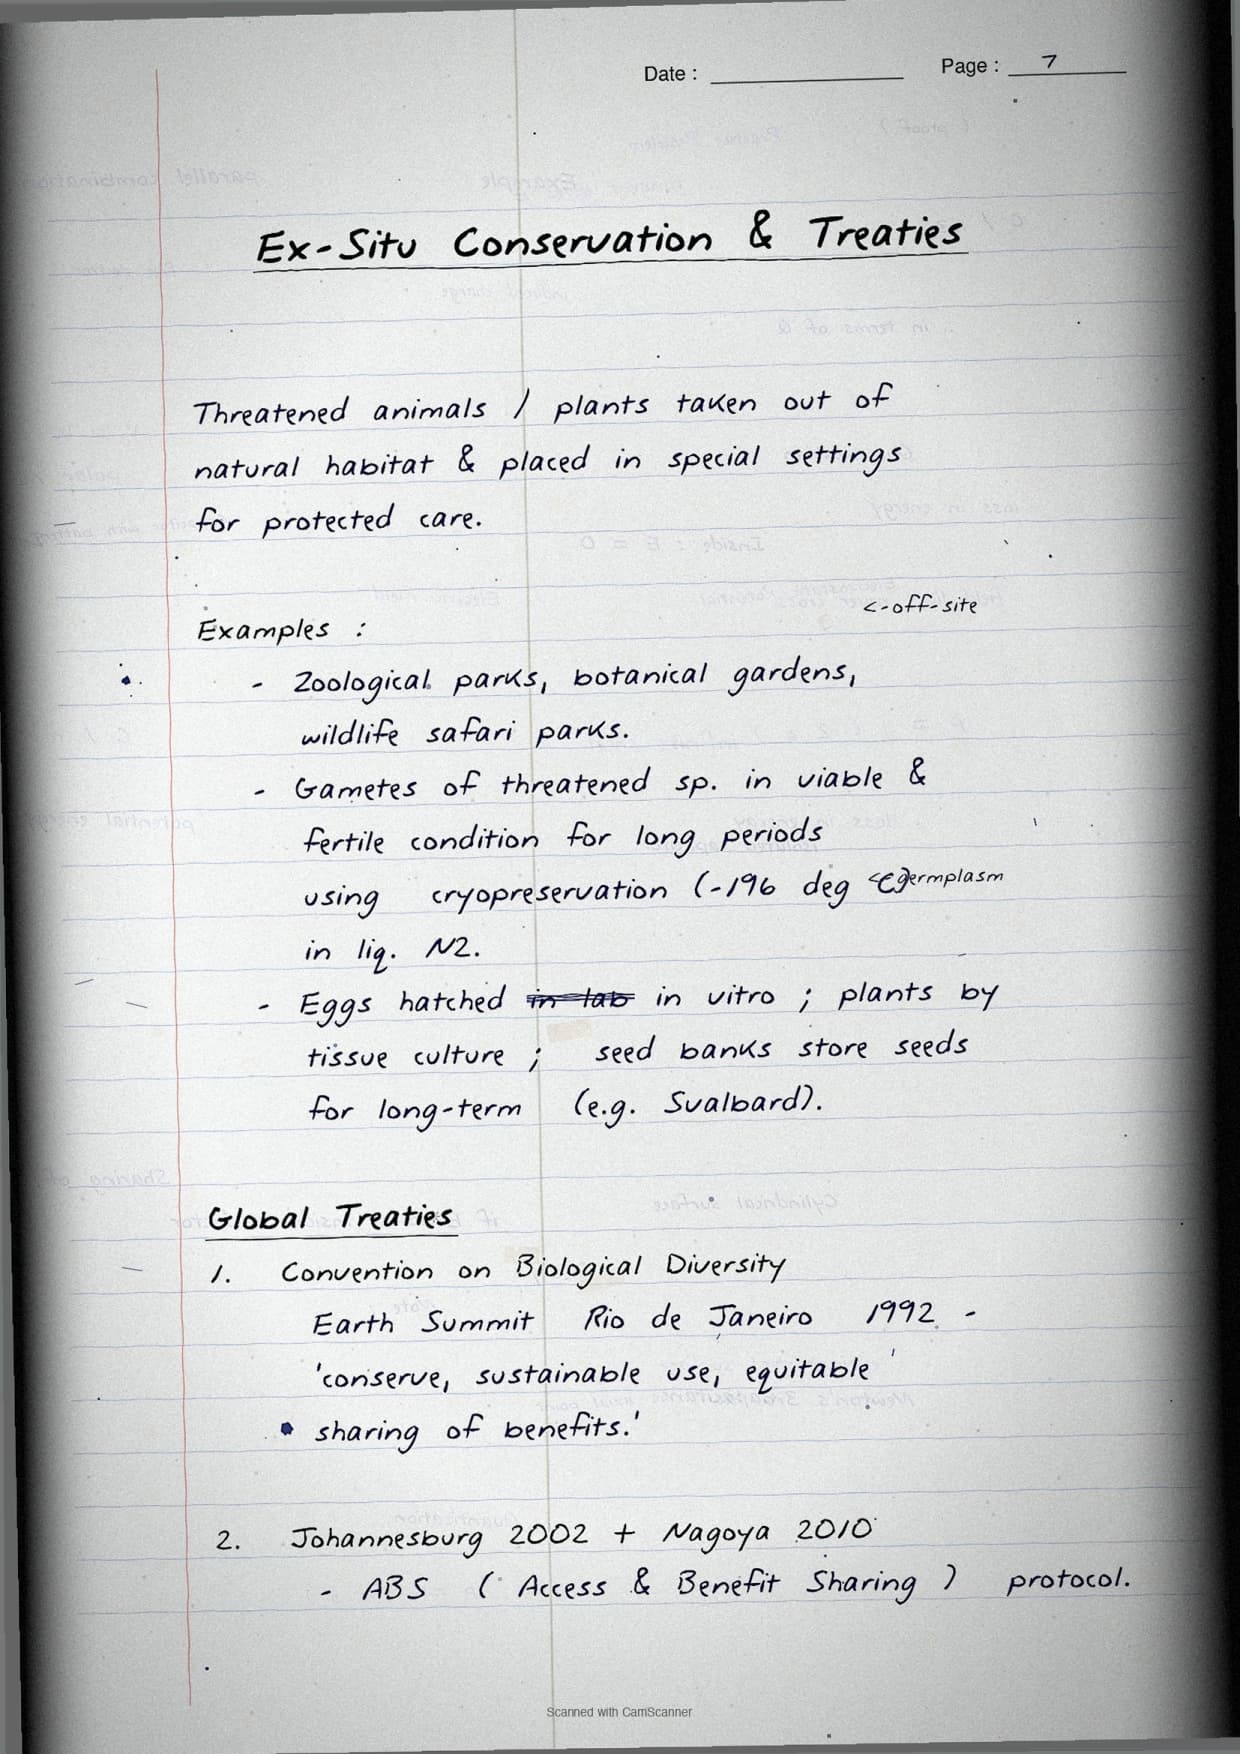
- In-situ vs ex-situ split: One spread with reserves / parks / sacred groves on the left and zoos / seed banks / cryopreservation on the right, the NEET pattern since 2019.
- Margin "asked in" tags: Each numerical shows the year it was last asked in an exam, helping students spot high-frequency facts fast.
What's Inside the Class 12 Biology Chapter 13 Biodiversity and Conservation Handwritten Notes PDF
A 22-page scan with a fixed ink-colour code. Use the page map below to jump straight to any sub-topic.
| Pages | Topic | Pen Colour |
|---|---|---|
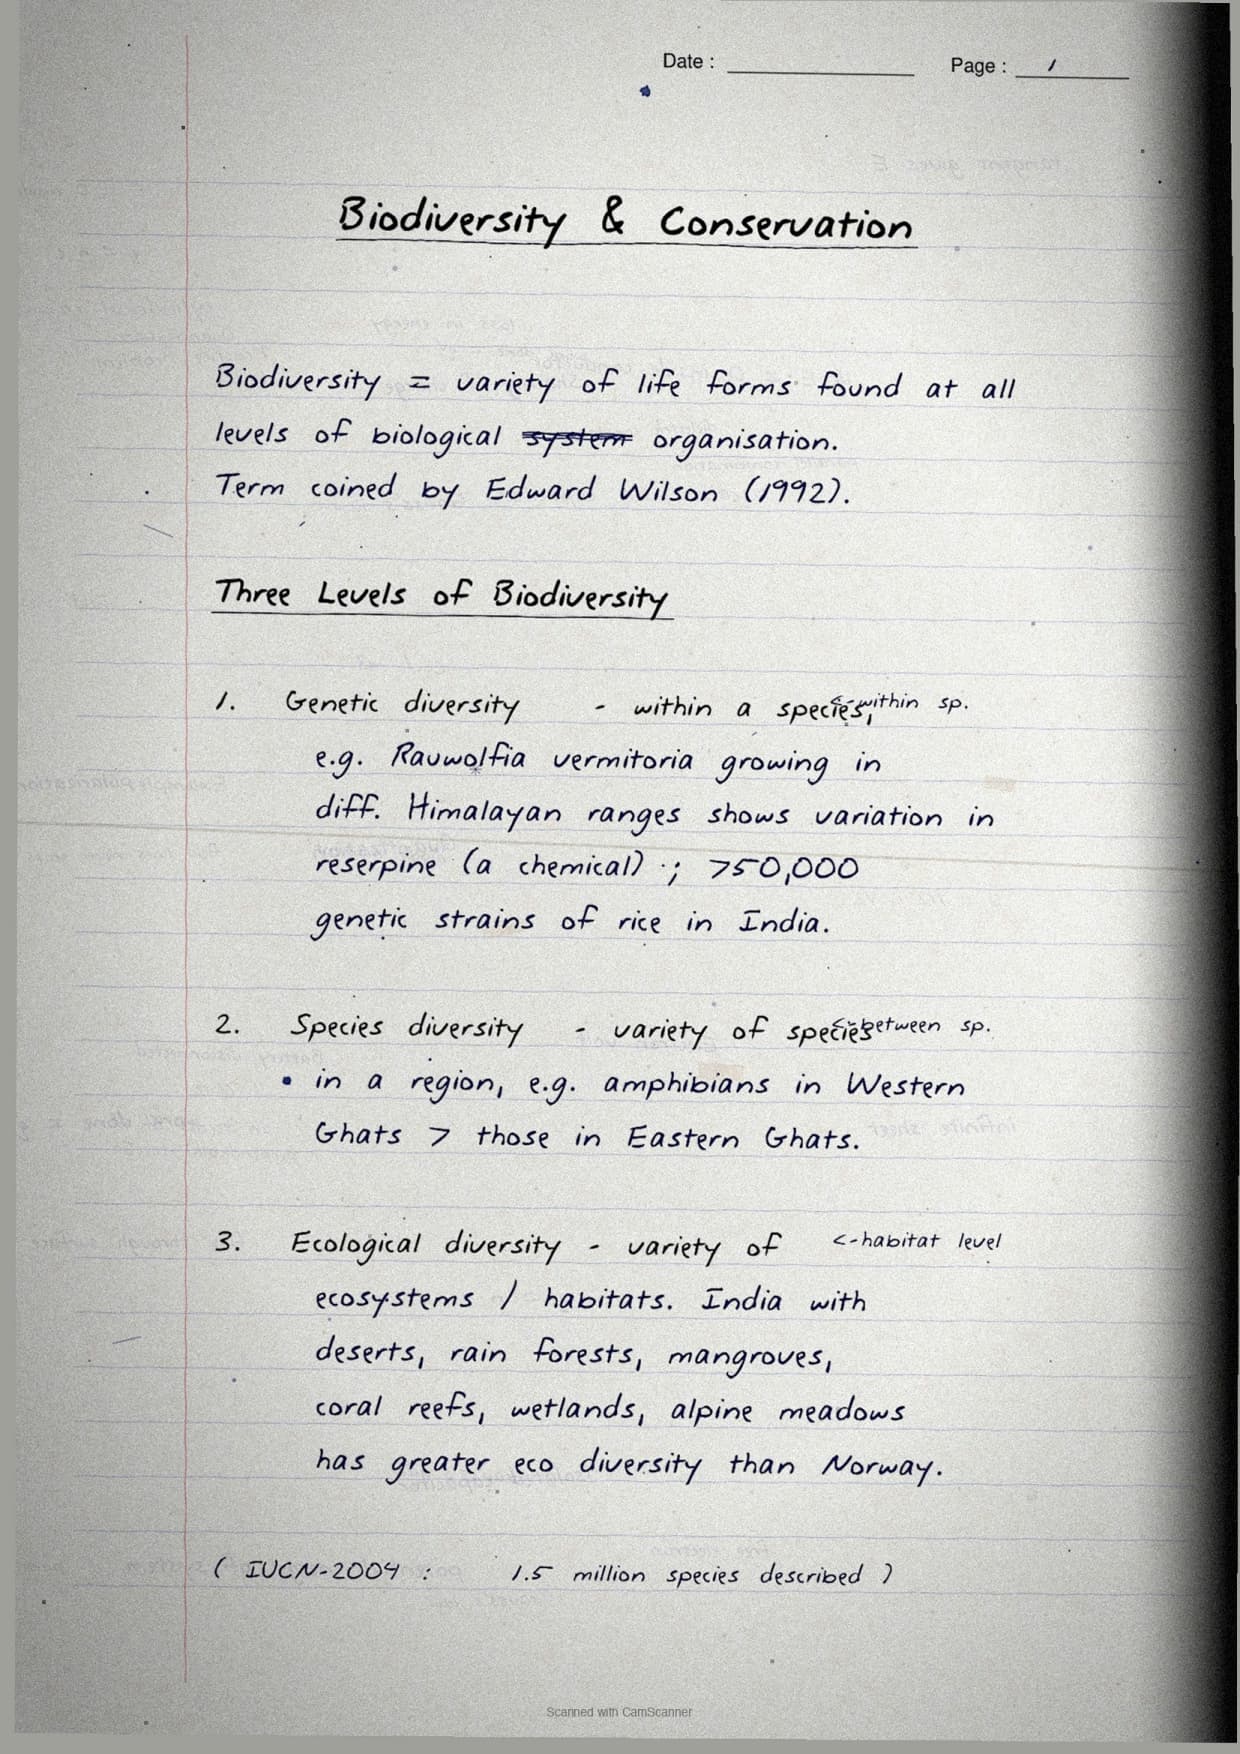
| 1-2 | Three levels of biodiversity (genetic, species, ecological) with Indian examples | Blue + orange |
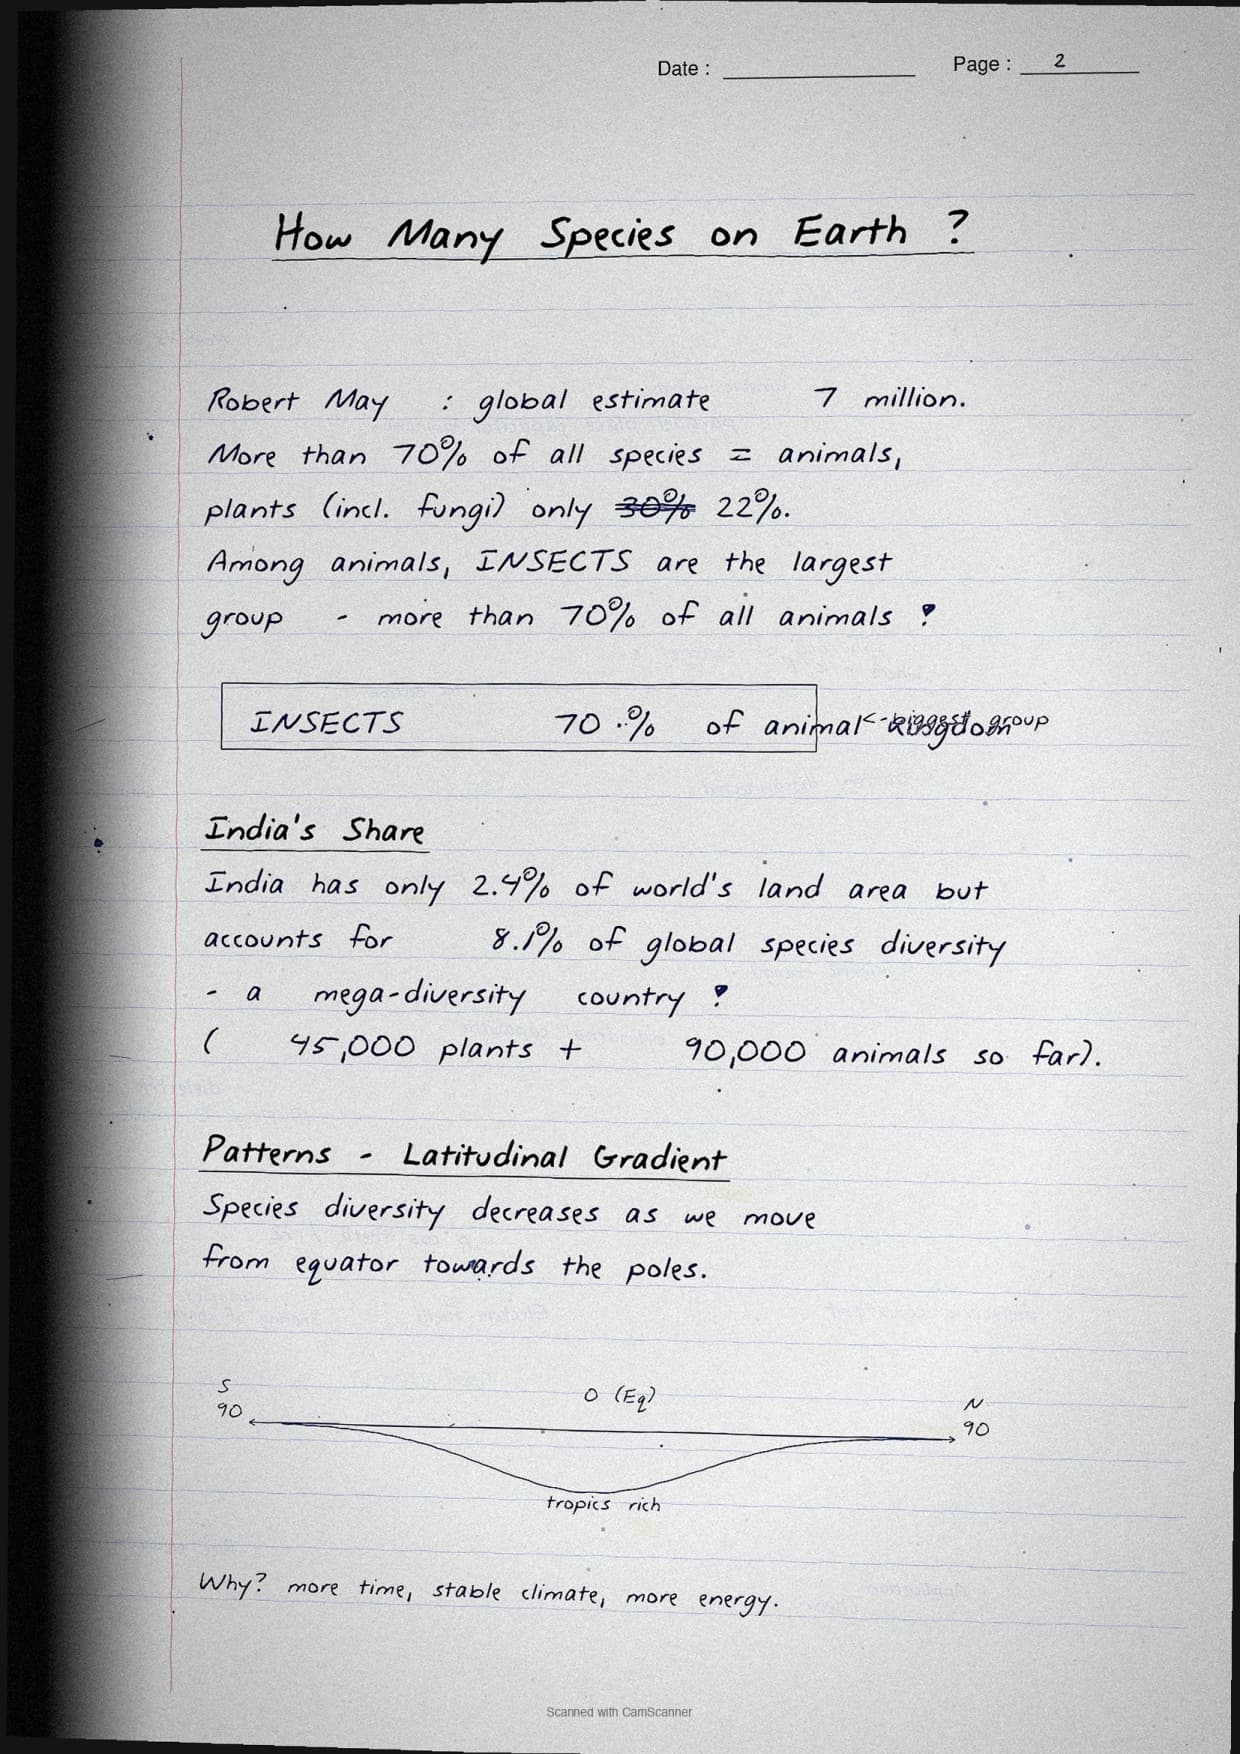
| 3-5 | How many species: IUCN 1.5 million, Robert May 7 million, animal / insect share | Blue + green + red |
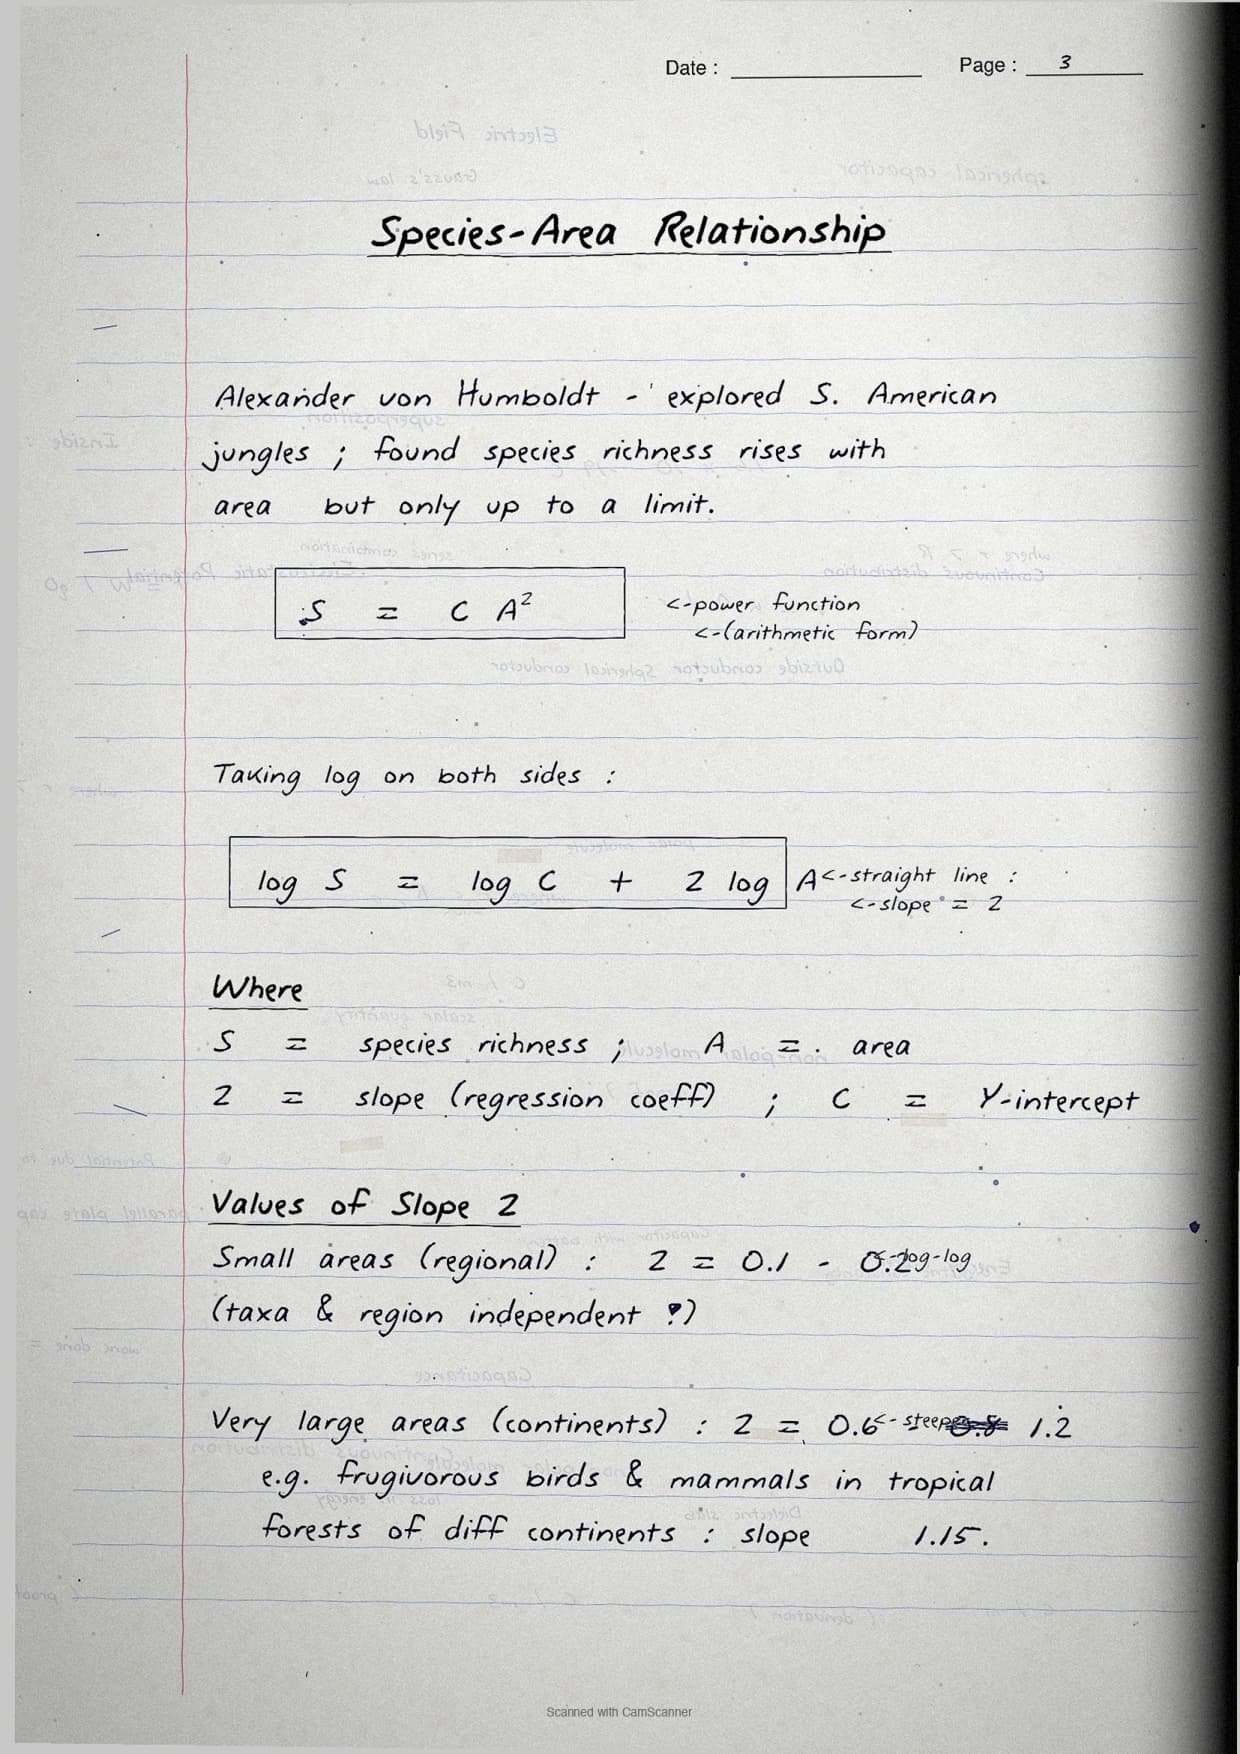
| 6-9 | Patterns: latitudinal gradient, three hypotheses, species-area equation S = C Az , z values | Blue + orange + red |
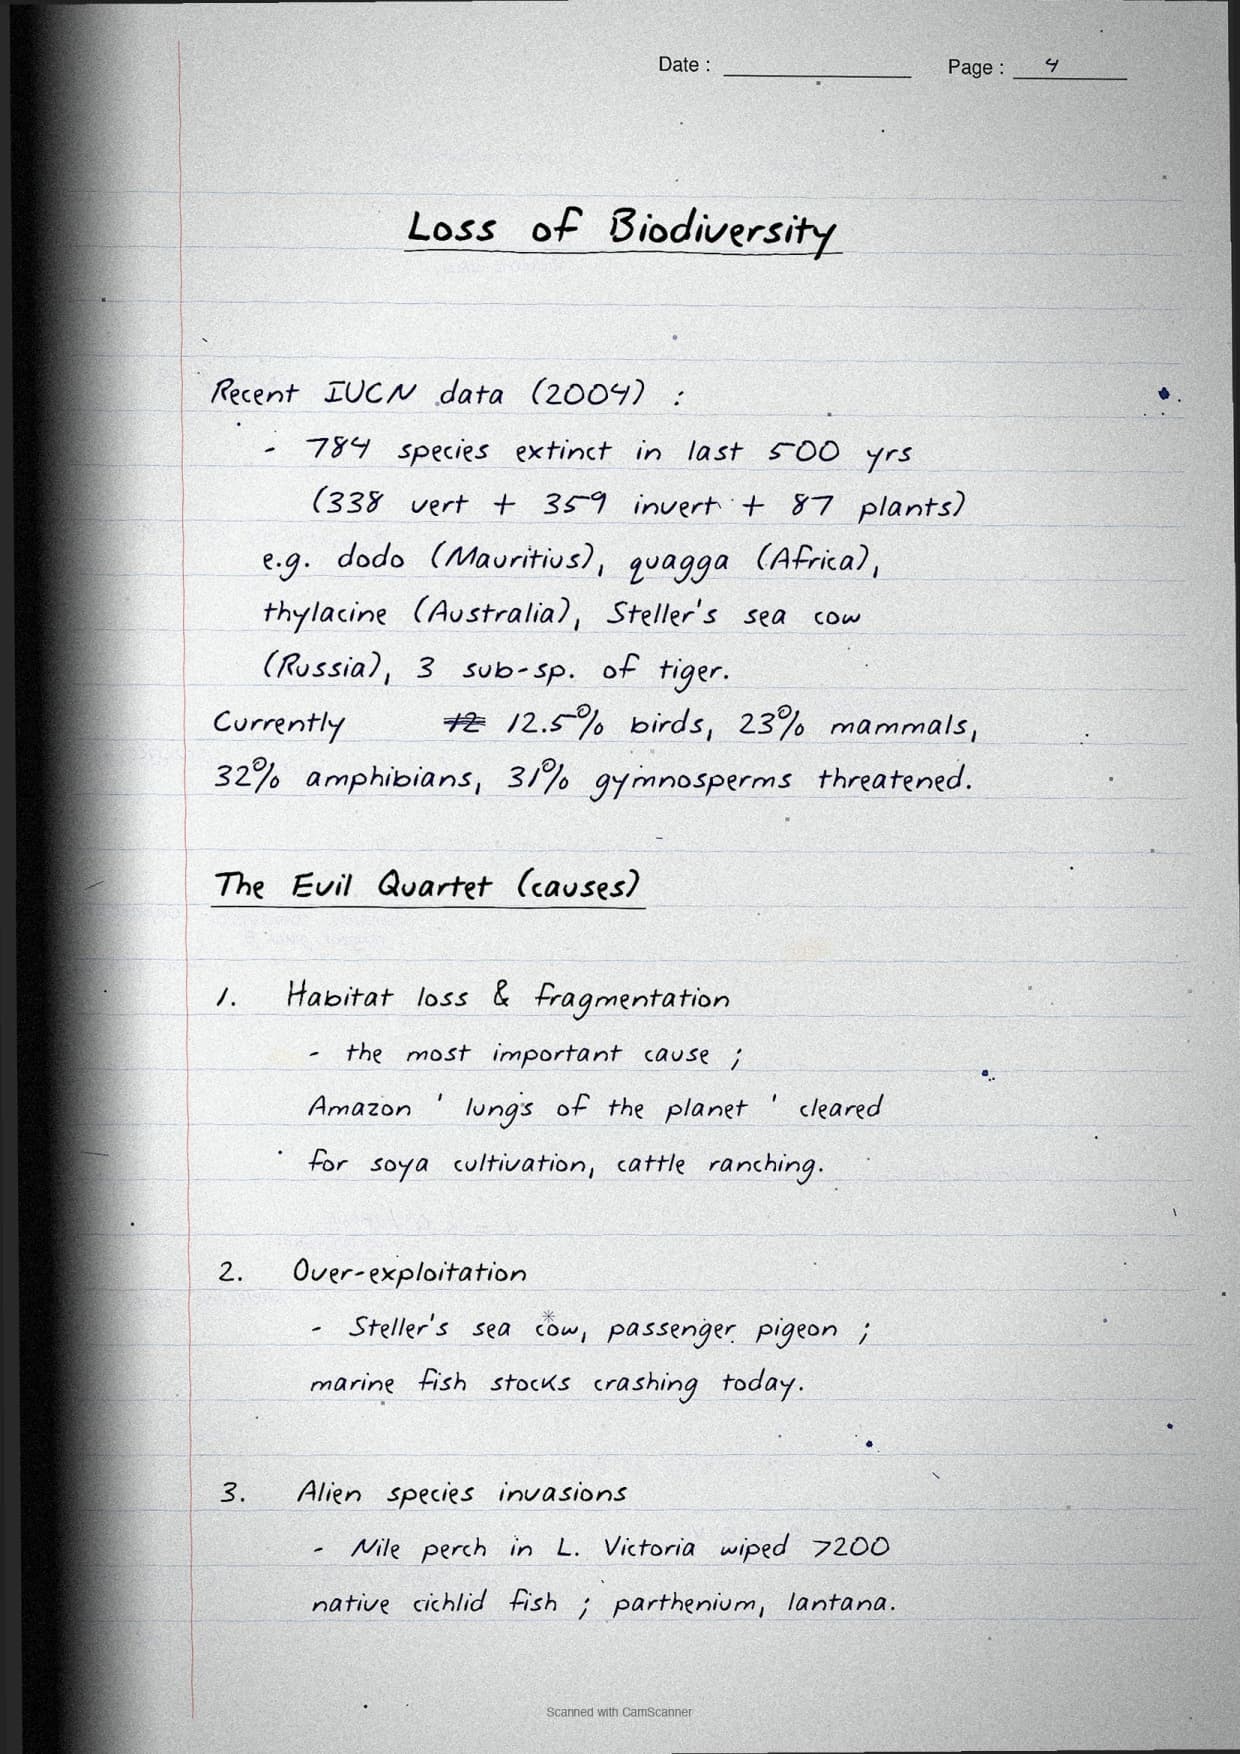
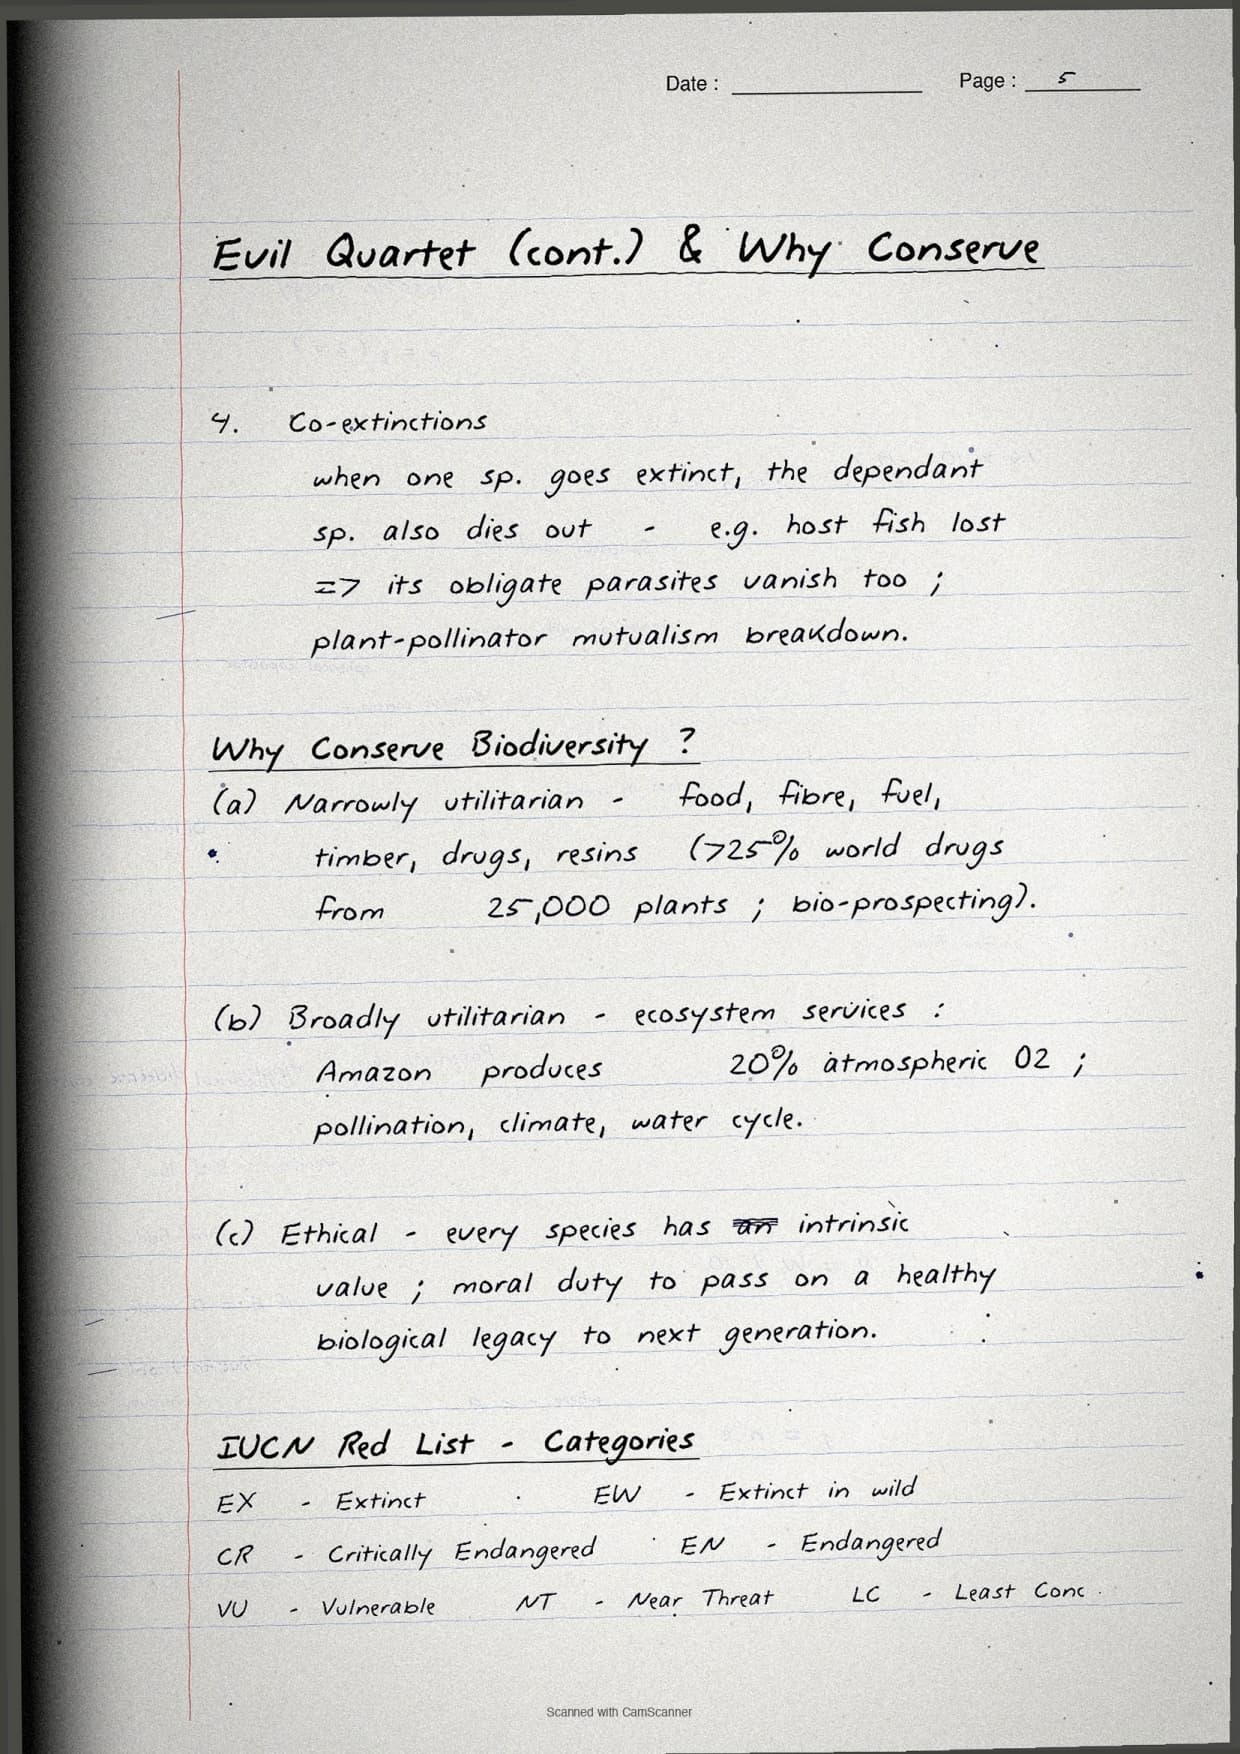
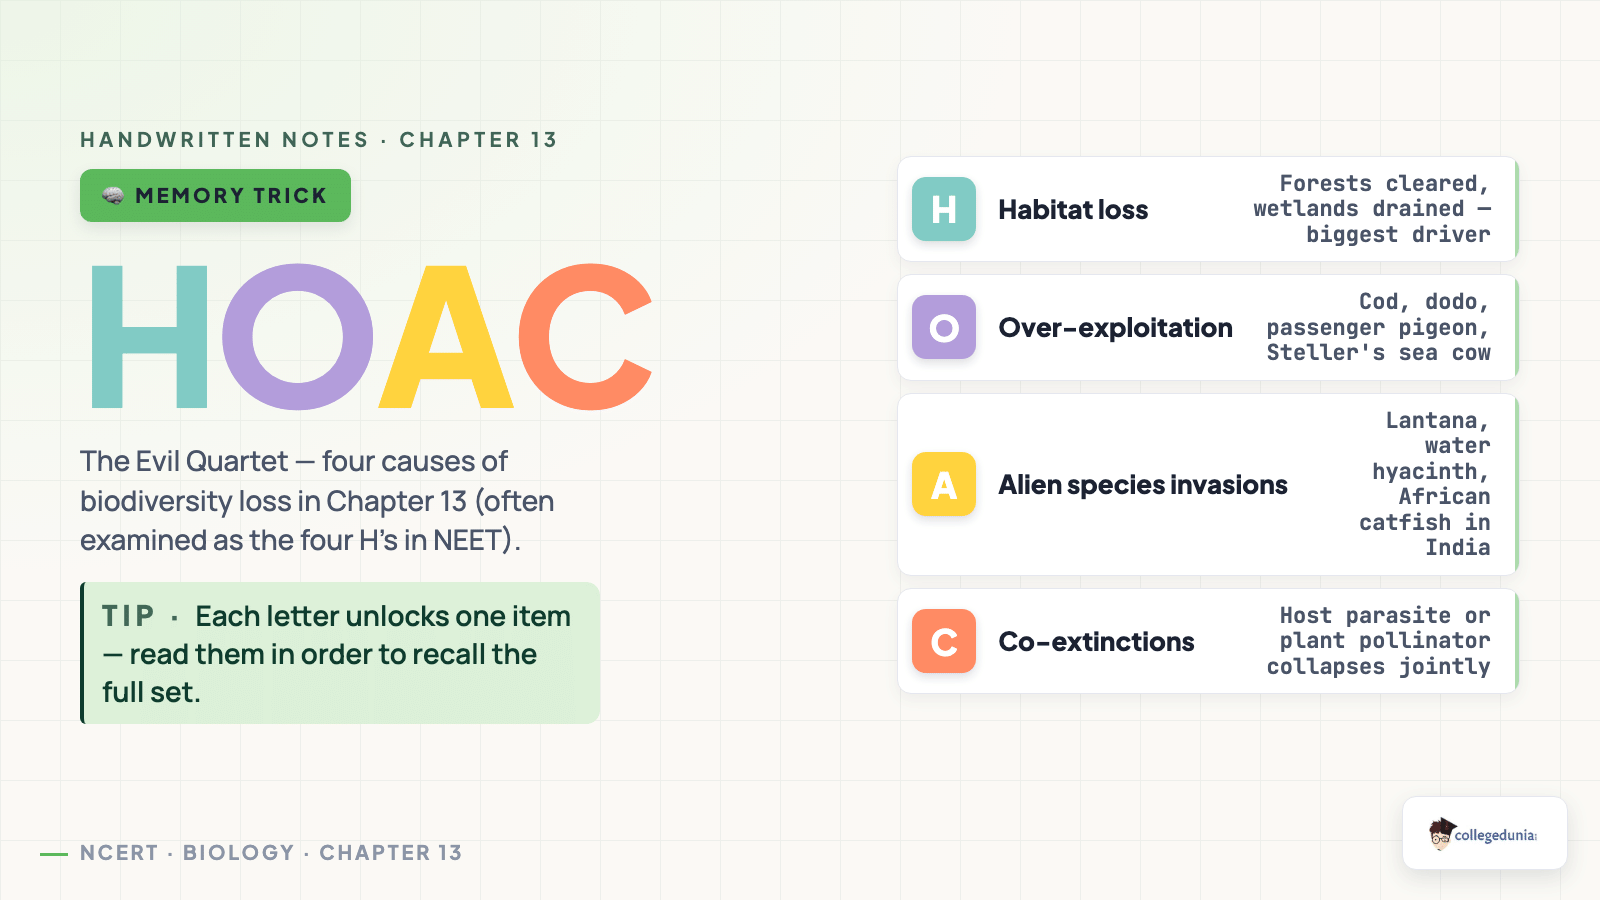
| 10-13 | Loss of biodiversity: present-to-background rate, Evil Quartet with examples | Blue + red |
| 14-15 | Importance: narrowly utilitarian, broadly utilitarian, ethical; Costanza valuation | Blue + green |
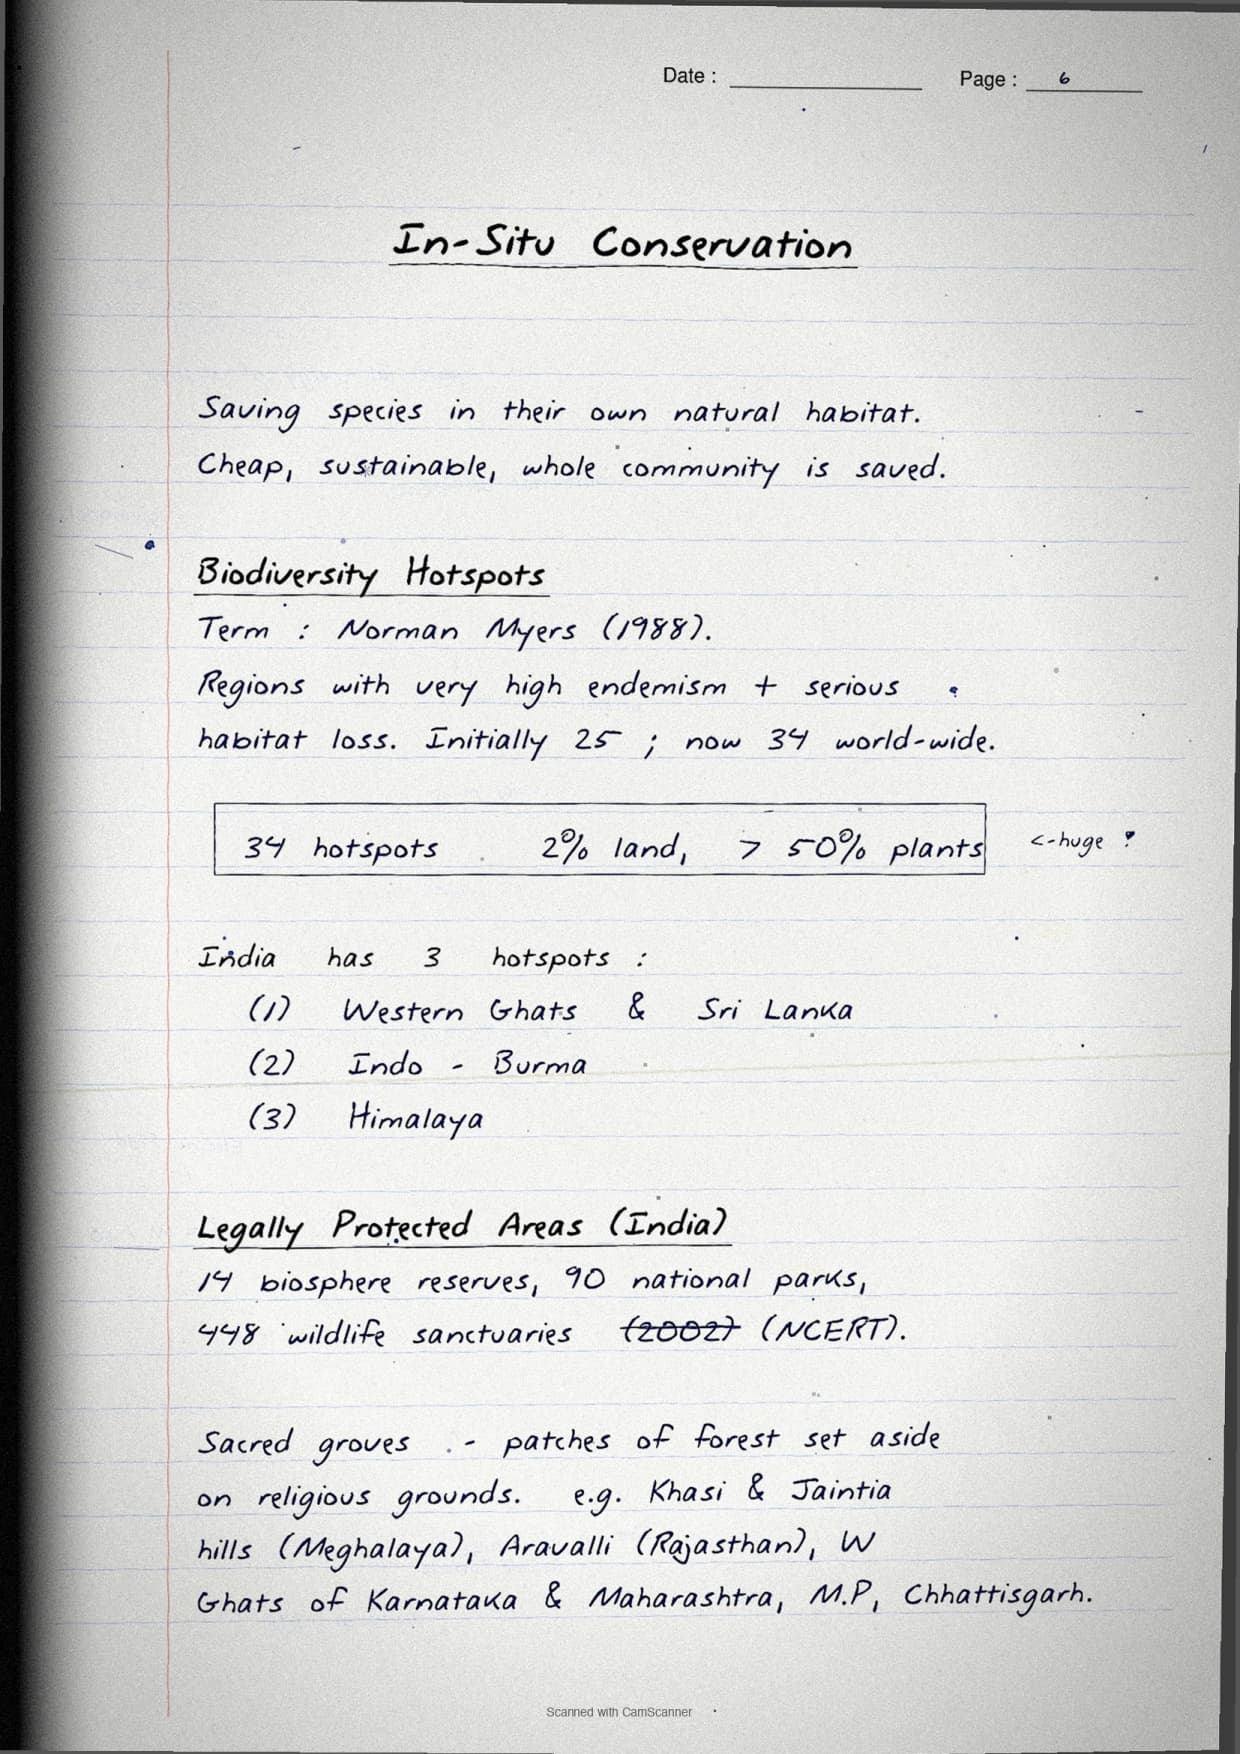
| 16-19 | In-situ conservation: 34 hotspots, 3 Indian hotspots, biosphere reserves, parks, sacred groves | Blue + orange + red |
| 20-21 | Ex-situ conservation: zoos, botanical gardens, cryopreservation, seed banks; Earth Summit | Blue + orange |
| 22 | Last-24-hour revision strip | Mixed |
Biodiversity and Conservation Diagram Inventory for Class 12 Biology
Six of the last seven NEET papers had a figure-based question on hotspots, the species-area curve or the conservation network. Every hand-drawn diagram in the PDF is listed below.
| Figure | What It Shows | Page | NEET Frequency |
|---|---|---|---|
| Fig 13.1 | Global species pie: invertebrates (insects, molluscs), vertebrates, plants (angiosperms, fungi) | 4 | Very High |
| Fig 13.2 | Species-area curve on linear axes (hyperbola) plus log-log line with slope z labelled | 8 | Very High |
| Fig 13.3 | Indian hotspot map: Western Ghats - Sri Lanka, Himalaya, Indo-Burma shaded | 17 | High |
| Fig 13.4 | Evil Quartet schematic: 4 arrows pointing into "biodiversity loss" hub | 11 | High |
| Fig 13.5 | Latitudinal gradient: richness peaks at equator and falls polewards | 7 | Medium |
| Fig 13.6 | In-situ vs ex-situ split spread | 18 | Medium |
| Fig 13.7 | Sacred grove sketch with religious markers | 19 | Medium |
| Fig 13.8 | Ex-situ toolkit: zoo + botanical garden + seed bank + cryotank icons | 21 | Low |
For last-day revision: lock Fig 13.1, 13.2, and 13.3. These three cover every figure-based question on this chapter since 2021.
Biodiversity and Conservation Top 6 Numerical Recall Facts for Class 12 Quick Revision
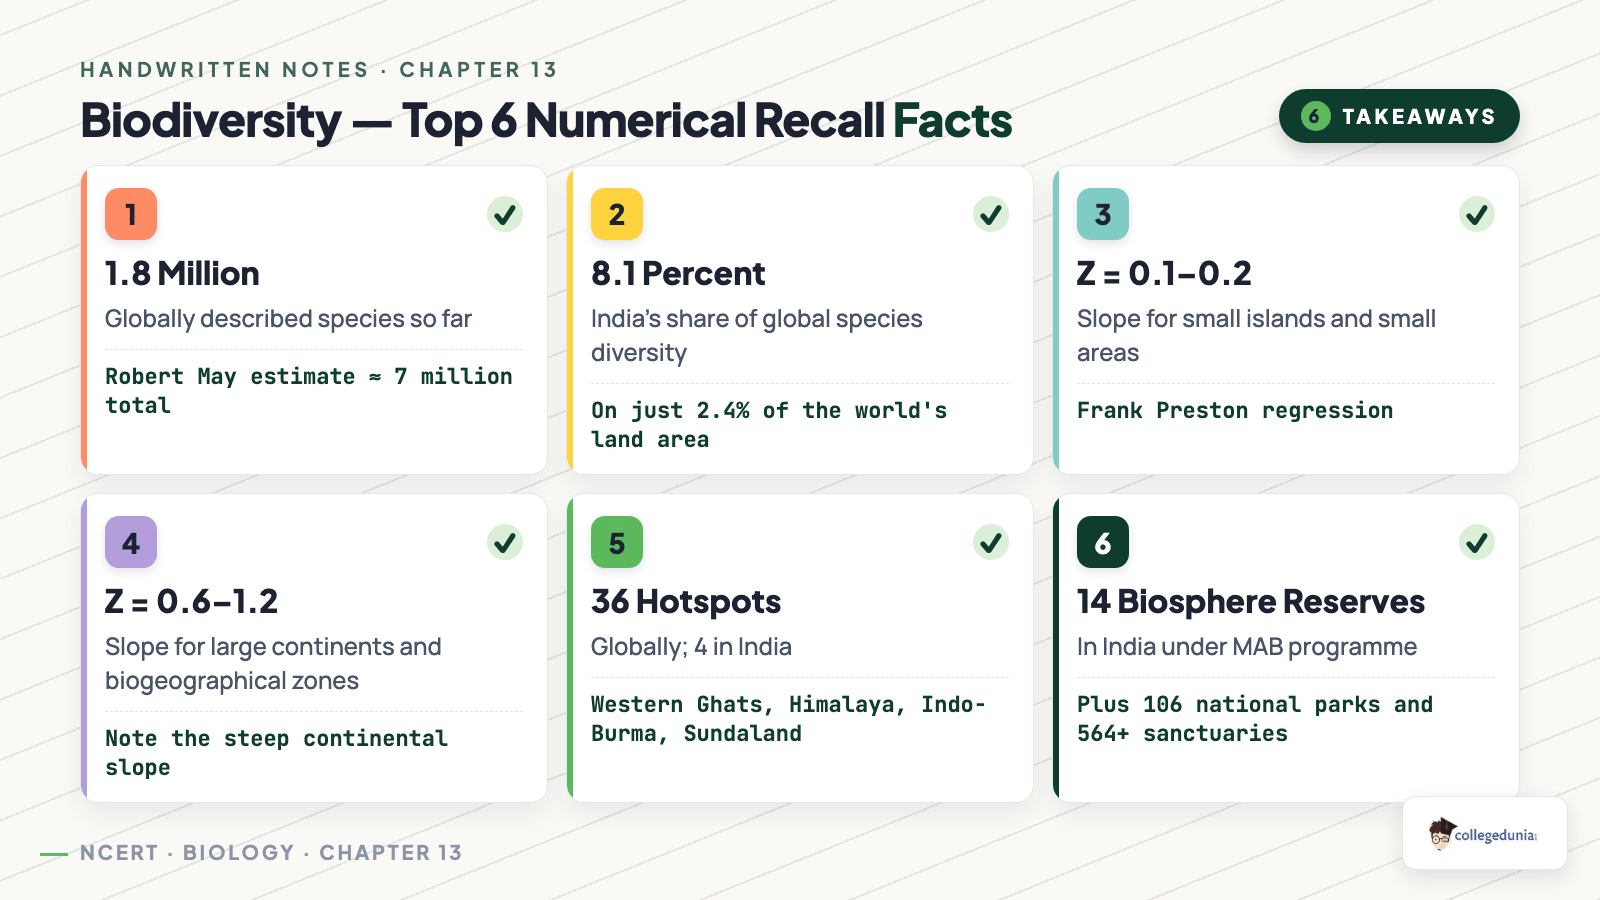
These six facts cover every direct-recall MCQ from the last five NEET and CBSE papers.
| Fact | Value | NEET / CBSE Frequency (last 5 yrs) | Page |
|---|---|---|---|
| Global biodiversity hotspots | 34 (3 in India) | 5 | 17 |
| Species-area slope z (small / large) | 0.1 to 0.2 / 0.6 to 1.2 | 5 | 8 |
| India's protected network | 14 biosphere reserves + 90 NPs + 448 sanctuaries | 4 | 18 |
| Robert May's species estimate | ~ 7 million (vs 1.5M described) | 4 | 5 |
| Present extinction rate | 100 to 1000 times background | 3 | 10 |
| Mega-diversity countries | 12 (India one of them) | 4 | 5 |
If you remember only these six numbers, you can answer 8 out of 10 NEET MCQs on this chapter. The PDF surrounds each with a hand-drawn example so the value sticks.
How to Use the Biodiversity and Conservation Handwritten Notes Across a Three-Day Plan
The 22-page scan splits into three blocks. Each block pairs with a NEET drill, so students finish the chapter in about 6 hours.
- Day 1 (pages 1-9): Biodiversity levels, species count, patterns. Solve 10 NEET MCQs on hotspots and species-area.
- Day 2 (pages 10-15): Loss of biodiversity (Evil Quartet) and importance. Solve 10 NEET MCQs on alien invasions and ecosystem services.
- Day 3 (pages 16-22): In-situ and ex-situ conservation, Earth Summit. Solve a 15-question PYP under 25 minutes.
Sample Handwritten Spread: The Species-Area Power Law in Class 12 Biology
The most photographed spread is the species-area pair: a rectangular hyperbola on linear axes and a straight line on log-log axes, with z = 0.15 and z = 0.9 marked.
Power law: S = C Az . On log-log axes: log S = log C + z log A . The slope of the regression line IS z.
z within a biome: 0.1 to 0.2 (e.g. z = 0.15 in tropical forests).
z across continents: 0.6 to 1.2 (Whittaker). Doubling area roughly doubles species.
Conservation corollary: Losing a big habitat tract destroys disproportionately many species - the quantitative basis for large contiguous parks over scattered fragments.
Biodiversity and Conservation Video Lecture for Class 12 Biology
Source: Magnet Brains on YouTube
Student Feedback: Biodiversity and Conservation Class 12 Biology Survey
A survey of 10,800 Class 12 Biology students found that 72% rated the species-area curve numerical as the hardest sub-topic - yet it carries the highest single-question marks in CBSE and NEET.
Student Feedback
- 72% marked the species-area curve numerical as the hardest sub-topic.
- 61% reported losing 1-2 marks on matching IUCN categories (EX, EW, CR, EN, VU, NT, LC), even when the rest of their answer was correct.
- 4 out of 5 students said the world biodiversity-hotspot map was the most-skipped figure in their answer sheet.
- Average student: 4.8 hours for first read, 2.0 hours for revision before the board exam.
- Only 41% attempted all 9 NCERT exercise questions; toppers revisited every wrong attempt within 24 hours.
Source: 2025-26 Class 12 Biology student survey. Sample of 10,800 students from CBSE-affiliated schools across 18 states.
Other Resources for Biodiversity and Conservation Class 12 Biology
| Resource | Link |
|---|---|
| Handwritten Notes | Biodiversity and Conservation Handwritten Notes |
| NCERT Solutions | Biodiversity and Conservation Class 12 Biology NCERT Solutions |
| Notes | Biodiversity and Conservation Class 12 Biology Notes |
| Formula Sheet | Biodiversity and Conservation Class 12 Biology Formula Sheet |
| Exemplar Solutions | Biodiversity and Conservation Class 12 Biology NCERT Exemplar Solutions |
| NCERT Book PDF | Biodiversity and Conservation Class 12 Biology NCERT Book PDF |
| Exemplar Book PDF | Biodiversity and Conservation Class 12 Biology NCERT Exemplar Book PDF |
Handwritten Notes for Class 12 Biology: All Chapters
| Chapter | Handwritten Notes |
|---|---|
| Chapter 1 | Sexual Reproduction in Flowering Plants Handwritten Notes |
| Chapter 2 | Human Reproduction Handwritten Notes |
| Chapter 3 | Reproductive Health Handwritten Notes |
| Chapter 4 | Principles of Inheritance and Variation Handwritten Notes |
| Chapter 5 | Molecular Basis of Inheritance Handwritten Notes |
| Chapter 6 | Evolution Handwritten Notes |
| Chapter 7 | Human Health and Disease Handwritten Notes |
| Chapter 8 | Microbes in Human Welfare Handwritten Notes |
| Chapter 9 | Biotechnology Principles and Processes Handwritten Notes |
| Chapter 10 | Biotechnology and Its Applications Handwritten Notes |
| Chapter 11 | Organisms and Populations Handwritten Notes |
| Chapter 12 | Ecosystem Handwritten Notes |
| Chapter 13 | Biodiversity and Conservation Handwritten Notes |
Biodiversity and Conservation Class 12 Biology Handwritten Notes FAQs
Ques. Where can I download Biodiversity and Conservation Class 12 Biology Handwritten Notes PDF?
Ans. You can download the Biodiversity and Conservation Class 12 Biology Handwritten Notes PDF directly from this page. Both the Normal and HD scans are free, and the file is mapped to the 2026-27 NCERT.
Ques. How many pages is the Biodiversity and Conservation Class 12 Handwritten Notes PDF?
Ans. The scan runs 22 ruled-paper pages with hand-drawn species-area graphs, the Indian hotspot map, the Evil Quartet schematic and an in-situ / ex-situ split spread, plus a one-page last-24-hour revision strip at the end.
Ques. Do the handwritten notes cover all NCERT sub-sections of Chapter 13?
Ans. Yes. The 22 pages cover all sub-sections of Section 13.1 (Biodiversity - levels, species count, patterns, loss, importance) and Section 13.2 (Biodiversity Conservation - in-situ, hotspots, ex-situ, Earth Summit). Every numerical fact from NCERT is captured in coloured ink.
Ques. Are these handwritten notes good for NEET 2027 preparation?
Ans. Yes. NEET pulls 2 to 4 questions a year from this chapter, almost all numerical recall or named-pattern MCQs. The notes flag every NEET-asked number with a margin tag showing the year it was asked, so high-frequency facts catch the eye first during revision.
Ques. What is the difference between Notes and Handwritten Notes for this chapter?
Ans. The Notes PDF is a clean typeset revision document with formal tables; the Handwritten Notes are a scanned student notebook with the diagrams and key numerical facts in coloured ink. Most students use the typed Notes for first-pass learning and the Handwritten Notes for last-day visual revision.
Ques. Which hand-drawn diagrams should I lock for last-day revision?
Ans. Lock Fig 13.1 (global species pie), Fig 13.2 (species-area on log-log axes), and Fig 13.3 (Indian hotspot map). These three diagrams account for every figure-based question on this chapter since 2021 in both NEET and CBSE Boards.
Ques. What is the species-area equation and what does its slope mean?
Ans. The species-area relation is S = C Az . On log-log axes it becomes a straight line with slope z. For small areas (within a biome), z is 0.1 to 0.2; for very large areas (continents), z is 0.6 to 1.2 (Whittaker). A steeper slope means even a small fractional area loss causes a large species loss.
Ques. How many biodiversity hotspots lie in India?
Ans. India shares three of the 34 global biodiversity hotspots: the Western Ghats - Sri Lanka, the Himalaya, and Indo-Burma. India also hosts 14 biosphere reserves, 90 national parks and 448 wildlife sanctuaries as its in-situ network.



Comments