


NEET 2025 placed three direct questions on this chapter and CBSE Board 2025 lifted a 3-mark short answer almost verbatim from the Exemplar, which is why Class 12 Biology Chapter 11 Organisms and Populations deserves a slot in your final-month revision. This page hosts the fully worked NCERT Exemplar solutions PDF, all 51 problems, mapped to the 2026-27 syllabus.


- CBSE Weightage: 5 to 7 marks (usually one short answer on population interactions or logistic growth plus one VSA on adaptations)
- NEET Weightage: 3 to 5 questions per year
- Exam Map: CBSE, NEET, AIIMS and CUET (not in the JEE syllabus)

These Exemplar Solutions are curated by NEET-rank-holder mentors at Collegedunia, mapped to the 2026-27 NCERT chapter, and benchmarked against the last five years of CBSE and NEET papers.
Also Check:
- Organisms and Populations Class 12 Biology NCERT Exemplar Book PDF
- Organisms and Populations Class 12 Biology NCERT Solutions
- Organisms and Populations Class 12 Biology Notes
Organisms and Populations NCERT Exemplar Video Solutions
Source: Magnet Brains on YouTube
Organisms and Populations Exemplar Question Types for Class 12 Biology
The Exemplar groups all 51 problems into four formats. Knowing the split helps you budget time per item. Every problem is solved in full inside the question bank lower down this page, with a Solution and an Expert Solution.
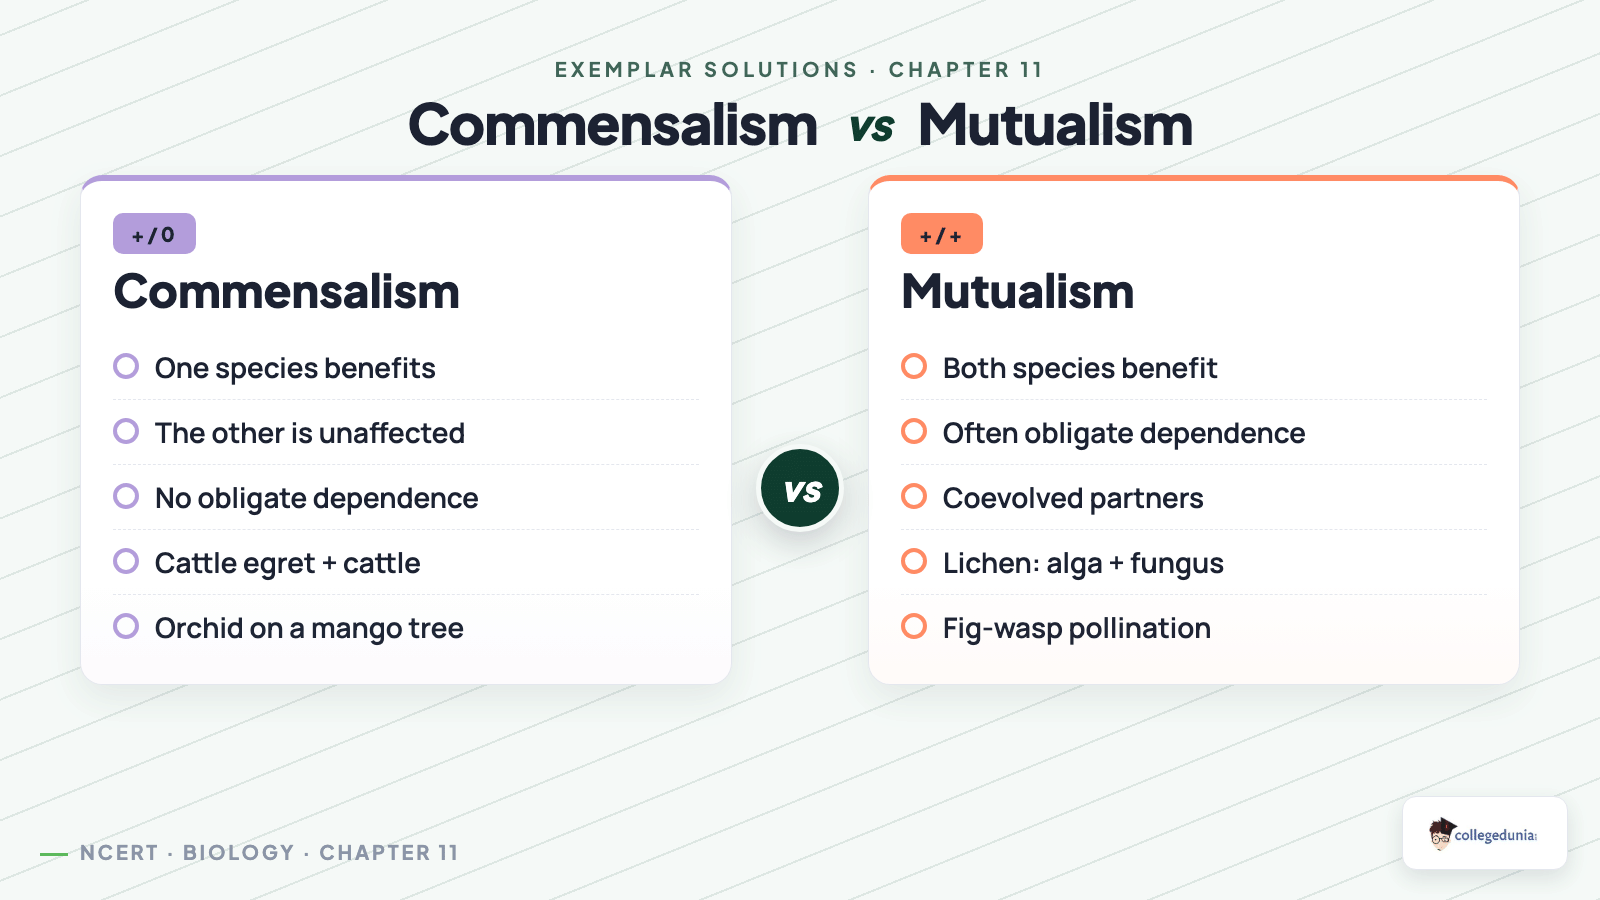
- MCQ (17): mostly sign-pair matching, for example commensalism (+/0) versus mutualism (+/+).
- VSA (18): one-line recall, such as why the logistic curve flattens as N approaches K.
- SA (11): short reasoning, such as stating Allen's rule and its adaptive value.
- LA (5): long derivations, such as the logistic equation and the sigmoid growth curve.
How Will Collegedunia's NCERT Exemplar Solutions Help You with Organisms and Populations?
This chapter is the top source of sign-pair MCQs in Class 12 Biology, but NEET traps students on the exact sign pair (+/0 vs +/+) and the exact NCERT example. Every Exemplar item below carries a full Solution plus an Expert Solution that names the recall phrase the answer key wants.
- Every type worked end-to-end: all 17 MCQ, 18 VSA, 11 SA and 5 LA problems, no skipped steps.
- Sign-pairs named: each step gives the sign-pair plus the NCERT example.
- NEET bridge: items tagged with the NEET year that reused the scaffold, so you spot the highest-yield revision.
- 2026-27 aligned: every solution flags whether the topic is still in the current syllabus.
Interaction Sign-Pair Recall Table: The Single Highest-Yield NEET Asset
If you remember nothing else from this chapter, lock the six interaction sign-pairs. Roughly 60% of the chapter's NEET MCQs are sign-pair matching items. The table below distils the eight most-asked pairs across the last five years.
| Interaction | Sign Pair | NCERT Example | NEET Asked |
|---|---|---|---|
| Mutualism | +/+ | Lichen (alga + fungus); Ficus-fig wasp | 2025, 2024 |
| Commensalism | +/0 | Cattle egret + cattle; orchid on mango | 2025, 2023 |
| Amensalism | -/0 | Penicillium on Staphylococcus | 2023 |
| Predation | +/- | Pisaster sea star; lion vs deer | 2024, 2022 |
| Parasitism | +/- | Cuckoo brood parasitism; Plasmodium | 2022 |
| Competition | -/- | Paramecium aurelia vs P. caudatum | 2025, 2021 |
| Mycorrhiza | +/+ | Glomus root association | 2023 |
| Keystone species | +/- (community) | Pisaster removal (Paine, 1966) | 2024, 2021 |
Three of these pairs appeared in NEET 2024 alone. Memorise the sign pair, not just the word, the Exemplar marker rejects "mutualism" when it wants "+/+".
Difficulty Step-Up From NCERT Textbook to Exemplar for Class 12 Biology
NCERT textbook questions test direct recall, the Exemplar twists the same scaffold by asking the why or the consequence. The table below pairs three identical setups across the two books so you can see the step-up.
| Concept | NCERT Textbook Q | Exemplar Twist |
|---|---|---|
| Logistic growth | "Write the logistic equation" (recall) | "What does the bracket (K-N)/K represent?" (interpretation) |
| Commensalism | "Define commensalism" (one-line) | "Why is the orchid on mango not parasitic?" (mechanism) |
| Adaptation | "Name a desert plant adaptation" (recall) | "Why does CAM photosynthesis save water in Opuntia?" |
| Allen's rule | "State Allen's rule" (one-line) | "Explain why short ears reduce heat loss" (surface-area logic) |
Students should attempt the NCERT version first, then the Exemplar twist the next day.
Organisms and Populations 12th Common Mistakes the Exemplar Trains Out
These mistakes are about phrasing the right fact in the wrong way, which is exactly what the Exemplar and the NEET answer key penalise.
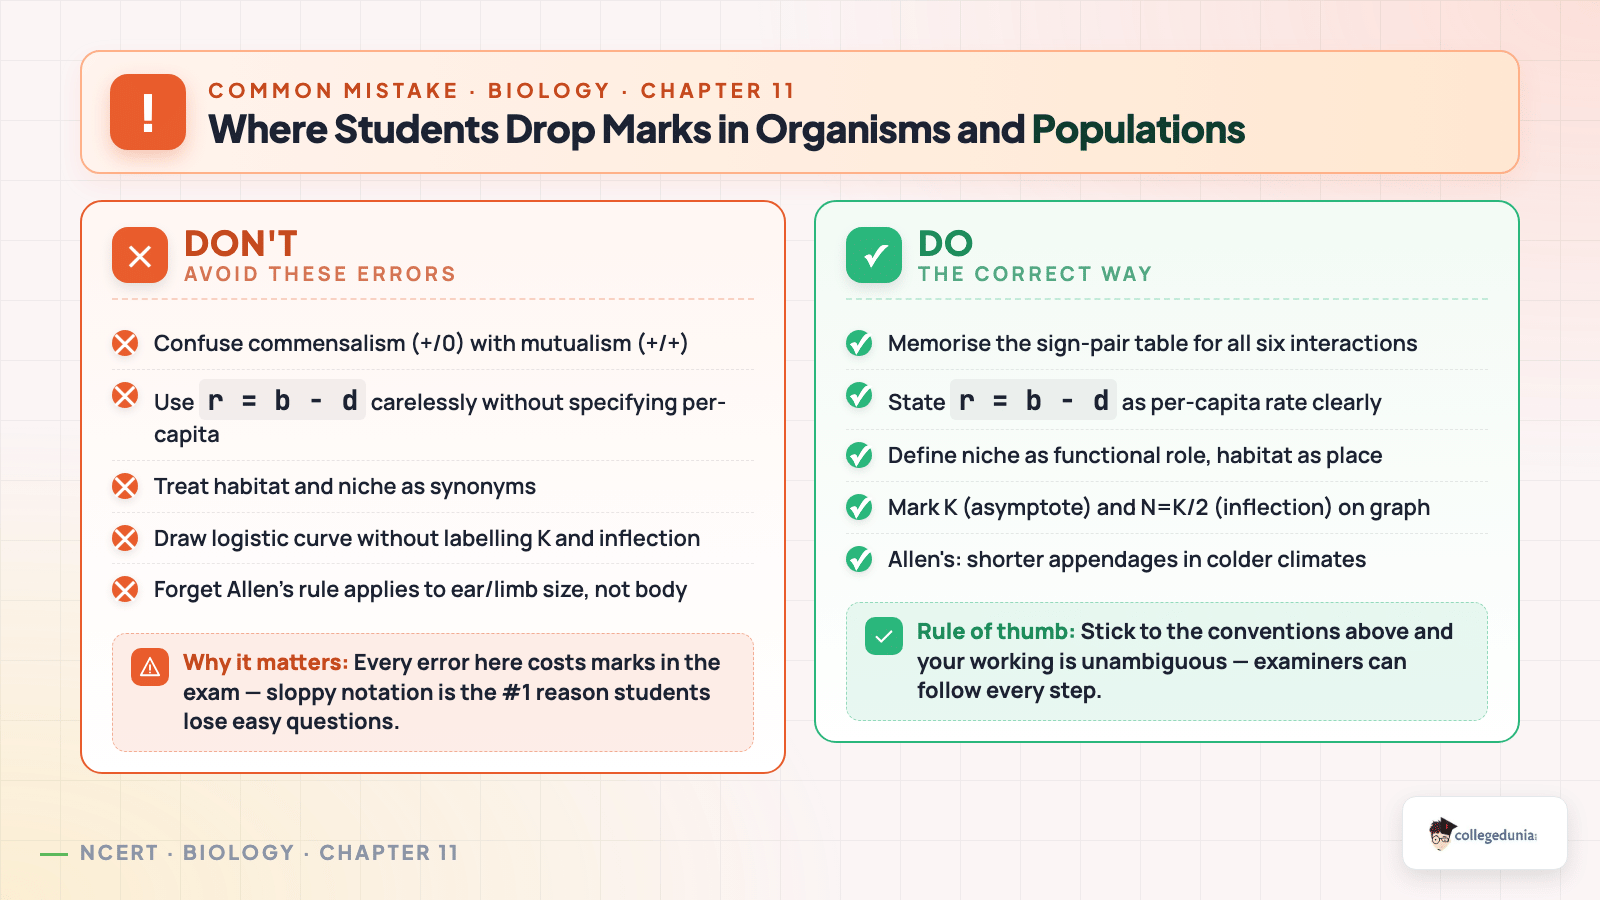
Mistake 1. Writing "dN/dt = rN" for logistic growth. That equation is exponential. Logistic carries the (K-N)/K bracket; the Exemplar marker wants the bracket explicit.
Mistake 2. Calling commensalism a "+/+" interaction. Commensalism is +/0; mutualism is +/+. The sign-pair is what the marker awards.
Mistake 3. Confusing predation (kills the prey) with parasitism (harms but keeps host alive). Both share +/-, but the outcome differs.
Mistake 4. Listing the kangaroo rat as a "regulator". It is a small mammal that does regulate, but the Exemplar wants the specific adaptation: oxidative water from internal fat.
Mistake 5. Writing "Gause's principle states two species can coexist" - the principle states they CANNOT coexist on the same limited niche; one excludes the other.
Best-Use of Organisms and Populations Exemplar for NEET Biology Preparation
The 51 Exemplar problems are not weighted equally for NEET. The block-wise plan below tells you which type to attempt first.
| Phase | Question Type | Why Now | Time Budget |
|---|---|---|---|
| First sweep | MCQ (17) | Sign-pair MCQs are the NEET sweet spot | 14 min |
| Second sweep | VSA (18) | One-line drill for CBSE 1-mark / 2-mark Qs | 36 min |
| Third sweep | SA (11) | Adaptations and population growth for CBSE 3-mark Qs | 55 min |
| Pre-exam sweep | LA (5) | Logistic derivation plus interactions for 5-mark CBSE | 40 min |
Class 12 Biology Chapter Weightage Across NEET
Organisms and Populations sits in the top tier of Class 12 Biology chapters by NEET yield, because the questions are pure recall plus one numerical. The mini-chart below sets it next to its neighbours.
Per-chapter NEET yield averaged over the last five papers (2021 to 2025).
Other Resources for Organisms and Populations Class 12 Biology
| Resource | Link |
|---|---|
| Exemplar Solutions | Organisms and Populations Exemplar Solutions |
| NCERT Solutions | Organisms and Populations NCERT Solutions Class 12 Biology |
| Notes | Organisms and Populations Notes Class 12 Biology |
| Handwritten Notes | Organisms and Populations Handwritten Notes Class 12 Biology |
| Formula Sheet | Organisms and Populations Formula Sheet Class 12 Biology |
| Exemplar Book PDF | Organisms and Populations NCERT Exemplar Book PDF Class 12 Biology |
| NCERT Book PDF | Organisms and Populations NCERT Book PDF Class 12 Biology |
All NCERT Exemplar Questions for Organisms and Populations with Step-by-Step Solutions
Every question of the NCERT Exemplar set for Class 12 Biology Chapter 11 Organisms and Populations is listed below with its full Solution and Expert Solution hidden inside collapsible tabs. Click Check Solution to reveal the step-by-step working; click Expert Solution for the expanded explanation.
Multiple-Choice Questions
Autecology is the:
(a) Relation of heterogenous populations to its environment
(b) Relation of an individual to its environment
(c) Relation of a community to its environment
(d) Relation of a biome to its environment
Correct option: (b) Relation of an individual to its environment.
Concept used. Ecology is the branch of biology that studies interactions among organisms and between organisms and their physical surroundings. It is studied at four levels of biological organisation: autecology (a single species or individual with its environment), synecology (a community of populations with its environment), population ecology (a group of conspecific individuals) and ecosystem ecology (energy flow and nutrient cycling). The prefix aut- comes from the Greek autos meaning ``self'', signalling that the focus is on a single self-standing unit (one organism or one species).
- Decode the term. Aut- = self/individual; -ecology = study of relations with environment. Together: study of an individual organism (or single species) and its environment.
- Match to options. Option (a) refers to several different populations - that is synecology. Option (c) is community ecology (synecology). Option (d) is biome-level ecology, an even larger scale. Only option (b) names a single individual.
- Confirm with example. The study of how one cactus survives in the Thar desert (its water economy, leaf modification, stomatal rhythm) is autecology of Opuntia.
Option (b): Relation of an individual to its environment.
Quick reading. Read the prefix first: aut- always means ``single/self'' in biology (autotroph = self-feeder, autosome = single-chromosome pair). The moment you see ``aut-'' + ``ecology'', the answer must involve a single unit - one organism or one species - interacting with its surroundings.
- Aut- → self / individual / single species.
- Syn- → together / community / many species.
- Eliminate by scale. Options (a), (c), (d) describe many organisms (populations, community, biome) - all are synecology.
- Only option (b) ``an individual to its environment'' matches the literal meaning of autecology.
- Anchor it with a textbook example: Schimper's 1898 work on Calluna vulgaris (heather) and a single moor habitat is considered the founding study of autecology.
Why this matters. NEET often tests level-of-organisation vocabulary (individual < population < community < ecosystem < biome < biosphere). Knowing the aut-/syn- split makes a whole class of MCQs trivial.
Option (b) - autecology = single organism + environment.
Ecotone is:
(a) A polluted area
(b) The bottom of a lake
(c) A zone of transition between two communities
(d) A zone of developing community
Correct option: (c) A zone of transition between two communities.
Concept used. An ecotone is the narrow band of overlap where two adjacent ecological communities meet, e.g. the mangrove between sea and land, the estuary between river and ocean, or the grassland–forest fringe. Ecotones often display the edge effect: greater species diversity than either neighbouring community because organisms from both sides plus a few ecotone specialists (edge species) coexist. The word fuses Greek oikos (house) and tonos (tension).
- Test each distractor. (a) ``Polluted area'' is just a degraded patch - no community-transition connotation. (b) ``Bottom of a lake'' is the benthic or profundal zone, a specific lake stratum, not a community boundary. (d) ``Zone of a developing community'' describes a sere or successional stage, not an interface.
- Match the definition. ``A zone of transition between two communities'' captures the spatial-overlap idea precisely.
- Anchor with example. The mangrove ecotone hosts both salt- tolerant plants (Rhizophora) and certain land-derived crabs and fish that range into brackish water.
Option (c): A zone of transition between two communities.
Structural observation. The word ecotone pairs eco- (community/house) with -tone (tension). The image to hold in your head is two ecosystems pressing against each other along a tense seam - that seam is the ecotone.
- Define mathematically: if community A has species set SA and community B has species set SB, the ecotone contains SA ∪ SB ∪ SE, where SE is the small set of edge-specialist species.
- Therefore ecotone diversity > diversity of either A or B alone - the edge effect. This is also why conservation biologists protect ecotones disproportionately.
- Map to options: only option (c) speaks of two communities in contact.
Option (c) - the transition seam between two communities.
Connection to wider chapter. The point this question makes is reinforced elsewhere in the chapter: the same prefix and sign- table logic recurs in the MCQ block, the SA block on inter-specific interactions, and the LA discussion of population growth. Building this vocabulary once and reapplying it across question types is the fastest way to clear an Exemplar chapter at speed.
Practice cue. If a similar question appears in the board paper or NEET, restate the definition in one sentence, anchor it with one named Indian-context example, then commit to the option. Avoid second-guessing once the prefix or sign-table has been decoded - the chapter is designed so that a single decoding step selects the answer.
Biosphere is:
(a) a component in the ecosystem
(b) composed of the plants present in the soil
(c) life in the outer space
(d) composed of all living organisms present on earth which interact with the physical environment
Correct option: (d) Composed of all living organisms present on earth which interact with the physical environment.
Concept used. The biosphere is the global ecological zone occupied by all living things on Earth, together with the parts of the lithosphere (soil/rock), hydrosphere (water) and atmosphere (air) with which they interact. It is the largest, all-inclusive level of biological organisation, above ecosystem and biome. The biosphere extends from the deepest ocean trenches (where chemosynthetic bacteria live) to the high troposphere (where some spores and insects drift).
- Eliminate (a): the biosphere contains ecosystems, it is not a sub-component of one.
- Eliminate (b): plants in soil are just one of many groups in the biosphere; the definition is far broader.
- Eliminate (c): no life is known to exist in outer space - the biosphere is Earth-bound.
- Option (d) names all living organisms plus their physical-environment interactions - that matches the textbook definition.
Option (d): All organisms on Earth that interact with the physical environment.
Picture-first. Imagine zooming out from a single cell on a leaf: cell → organism (the plant) → population (all plants of that species) → community (all populations in the patch) → ecosystem (community + abiotic factors) → biome (regional ecosystems sharing climate) → biosphere (every biome combined with their air, water and rock).
- The biosphere is the outermost concentric shell of life on Earth. Anything alive on the planet is inside it.
- It is the unit at which we discuss global biogeochemical cycles (carbon, nitrogen, water).
- Only option (d) captures both inclusivity (``all'') and interaction with the physical environment.
Why this matters. The biosphere concept anchors all discussion of global change - climate change, ozone depletion, mass extinction - because each operates at biosphere scale.
Option (d) - the entire living layer of Earth.
Ecological niche is:
(a) the surface area of the ocean
(b) an ecologically adapted zone
(c) the physical position and functional role of a species within the community
(d) formed of all plants and animals living at the bottom of a lake
Correct option: (c) The physical position and functional role of a species within the community.
Concept used. A niche is the multi-dimensional description of a species' way of life: where it lives in the habitat (spatial or habitat niche), what it eats and what eats it (trophic niche), when it is active (temporal niche) and how it responds to abiotic gradients of temperature, moisture, light and pH. Habitat answers ``where''; niche answers ``where + what + when + how''. The competitive-exclusion principle (Gause) says that no two species can occupy the same niche indefinitely.
- Test each option. (a) Ocean surface is just a habitat location - too narrow. (b) ``Ecologically adapted zone'' is vague and could describe a habitat. (d) Lake-bottom organisms form the benthos - again a habitat, not a niche.
- Option (c) names both the physical position (habitat aspect) and the functional role (feeding, breeding, competing). That is the modern Hutchinsonian definition of niche.
- Concrete example. Two leaf-warbler species in the same Himalayan forest can coexist because one feeds on insects at the canopy edge while the other gleans from inner branches - same habitat, different niches.
Option (c): Physical position + functional role of a species in the community.
Strategic angle. Don't confuse habitat (the address) with niche (the profession). Habitat says ``the squirrel lives on the oak tree''; niche says ``the squirrel lives on the oak, feeds on acorns at dawn and dusk, nests in cavities, is preyed on by hawks, and disperses oak seeds.''
- ``Physical position'' in option (c) maps to the habitat component.
- ``Functional role'' maps to feeding, reproductive timing, predator–prey links, competitive role, etc.
- Only (c) has both - every other option has only the location part.
Option (c) - niche = address + profession.
Cross-reference within the chapter. The principle invoked here is also used in the long-answer questions on community interactions and on growth curves. Recognising the same idea recycled across question types saves time on the Exemplar paper.
Take-away for revision. Note the named example used above in your formula sheet under ``Organisms and Populations''. The chapter's MCQs, VSAs and SAs repeatedly draw from a small canonical list of Indian-context examples - committing those to memory pays back across every section.
According to Allen's Rule, the mammals from colder climates have:
(a) shorter ears and longer limbs
(b) longer ears and shorter limbs
(c) longer ears and longer limbs
(d) shorter ears and shorter limbs
Correct option: (d) shorter ears and shorter limbs.
Concept used. Allen's Rule (Joel Allen, 1877) states that endothermic (warm-blooded) animals from colder climates tend to have shorter appendages - ears, limbs, tails, snouts - than related species from warmer climates. The reason is geometric: appendages have a high surface-area-to-volume ratio and lose heat quickly. Shrinking them reduces heat loss and helps maintain core body temperature. (Compare Bergmann's Rule: cold-climate animals tend to be larger overall, because volume rises faster than surface area.)
- State the principle in symbols. Heat loss ∝ surface area A; heat content ∝ body volume V. Smaller appendages cut A without cutting V, so the loss-to-content ratio drops.
- Apply to options. Cold ⇒ minimise heat loss ⇒ both ears and limbs should be short. Only option (d) has both shorter.
- Sanity check with examples. Arctic fox has small ears and short limbs; desert fennec fox has huge ears and long limbs. Same genus, opposite extremes - exactly what Allen's Rule predicts.
Option (d): Shorter ears and shorter limbs.
Quick reading. The mnemonic is ``cold = compact''. Long thin appendages bleed heat; short stubby ones conserve it. Walrus, polar bear, arctic fox - all noticeably stubby compared with their tropical cousins.
- Pair Allen with Bergmann. Allen → appendage shape; Bergmann → overall body size. Cold climates favour large bodies + short appendages together.
- Eliminate by sign. Anything with ``longer'' in cold climates contradicts the rule. That kills (a), (b), (c).
- Option (d) is the only doubly-short choice - it wins.
Option (d) - both ears and limbs are short in cold-climate mammals.
Where this fits in the chapter map. This idea sits at the intersection of the ``abiotic factors → organismic responses'' and ``population attributes → growth models'' threads. The sign-table for interactions, the four response modes (regulate, conform, migrate, suspend) and the two growth-curve shapes (J and S) are the chapter's three pillars; every Exemplar question is a variation on one of them.
Speed tactic. When a similar Exemplar question appears, identify which pillar it belongs to first - that immediately narrows the vocabulary and the canonical example set you need to draw on. The actual answer then falls out in a single line of reasoning.
Salt concentration (Salinity) of the sea measured in parts per thousand is:
(a) 10 – 15
(b) 30 – 70
(c) 0 – 5
(d) 30 – 35
Correct option: (d) 30 – 35 ppt.
Concept used. Salinity measures the total dissolved salts in water, expressed in parts per thousand (ppt or ). The textbook ranges are: inland freshwater < 5 ppt; open sea 30–35 ppt (about 3.5% salt by mass); hypersaline lagoons > 100 ppt. Organisms tolerant of only a narrow salinity range are stenohaline; those tolerant of a wide range are euryhaline.
- Recall the canonical figure for ocean salt content: ≈ 35 g salt per 1000 g of seawater = 35 ppt.
- Match to options. (a) 10–15 is brackish (estuary). (c) 0–5 is fresh inland. (b) 30–70 starts plausibly but extends past any oceanic value. Only (d) 30–35 hugs the textbook range.
- Cross-check. The chlorinity-based definition gives an average of 34.7 ppt for the open Atlantic - well inside (d).
Option (d): 30 – 35 ppt for the open sea.
Quick reading. If you only memorise one salinity figure, remember 35 ppt for the open ocean. Estuaries are diluted by river flow; hypersaline lagoons (Dead Sea, Rann of Kutch in summer) are concentrated by evaporation. The chapter table places the sea between those extremes.
- Eliminate the freshwater band: (c) 0–5 ppt belongs to rivers and inland lakes.
- Eliminate brackish: (a) 10–15 ppt is typical of estuarine mixing zones.
- Eliminate over-shoot: (b) 30–70 ppt would include hypersaline lagoons, not the open sea.
- That leaves (d) 30–35 ppt - the marine textbook range.
Option (d).
Linking to the rest of the syllabus. The same logic applies in Ecosystem (Chapter 12 in the 2026-27 syllabus) where energy flow and nutrient cycling depend on the species-level interactions discussed here, and in Biodiversity & Conservation (Chapter 13) where the conservation of mutualisms and pollinators is a recurring theme.
Recommended practice. Re-read the chapter table of positive interactions and run through one named Indian-context example for each. The Exemplar deliberately tests examples (not just definitions), so a handful of well-chosen examples per category is the most efficient revision strategy.
Formation of tropical forests needs mean annual temperature and mean annual precipitation as:
(a) 18 – 25 C and 150 – 400 cm
(b) 5 – 15 C and 50 – 100 cm
(c) 30 – 50 C and 100 – 150 cm
(d) 5 – 15 C and 100 – 200 cm
Correct option: (a) 18–25 C and 150–400 cm.
Concept used. A biome is a large climatic region characterised by a distinctive plant community. Tropical rainforests straddle the equator (Amazon, Congo, Western Ghats, Borneo); their defining climate is warm (no real winter) and wet (rain nearly every month). The textbook gives mean annual temperature ≈ 18–25 C and mean annual precipitation ≈ 150–400 cm. Combined, these allow continuous primary productivity and the iconic multi-storey canopy.
- Eliminate the cold options. (b) and (d) start at 5 C - that is temperate or boreal climate, not tropical.
- Eliminate the dry option. (c) caps precipitation at 150 cm - insufficient for rainforest formation (deserts and dry savannas live there).
- Eliminate the unrealistic temperature. 30–50 C mean is desert-class, not rainforest.
- Only (a) keeps both axes in the textbook rainforest band.
Option (a): 18–25 C, 150–400 cm.
Strategic angle. For biome MCQs, screen the temperature axis first (it has fewer overlaps), then the precipitation axis. Any option whose temperature does not match the tropics (warm, no frost) can be discarded immediately.
- Temperature screen: tropical means ≈ 18–28 C annual mean. Options (b) and (d) fail.
- Precipitation screen: rainforest needs ≥ 150 cm/yr. Option (c) fails (≤ 150 cm).
- Option (a) survives both screens.
Why this matters. The same screening idea identifies temperate forest (10–20 C, 75–150 cm) and tundra (-10 to 5 C, < 25 cm) MCQs at a glance.
Option (a).
Why the chapter keeps returning to this idea. The Exemplar is structured so that each MCQ, VSA, SA and LA tests the same small set of core ideas at increasing depth. This question is one such variant; mastering the underlying principle once unlocks several other questions in the chapter.
Revision tip. Pair every definition you encounter in this chapter with one named Indian example (e.g. Sundarbans for mangroves, Western Ghats for biodiversity hotspot, Cuscuta for a parasitic angiosperm). The Exemplar examiners reward example- backed answers over bare definitions.
Which of the following forest plants controls the light conditions at the ground?
(a) Lianas and climbers
(b) Shrubs
(c) Tall trees
(d) Herbs
Correct option: (c) Tall trees.
Concept used. A forest is vertically stratified into layers: emergent (the tallest trees breaking through), canopy (the continuous main tree cover), understorey (smaller trees and shrubs), and forest floor (herbs, mosses, leaf litter). Because sunlight enters from above, the canopy formed by the tallest trees filters and intercepts most of the incoming light. Only 1–5% of the surface radiation typically reaches the forest floor in a dense rainforest. Thus the tall trees control ground-level light.
- Identify the light-blocking layer. The plants closest to the sun (i.e. tallest) intercept the most.
- Quantify. A multi-layered rainforest canopy can absorb ≥ 95% of incident PAR (photosynthetically active radiation), leaving only diffuse light below.
- Eliminate options. Lianas climb onto tall trees; shrubs and herbs grow under them. None of these creates the primary ground shade.
Option (c): Tall trees.
Picture-first. Visualise standing on the floor of a tropical rainforest. The dimness around you is created by the green roof overhead - that roof is built by tall trees (30–50 m). Shrubs and herbs sit inside that shade; they don't make it.
- The plant that controls a resource is the plant intercepting it first. For light entering from above, that means the tallest layer.
- Lianas, shrubs and herbs all live in the shadow cast by the tall trees. They respond to the light regime; they do not set it.
- Hence option (c).
Option (c).
What will happen to a well growing herbaceous plant in the forest if it is transplanted outside the forest in a park?
(a) It will grow normally
(b) It will grow well because it is planted in the same locality
(c) It may not survive because of change in its micro climate
(d) It grows very well because the plant gets more sunlight
Correct option: (c) It may not survive because of change in its micro climate.
Concept used. The microclimate is the very local set of conditions (light intensity, temperature, humidity, soil moisture, soil pH, mycorrhizal partners) experienced by a plant within a few metres of its rooting site. A forest-floor herb is adapted to dim, humid, cool, mycorrhiza-rich shade. Moving it to a park exposes it suddenly to full sunlight, low humidity, higher temperature and different soil microflora. Without time to acclimate (or genetic plasticity), it is likely to wilt and die.
- Compare conditions. Forest floor: ∼ 1–5% PAR, 80– 95% relative humidity, 5–10 C cooler in summer than open ground, soil rich in symbiotic fungi. Park: full 100% PAR, 40–60% humidity, hotter, often compacted soil with reduced mycorrhiza.
- Predict the response. A shade-loving sciophyte suddenly thrust into full sun suffers photo-inhibition, scorch and water stress.
- Eliminate distractors. (a), (b) and (d) all assume the plant will be fine; ecology says otherwise. Same locality ≠ same microclimate.
Option (c): It may not survive because of change in its microclimate.
Strategic angle. The trap option here is (b) - ``same locality''. Locality (the patch of city the plant is in) is not the same as microclimate (the few cubic metres immediately around the plant). Two spots 20 m apart in the same neighbourhood can have dramatically different microclimates.
- Microclimate has four axes: light, temperature, humidity, soil. Move a plant and you usually change at least three of them.
- Forest herbs are sciophytes; parks are sun-baked. The light axis alone is fatal.
- Hence option (c) - survival is uncertain because the microclimate has changed, even though the geographic locality hasn't.
Option (c).
Connection to wider chapter. The point this question makes is reinforced elsewhere in the chapter: the same prefix and sign- table logic recurs in the MCQ block, the SA block on inter-specific interactions, and the LA discussion of population growth. Building this vocabulary once and reapplying it across question types is the fastest way to clear an Exemplar chapter at speed.
Practice cue. If a similar question appears in the board paper or NEET, restate the definition in one sentence, anchor it with one named Indian-context example, then commit to the option. Avoid second-guessing once the prefix or sign-table has been decoded - the chapter is designed so that a single decoding step selects the answer.
If a population of 50 Paramoecium present in a pool increases to 150 after an hour, what would be the growth rate of population?
(a) 50 per hour
(b) 200 per hour
(c) 5 per hour
(d) 100 per hour
Correct option: (d) 100 per hour.
Concept used. Absolute population growth rate is the change in number of individuals per unit time: Growth rate = Δ NΔ t = Nt - N0t. Here Δ N is the change in population, N0 the initial population, Nt the population after time t. The unit is ``individuals per unit time''. Do not confuse this with per capita (per individual) growth rate, which is asked separately in Q11.
- Identify the data. N0 = 50, Nt = 150, t = 1 hour.
- Compute the change in population: Δ N = Nt - N0 = 150 - 50 = 100.
- Apply the formula: Δ NΔ t = 1001 h = 100 individuals per hour.
- Cross-check against options. (a) 50/h would be half the change. (b) 200/h is the new total mis-read as a rate. (c) 5/h is off by a factor of 20. Only (d) matches.
Option (d): 100 individuals per hour.
Quick reading. Two-word recipe: change-over-time. Subtract start from end, divide by elapsed time - done.
- Δ N = 150 - 50 = 100 paramoecia.
- Δ t = 1 hour.
- Rate = Δ N / Δ t = 100/h.
Why this matters. Always check whether the question asks for absolute rate (individuals/time) or per-capita rate (rate/N0). Q10 wants absolute; Q11 wants per-capita on the same data - they have different answers.
Option (d) - 100 paramoecia per hour.
Cross-reference within the chapter. The principle invoked here is also used in the long-answer questions on community interactions and on growth curves. Recognising the same idea recycled across question types saves time on the Exemplar paper.
Take-away for revision. Note the named example used above in your formula sheet under ``Organisms and Populations''. The chapter's MCQs, VSAs and SAs repeatedly draw from a small canonical list of Indian-context examples - committing those to memory pays back across every section.
What would be the per cent growth or birth rate per individual per hour for the same population mentioned in the previous question (Question 10)?
(a) 100
(b) 200
(c) 50
(d) 150
Correct option: (b) 200.
Concept used. Per-capita (per individual) growth rate is the absolute growth rate divided by the starting population, then multiplied by 100 to express it as a percentage: b (or r) = 1N0· Δ NΔ t× 100 %. For a single time step, it answers: ``On average, how many new individuals were produced per existing individual per unit time, in %?'' This is the symbol r in the exponential growth equation dN/dt = rN.
- Identify data from Q10. N0 = 50, Δ N = 100, Δ t = 1 h.
- Compute the absolute per-capita rate (a decimal): 1N0Δ NΔ t = 150× 1001 = 10050 = 2.0 per individual per hour.
- Convert to per cent by multiplying by 100: 2.0 × 100 % = 200 % per hour.
- Cross-check. Each individual on average produced 2 extra paramoecia in one hour, i.e. a 200 % growth per individual per hour.
Option (b): 200 % per individual per hour.
Quick reading. Take the Q10 answer of 100 new individuals/hour and ask: ``per existing individual?'' Divide by N0 = 50 to get 2.0 per individual per hour. Multiply by 100 to express as a percentage = 200 %.
- Absolute rate (from Q10) = 100/h.
- Per-capita decimal: 100/50 = 2.0.
- Per cent: 2.0 × 100 = 200 %.
Why this matters. Per-capita rate r is the foundation of both exponential (dN/dt = rN) and logistic (dN/dt = rN(K-N)/K) models. Internalising the calculation makes those equations concrete.
Option (b) - 200 % per individual per hour.
Where this fits in the chapter map. This idea sits at the intersection of the ``abiotic factors → organismic responses'' and ``population attributes → growth models'' threads. The sign-table for interactions, the four response modes (regulate, conform, migrate, suspend) and the two growth-curve shapes (J and S) are the chapter's three pillars; every Exemplar question is a variation on one of them.
Speed tactic. When a similar Exemplar question appears, identify which pillar it belongs to first - that immediately narrows the vocabulary and the canonical example set you need to draw on. The actual answer then falls out in a single line of reasoning.
A population has more young individuals compared to the older individuals. What would be the status of the population after some years?
(a) It will decline
(b) It will stabilise
(c) It will increase
(d) It will first decline and then stabilise
Correct option: (c) It will increase.
Concept used. An age pyramid groups a population into three age classes: pre-reproductive (young), reproductive (middle), post-reproductive (old). The shape predicts the future:
- Broad base (more young), narrow top ⇒ expanding (triangular pyramid).
- Roughly equal bands ⇒ stable (bell-shaped).
- Narrow base, broad top ⇒ declining (urn-shaped).
- Diagnose the pyramid: more young ⇒ broad base ⇒ expanding pyramid.
- Predict trajectory: as the broad young cohort enters the reproductive age over the next 10–20 years, births will exceed deaths.
- Therefore the population will increase, not decline or stabilise.
Option (c): It will increase.
Picture-first. Draw the three pyramids in your head. Triangle (broad bottom) → growing. Bell (equal middle) → stable. Inverted urn (narrow bottom) → shrinking. The question states ``more young'' - that is the triangle.
- Triangle shape = expanding population (India 2001 census is the standard example).
- Future birthrate > future deathrate as the broad cohort matures.
- Net increase ⇒ option (c).
Option (c).
Linking to the rest of the syllabus. The same logic applies in Ecosystem (Chapter 12 in the 2026-27 syllabus) where energy flow and nutrient cycling depend on the species-level interactions discussed here, and in Biodiversity & Conservation (Chapter 13) where the conservation of mutualisms and pollinators is a recurring theme.
Recommended practice. Re-read the chapter table of positive interactions and run through one named Indian-context example for each. The Exemplar deliberately tests examples (not just definitions), so a handful of well-chosen examples per category is the most efficient revision strategy.
What parameters are used for tiger census in our country's national parks and sanctuaries?
(a) Pug marks only
(b) Pug marks and faecal pellets
(c) Faecal pellets only
(d) Actual head counts
Correct option: (b) Pug marks and faecal pellets.
Concept used. For elusive forest predators that are difficult to count directly, indirect-evidence censuses are used. Tigers leave two reliable signs in the field: pug marks (footprint imprints on soft soil, each tiger's pattern is as individual as a fingerprint) and faecal pellets called scats (size, contents and location reveal identity, diet and territory). In Indian tiger reserves, the All India Tiger Estimation combines pug-mark plaster casts plus scat analysis with camera trapping for the most accurate count.
- Eliminate (d). Direct head counts of a shy, nocturnal, highly territorial carnivore are infeasible in dense forest.
- Eliminate (a) and (c). Each is only one cue; combining both gives much better accuracy and identifies individuals.
- Confirm with practice: Project Tiger uses pug marks + scats + camera traps (also DNA from scat). The textbook answer is the first two - option (b).
Option (b): Pug marks and faecal pellets.
Strategic angle. For elusive species, censuses combine spoor (footprints/marks) and scats (droppings). Either alone undercounts; together they identify individuals reliably.
- Pug marks uniquely fingerprint each tiger.
- Scats add diet and territory data.
- Combined approach is more accurate than either single cue, and head-counts are impossible in dense forest.
Option (b).
Why the chapter keeps returning to this idea. The Exemplar is structured so that each MCQ, VSA, SA and LA tests the same small set of core ideas at increasing depth. This question is one such variant; mastering the underlying principle once unlocks several other questions in the chapter.
Revision tip. Pair every definition you encounter in this chapter with one named Indian example (e.g. Sundarbans for mangroves, Western Ghats for biodiversity hotspot, Cuscuta for a parasitic angiosperm). The Exemplar examiners reward example- backed answers over bare definitions.
Which of the following would necessarily decrease the density of a population in a given habitat?
(a) Natality > mortality
(b) Immigration > emigration
(c) Mortality and emigration
(d) Natality and immigration
Correct option: (c) Mortality and emigration.
Concept used. Population density N at the next time step is determined by four flows: Nt+1 = Nt + B + I - D - E, where B = births (natality), I = immigration in, D = deaths (mortality), E = emigration out. The first two add individuals; the last two remove them. To necessarily (i.e. always) reduce density, you need processes that only subtract from N - that is, both D and E together.
- Test each option against Nt+1 = Nt + B + I - D - E.
- (a) Natality > mortality gives B - D > 0, so density increases. Wrong sign.
- (b) Immigration > emigration gives I - E > 0, so density again increases. Wrong sign.
- (d) Natality and immigration are both additive - they increase density.
- (c) Mortality D and emigration E both subtract from N. Whatever the absolute numbers, both terms enter with a minus sign, so density falls. That is the only option that necessarily decreases density.
Option (c): Mortality and emigration (both subtract from N).
Strategic angle. Translate the four words to algebra: +B, +I, -D, -E. The question asks ``which always decreases?'' Pick the option that contains only minus terms.
- B and I have plus signs.
- D and E have minus signs.
- Only option (c) lists the two minus terms.
Option (c).
Connection to wider chapter. The point this question makes is reinforced elsewhere in the chapter: the same prefix and sign- table logic recurs in the MCQ block, the SA block on inter-specific interactions, and the LA discussion of population growth. Building this vocabulary once and reapplying it across question types is the fastest way to clear an Exemplar chapter at speed.
Practice cue. If a similar question appears in the board paper or NEET, restate the definition in one sentence, anchor it with one named Indian-context example, then commit to the option. Avoid second-guessing once the prefix or sign-table has been decoded - the chapter is designed so that a single decoding step selects the answer.
Cross-reference within the chapter. The principle invoked here is also used in the long-answer questions on community interactions and on growth curves. Recognising the same idea recycled across question types saves time on the Exemplar paper.
Take-away for revision. Note the named example used above in your formula sheet under ``Organisms and Populations''. The chapter's MCQs, VSAs and SAs repeatedly draw from a small canonical list of Indian-context examples - committing those to memory pays back across every section.
A protozoan reproduces by binary fission. What will be the number of protozoans in its population after six generations?
(a) 128
(b) 24
(c) 64
(d) 32
Correct option: (c) 64.
Concept used. Binary fission doubles the cell count each generation: 1 cell → 2 cells → 4 cells → The general formula starting from a single founder is Nn = N0 · 2n, where N0 is the starting number, Nn the count after n generations and 2n the doubling factor. With N0 = 1, the count after n generations is simply 2n.
- Set N0 = 1 and n = 6.
- Substitute: N6 = 1 · 26.
- Compute the power: 26 = 2× 2× 2× 2× 2× 2 = 4× 4× 4 = 64.
- Cross-check options. (a) 128 = 27 (seven generations), too many. (d) 32 = 25 (five generations), too few. (b) 24 does not match any 2n. Only (c) 64 matches 26.
Option (c): 26 = 64 protozoans.
Quick reading. Six doublings ⇒ 26 = 64. Done.
- Generation 1: 2 cells. Generation 2: 4. Generation 3: 8. Generation 4: 16. Generation 5: 32. Generation 6: 64.
- This sequence is 2n powers of 2.
Why this matters. Doubling is the fastest natural growth mode. In ideal conditions, just 20 generations turns 1 cell into over a million (220≈ 106). This is why bacterial contamination scales explosively.
Option (c) - 26 = 64.
Where this fits in the chapter map. This idea sits at the intersection of the ``abiotic factors → organismic responses'' and ``population attributes → growth models'' threads. The sign-table for interactions, the four response modes (regulate, conform, migrate, suspend) and the two growth-curve shapes (J and S) are the chapter's three pillars; every Exemplar question is a variation on one of them.
Speed tactic. When a similar Exemplar question appears, identify which pillar it belongs to first - that immediately narrows the vocabulary and the canonical example set you need to draw on. The actual answer then falls out in a single line of reasoning.
In 2005, for each of the 14 million people present in a country, 0.028 were born and 0.008 died during the year. Using exponential equation, the number of people present in 2015 is predicted as:
(a) 25 millions
(b) 17 millions
(c) 20 millions
(d) 18 millions
Correct option: (b) 17 millions.
Concept used. The continuous exponential growth equation predicts population size after time t as Nt = N0 ert, where N0 is the starting size, r = b - d is the per-capita intrinsic rate (births minus deaths per individual per year) and t is the elapsed time in years. The constant e ≈ 2.71828.
- Identify the data. N0 = 14× 106 in year 2005; per-capita birth b = 0.028/yr; per-capita death d = 0.008/yr; t = 2015 - 2005 = 10 yr.
- Compute the intrinsic rate: r = b - d = 0.028 - 0.008 = 0.020 yr-1.
- Compute the exponent: rt = 0.020 × 10 = 0.20.
- Compute the growth factor: ert = e0.20. Using the Taylor series or a table, e0.20≈ 1.2214.
- Compute Nt: N2015 = 14× 106 × 1.2214 ≈ 17.10× 10⁶ ≈ 17 millions.
- Match to options. (a) 25 millions would need r≈ 0.058. (c) 20 millions would need r≈ 0.036. (d) 18 is close but slightly above the exact value. The textbook-rounded answer is (b) 17 millions.
Option (b): ≈ 17 million people in 2015.
Strategic angle. Three-step recipe: compute r, compute rt, multiply N0 by ert.
- r = 0.028 - 0.008 = 0.02/yr.
- rt = 0.02 × 10 = 0.2.
- e0.2≈ 1.22, so N2015≈ 14 × 1.22 ≈ 17.1 million.
Why this matters. The same template handles every population forecasting MCQ: ``in T years at rate r, the new size is N0 erT.''
Option (b) - ≈ 17 million.
Linking to the rest of the syllabus. The same logic applies in Ecosystem (Chapter 12 in the 2026-27 syllabus) where energy flow and nutrient cycling depend on the species-level interactions discussed here, and in Biodiversity & Conservation (Chapter 13) where the conservation of mutualisms and pollinators is a recurring theme.
Recommended practice. Re-read the chapter table of positive interactions and run through one named Indian-context example for each. The Exemplar deliberately tests examples (not just definitions), so a handful of well-chosen examples per category is the most efficient revision strategy.
Why the chapter keeps returning to this idea. The Exemplar is structured so that each MCQ, VSA, SA and LA tests the same small set of core ideas at increasing depth. This question is one such variant; mastering the underlying principle once unlocks several other questions in the chapter.
Revision tip. Pair every definition you encounter in this chapter with one named Indian example (e.g. Sundarbans for mangroves, Western Ghats for biodiversity hotspot, Cuscuta for a parasitic angiosperm). The Exemplar examiners reward example- backed answers over bare definitions.
Amensalism is an association between two species where:
(a) one species is harmed and other is benefitted
(b) one species is harmed and other is unaffected
(c) one species is benefitted and other is unaffected
(d) both the species are harmed.
Correct option: (b) One species is harmed and the other is unaffected.
Concept used. The textbook classifies inter-specific interactions by the sign of the effect on each partner:
Interaction & Sp. A & Sp. B & Example
Mutualism & + & + & Lichen, mycorrhiza
Commensalism & + & 0 & Cattle egret + cattle
Predation & + & - & Lion + deer
Parasitism & + & - & Tapeworm + human
Competition & - & - & Two grasses in a plot
Amensalism& - & 0 & Penicillium + bacteria
tabular
- Decode. ``A-mensalism'' literally negates ``commensalism''; in commensalism one benefits (+/0), so in amensalism one is harmed (-/0).
- Match to options. Option (b) ``one harmed, other unaffected'' is exactly -/0.
- Eliminate others. (a) -/+ is parasitism or predation. (c) +/0 is commensalism. (d) -/- is competition.
Option (b): One harmed, the other unaffected.
Quick reading. Build a sign table (+, 0, -) for each species and match. Amensalism = (-, 0).
- One species suffers (sign -), the other is indifferent (sign 0).
- Classic example: Penicillium secretes penicillin that kills nearby bacteria, while gaining nothing measurable itself.
- Only option (b) matches the -/0 signature.
Option (b).
Connection to wider chapter. The point this question makes is reinforced elsewhere in the chapter: the same prefix and sign- table logic recurs in the MCQ block, the SA block on inter-specific interactions, and the LA discussion of population growth. Building this vocabulary once and reapplying it across question types is the fastest way to clear an Exemplar chapter at speed.
Practice cue. If a similar question appears in the board paper or NEET, restate the definition in one sentence, anchor it with one named Indian-context example, then commit to the option. Avoid second-guessing once the prefix or sign-table has been decoded - the chapter is designed so that a single decoding step selects the answer.
Lichens are association of:
(a) bacteria and fungus
(b) alga and bacterium
(c) fungus and alga
(d) fungus and virus
Correct option: (c) Fungus and alga.
Concept used. A lichen is a textbook example of obligate mutualism: the fungal partner (the mycobiont, usually an ascomycete) provides the thallus structure, attachment to rock or bark, and absorbs minerals and water; the algal partner (the phycobiont, a green alga or cyanobacterium) provides photosynthate (sugars). Neither partner can colonise bare rock on its own. Lichens are sensitive bio-indicators of air pollution because SO2 kills the alga.
- Identify the two organisms in a lichen. By definition: a fungus and a photosynthetic partner (alga or cyanobacterium).
- Match to options. (a) bacterium + fungus and (b) alga + bacterium are wrong. (d) virus is not a free-living partner. Only (c) fungus + alga matches.
- Confirm with role. Fungus = mycobiont (structure, water uptake); alga = phycobiont (food).
Option (c): Fungus + alga.
Picture-first. Picture a thin grey crust on a tree trunk: that crust is a fungus wrapped tightly around microscopic algae. The fungus offers a home; the algae cook food. Both win.
- Fungus + alga is the canonical pairing.
- Each can survive separately only in lab culture - in nature the partnership is obligate.
- Hence option (c).
Option (c).
Cross-reference within the chapter. The principle invoked here is also used in the long-answer questions on community interactions and on growth curves. Recognising the same idea recycled across question types saves time on the Exemplar paper.
Take-away for revision. Note the named example used above in your formula sheet under ``Organisms and Populations''. The chapter's MCQs, VSAs and SAs repeatedly draw from a small canonical list of Indian-context examples - committing those to memory pays back across every section.
Which of the following is a partial root parasite?
(a) Sandal wood
(b) Mistletoe
(c) Orobanche
(d) Ganoderma
Correct option: (a) Sandalwood.
Concept used. Plant parasitism is classified by how much the parasite still photosynthesises and where it attaches:
- Partial root parasite: green leaves, makes own carbohydrate, but its roots draw water + minerals from a host root via haustoria. Example: Santalum album (Sandalwood).
- Total root parasite: no chlorophyll, takes everything from host root. Example: Orobanche, Rafflesia.
- Partial stem parasite: green, draws from host stem. Example: Viscum (Mistletoe).
- Saprotroph: Ganoderma is a wood-decay fungus, not a plant parasite at all (and certainly not a root parasite).
- Eliminate (c) Orobanche - total root parasite (no chlorophyll, fully dependent).
- Eliminate (b) Mistletoe - partial stem parasite, attaches to branches.
- Eliminate (d) Ganoderma - saprophytic fungus.
- Only (a) Sandalwood is a partial root parasite: green canopy, but feeds on host-root water and salts via haustoria on its own roots.
Option (a): Sandalwood.
Structural observation. Two axes split this MCQ: (i) partial vs total, (ii) root vs stem. Sandalwood is the unique entry that is both partial and root-attached.
- Mistletoe = partial stem.
- Orobanche = total root.
- Ganoderma = fungus, not parasite.
- Sandalwood = partial root ⇒ option (a).
Option (a).
Where this fits in the chapter map. This idea sits at the intersection of the ``abiotic factors → organismic responses'' and ``population attributes → growth models'' threads. The sign-table for interactions, the four response modes (regulate, conform, migrate, suspend) and the two growth-curve shapes (J and S) are the chapter's three pillars; every Exemplar question is a variation on one of them.
Speed tactic. When a similar Exemplar question appears, identify which pillar it belongs to first - that immediately narrows the vocabulary and the canonical example set you need to draw on. The actual answer then falls out in a single line of reasoning.
Which one of the following organisms reproduces sexually only once in its life time?
(a) Banana
(b) Mango
(c) Tomato
(d) Eucalyptus
Correct option: (a) Banana.
Concept used. Plants are classified by their reproductive strategy across a lifetime: semelparous (also called monocarpic) organisms reproduce sexually only once, then die or become vegetative; iteroparous (polycarpic) organisms reproduce multiple times during their life. The textbook examples of semelparity include bamboo (flowers once after 50–100 years), agave, and the cultivated banana (Musa) - after the pseudostem produces its single inflorescence and fruit, that pseudostem dies; the plant continues only via lateral suckers (asexual).
- Identify the life history of each option.
- Banana: pseudostem flowers and fruits once, then dies (sexual reproduction is one-shot).
- Mango: large tree, flowers and fruits every year for decades. Iteroparous.
- Tomato: annual herb, flowers continuously through one season - iteroparous within that season.
- Eucalyptus: tree that flowers many times. Iteroparous.
- The unique semelparous option is (a) Banana.
- Confirm: bamboo is a more dramatic example (decades-long wait, then mass flowering and death), but it is not in the options.
Option (a): Banana.
Strategic angle. The hidden vocab is semelparous vs iteroparous. Search the options for the one plant whose pseudostem dies after a single fruiting cycle.
- Mango, tomato and eucalyptus all fruit repeatedly during their lives.
- Banana's pseudostem fruits once and dies (vegetative spread via suckers continues, but sexual reproduction occurs only once).
- Hence option (a).
Why this matters. Semelparity is an extreme energy-allocation strategy: invest everything in one reproductive event. Bamboo even synchronises this across a population to satiate seed predators.
Option (a) - Banana.
Linking to the rest of the syllabus. The same logic applies in Ecosystem (Chapter 12 in the 2026-27 syllabus) where energy flow and nutrient cycling depend on the species-level interactions discussed here, and in Biodiversity & Conservation (Chapter 13) where the conservation of mutualisms and pollinators is a recurring theme.
Recommended practice. Re-read the chapter table of positive interactions and run through one named Indian-context example for each. The Exemplar deliberately tests examples (not just definitions), so a handful of well-chosen examples per category is the most efficient revision strategy.
Very Short Answer Type Questions
Species that can tolerate narrow range of temperature are called 2cm0.4pt.
Concept used. Organisms are classified by their thermal tolerance range. Stenothermal species tolerate only a narrow range of temperatures (Greek stenos = narrow); eurythermal species tolerate a wide range (Greek eurys = wide). The same prefix logic gives stenohaline/euryhaline for salinity.
- Match prefix to meaning: steno- = narrow.
- Apply to temperature: narrow temperature range ⇒ stenothermal.
- Example: most coral species - they bleach above 30 C and die below 18 C.
Stenothermal species.
Quick reading. Greek prefix steno- = narrow. Couple it to -thermal (temperature) and the answer writes itself: stenothermal.
- Steno- + thermal ⇒ narrow temperature tolerance.
- Pair: eury- + thermal ⇒ wide temperature tolerance (see Q2).
Stenothermal.
Why the chapter keeps returning to this idea. The Exemplar is structured so that each MCQ, VSA, SA and LA tests the same small set of core ideas at increasing depth. This question is one such variant; mastering the underlying principle once unlocks several other questions in the chapter.
Revision tip. Pair every definition you encounter in this chapter with one named Indian example (e.g. Sundarbans for mangroves, Western Ghats for biodiversity hotspot, Cuscuta for a parasitic angiosperm). The Exemplar examiners reward example- backed answers over bare definitions.
What are Eurythermic species?
Concept used. Eurythermic (or eurythermal) species are organisms that tolerate a wide range of temperatures. The prefix eury- (Greek for ``wide'') is the opposite of steno- (narrow, see VSA Q1).
- Decode eury- = wide.
- Apply to temperature: wide temperature range ⇒ the species can survive across many climatic settings.
- Examples: humans, cockroaches, common Indian sparrow (Passer domesticus) - found from cold Himalayan foothills to hot plains.
Species that tolerate a wide range of temperatures, e.g. humans, cockroach.
Strategic angle. Whenever VSA asks for ``eurythermic'', ``eurythermal'', ``euryhaline'', the answer is built by replacing the suffix word with its narrow-vs-wide content.
- Eurythermic = wide temperature tolerance.
- Wide tolerance lets the species occupy multiple biomes.
Wide-temperature-range tolerant species.
Connection to wider chapter. The point this question makes is reinforced elsewhere in the chapter: the same prefix and sign- table logic recurs in the MCQ block, the SA block on inter-specific interactions, and the LA discussion of population growth. Building this vocabulary once and reapplying it across question types is the fastest way to clear an Exemplar chapter at speed.
Practice cue. If a similar question appears in the board paper or NEET, restate the definition in one sentence, anchor it with one named Indian-context example, then commit to the option. Avoid second-guessing once the prefix or sign-table has been decoded - the chapter is designed so that a single decoding step selects the answer.
Species that can tolerate wide range of salinity are called 2cm0.4pt.
Concept used. Salinity tolerance uses the same prefixes: euryhaline = wide salinity range, stenohaline = narrow salinity range. The suffix -haline comes from Greek halinos (of salt).
- Decode eury- = wide, -haline = salt.
- Wide salinity tolerance ⇒ euryhaline.
- Examples: salmon (migrates between river and sea), Tilapia, many estuarine crustaceans.
Euryhaline species.
Quick reading. Pair the prefix with the salt-suffix: eury- + -haline = euryhaline.
- Wide salinity = euryhaline.
- Mirror term: stenohaline = narrow salinity (next question).
Euryhaline.
Cross-reference within the chapter. The principle invoked here is also used in the long-answer questions on community interactions and on growth curves. Recognising the same idea recycled across question types saves time on the Exemplar paper.
Take-away for revision. Note the named example used above in your formula sheet under ``Organisms and Populations''. The chapter's MCQs, VSAs and SAs repeatedly draw from a small canonical list of Indian-context examples - committing those to memory pays back across every section.
Define stenohaline species.
Concept used. Stenohaline organisms tolerate only a narrow range of salinity. They are typically restricted to one of freshwater or marine environments and cannot cross the boundary. Greek stenos (narrow) + halinos (salt).
- Apply the steno- prefix to salinity: narrow salt tolerance.
- Examples: most freshwater fish die in seawater; most marine fish die in freshwater because they cannot regulate osmotic balance.
- Contrast with euryhaline species (VSA Q3) which cross freely.
Species tolerating only a narrow range of salinity (e.g. goldfish in fresh water).
Strategic angle. Use VSA Q3 in reverse: steno- + -haline = narrow salt tolerance.
- Most fresh-water fish and most strictly marine fish are stenohaline.
- Their gill ion-pumps are tuned to one osmotic regime; a change kills them.
Narrow-salinity-range tolerant species.
Where this fits in the chapter map. This idea sits at the intersection of the ``abiotic factors → organismic responses'' and ``population attributes → growth models'' threads. The sign-table for interactions, the four response modes (regulate, conform, migrate, suspend) and the two growth-curve shapes (J and S) are the chapter's three pillars; every Exemplar question is a variation on one of them.
Speed tactic. When a similar Exemplar question appears, identify which pillar it belongs to first - that immediately narrows the vocabulary and the canonical example set you need to draw on. The actual answer then falls out in a single line of reasoning.
What is the interaction between two species called?
Concept used. Any biological interaction between members of two different species is called an inter-specific interaction (or simply interspecific interaction). It is distinguished from intra-specific interactions, which occur between members of the same species (e.g. competition between two lions of the same pride for a kill).
- Decode the prefixes: inter- = between, intra- = within.
- Two different species ⇒ inter-specific interaction.
- The textbook lists six classical types: mutualism, commensalism, predation, parasitism, competition and amensalism (table in MCQ Q17 solution).
Inter-specific (interspecific) interaction.
Quick reading. Two species → inter-; one species → intra-.
- ``Inter'' = between (two parties).
- Any interaction across the species boundary is interspecific.
Interspecific interaction.
Linking to the rest of the syllabus. The same logic applies in Ecosystem (Chapter 12 in the 2026-27 syllabus) where energy flow and nutrient cycling depend on the species-level interactions discussed here, and in Biodiversity & Conservation (Chapter 13) where the conservation of mutualisms and pollinators is a recurring theme.
Recommended practice. Re-read the chapter table of positive interactions and run through one named Indian-context example for each. The Exemplar deliberately tests examples (not just definitions), so a handful of well-chosen examples per category is the most efficient revision strategy.
What is commensalism?
Concept used. Commensalism is an inter-specific interaction in which one species benefits and the other is neither helped nor harmed (sign signature +/0). The benefactor is indifferent; the beneficiary gets food, shelter, transport or protection.
- Sign table entry: (+, 0).
- Beneficiary: gains something tangible (e.g. a perch, leftover food, dispersal).
- Indifferent partner: incurs no measurable cost or benefit.
- Examples: cattle egret feeds on insects flushed by grazing cattle (egret +, cattle 0); barnacles on a whale.
An interaction where one species is benefitted and the other is unaffected.
Strategic angle. Read the word: com- (together) + mensa (Latin for table) - ``sharing the table''. One eats from the table the other set, without disturbing the meal.
- One species: gains.
- Other species: indifferent.
- Example: orchids growing on mango trees (orchid gets a perch with no harm to the mango).
One benefits, the other is unaffected - sign (+,0).
Why the chapter keeps returning to this idea. The Exemplar is structured so that each MCQ, VSA, SA and LA tests the same small set of core ideas at increasing depth. This question is one such variant; mastering the underlying principle once unlocks several other questions in the chapter.
Revision tip. Pair every definition you encounter in this chapter with one named Indian example (e.g. Sundarbans for mangroves, Western Ghats for biodiversity hotspot, Cuscuta for a parasitic angiosperm). The Exemplar examiners reward example- backed answers over bare definitions.
Name the association in which one species produces poisonous substance or a change in environmental conditions that is harmful to another species.
Concept used. The interaction described is amensalism (-/0): one species releases a chemical or modifies the environment in a way that harms a second species, while itself gaining nothing measurable. A specific subset of amensalism is antibiosis, in which the harm is delivered by a metabolic secretion (an antibiotic or allelochemical).
- Match the description to the sign table: harm to one (sign -), no measurable effect on the producer (sign 0).
- The textbook label for (-,0) is amensalism; the chemical sub-mode is antibiosis.
- Examples: Penicillium secretes penicillin which kills nearby bacteria (the fungus gains nothing direct); the black walnut tree (Juglans) releases juglone, suppressing nearby plant growth.
Amensalism (specifically antibiosis when a chemical is involved).
Quick reading. ``Poisonous secretion harming another'' ⇒ amensalism with an antibiotic mechanism.
- Producer: not measurably benefited.
- Target: harmed.
- Sign table (-,0) is amensalism by definition.
Amensalism / antibiosis.
Connection to wider chapter. The point this question makes is reinforced elsewhere in the chapter: the same prefix and sign- table logic recurs in the MCQ block, the SA block on inter-specific interactions, and the LA discussion of population growth. Building this vocabulary once and reapplying it across question types is the fastest way to clear an Exemplar chapter at speed.
Practice cue. If a similar question appears in the board paper or NEET, restate the definition in one sentence, anchor it with one named Indian-context example, then commit to the option. Avoid second-guessing once the prefix or sign-table has been decoded - the chapter is designed so that a single decoding step selects the answer.
What is Mycorrhiza?
Concept used. Mycorrhiza (literally ``fungus-root'') is a mutualistic association between certain soil fungi and the roots of higher plants. The fungus envelops or penetrates the root cells, greatly expanding the absorptive surface for water and phosphorus; in return the plant supplies photosynthate (sugars) to the fungus. There are two main types: ectomycorrhiza (sheath outside the root, common with pine and oak) and endomycorrhiza or arbuscular mycorrhiza (penetrates root cortex cells, present in > 80% of plant species).
- Identify the partners: a fungus and the root of a vascular plant.
- Identify the exchange: fungus → minerals (especially P) and water; plant → sugars (mainly hexoses).
- Identify the sign: (+,+) ⇒ mutualism.
A mutualistic fungus–root association in which the fungus enhances mineral and water uptake while receiving sugars from the plant.
Strategic angle. Mycorrhiza is the textbook ``poster child'' for plant mutualism. Remember three exchanges: water, P, sugar.
- Plant root + soil fungus.
- Fungus expands the absorptive surface area (often 100× ).
- Plant pays back in fixed carbon (sugars).
Mutualistic fungus–root association.
Cross-reference within the chapter. The principle invoked here is also used in the long-answer questions on community interactions and on growth curves. Recognising the same idea recycled across question types saves time on the Exemplar paper.
Take-away for revision. Note the named example used above in your formula sheet under ``Organisms and Populations''. The chapter's MCQs, VSAs and SAs repeatedly draw from a small canonical list of Indian-context examples - committing those to memory pays back across every section.
Emergent land plants that can tolerate the salinities of the sea are called 2cm0.4pt.
Concept used. Halophytes are plants that can grow in saline soils or in salty water (Greek halos = salt, phyton = plant). Mangroves are the classic emergent halophytes along tropical coastlines, with specialised salt-secreting glands and pneumatophores (breathing roots).
- Sea-level salinity ≈ 30–35 ppt (see MCQ Q6). Tolerating that needs salt-handling adaptations.
- Plants with such adaptations are halophytes - Rhizophora, Avicennia, Sonneratia in Indian mangroves.
- These are the ``emergent'' halophytes the question asks for.
Halophytes (mangroves are the principal emergent halophytes).
Quick reading. Greek halo- (salt) + -phyte (plant). Salt-tolerant plant = halophyte.
- Sea-salinity tolerance + land-emergent habit = mangroves.
- Mangroves are the canonical halophyte answer.
Halophytes (mangroves).
Where this fits in the chapter map. This idea sits at the intersection of the ``abiotic factors → organismic responses'' and ``population attributes → growth models'' threads. The sign-table for interactions, the four response modes (regulate, conform, migrate, suspend) and the two growth-curve shapes (J and S) are the chapter's three pillars; every Exemplar question is a variation on one of them.
Speed tactic. When a similar Exemplar question appears, identify which pillar it belongs to first - that immediately narrows the vocabulary and the canonical example set you need to draw on. The actual answer then falls out in a single line of reasoning.
Why do high altitude areas have brighter sunlight and lower temperatures as compared to the plains?
Concept used. Two effects of altitude on light and temperature: (i) thinner atmosphere ⇒ less scattering and less ozone-UV absorption, so a higher fraction of solar radiation reaches the ground (especially UV and visible); (ii) thinner air also retains less heat - both the air column and ground radiate heat away faster, and the air pressure drops adiabatically with altitude (∼ 6.5 C drop per km, the environmental lapse rate).
- Brighter sunlight: less air mass between the Sun and the ground reduces Rayleigh scattering and atmospheric absorption. Hence higher direct-beam intensity.
- Lower temperature: lower atmospheric density and pressure ⇒ lower heat-storage capacity and faster radiative cooling. Adiabatic expansion of rising air parcels further drops their temperature.
- Combined effect: a Himalayan slope at 4000 m is sunnier but colder than the Indo-Gangetic plain at sea level.
Thinner atmosphere lets more sunlight through (brighter) but stores less heat (colder).
Picture-first. The atmosphere is a thinning ``blanket''. At 4000 m the blanket is ∼ 60% as thick. Less blanket: more sun gets in (brighter), but less heat is held (colder).
- Atmospheric column shrinks with altitude ⇒ less scattering, more direct sunlight.
- Air density drops ⇒ less heat retention, lower ambient temperature.
- Lapse rate ≈ 6.5 C/km.
Thinner atmosphere ⇒ brighter sun + colder air.
Linking to the rest of the syllabus. The same logic applies in Ecosystem (Chapter 12 in the 2026-27 syllabus) where energy flow and nutrient cycling depend on the species-level interactions discussed here, and in Biodiversity & Conservation (Chapter 13) where the conservation of mutualisms and pollinators is a recurring theme.
Recommended practice. Re-read the chapter table of positive interactions and run through one named Indian-context example for each. The Exemplar deliberately tests examples (not just definitions), so a handful of well-chosen examples per category is the most efficient revision strategy.
What is homeostasis?
Concept used. Homeostasis is the maintenance of a constant internal environment (temperature, pH, osmotic balance, glucose level) despite a varying external environment. Greek homoios (same) + stasis (standing). It is achieved by regulatory mechanisms: feedback loops involving sensors (receptors), control centres (often the brain) and effectors (muscles, glands).
- Identify the goal: hold internal variables within narrow limits.
- Identify the mechanism: negative-feedback loops sense deviations and trigger counter-responses (e.g. sweating when body temperature rises).
- Classify organisms: regulators (homeostatic, e.g. mammals, birds), conformers (their internal state tracks the environment, e.g. most invertebrates and fish).
The maintenance of constant internal conditions in the face of a varying external environment.
Strategic angle. Read the word: homeo (same) + stasis (standing). The body ``stands the same'' despite external change.
- Regulators do it actively (cost energy): mammals, birds.
- Conformers don't; their internal state shifts with the environment.
Active maintenance of a constant internal milieu.
Why the chapter keeps returning to this idea. The Exemplar is structured so that each MCQ, VSA, SA and LA tests the same small set of core ideas at increasing depth. This question is one such variant; mastering the underlying principle once unlocks several other questions in the chapter.
Revision tip. Pair every definition you encounter in this chapter with one named Indian example (e.g. Sundarbans for mangroves, Western Ghats for biodiversity hotspot, Cuscuta for a parasitic angiosperm). The Exemplar examiners reward example- backed answers over bare definitions.
Define aestivation.
Concept used. Aestivation (also spelled estivation) is a state of summer dormancy that animals or plants enter to survive periods of high temperature and water scarcity. Metabolism, heart rate and respiration drop sharply; the organism remains inactive in a burrow, mud cell or moist crevice until favourable conditions return. It is the summer counterpart of hibernation (winter dormancy).
- Identify the trigger: high temperature and/or drought.
- Identify the response: lowered metabolic rate, inactivity, often a moist refuge.
- Examples: snails seal their shells; lungfish encyst in mud; some frogs and Indian desert ground squirrels aestivate.
A summer dormancy with depressed metabolism, used to escape heat and drought.
Quick reading. Aestivation = summer hibernation. Same physiology (metabolic suppression), opposite season.
- Hot/dry trigger → metabolic shutdown → wait it out.
- Examples: snails, lungfish, some frogs.
Summer dormancy to survive heat and water scarcity.
Connection to wider chapter. The point this question makes is reinforced elsewhere in the chapter: the same prefix and sign- table logic recurs in the MCQ block, the SA block on inter-specific interactions, and the LA discussion of population growth. Building this vocabulary once and reapplying it across question types is the fastest way to clear an Exemplar chapter at speed.
Practice cue. If a similar question appears in the board paper or NEET, restate the definition in one sentence, anchor it with one named Indian-context example, then commit to the option. Avoid second-guessing once the prefix or sign-table has been decoded - the chapter is designed so that a single decoding step selects the answer.
What is diapause and its significance?
Concept used. Diapause is a programmed developmental arrest, most common in insects but also seen in some crustaceans and zooplankton (notably Daphnia, the water flea). Triggered by environmental cues such as shortening day length, falling temperature or food shortage, diapause halts growth and reproduction at a specific life stage (egg, larva, pupa or adult). It allows the population to bridge an unfavourable season - winter cold, summer drought, predator surges - without dying out.
- Distinguish from hibernation/aestivation. Diapause is anticipatory (triggered by photoperiod before bad conditions arrive) and is a fixed life-stage halt, not a general metabolic slowdown.
- Identify the significance: synchronises population emergence, survives lethal seasons, can be obligatory (every generation) or facultative (only when cues warrant).
- Example: many temperate-zone insect eggs and Daphnia ephippia overwinter in diapause and hatch in spring.
An environmentally triggered halt in development; significance - it lets the species survive unfavourable seasons.
Quick reading. Diapause = anticipated developmental pause cued by day length. Survival strategy in seasonal climates.
- Trigger: shortening photoperiod, dropping temperature.
- Stage: any (egg, larva, pupa, adult).
- Outcome: bridge unfavourable season, resume in spring.
A cue-triggered developmental arrest that lets species bridge harsh seasons.
Cross-reference within the chapter. The principle invoked here is also used in the long-answer questions on community interactions and on growth curves. Recognising the same idea recycled across question types saves time on the Exemplar paper.
Take-away for revision. Note the named example used above in your formula sheet under ``Organisms and Populations''. The chapter's MCQs, VSAs and SAs repeatedly draw from a small canonical list of Indian-context examples - committing those to memory pays back across every section.
What would be the growth rate pattern, when the resources are unlimited?
Concept used. When resources (food, space, water, nutrients) are unlimited, populations grow by exponential growth following dN/dt = rN. Plotted against time, the curve is J-shaped - slow start, then runaway increase with no upper ceiling. The integrated form is Nt = N0 ert.
- Identify the model: unlimited resources ⇒ no carrying-capacity term, growth is pure rN.
- Identify the curve shape: continuous doubling produces a J-shape on a linear N vs t plot.
- Contrast with logistic (S-shape) which appears when resources are limited (see LA Q4).
Exponential (J-shaped) growth, dN/dt = rN.
Strategic angle. Unlimited resources ⇒ no ceiling ⇒ exponential J-curve. Limited resources ⇒ ceiling K ⇒ logistic S-curve. Two sentences capture both possibilities.
- Equation: dN/dt = rN.
- Solution: Nt = N0 ert, a J-shape.
Exponential (J-shaped) growth.
Where this fits in the chapter map. This idea sits at the intersection of the ``abiotic factors → organismic responses'' and ``population attributes → growth models'' threads. The sign-table for interactions, the four response modes (regulate, conform, migrate, suspend) and the two growth-curve shapes (J and S) are the chapter's three pillars; every Exemplar question is a variation on one of them.
Speed tactic. When a similar Exemplar question appears, identify which pillar it belongs to first - that immediately narrows the vocabulary and the canonical example set you need to draw on. The actual answer then falls out in a single line of reasoning.
What are the organisms that feed on plant sap and other plant parts called?
Concept used. Animals that eat plants are called phytophagous (Greek phyton = plant, phagein = to eat) or, more generally, herbivores. Sap-feeders are a sub-class of phytophages (e.g. aphids, leafhoppers, scale insects, plant bugs).
- Identify the prefix phyto- = plant.
- Identify the suffix -phagous = eating.
- Combined: plant-eating animals ⇒ phytophagous.
Phytophagous organisms (a sub-class of herbivores).
Quick reading. Phyto- (plant) + -phagous (eating). Aphids and grasshoppers are textbook examples.
- Sap-suckers: aphids, leafhoppers.
- Tissue-chewers: grasshoppers, caterpillars.
- Both are phytophagous.
Phytophagous.
Linking to the rest of the syllabus. The same logic applies in Ecosystem (Chapter 12 in the 2026-27 syllabus) where energy flow and nutrient cycling depend on the species-level interactions discussed here, and in Biodiversity & Conservation (Chapter 13) where the conservation of mutualisms and pollinators is a recurring theme.
Recommended practice. Re-read the chapter table of positive interactions and run through one named Indian-context example for each. The Exemplar deliberately tests examples (not just definitions), so a handful of well-chosen examples per category is the most efficient revision strategy.
What is high altitude sickness? Write its symptoms.
Concept used. High-altitude sickness (acute mountain sickness, AMS) is the physiological response of an unacclimatised lowland resident to the reduced partial pressure of oxygen at altitudes > 2400 m. Although the percentage of oxygen in air stays at 21%, the lower atmospheric pressure means fewer oxygen molecules reach the alveoli per breath, producing hypoxia. The body responds by hyperventilating and increasing heart rate; with time it boosts red-blood-cell production and capillary density (acclimatisation).
- State the cause: hypoxia from lower pO2 at altitude.
- List the symptoms:
- Nausea, vomiting and loss of appetite.
- Fatigue, weakness and dizziness.
- Headache.
- Sleeplessness; shortness of breath.
- Rapid heart rate (tachycardia).
- Recovery: descend, supplemental O2, time to acclimatise.
Hypoxia-driven illness at high altitude; symptoms include nausea, fatigue, headache, palpitations and sleeplessness.
Strategic angle. Cause = low oxygen partial pressure; symptoms = the body's hyperventilation/cardiac compensation gone wrong. List 4–5 named symptoms for full marks.
- Cause: pO2 falls with altitude even though % O2 is constant.
- Symptoms: nausea, fatigue, headache, palpitations, sleeplessness.
- Cure: descent, oxygen, gradual acclimatisation.
Hypoxic mountain illness with nausea, headache, fatigue and palpitations.
Why the chapter keeps returning to this idea. The Exemplar is structured so that each MCQ, VSA, SA and LA tests the same small set of core ideas at increasing depth. This question is one such variant; mastering the underlying principle once unlocks several other questions in the chapter.
Revision tip. Pair every definition you encounter in this chapter with one named Indian example (e.g. Sundarbans for mangroves, Western Ghats for biodiversity hotspot, Cuscuta for a parasitic angiosperm). The Exemplar examiners reward example- backed answers over bare definitions.
Give a suitable example for commensalism.
Concept used. Commensalism (recall VSA Q6) requires sign signature (+, 0): one species benefits, the other is unaffected. Two textbook examples for India-context answers:
- Cattle egret (Bubulcus ibis) follows grazing cattle and feeds on insects flushed out of the grass. The bird benefits (+); the cattle are indifferent (0).
- An epiphytic orchid growing on a mango tree branch. The orchid gets a sunlit perch (+); the mango is unaffected (0) so long as the orchid doesn't draw water or nutrients from the host.
- Pick one example.
- State which species benefits, which is unaffected.
Cattle egret feeding on insects flushed by grazing cattle.
Quick reading. Pick whichever pair you can describe in one line. Cattle egret + cattle is the easiest because the egret's benefit (insects) is obvious and the cattle clearly don't care.
- Beneficiary: cattle egret (gets food).
- Indifferent: cattle (no measurable cost or benefit).
Cattle egret + grazing cattle.
Connection to wider chapter. The point this question makes is reinforced elsewhere in the chapter: the same prefix and sign- table logic recurs in the MCQ block, the SA block on inter-specific interactions, and the LA discussion of population growth. Building this vocabulary once and reapplying it across question types is the fastest way to clear an Exemplar chapter at speed.
Practice cue. If a similar question appears in the board paper or NEET, restate the definition in one sentence, anchor it with one named Indian-context example, then commit to the option. Avoid second-guessing once the prefix or sign-table has been decoded - the chapter is designed so that a single decoding step selects the answer.
Define ectoparasite and endoparasite and give suitable examples.
Concept used. Parasites are classified by where they live on or in the host:
- Ectoparasite (Greek ektos = outside): lives on the host's body surface - skin, fur, scales, feathers. Examples: head louse (Pediculus humanus), human flea, ticks on cattle, copepod ectoparasites of marine fish.
- Endoparasite (endon = within): lives inside the host body - in the gut, liver, lung, blood. Examples: Ascaris (intestinal roundworm), tapeworm (Taenia), Plasmodium (malarial parasite in blood and liver).
- Decode prefix: ecto- = outside, endo- = inside.
- Apply to parasite location.
- Quote one named example for each.
Ectoparasite lives on the host surface (e.g. head louse); endoparasite lives inside the host (e.g. Ascaris).
Strategic angle. One-word distinction + one named example each is enough.
- Ecto = outside; head lice, ticks.
- Endo = inside; tapeworm, Plasmodium.
Ecto = surface (lice); Endo = internal (tapeworm).
Cross-reference within the chapter. The principle invoked here is also used in the long-answer questions on community interactions and on growth curves. Recognising the same idea recycled across question types saves time on the Exemplar paper.
Take-away for revision. Note the named example used above in your formula sheet under ``Organisms and Populations''. The chapter's MCQs, VSAs and SAs repeatedly draw from a small canonical list of Indian-context examples - committing those to memory pays back across every section.
What is brood parasitism? Explain with the help of an example.
Concept used. Brood parasitism is a reproductive strategy in which one bird species lays its eggs in the nest of another (host) species and lets the host raise the parasite's chicks as its own. The parasite saves the energy of nest-building and chick-care; the host loses fitness because its own chicks usually starve or are evicted by the larger, faster-growing parasite chick. The classic example is the cuckoo (Cuculus canorus, or the Asian Koel Eudynamys scolopaceus) laying eggs in the nest of a crow.
- Identify the actors: parasite bird (cuckoo/koel) and host bird (crow, warbler, dunnock, etc.).
- Describe the mechanism: cuckoo lays its egg in the host nest, often quickly while the host is away; the egg often mimics the host's egg colour and size; the parasitic chick hatches earlier and either ejects host eggs or out-competes host chicks for food.
- Identify the cost–benefit: parasite + (free childcare); host - (lost reproductive output). Hence brood parasitism is a form of parasitism, signature (+, -).
One species lays its eggs in another species' nest, e.g. cuckoo laying eggs in a crow's nest.
Picture-first. A cuckoo sneaks an egg into a crow's nest. The crow incubates and feeds the cuckoo chick, often at the cost of its own brood. That is brood parasitism in one sentence.
- Parasite saves: nest-building, incubation, chick-feeding.
- Host loses: its own chicks' survival.
- Egg-mimicry has co-evolved in many host–cuckoo systems.
Cuckoo–crow egg parasitism.
Where this fits in the chapter map. This idea sits at the intersection of the ``abiotic factors → organismic responses'' and ``population attributes → growth models'' threads. The sign-table for interactions, the four response modes (regulate, conform, migrate, suspend) and the two growth-curve shapes (J and S) are the chapter's three pillars; every Exemplar question is a variation on one of them.
Speed tactic. When a similar Exemplar question appears, identify which pillar it belongs to first - that immediately narrows the vocabulary and the canonical example set you need to draw on. The actual answer then falls out in a single line of reasoning.
Linking to the rest of the syllabus. The same logic applies in Ecosystem (Chapter 12 in the 2026-27 syllabus) where energy flow and nutrient cycling depend on the species-level interactions discussed here, and in Biodiversity & Conservation (Chapter 13) where the conservation of mutualisms and pollinators is a recurring theme.
Recommended practice. Re-read the chapter table of positive interactions and run through one named Indian-context example for each. The Exemplar deliberately tests examples (not just definitions), so a handful of well-chosen examples per category is the most efficient revision strategy.
Short Answer Type Questions
Why are coral reefs not found in the regions from West Bengal to Andhra Pradesh but are found in Tamil Nadu and on the east coast of India?
Concept used. Coral reefs are built by colonial cnidarians (Scleractinia) whose calcium-carbonate skeletons accumulate over centuries. Reef-building corals are stenohaline and stenothermal: they require salinity ≈ 30–35 ppt, water temperature > 20 C, and clear, sediment-free water (high light penetration is needed for their symbiotic algae, zooxanthellae). Any factor that lowers salinity, raises turbidity, or covers the substrate with mud breaks reef formation.
- The West Bengal–Andhra Pradesh coastline lies at the mouths of major rivers: the Hooghly–Ganga, Brahmaputra (deltaic outflow into the Sundarbans), Mahanadi, Godavari and Krishna. These rivers deliver huge sediment loads and dilute the coastal water with freshwater.
- Two reef-blocking effects result. (a) Salinity drops well below the 30–35 ppt range corals tolerate. (b) Turbidity rises sharply, cutting the light reaching the zooxanthellae and smothering polyps with silt.
- Tamil Nadu and the southern east coast (Gulf of Mannar, Palk Bay) receive far less river-borne sediment and dilution. Salinity stays in the marine range and water clarity supports reef growth, allowing the famous Gulf of Mannar coral reefs.
Heavy river freshwater + sediment from the Ganga–Brahmaputra–Mahanadi–Godavari–Krishna delta system lowers salinity and raises turbidity along Bengal–Andhra, blocking reef growth; Tamil Nadu's clearer, saltier waters allow it.
Strategic angle. Use the two-axis test: corals need high salinity and clear water. The Bengal–Andhra coast fails both because of giant river deltas; Tamil Nadu satisfies both because no comparable river dumps sediment there.
- River-dominated coast ⇒ low salinity + high turbidity ⇒ no reefs.
- River-poor coast (Gulf of Mannar) ⇒ marine salinity + clear water ⇒ reefs thrive.
Freshwater dilution and silt from delta rivers exclude reefs in WB–AP; clear marine water permits them in Tamil Nadu.
Why the chapter keeps returning to this idea. The Exemplar is structured so that each MCQ, VSA, SA and LA tests the same small set of core ideas at increasing depth. This question is one such variant; mastering the underlying principle once unlocks several other questions in the chapter.
Revision tip. Pair every definition you encounter in this chapter with one named Indian example (e.g. Sundarbans for mangroves, Western Ghats for biodiversity hotspot, Cuscuta for a parasitic angiosperm). The Exemplar examiners reward example- backed answers over bare definitions.
Connection to wider chapter. The point this question makes is reinforced elsewhere in the chapter: the same prefix and sign- table logic recurs in the MCQ block, the SA block on inter-specific interactions, and the LA discussion of population growth. Building this vocabulary once and reapplying it across question types is the fastest way to clear an Exemplar chapter at speed.
Practice cue. If a similar question appears in the board paper or NEET, restate the definition in one sentence, anchor it with one named Indian-context example, then commit to the option. Avoid second-guessing once the prefix or sign-table has been decoded - the chapter is designed so that a single decoding step selects the answer.
If a fresh water fish is placed in an aquarium containing sea water, will the fish be able to survive? Explain giving reasons.
Concept used. Body fluids of a freshwater fish are hypertonic to fresh water (higher salt concentration inside than outside), so the fish actively absorbs salts through its gills and excretes copious dilute urine. Seawater, in contrast, is hypertonic to the fish's body fluids (≈ 35 ppt vs ≈ 10 ppt). Placed in seawater, the osmotic gradient reverses: water rushes out of the fish's body by osmosis and salts diffuse in. The fish has no physiological machinery (no salt-excreting chloride cells, no concentrated urine) to reverse this - it is stenohaline.
- State the osmotic situation. Fish body fluids: ∼ 10 ppt salt. Seawater: ∼ 35 ppt salt. Net water movement: out of fish, by osmosis through the gills.
- State the ionic situation. Salts diffuse in through the gills along their concentration gradient.
- State the physiological limit. The freshwater fish's gills and kidneys are tuned to dilute external water; they cannot excrete concentrated salt or retain water in seawater.
- Outcome. The fish loses water (cellular dehydration) and accumulates salt; it dies within hours.
No. The fish is stenohaline; in seawater it loses water by osmosis and absorbs salt against its physiology, and dies.
Strategic angle. Compare the osmotic concentrations. Freshwater fish body > freshwater medium < seawater. The fish is on the wrong side of the osmotic balance in seawater.
- Inside the fish: ∼ 10 ppt; outside in seawater: ∼ 35 ppt.
- Water leaves; salt enters; both kill the cell.
- Stenohaline = no rescue physiology.
No - osmotic dehydration plus salt overload kill the fish.
Cross-reference within the chapter. The principle invoked here is also used in the long-answer questions on community interactions and on growth curves. Recognising the same idea recycled across question types saves time on the Exemplar paper.
Take-away for revision. Note the named example used above in your formula sheet under ``Organisms and Populations''. The chapter's MCQs, VSAs and SAs repeatedly draw from a small canonical list of Indian-context examples - committing those to memory pays back across every section.
Where this fits in the chapter map. This idea sits at the intersection of the ``abiotic factors → organismic responses'' and ``population attributes → growth models'' threads. The sign-table for interactions, the four response modes (regulate, conform, migrate, suspend) and the two growth-curve shapes (J and S) are the chapter's three pillars; every Exemplar question is a variation on one of them.
Speed tactic. When a similar Exemplar question appears, identify which pillar it belongs to first - that immediately narrows the vocabulary and the canonical example set you need to draw on. The actual answer then falls out in a single line of reasoning.
Why do all the fresh water organisms have contractile vacuoles whereas majority of marine organisms lack them?
Concept used. A contractile vacuole is a membrane-bound organelle in unicellular freshwater protists (Paramoecium, Amoeba) that periodically expels excess water to prevent cell lysis. It is essentially an osmoregulatory pump. Need for it depends on the osmotic gradient between the cell and its medium.
- Freshwater cells: cytoplasm is hypertonic relative to fresh water ⇒ continuous water influx by osmosis. The cell would burst if it could not pump water out. Hence the contractile vacuole.
- Marine cells: cytoplasm is roughly isotonic (or slightly hypotonic) to seawater ⇒ little or no net water influx. No need for a contractile vacuole - and in many marine protists it is absent or much less active.
- Conclusion: contractile vacuoles evolved as a freshwater adaptation; marine ancestors lacked the osmotic pressure that necessitates them.
Freshwater is hypotonic to the cell, so water rushes in and must be pumped out by the contractile vacuole. Seawater is roughly isotonic, so no pump is needed.
Quick reading. Osmotic gradient drives the difference. Freshwater = inflow problem ⇒ pump it out; seawater = no inflow ⇒ no pump.
- Freshwater cell: osmotic water influx is constant.
- Marine cell: gradient is negligible.
- Hence the contractile vacuole is a freshwater-specific organelle.
The contractile vacuole counteracts continuous osmotic water entry - a problem only in fresh water.
Linking to the rest of the syllabus. The same logic applies in Ecosystem (Chapter 12 in the 2026-27 syllabus) where energy flow and nutrient cycling depend on the species-level interactions discussed here, and in Biodiversity & Conservation (Chapter 13) where the conservation of mutualisms and pollinators is a recurring theme.
Recommended practice. Re-read the chapter table of positive interactions and run through one named Indian-context example for each. The Exemplar deliberately tests examples (not just definitions), so a handful of well-chosen examples per category is the most efficient revision strategy.
Define heliophytes and sciophytes. Name a plant from your locality that is either heliophyte or sciophyte.
Concept used. Plants are classified by their light requirement: heliophytes (Greek helios = Sun) thrive in full sunlight and are intolerant of deep shade; sciophytes (skia = shade) thrive in low light and are damaged by direct sun. The split reflects different photosynthetic machinery - high light-saturation point and many chloroplasts per mesophyll cell in heliophytes; low saturation point and grana-rich chloroplasts in sciophytes.
- Heliophyte definition: sun-loving plants that grow optimally in open, full-sun conditions.
- Sciophyte definition: shade-loving plants that grow optimally under low light, often the forest understorey.
- Local examples:
- Heliophyte: Tridax procumbens (a common roadside weed), sunflower, mustard, marigold.
- Sciophyte: Pteris (table fern), Begonia, Money plant (Epipremnum aureum), Oxalis.
Heliophytes need full sun (e.g. sunflower); sciophytes need shade (e.g. fern).
Strategic angle. Greek prefixes again: helio- = sun; scio- = shade. Pair with one common Indian plant each for full marks.
- Helio = open-ground sun-lover (sunflower, Tridax).
- Scio = shade-dweller (ferns, money plant indoors).
Heliophyte = sun plant; sciophyte = shade plant.
Why the chapter keeps returning to this idea. The Exemplar is structured so that each MCQ, VSA, SA and LA tests the same small set of core ideas at increasing depth. This question is one such variant; mastering the underlying principle once unlocks several other questions in the chapter.
Revision tip. Pair every definition you encounter in this chapter with one named Indian example (e.g. Sundarbans for mangroves, Western Ghats for biodiversity hotspot, Cuscuta for a parasitic angiosperm). The Exemplar examiners reward example- backed answers over bare definitions.
Why do submerged plants receive weaker illumination than exposed floating plants in a lake?
Concept used. Sunlight entering water is attenuated by two processes: absorption by water molecules and dissolved matter, and scattering by suspended particles. Both increase exponentially with depth, following the Beer–Lambert law I(z) = I0 e-k z, where I0 is surface intensity, z is depth and k is the extinction coefficient. Different wavelengths are absorbed at different depths: red light disappears in the first 5–10 m, blue penetrates deepest.
- Floating plants (Eichhornia, Nymphaea leaves, Pistia) sit at the surface and receive the full unattenuated sunlight.
- Submerged plants (Hydrilla, Vallisneria, Ceratophyllum) sit metres below; the water column above absorbs and scatters most of the incident PAR.
- Hence the same lake delivers high light at the surface (for floaters) and progressively weaker light at depth (for submerged plants). The submerged forms compensate with more chlorophyll per cell and thin, finely-divided leaves to maximise surface area.
Light is absorbed and scattered as it passes through water, so the submerged plants receive only a fraction of the surface intensity.
Picture-first. Sunlight is bright at the lake's surface and dimmer underwater. The deeper you go, the dimmer it gets, because the water column has absorbed and scattered photons along the way.
- Surface light I0 is full strength.
- At depth z, I(z) = I0 e-kz.
- Floating leaves see I0; submerged leaves see I(z) ≪ I0.
Water absorbs and scatters light, reducing what submerged plants receive.
Connection to wider chapter. The point this question makes is reinforced elsewhere in the chapter: the same prefix and sign- table logic recurs in the MCQ block, the SA block on inter-specific interactions, and the LA discussion of population growth. Building this vocabulary once and reapplying it across question types is the fastest way to clear an Exemplar chapter at speed.
Practice cue. If a similar question appears in the board paper or NEET, restate the definition in one sentence, anchor it with one named Indian-context example, then commit to the option. Avoid second-guessing once the prefix or sign-table has been decoded - the chapter is designed so that a single decoding step selects the answer.
In a sea shore, the benthic animals live in sandy, muddy and rocky substrata and accordingly developed the following adaptations.
(a) Burrowing
(b) Building cubes
(c) Holdfasts / peduncle
Find the suitable substratum against each adaptation.
Concept used. Benthos are the animals and plants living on or in the sea bottom. The substratum (sand, mud, rock) constrains their morphology: soft loose substrata favour burrowers; soft cohesive substrata favour tube-builders; hard substrata favour attachment structures.
- Match adaptation → substratum:
- (a) Burrowing - possible only in loose, penetrable material. ⇒ Sandy substratum. Examples: clams, sand crabs, polychaetes.
- (b) Building tubes (the question's ``cubes'' should read ``tubes'') - soft cohesive mud holds tube-shape best. ⇒ Muddy substratum. Examples: tubicolous polychaetes (Chaetopterus), some crustaceans.
- (c) Holdfasts/peduncles - anchor the animal or plant to a hard surface against wave drag. ⇒ Rocky substratum. Examples: barnacles' cement, mussels' byssal threads, kelp holdfasts.
(a) Sandy → burrowing; (b) Muddy → tube building; (c) Rocky → holdfasts/peduncles.
Strategic angle. Two of three matches are obvious. ``Burrowing'' needs material you can dig into → sand. ``Holdfasts'' need something to clamp → rock. The remaining one (tubes) goes with mud.
- Burrow → sand.
- Tube → mud.
- Holdfast/peduncle → rock.
Sand–burrow, Mud–tube, Rock–holdfast.
Cross-reference within the chapter. The principle invoked here is also used in the long-answer questions on community interactions and on growth curves. Recognising the same idea recycled across question types saves time on the Exemplar paper.
Take-away for revision. Note the named example used above in your formula sheet under ``Organisms and Populations''. The chapter's MCQs, VSAs and SAs repeatedly draw from a small canonical list of Indian-context examples - committing those to memory pays back across every section.
Categorise the following plants into hydrophytes, halophytes, mesophytes and xerophytes. Give reasons for your answers.
(a) Salvinia
(b) Opuntia
(c) Rhizophora
(d) Mangifera
Concept used. Plants are classified by their water-relations into four groups: hydrophytes (live in or on water, adaptations for buoyancy and gas exchange under water), xerophytes (live in dry habitats, adaptations to conserve water - thick cuticle, succulence, spines), halophytes (live in saline soils/water, adaptations to handle salt - salt glands, succulent leaves, pneumatophores), mesophytes (live in normal moist soil with average rainfall).
- Classify each plant.
- (a) Salvinia: free-floating fern of ponds and ditches. ⇒ Hydrophyte. Reason: its leaves float on water; lower surface absorbs water; aerenchyma provides buoyancy.
- (b) Opuntia (prickly pear cactus): grows in arid scrub. ⇒ Xerophyte. Reason: leaves reduced to spines (low transpiring surface); thick cuticle; succulent stem stores water; CAM photosynthesis.
- (c) Rhizophora: a true mangrove of tidal coasts. ⇒ Halophyte. Reason: tolerates seawater salinity via salt-secreting leaves; pneumatophores for gas exchange in waterlogged soil; viviparous seedlings.
- (d) Mangifera (mango): a typical tropical tree in well-drained moist soil. ⇒ Mesophyte. Reason: moderate cuticle, broad mesophyllic leaves, no special water- or salt-coping structures.
Salvinia = hydrophyte; Opuntia = xerophyte; Rhizophora = halophyte; Mangifera = mesophyte.
Strategic angle. Match the plant to its habitat first; the ecological category follows.
- Floating on water → hydrophyte (Salvinia).
- Desert, succulent + spiny → xerophyte (Opuntia).
- Tidal mangrove forest → halophyte (Rhizophora).
- Garden orchard, average soil → mesophyte (Mangifera).
Salvinia–hydro; Opuntia–xero; Rhizophora–halo; Mangifera–meso.
Where this fits in the chapter map. This idea sits at the intersection of the ``abiotic factors → organismic responses'' and ``population attributes → growth models'' threads. The sign-table for interactions, the four response modes (regulate, conform, migrate, suspend) and the two growth-curve shapes (J and S) are the chapter's three pillars; every Exemplar question is a variation on one of them.
Speed tactic. When a similar Exemplar question appears, identify which pillar it belongs to first - that immediately narrows the vocabulary and the canonical example set you need to draw on. The actual answer then falls out in a single line of reasoning.
Linking to the rest of the syllabus. The same logic applies in Ecosystem (Chapter 12 in the 2026-27 syllabus) where energy flow and nutrient cycling depend on the species-level interactions discussed here, and in Biodiversity & Conservation (Chapter 13) where the conservation of mutualisms and pollinators is a recurring theme.
Recommended practice. Re-read the chapter table of positive interactions and run through one named Indian-context example for each. The Exemplar deliberately tests examples (not just definitions), so a handful of well-chosen examples per category is the most efficient revision strategy.
In a pond, we see plants which are free-floating; rooted-submerged; rooted emergent; rooted with floating leaves. Write the type of plants against each of them.
(a) Hydrilla (b) Typha (c) Nymphaea (d) Lemna (e) Vallisneria
Concept used. Pond hydrophytes are sub-classified by their rooting and leaf position: free-floating (no roots in soil, floats on water surface), rooted-submerged (rooted in pond bed, entire plant under water), rooted-emergent (rooted in pond bed, shoot rises above water), rooted with floating leaves (rooted in bed, long petiole, leaves float on surface).
- Classify each species using its habit.
- (a) Hydrilla ⇒ rooted-submerged (entire plant under water, rooted in bed).
- (b) Typha (cattail) ⇒ rooted-emergent (roots in pond mud, leaves and inflorescence well above water).
- (c) Nymphaea (water lily) ⇒ rooted with floating leaves (rhizome in mud, leaves float on surface on long petioles).
- (d) Lemna (duckweed) ⇒ free-floating (tiny rootlets dangle, not anchored).
- (e) Vallisneria ⇒ rooted-submerged (ribbon-like leaves under water; rooted in bed).
Hydrilla - rooted submerged; Typha - rooted emergent; Nymphaea - rooted with floating leaves; Lemna - free floating; Vallisneria - rooted submerged.
Strategic angle. For each species answer two yes/no questions: is it rooted in mud? Are its leaves above water, on the surface, or submerged?
- Hydrilla - rooted, leaves submerged.
- Typha - rooted, shoot emergent.
- Nymphaea - rooted, leaves floating.
- Lemna - unrooted (free floating).
- Vallisneria - rooted, leaves submerged.
See main solution.
Why the chapter keeps returning to this idea. The Exemplar is structured so that each MCQ, VSA, SA and LA tests the same small set of core ideas at increasing depth. This question is one such variant; mastering the underlying principle once unlocks several other questions in the chapter.
Revision tip. Pair every definition you encounter in this chapter with one named Indian example (e.g. Sundarbans for mangroves, Western Ghats for biodiversity hotspot, Cuscuta for a parasitic angiosperm). The Exemplar examiners reward example- backed answers over bare definitions.
The density of a population in a habitat per unit area is measured in different units. Write the unit of measurement against the following:
(a) Bacteria (b) Banyan (c) Deer (d) Fish
Concept used. Population density is the count of individuals per chosen unit of habitat. The unit chosen depends on the species' body size and the medium: microscopic organisms are measured per ml or per cm2; small plants per m2; large trees per hectare; mobile animals per km2 for terrestrial, per litre or m3 for aquatic.
- Match species → unit.
- (a) Bacteria are microscopic and counted in cultures or environmental samples. Unit: cells per ml (or per cm2 of surface).
- (b) Banyan is a very large tree; only a few fit per hectare. Unit: trees per hectare.
- (c) Deer are large mobile mammals roaming forests; the natural unit is deer per km2.
- (d) Fish live in three-dimensional water; the unit is fish per litre (small species) or fish per m3.
Bacteria - cells/ml; Banyan - trees/ha; Deer - animals/km2; Fish - fish/litre.
Strategic angle. Scale the unit to the organism: tiny = ml-scale; small plant = m2; tree = ha; mobile mammal = km2; aquatic small = litre.
- Bacteria → /ml.
- Banyan → /ha.
- Deer → /km2.
- Fish → /litre.
Units chosen above match species size.
Connection to wider chapter. The point this question makes is reinforced elsewhere in the chapter: the same prefix and sign- table logic recurs in the MCQ block, the SA block on inter-specific interactions, and the LA discussion of population growth. Building this vocabulary once and reapplying it across question types is the fastest way to clear an Exemplar chapter at speed.
Practice cue. If a similar question appears in the board paper or NEET, restate the definition in one sentence, anchor it with one named Indian-context example, then commit to the option. Avoid second-guessing once the prefix or sign-table has been decoded - the chapter is designed so that a single decoding step selects the answer.
Identify the age pyramid below and answer the questions.

(b) What type of population growth is represented by the above age pyramid?
Concept used. An age pyramid stacks the three age classes from bottom (pre-reproductive) to middle (reproductive) to top (post-reproductive). The widths of the three bands indicate cohort sizes. A pyramid with the broadest bar on the bottom and the narrowest bar on top is a triangular (expanding) pyramid - characteristic of a growing population: lots of young about to enter the reproductive phase.
- Label the tiers from bottom upward as the question's arrows
indicate:
- Tier 1 (bottom, the widest bar) = pre-reproductive (young) class.
- Tier 2 (middle) = reproductive class.
- Tier 3 (top, the narrowest bar) = post-reproductive (old) class.
- Diagnose the shape: pre-reproductive cohort > reproductive cohort > post-reproductive cohort ⇒ triangular (expanding) pyramid.
- Predict the population status: the broad young cohort will mature into the reproductive class and produce many more offspring than the small post-reproductive cohort is removing through mortality. The population will therefore increase.
(a) 1 = Pre-reproductive, 2 = Reproductive, 3 = Post-reproductive. (b) Expanding (growing) population.
Picture-first. Three pyramid shapes occur in the textbook: triangular (broad base → growing), bell (equal bands → stable), inverted urn (broad top → declining). The Q10 figure matches the triangular shape - widest bar at the bottom.
- Tier 1 = pre-reproductive; Tier 2 = reproductive; Tier 3 = post-reproductive.
- Broad base + narrow top ⇒ triangular pyramid ⇒ expanding (growing) population.
Pre-/reproductive/post-reproductive bottom-to-top; expanding (growing) population.
Cross-reference within the chapter. The principle invoked here is also used in the long-answer questions on community interactions and on growth curves. Recognising the same idea recycled across question types saves time on the Exemplar paper.
Take-away for revision. Note the named example used above in your formula sheet under ``Organisms and Populations''. The chapter's MCQs, VSAs and SAs repeatedly draw from a small canonical list of Indian-context examples - committing those to memory pays back across every section.
In an association of two animal species, one is a termite which feeds on wood and the other is a protozoan Trichonympha present in the gut of the termite. What type of association they establish?
Concept used. Trichonympha is a flagellate protozoan that lives inside the hindgut of wood-eating termites. The termite swallows wood but cannot digest cellulose itself; Trichonympha secretes cellulase enzymes that break cellulose into simple sugars. Both the termite (gets digestible food) and the protozoan (gets a stable warm habitat and a steady cellulose supply) benefit. This is a textbook case of mutualism - sign (+, +).
- Identify benefit to each partner.
- Termite: cellulose in chewed wood is digested into glucose by the protozoan's enzymes; the termite absorbs the sugars.
- Trichonympha: gets a stable warm anaerobic habitat and a continuous supply of cellulose substrate.
- Both sides gain ⇒ sign signature (+,+) ⇒ mutualism.
- The relationship is also obligate on both sides: the termite starves without Trichonympha; the protozoan cannot live outside the termite gut.
Mutualism - obligate, both partners benefit.
Quick reading. ``Both gain'' + ``neither can do without the other'' = obligate mutualism. Trichonympha–termite is the canonical gut-symbiosis example.
- Termite supplies wood; protozoan supplies cellulase.
- Result: glucose for both.
- Sign (+,+) ⇒ mutualism.
Obligate mutualism.
Where this fits in the chapter map. This idea sits at the intersection of the ``abiotic factors → organismic responses'' and ``population attributes → growth models'' threads. The sign-table for interactions, the four response modes (regulate, conform, migrate, suspend) and the two growth-curve shapes (J and S) are the chapter's three pillars; every Exemplar question is a variation on one of them.
Speed tactic. When a similar Exemplar question appears, identify which pillar it belongs to first - that immediately narrows the vocabulary and the canonical example set you need to draw on. The actual answer then falls out in a single line of reasoning.
Lianas are vascular plants rooted in the ground and maintain erectness of their stem by making use of other trees for support. They do not maintain direct relation with those trees. Discuss the type of association the lianas have with the trees.
Concept used. Lianas are woody climbers (vascular plants rooted in the soil) that twine around tall trees and use the tree trunks as scaffolding to reach the sunlit canopy. The liana gains access to high light; the supporting tree is not harmed provided the liana does not strangle or out-compete it. Where the support tree is genuinely unaffected, this is a textbook example of commensalism (sign +/0).
- Identify benefit/cost.
- Liana: gains height and access to canopy sunlight. Without the tree it would be limited to ground-level light.
- Host tree: the question stipulates no direct relation ⇒ no measurable cost or benefit.
- Sign signature: (+, 0) ⇒ commensalism.
- (Note: in nature heavy liana loads can damage trees, in which case the relationship turns to amensalism or even parasitism. The question's wording asks us to treat it as benign → commensalism.)
Commensalism - the liana benefits, the supporting tree is unaffected.
Strategic angle. ``Uses for support, no direct relation'' is the textbook commensalism phrasing. The same logic explains epiphytes on mango branches and barnacles on whales.
- Liana = beneficiary.
- Tree = indifferent.
- Hence commensalism.
Commensalism.
Linking to the rest of the syllabus. The same logic applies in Ecosystem (Chapter 12 in the 2026-27 syllabus) where energy flow and nutrient cycling depend on the species-level interactions discussed here, and in Biodiversity & Conservation (Chapter 13) where the conservation of mutualisms and pollinators is a recurring theme.
Recommended practice. Re-read the chapter table of positive interactions and run through one named Indian-context example for each. The Exemplar deliberately tests examples (not just definitions), so a handful of well-chosen examples per category is the most efficient revision strategy.
Why the chapter keeps returning to this idea. The Exemplar is structured so that each MCQ, VSA, SA and LA tests the same small set of core ideas at increasing depth. This question is one such variant; mastering the underlying principle once unlocks several other questions in the chapter.
Revision tip. Pair every definition you encounter in this chapter with one named Indian example (e.g. Sundarbans for mangroves, Western Ghats for biodiversity hotspot, Cuscuta for a parasitic angiosperm). The Exemplar examiners reward example- backed answers over bare definitions.
Give the scientific names of any two microorganisms inhabiting the human intestine.
Concept used. The human large intestine hosts a dense microbial community (gut microbiota, ∼ 1014 cells) in mutualistic relation with the host: they ferment otherwise indigestible fibre into short-chain fatty acids, synthesise vitamins K and B12, and exclude pathogens. Two widely recognised gut residents are Escherichia coli (a facultative anaerobe in the colon) and Lactobacillus acidophilus (a fermenter that acidifies the gut and inhibits pathogens). Bifidobacterium bifidum and Bacteroides fragilis are equally acceptable.
- Pick two named gut bacteria.
- Italicise the binomials (genus + species).
Escherichia coli and Lactobacillus acidophilus.
Quick reading. Two names with proper binomial italicisation get full marks. Standard pair: E. coli and Lactobacillus acidophilus.
- Bacterium 1: Escherichia coli.
- Bacterium 2: Lactobacillus acidophilus.
E. coli, L. acidophilus.
Connection to wider chapter. The point this question makes is reinforced elsewhere in the chapter: the same prefix and sign- table logic recurs in the MCQ block, the SA block on inter-specific interactions, and the LA discussion of population growth. Building this vocabulary once and reapplying it across question types is the fastest way to clear an Exemplar chapter at speed.
Practice cue. If a similar question appears in the board paper or NEET, restate the definition in one sentence, anchor it with one named Indian-context example, then commit to the option. Avoid second-guessing once the prefix or sign-table has been decoded - the chapter is designed so that a single decoding step selects the answer.
What is a tree line?
Concept used. The tree line (or timber line) is the upper altitudinal (or northern/southern latitudinal) limit beyond which trees can no longer grow. Above the tree line, only shrubs, herbs, mosses and lichens persist - a transition called the alpine or arctic zone. The limit is set by low temperatures (growing-season length too short for woody tissue to mature), strong winds, snow cover and a short frost-free season.
- Define: the boundary in altitude/latitude past which trees cannot establish or survive.
- Identify the cause: combination of low temperature, short growing season, wind, ice abrasion.
- Indian example: in the Himalayas, the tree line lies approximately at 3500–4000 m; above it spreads the alpine meadow with only shrubs (e.g. Rhododendron).
The upper altitudinal/latitudinal boundary above which trees cannot grow, set chiefly by cold and short growing season.
Strategic angle. ``Boundary above which X cannot grow'' defines any X-line: tree line, snow line, frost line. Each is set by a single dominant climatic limit.
- Tree line = upper limit of tree growth.
- Cause: cold + short growing season.
Upper altitudinal limit beyond which trees cannot survive.
Cross-reference within the chapter. The principle invoked here is also used in the long-answer questions on community interactions and on growth curves. Recognising the same idea recycled across question types saves time on the Exemplar paper.
Take-away for revision. Note the named example used above in your formula sheet under ``Organisms and Populations''. The chapter's MCQs, VSAs and SAs repeatedly draw from a small canonical list of Indian-context examples - committing those to memory pays back across every section.
Define `zero population growth rate'. Draw an age pyramid for the same.
Concept used. A population has zero population growth rate (ZPG) when births + immigration exactly equal deaths + emigration, so the population size stays constant over time. In the simplest closed-population case, this reduces to natality = mortality. The age pyramid that represents ZPG is roughly bell-shaped: pre-reproductive and reproductive cohorts of about equal size, with a slightly tapering post-reproductive top.
- Definition. ZPG: dNdt = 0, equivalent to b = d (per-capita birth = per-capita death). Net effect: the population neither grows nor shrinks.
- Population it describes: many developed countries with approximately equal birth and death rates and low net migration.
- Draw the pyramid.
![See diagram in the PDF version]
ZPG: births = deaths so dN/dt = 0; the age pyramid is bell-shaped (equal pre-reproductive and reproductive bands).
Strategic angle. Two ingredients: a one-sentence definition (b = d) and a bell-shaped pyramid sketch. Both are needed for full marks.
- Quantitative definition: b = d ⇒ dN/dt = 0.
- Qualitative shape: bell - equal middle bands, tapered top.
Stable population, bell pyramid.
Where this fits in the chapter map. This idea sits at the intersection of the ``abiotic factors → organismic responses'' and ``population attributes → growth models'' threads. The sign-table for interactions, the four response modes (regulate, conform, migrate, suspend) and the two growth-curve shapes (J and S) are the chapter's three pillars; every Exemplar question is a variation on one of them.
Speed tactic. When a similar Exemplar question appears, identify which pillar it belongs to first - that immediately narrows the vocabulary and the canonical example set you need to draw on. The actual answer then falls out in a single line of reasoning.
Linking to the rest of the syllabus. The same logic applies in Ecosystem (Chapter 12 in the 2026-27 syllabus) where energy flow and nutrient cycling depend on the species-level interactions discussed here, and in Biodiversity & Conservation (Chapter 13) where the conservation of mutualisms and pollinators is a recurring theme.
Recommended practice. Re-read the chapter table of positive interactions and run through one named Indian-context example for each. The Exemplar deliberately tests examples (not just definitions), so a handful of well-chosen examples per category is the most efficient revision strategy.
List any four characters that are employed in human population census.
Concept used. A national census is a periodic enumeration of a country's population. Beyond the headcount, several demographic attributes are recorded to plan policy. The Indian decennial census records dozens of variables; any four of the following count for this question.
- List four characters commonly recorded:
- Age structure (age distribution into pre-reproductive, reproductive, post-reproductive).
- Sex ratio (number of females per 1000 males).
- Natality (birth rate) and mortality (death rate).
- Literacy rate.
- Occupation/employment.
- Religion, language, marital status.
- Any four are acceptable.
Any four of: age structure, sex ratio, natality, mortality, literacy, occupation.
Quick reading. Pick four of the obvious demographic variables; any four are fine.
- Age + sex + birth rate + death rate is a safe pick.
Age, sex ratio, natality, mortality.
Why the chapter keeps returning to this idea. The Exemplar is structured so that each MCQ, VSA, SA and LA tests the same small set of core ideas at increasing depth. This question is one such variant; mastering the underlying principle once unlocks several other questions in the chapter.
Revision tip. Pair every definition you encounter in this chapter with one named Indian example (e.g. Sundarbans for mangroves, Western Ghats for biodiversity hotspot, Cuscuta for a parasitic angiosperm). The Exemplar examiners reward example- backed answers over bare definitions.
Give one example for each of the following types.
(a) Migratory animal
(b) Camouflaged animal
(c) Predator animal
(d) Biological control agent
(e) Phytophagous animal
(f) Chemical defense agent
Concept used. Each category names a distinct ecological role; one named example per category is enough.
- (a) Migratory animal: Siberian crane (Grus leucogeranus) - winters in India, breeds in Siberia. Alternative: Arctic tern, wildebeest.
- (b) Camouflaged animal: stick insect (Phasma) or the leaf insect (Phyllium) - body mimics twigs/ leaves. Alternative: chameleon, ptarmigan.
- (c) Predator animal: tiger (Panthera tigris). Alternative: lion, hawk, frog.
- (d) Biological control agent: Ladybird beetle (Coccinella) - preys on aphids to protect crops. Alternative: Trichogramma, Bacillus thuringiensis.
- (e) Phytophagous animal: grasshopper (Schistocerca gregaria) or aphid; feeds entirely on plants.
- (f) Chemical defense agent: Monarch butterfly (Danaus plexippus) - its larva sequesters cardiac glycosides from milkweed; Calotropis latex itself is a plant chemical defense.
(a) Siberian crane (b) Stick insect (c) Tiger (d) Ladybird beetle (e) Grasshopper (f) Monarch butterfly.
Strategic angle. For each category, write the most iconic example you remember - that minimises the risk of a debatable answer.
- Use the canonical example list above.
See main solution.
Connection to wider chapter. The point this question makes is reinforced elsewhere in the chapter: the same prefix and sign- table logic recurs in the MCQ block, the SA block on inter-specific interactions, and the LA discussion of population growth. Building this vocabulary once and reapplying it across question types is the fastest way to clear an Exemplar chapter at speed.
Practice cue. If a similar question appears in the board paper or NEET, restate the definition in one sentence, anchor it with one named Indian-context example, then commit to the option. Avoid second-guessing once the prefix or sign-table has been decoded - the chapter is designed so that a single decoding step selects the answer.
Cross-reference within the chapter. The principle invoked here is also used in the long-answer questions on community interactions and on growth curves. Recognising the same idea recycled across question types saves time on the Exemplar paper.
Take-away for revision. Note the named example used above in your formula sheet under ``Organisms and Populations''. The chapter's MCQs, VSAs and SAs repeatedly draw from a small canonical list of Indian-context examples - committing those to memory pays back across every section.
Fill in the blanks.
Species A & Species B & Type of Interaction & Example
+ & - & 2.5cm0.4pt & 2.5cm0.4pt
+ & + & 2.5cm0.4pt & 2.5cm0.4pt
+ & 1cm0.4pt & Commensalism & 2.5cm0.4pt
tabular
Concept used. Use the sign table for interspecific interactions (built in MCQ Q17). Fill each blank by reading the sign pair.
- Row 1: (+,-). Species A gains; species B suffers. That is predation or parasitism. Example: Tiger eating deer (predation); Plasmodium in human blood (parasitism).
- Row 2: (+,+). Both gain. That is mutualism. Example: lichen (fungus + alga), or pollinator bee + flower.
- Row 3: (+, ?) labelled commensalism. The commensalism sign is (+, 0), so the missing sign is 0. Example: cattle egret + cattle.
- Completed table:
tabularc c l l
Species A & Species B & Type of interaction & Example
+ & - & Predation/Parasitism & Tiger–Deer (predation)
+ & + & Mutualism & Lichen (fungus + alga)
+ & 0 & Commensalism & Cattle egret + cattletabular
See completed table above.
Strategic angle. Each row is a sign pair → a name → a canonical example. Just translate from the sign table you built in Q17.
- (+,-): predation or parasitism - tiger eats deer.
- (+,+): mutualism - lichen.
- (+,0): commensalism - cattle egret + cattle.
Predation, Mutualism, Commensalism with examples above.
Where this fits in the chapter map. This idea sits at the intersection of the ``abiotic factors → organismic responses'' and ``population attributes → growth models'' threads. The sign-table for interactions, the four response modes (regulate, conform, migrate, suspend) and the two growth-curve shapes (J and S) are the chapter's three pillars; every Exemplar question is a variation on one of them.
Speed tactic. When a similar Exemplar question appears, identify which pillar it belongs to first - that immediately narrows the vocabulary and the canonical example set you need to draw on. The actual answer then falls out in a single line of reasoning.
Observe the set of 4 figures A, B, C and D and answer the following questions.
(i) Which one of the figures shows mutualism?
(ii) What kind of association is shown in D?
(iii) Name the organisms and the association in C.
(iv) What role is the insect performing in B?
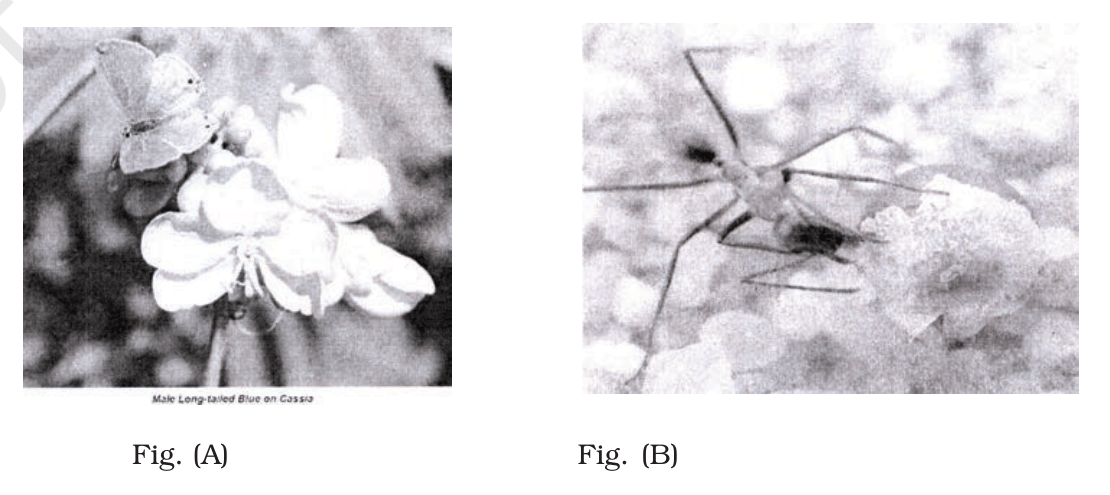
Now study the second pair of figures (C) and (D) below.
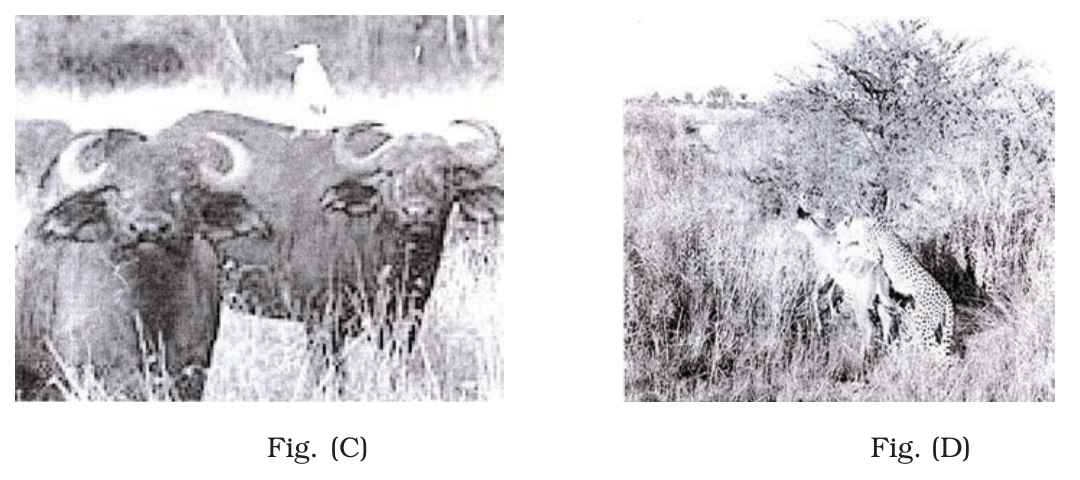
Concept used. Figure A shows an orchid in bloom with a male long-tailed blue butterfly - an example of an orchid flower mimicking a female butterfly so the male attempts pseudo-copulation and pollinates the flower (deceit pollination, a form of one-sided gain favouring the plant). Figure B shows an insect (bee) actively collecting pollen and nectar from a flower - classical pollinator mutualism. Figure C shows cattle egrets sitting on grazing cattle - commensalism. Figure D shows a predator (cheetah/wild cat) stalking prey - predation.
- (i) Mutualism: the bee–flower pair in Fig. B - both partners benefit (bee gets food, flower gets cross- pollination).
- (ii) Fig. D shows predation - a predator (cheetah/cat) stalking prey hidden in tall grass.
- (iii) Fig. C shows cattle (Bos indicus) with the cattle egret (Bubulcus ibis). The association is commensalism: the egret gains (feeds on insects flushed by the cattle), and the cattle are unaffected.
- (iv) The insect in Fig. B is acting as a pollinator - it collects nectar/pollen and transfers pollen between flowers, enabling cross-pollination of the angiosperm.
(i) B; (ii) Predation; (iii) Cattle + cattle egret, commensalism; (iv) Pollinator.
Picture-first. Map each figure to a sign-table category. A = pseudo-copulation (orchid mimicry, deceit). B = insect pollinator (mutualism). C = cattle egret on cattle (commensalism). D = cat stalking prey (predation).
- Mutualism is the only (+,+) candidate → B.
- D is hunting → predation.
- C cattle + egret → commensalism.
- B insect → pollinator.
See main solution.
Linking to the rest of the syllabus. The same logic applies in Ecosystem (Chapter 12 in the 2026-27 syllabus) where energy flow and nutrient cycling depend on the species-level interactions discussed here, and in Biodiversity & Conservation (Chapter 13) where the conservation of mutualisms and pollinators is a recurring theme.
Recommended practice. Re-read the chapter table of positive interactions and run through one named Indian-context example for each. The Exemplar deliberately tests examples (not just definitions), so a handful of well-chosen examples per category is the most efficient revision strategy.
Why the chapter keeps returning to this idea. The Exemplar is structured so that each MCQ, VSA, SA and LA tests the same small set of core ideas at increasing depth. This question is one such variant; mastering the underlying principle once unlocks several other questions in the chapter.
Revision tip. Pair every definition you encounter in this chapter with one named Indian example (e.g. Sundarbans for mangroves, Western Ghats for biodiversity hotspot, Cuscuta for a parasitic angiosperm). The Exemplar examiners reward example- backed answers over bare definitions.
Long Answer Type Questions
Comment on the following figures: 1, 2 and 3 (A, B, C, D, G, P, Q, R, S are species).
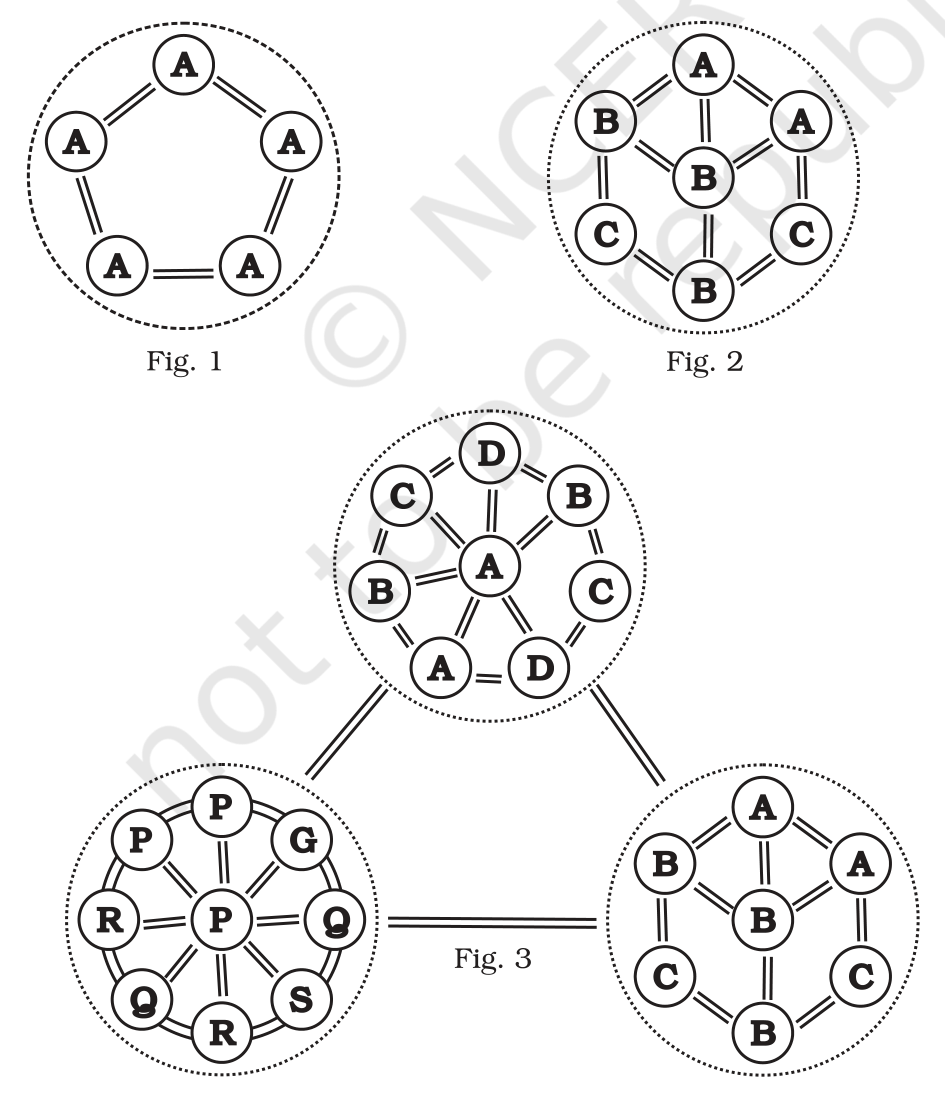
Concept used. Each circle in the figure represents a community (the dashed/dotted boundary). The letters inside each circle are species; lines between species denote ecological connections (feeding, competition, mutualism). The arrangement of circles encodes the spatial relationship of the communities - a single isolated community in Fig. 1, two adjacent communities sharing an ecotone in Fig. 2, and three adjacent communities meeting at multiple ecotones in Fig. 3.
- Fig. 1. A single community containing only one species (A) repeated several times. This is a monospecific community - low species diversity, the kind you see in monoculture plantations (e.g. a teak plantation, or a wheat field).
- Fig. 2. Two distinct communities placed side-by-side: one made of species A and a second of species B and C. The narrow overlap shows three species mixing - that overlap region is the ecotone. Ecotones display the edge effect: greater diversity than either community alone.
- Fig. 3. Three communities arranged around a central
community.
- Community 1: species A, B, C (similar to the upper part of Fig. 2).
- Community 2: species P, Q, R, S (a richer assemblage).
- Community 3: species A, B, C, D (one more than community 1; broader diversity).
- Take-away. The figures move from monoculture (Fig. 1, lowest diversity) to a two-community ecotone (Fig. 2) to a three-community mosaic (Fig. 3, highest diversity and edge effect). The pattern shows how community boundaries generate biological richness.
Fig. 1 - single (monospecific) community; Fig. 2 - two communities sharing one ecotone; Fig. 3 - three communities meeting at a central ecotone, demonstrating maximum edge effect.
Structural observation. The three figures form a sequence: (1) a community with no neighbours, (2) two communities sharing one edge, (3) three communities sharing edges with each other. Each extra neighbour adds an ecotone, and each ecotone adds diversity.
- Fig. 1. A single dashed circle with species A repeated. This is a single community of one species - a monoculture. Diversity is the lowest possible: just one taxon. Real-world analogue: Eucalyptus plantation, paddy field, or naturally low-diversity systems like deep cave pools.
- Fig. 2. Two circles touching, one labelled with
A repeated and the other with B and C.
The overlap zone contains representatives of A,
B and C simultaneously - that overlap is an
ecotone. Ecotones have:
- Species from community 1.
- Species from community 2.
- Edge specialists (sometimes called ``ecotone species'') that exploit conditions intermediate between the two communities.
- Fig. 3. Three circles arranged as a triangle, each sharing an edge with the other two. The central junction is a multi-way ecotone: species from communities 1, 2 and 3 all meet here. Compared with Fig. 2, the diversity in this ecotone is even higher because three source communities contribute species.
- Generalisation. As landscapes become more heterogeneous - more communities meeting at more boundaries - both alpha diversity (within-community) and gamma diversity (regional total) increase. This is why conservation biologists value landscape mosaics over single large homogeneous patches.
- Cross-reference. Compare with the definition of ecotone (MCQ Q2) and the edge effect mentioned in the chapter.
Why this matters. The figures encode a core ecological idea: community boundaries create biological richness. The edge of a forest, a wetland margin or a mangrove all show higher diversity than the interiors. Mosaic landscapes are productive for the same reason.
Fig. 1 monospecific community; Fig. 2 two communities sharing an ecotone; Fig. 3 three communities sharing a multi-way ecotone - diversity rises with each added boundary.
An individual and a population has certain characteristics. Name these attributes with definitions.
Concept used. The textbook draws a sharp distinction between attributes of an individual (properties of a single organism) and attributes of a population (properties of the collective that no individual possesses). The latter is the bedrock of population ecology.
- Attributes of an individual.
- Born and dies once in its lifetime.
- Has a definite age, sex, body size and physiological state at any moment.
- Has a fixed birth date and a fixed (future) date of death.
- Other measurable individual traits: rate of growth, fecundity, behaviour, genotype.
- Attributes of a population. (These are the
attributes birth rate, death rate,
sex ratio, age distribution and
population density discussed in the chapter.)
- Birth rate (natality): number of new individuals added per existing individual per unit time. e.g. ``4 births per individual per year'' for a lotus pond population.
- Death rate (mortality): number of deaths per existing individual per unit time.
- Sex ratio: relative proportion of males to females (often reported as females per 1000 males).
- Age distribution: number of individuals in each age class (pre-, reproductive, post- reproductive); displayed as an age pyramid.
- Population density: number of individuals per unit area or volume of habitat. Symbolised N. Density can also be measured indirectly via percent cover, biomass, or pug-marks / scats (MCQ Q13).
- Population size (N): the total number of individuals.
- Mathematical link to growth. Population density at the next time step is Nt+1 = Nt + B + I - D - E, with B, I, D, E the four flows (see MCQ Q14). All four are population-level attributes; none belongs to a single individual.
Individual: born, dies, has age, sex, size. Population: birth rate, death rate, sex ratio, age distribution, density.
Strategic angle. Build a two-column comparison: one column for individual traits (singular, observable on one organism), one for population traits (rates, ratios, distributions - observable only on the group).
- Individual attributes.
- Birth and death - one each in a lifetime.
- Age, sex, body mass at any moment.
- Genotype, physiology, behaviour, fecundity.
- Population attributes - five core ones.
- Birth rate (natality). Number of births per individual per unit time. Example: ``In a pond of 20 lotus plants there were 8 new individuals in the last year'' ⇒ birth rate = 8/20 = 0.4 per lotus per year.
- Death rate (mortality). Deaths per individual per unit time.
- Sex ratio. Proportion of males vs females, or females per 1000 males.
- Age distribution. Numbers in pre-/ reproductive/post-reproductive classes, drawn as an age pyramid.
- Population density. Number of individuals per unit area or volume.
- Why distinct. A single tiger has neither a birth rate nor a sex ratio nor an age distribution. These are emergent attributes of the group.
- Worked example. A village school with 300 students has age distribution (Class 1 to 12), sex ratio (boys:girls), birth rate (new admissions per existing student per year). Individual students have age, sex and grade. The two attribute sets do not overlap.
- Use in the chapter. The population attributes feed into the exponential (dN/dt = rN) and logistic (dN/dt = rN(K-N)/K) growth models examined in LA Q4.
Why this matters. Whenever the chapter (or NEET) talks about ``the population grew at r = 0.02'' or ``the age pyramid is expanding'', it is invoking population-level attributes that simply do not exist for any one organism.
Individual: birth, death, age, sex, body characters. Population: birth rate, death rate, sex ratio, age distribution, density.
The following diagrams are the age pyramids of different populations. Comment on the status of these populations.
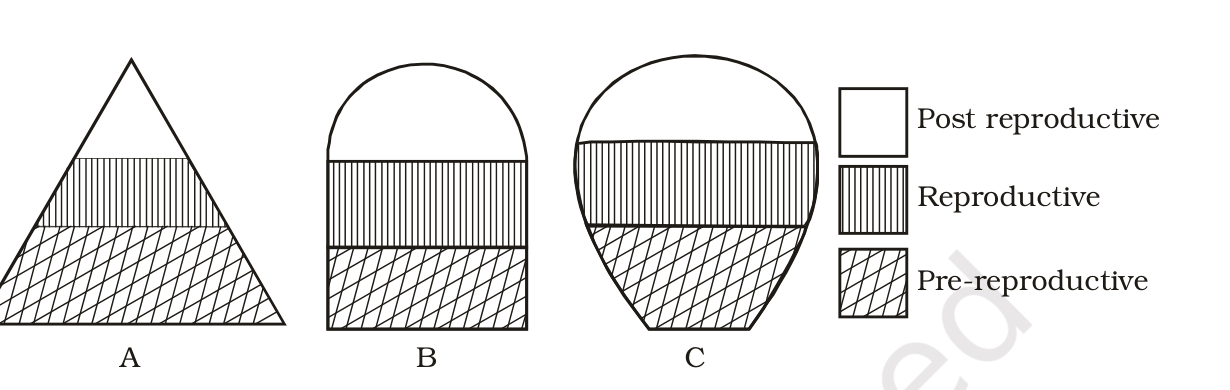
Concept used. An age pyramid stacks the three age classes - pre-reproductive (bottom), reproductive (middle), post- reproductive (top) - with the width of each band proportional to the cohort size at the census. The shape predicts future population trajectory. Three canonical shapes are recognised: triangular (growing), bell (stable), inverted urn (declining).
- Pyramid A - triangular. Broad base (large pre- reproductive cohort), narrower middle, narrowest top. This is an expanding population: when the broad young cohort matures into the reproductive class, it will produce many offspring, so the population will keep growing. Modern analogues: India's age structure circa 2001, much of sub-Saharan Africa today.
- Pyramid B - bell-shaped. Equal pre-reproductive and reproductive bands, slightly tapering post-reproductive top. This is a stable population: each reproductive cohort is being replaced by an equally-sized young cohort. Birth rate ≈ death rate. Many developed European countries (early-2000s Germany, France).
- Pyramid C - inverted urn. Narrow base, broad reproductive middle, broad top. This is a declining population: too few young to replace the reproductive cohort when it ages out. Japan and Italy today show this pattern.
- Take-away. The base-to-top width gradient encodes
the population's future:
- Base wider than top → growth.
- Equal → stability.
- Top wider than base → decline.
A - expanding (triangular); B - stable (bell); C - declining (inverted urn).
Picture-first. Hold the three shapes in mind: a Christmas tree (triangular), a bell, and an upside-down vase. Each shape encodes a future trajectory because the shape of today's age distribution determines tomorrow's birth–death balance.
- Pyramid A. Christmas-tree shape: lots of children at the bottom, fewer adults, very few elderly. Mechanism: in the next 10–15 years, that large young cohort enters reproduction. Births will outnumber deaths (the post- reproductive group is small). Population grows. This is the expanding pattern.
- Pyramid B. Bell shape: pre-reproductive and reproductive bars are about equal width; post-reproductive narrows. Mechanism: each generation produces roughly the same number of children as the parent generation. Births balance deaths. Population stays at constant size - the stable pattern.
- Pyramid C. Upside-down vase: narrow base, wide middle and top. Mechanism: too few children today to replace the reproductive cohort when it ages out. When the broad reproductive band shifts up to become post-reproductive, it will not be replaced by an equally broad band coming up from below. Births < deaths. Population shrinks - the declining pattern.
- Quantify if asked. For each shape, also note the per-capita rate r = b - d. Pyramid A: r > 0. Pyramid B: r ≈ 0. Pyramid C: r < 0.
- Real-world map.
- A: India (2001 census), Nigeria, Bangladesh today.
- B: Sweden, France in the late 1990s.
- C: Japan, Italy, Germany today.
- Why the same shape recurs. Because mortality and natality respond to economic and cultural conditions smoothly, age pyramids change shape over decades, not years. India's pyramid is slowly transitioning from A toward B.
Why this matters. Age pyramids are the most compact forecasting tool in demography - a single diagram tells you whether to plan for new schools (A), maintain existing infrastructure (B), or prepare for an ageing-dependency burden (C).
A - expanding; B - stable; C - declining.
Comment on the growth curve given below.
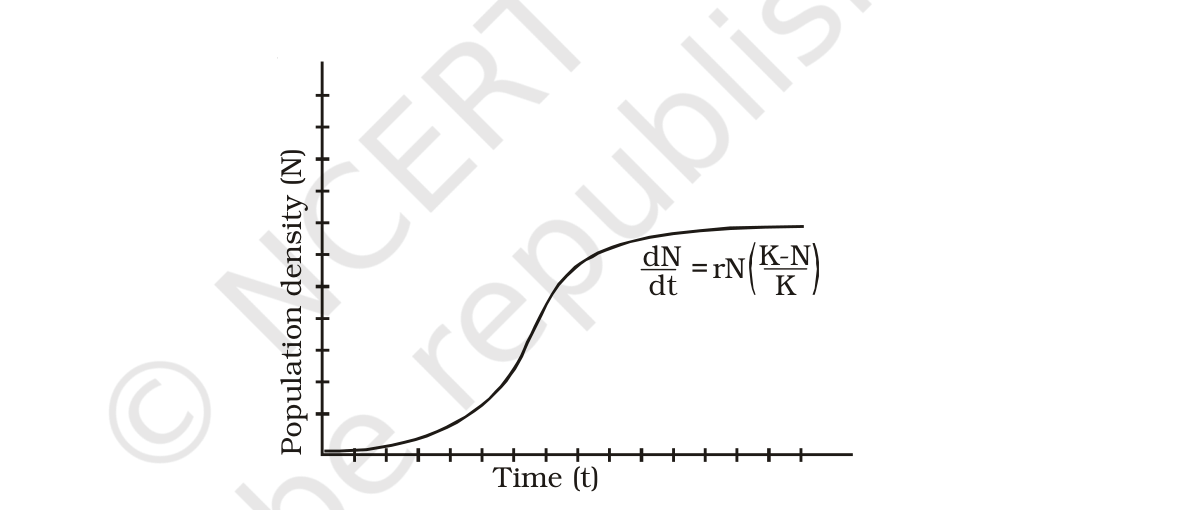
Concept used. The S-shaped curve in the figure is the logistic growth curve described by the Verhulst–Pearl equation dNdt = rN · K - NK, where N is the population size at time t, r the intrinsic per-capita growth rate, and K the carrying capacity of the environment - the maximum population the resources can sustain indefinitely. Unlike exponential growth (dN/dt = rN, J-shape) which assumes unlimited resources, logistic growth includes a slowing term (K-N)/K that dampens growth as N approaches K.
- Read the equation factor by factor.
- rN alone is the exponential term: at low N the population grows almost exponentially.
- (K-N)/K is a unitless brake that decreases from 1 (when N ≪ K) to 0 (when N = K). It represents environmental resistance - competition for food, space and other resources.
- Identify the four phases visible in the curve.
- Lag phase - low initial N; growth is slow because few breeders are present even though resources are abundant.
- Log (exponential) phase - once N rises, rN dominates and the curve is nearly exponential. The curve is steepest in this phase.
- Slowing (deceleration) phase - as N approaches K, the brake (K-N)/K shrinks toward 0 and growth slows.
- Stationary phase - N = K, dN/dt = 0, births equal deaths. The curve flattens at K.
- When does this model apply? In every real environment with finite resources - which means essentially every natural population. Examples: yeast in a culture flask, Paramoecium in a test tube (see LA Q5), whitetail deer on an island, plankton blooms.
- Compare with exponential. The J-curve of dN/dt = rN is unbounded; the S-curve of the logistic levels off at K. The logistic is therefore a more biologically realistic model.
- Inflection point. At N = K/2, growth rate dN/dt is maximum (you can verify by differentiating). After this point, the second derivative becomes negative and the curve bends toward K.
The curve is the logistic (S-shaped) growth dN/dt = rN(K-N)/K - exponential-like at low N, slowing as N → K, and stationary at the carrying capacity K.
Structural observation. The S-curve is two equations glued together by a brake. At low N the brake (K-N)/K ≈ 1, so dN/dt ≈ rN - exponential. At high N the brake (K-N)/K → 0, so dN/dt → 0 - stationary. The transition gives the S-shape.
- Set up the equation. The logistic equation is dN/dt = rN · (K - N)/K. Two parameters: r (intrinsic rate, units of 1/time) and K (carrying capacity, units of individuals).
- Limiting behaviour.
- When N ≪ K: (K-N)/K ≈ 1, so dN/dt ≈ rN. Exponential growth, J-shape.
- When N = K: (K-N)/K = 0, so dN/dt = 0. Growth halts. The curve plateaus.
- When N > K (rare overshoot): (K-N)/K < 0, so dN/dt < 0. Population shrinks back toward K.
- Solve to find the inflection point. The growth
rate dN/dt = rN(K-N)/K is a parabola in N opening
downward with zeros at N = 0 and N = K. The peak lies
midway, at N = K/2.
- Compute the maximum growth: .dNdt|N=K/2 = r· K2· K - K/2K = r· K2· 12 = rK4.
- This is the steepest slope on the S-curve, the inflection point. After this, the curve concaves downward.
- Phase recap.
- Lag (low N, slow growth because few reproducers).
- Log (mid N, steepest growth).
- Slowing (approach to K, brake takes over).
- Stationary (N = K, dN/dt = 0).
- Where the model fits. Yeast cultures, bacteria in chemostats, sheep introduced to Tasmania, Paramoecium in flask cultures all show logistic-shaped trajectories. Real populations may overshoot K and crash - the logistic is a smoothing approximation.
- Equation insight. A useful identity for the plateau: at N = K, r has not changed - only the realised growth rate rN(K-N)/K falls to zero because environmental resistance fully cancels r.
Why this matters. Conservation, fisheries and pest-control all use K as the policy target. Setting a yearly harvest at the maximum sustainable yield = rK/4 keeps the population at K/2 - the peak growth-rate point - without driving it to extinction.
Logistic (S-shaped) curve dN/dt = rN(K-N)/K with lag, log, slowing and stationary phases.
A population of Paramoecium caudatum was grown in a culture medium. After 5 days the culture medium became overcrowded with Paramoecium and had depleted nutrients. What will happen to the population and what type of growth curve will the population attain? Draw the growth curve.
Concept used. In a closed culture, Paramoecium growth is logistic (LA Q4). The early days show exponential rise; as nutrients deplete and metabolic waste accumulates, the death rate rises and the birth rate falls, so dN/dt → 0 at the carrying capacity K. The population trajectory is therefore S-shaped.
- What happens after Day 5. Resources (food + space) are scarce; metabolic wastes are toxic. Birth rate drops, death rate rises. The growth rate dN/dt approaches zero.
- Type of curve. The whole experiment from inoculation to overcrowding traces a sigmoid (S-shaped) logistic curve.
- Sketch the curve.
![See diagram in the PDF version]
- Outcome. The population plateaus at the carrying capacity K of the culture vessel. If nutrient depletion and waste build-up are severe, the population may even crash (a death phase). Removing waste and adding fresh medium (i.e. a chemostat) would let exponential growth resume.
The population attains a sigmoid (S-shaped) logistic curve, plateauing at the culture's carrying capacity K.
Strategic angle. A finite flask = finite resources = logistic growth. The S-curve is the only realistic answer; the J-curve would require an infinite chemostat.
- Days 0–1: Lag phase. The inoculum acclimatises; reproduction is slow because the few cells present can produce only a few daughters per division.
- Days 1–3: Log phase. The cells, now numerous and with abundant food, divide rapidly. dN/dt ≈ rN - nearly exponential. The Paramoecium count doubles every few hours.
- Days 3–5: Slowing phase. As N approaches K, the brake (K-N)/K takes over. Cell division slows; some cells die from waste accumulation.
- Day 5 onwards: Stationary phase. Births equal deaths; net growth is zero. The plateau persists as long as nutrients remain.
- Possible decline phase. If the experiment is continued without fresh medium, nutrient exhaustion + waste toxicity overwhelms the population, and N begins to fall (a death/decline phase appears).
- Sketch. The curve mirrors Fig. LA Q4 - flat low, steep middle, flat top at K.
- Cross-check. This is the famous Gause experiment (1934) with Paramoecium caudatum that established the logistic model in animal populations.
Why this matters. The same logistic curve describes bacterial colonies, yeast fermentation, plankton blooms and even introduced mammal populations. The S-shape is one of the most universal patterns in population biology.
S-shaped (sigmoid, logistic) curve plateauing at K after Day 5; the population stops growing and may eventually decline if waste accumulates further.
Discuss the various types of positive interactions between species.
Concept used. Positive interactions are those in which at least one partner gains and neither is harmed. From the sign-table (MCQ Q17), these are mutualism (+/+), commensalism (+/0) and the more permissive case of proto-cooperation (+/+ but optional). The chapter emphasises mutualism (the strongest positive interaction) and commensalism (the looser one-sided benefit).
- Mutualism (+/+). Both partners gain; often
obligate (cannot live separately). Examples:
- Lichen = fungus + alga.
- Mycorrhiza = fungus + plant root.
- Plant pollinator mutualism - e.g. fig tree (Ficus) + fig wasp (Blastophaga). The wasp pollinates the fig flower; the fig provides a nursery for wasp larvae. Neither can complete its life cycle without the other.
- Nitrogen fixation: Rhizobium + legume root.
- Termite + Trichonympha (SA Q11).
- Commensalism (+/0). One species benefits; the
other is unaffected.
- Cattle egret + cattle (insects flushed by grazing).
- Orchid (an epiphyte) on a mango branch - orchid gets sunny perch; mango unaffected.
- Suckerfish (Remora) attached to a shark - remora gets transport and food scraps; shark unaffected.
- Sea anemone on a hermit-crab shell (in some pairings, only the anemone gains protection from the elevated perch; in others both gain - that's mutualism).
- Proto-cooperation. A facultative form of mutualism in which both partners gain but can live independently. Not always treated as a separate category; the textbook usually merges it with mutualism. Example: oxpecker birds feeding on ticks of zebra (both benefit; both can survive separately).
- Take-away. Positive interactions are central to community assembly: they let species colonise habitats they couldn't enter alone (lichen on bare rock), bridge nutrient gaps (mycorrhiza), and stabilise trophic chains (pollination).
Mutualism (+/+, e.g. lichen, mycorrhiza, fig–fig wasp), Commensalism (+/0, e.g. cattle egret + cattle, orchid on mango) and Proto-cooperation (+/+, facultative; e.g. oxpecker + zebra).
Strategic angle. Build a clean comparison table. Rows are the three positive interactions; columns are sign signature, whether obligate, and one canonical example each.
- Mutualism - (+,+) obligate.
- Both gain; often neither can survive without the other.
- Examples: lichen (fungus + alga), mycorrhiza (fungus + root), Rhizobium + legume root, fig + fig wasp.
- Mechanism. One partner supplies what the other cannot make: alga supplies sugars to the fungus; fungus supplies water/minerals to the alga.
- Commensalism - (+,0).
- One gains; the other is indifferent.
- Examples: cattle egret + cattle, orchid + mango, remora + shark, barnacle + whale.
- Mechanism. The beneficiary exploits a resource (food, perch, transport, protection) that the indifferent partner inadvertently provides.
- Proto-cooperation - (+,+) facultative.
- Both gain but neither is dependent.
- Example: oxpecker birds + zebra (bird eats ticks; zebra loses parasites). Hermit crab + sea anemone in some pairings.
- Why classification matters. Conservation actions often need to preserve both partners of a mutualism - saving only the fig tree without the fig wasp condemns both. Commensal pairs are robust because the indifferent partner doesn't need the beneficiary at all.
- Edge case. Same pair can shift category depending on context. Bee + flower in a normal year is mutualism; in a year of nectar shortage with no pollination return, the bee may visit without pollinating (commensal-leaning toward parasitism).
- Note. Some textbooks list only two positive interactions (mutualism, commensalism) and treat proto-cooperation as facultative mutualism. Both formulations are accepted answers.
Why this matters. Positive interactions explain many ``impossible'' ecological feats - bare rocks colonised by lichens, nitrogen-poor soils enriched by Rhizobium, dark forest floors fed by mycorrhizal networks. These interactions stabilise communities and accelerate succession.
Mutualism (both gain, often obligate); Commensalism (one gains, one indifferent); Proto-cooperation (both gain but facultative).
In an aquarium two herbivorous species of fish are living together and feeding on phytoplankton. As per the Gause's Principle, one of the species is to be eliminated in due course of time, but both are surviving well in the aquarium. Give possible reasons.
Concept used. Gause's Competitive Exclusion Principle (1934) states that two species competing for exactly the same limiting resource cannot coexist indefinitely - one will be eliminated. The principle assumes (i) the resource is limiting, (ii) the two species' niches overlap completely, (iii) the environment is constant. If any assumption fails, coexistence is possible. The chapter discusses three escape routes: resource partitioning, niche differentiation and spatial/ temporal separation.
- Why both species survive - possible reasons.
- Resource partitioning. Although both feed on phytoplankton, they may pick different sub-types (one prefers diatoms, the other prefers cyanobacteria), splitting the same resource into non-overlapping fractions.
- Spatial separation in the aquarium. One species may feed predominantly in the upper water column (near the surface where light favours green algae); the other may feed near the bottom (where settled or shaded phytoplankton dominate).
- Temporal separation. One species may feed during the day, the other at dusk/night, reducing direct overlap.
- Different feeding behaviour or size. Different mouth size and gill-raker spacing let each fish capture phytoplankton of different size ranges.
- Plentiful resource. If phytoplankton is being continuously regenerated (aerated, lit aquarium with regular feeding), the resource may never become limiting - and Gause's principle only operates when the resource is limiting.
- Stable/benign environment. Aquaria are buffered (temperature, pH, dissolved oxygen kept stable). Stress that would normally tilt competition toward the better-adapted species is absent.
- Conclusion. Any one of the above (or a combination) breaks one of Gause's assumptions, allowing both species to coexist.
Both species coexist because Gause's assumptions are violated - through resource partitioning, spatial or temporal separation, abundant non-limiting food, or a stable aquarium environment.
Strategic angle. Gause's principle has hidden assumptions: limiting resource, complete niche overlap, constant environment. Identify which assumption the aquarium violates, and the answer writes itself.
- Recap Gause. Two species competing for the same limiting resource cannot coexist in the long run. One must go extinct (competitive exclusion).
- What can rescue coexistence?
- Resource is not limiting - abundant phytoplankton in a well-fed tank.
- Niches not fully overlapping - different phytoplankton sub-types or sizes consumed.
- Spatial niche separation - top vs bottom feeders.
- Temporal niche separation - day vs night feeders.
- Apply to the aquarium.
- Aquaria are typically over-supplied with food (the hobbyist adds flakes regularly). Phytoplankton is non-limiting.
- Stable temperature, pH and oxygen mean neither species is stressed; both maintain steady birth rates.
- Even slight spatial preferences (mid-water vs bottom) keep the two species effectively foraging in different micro-habitats.
- Connection to MacArthur's warblers. The same logic explains how five Dendroica warbler species coexist in North American conifers: each feeds at a different height and on a different branch zone. Gause's principle is intact because each species has its own micro-niche.
- Generalisation. ``Two species can coexist if and only if they avoid competing for exactly the same limiting resource.'' This single sentence resolves apparent contradictions to Gause.
- Aquarium summary table.
- Resource overlap: partial → coexistence possible.
- Resource scarcity: non-limiting → coexistence possible.
- Environment: stable → neither species pushed out.
Why this matters. The same logic underlies fishery management: stocking two herbivorous carp species (silver carp + catla) in the same pond works because their feeding zones differ - silver carp at surface, catla in mid-water. Gause's principle does not forbid coexistence; it forbids identical niches.
Aquarium conditions break Gause's assumptions: phytoplankton is over-supplied (non-limiting), the two species occupy slightly different sub-niches (size, depth, time), and the environment is buffered; so both species persist.
While living in and on the host species, the animal parasite has evolved certain adaptations. Describe these adaptations with examples.
Concept used. A parasite lives in (endoparasite) or on (ectoparasite) a host, drawing nutrition at the host's expense (sign - for host, + for parasite). Because the host environment is biologically rich but defensively hostile (immune attacks, gut peristalsis, grooming), endoparasites in particular have evolved a suite of specialised adaptations - many involving loss of structures no longer needed inside a host.
- Morphological adaptations (mostly loss of organs).
- Loss of sense organs - eyes, antennae, statocysts are useless inside a host's gut. Tapeworms and flukes have no eyes.
- Loss of digestive system. Tapeworms (Taenia solium) absorb pre-digested nutrients directly through their body wall; no mouth, no gut.
- Adhesive/attachment organs. Scolex of tapeworm bears hooks and suckers; flukes have oral and ventral suckers; head lice have grasping claws; ticks have a barbed hypostome.
- Thick cuticle/tegument. Resists host digestive enzymes (e.g. Ascaris has a tough cuticle that survives stomach acid).
- Anaerobic respiration. The host gut is low in oxygen; endoparasites have shifted to fermentation pathways.
- Reproductive adaptations.
- Hermaphroditism - most flatworm parasites are hermaphrodites, so a single individual in a host can self-fertilise.
- High fecundity. Ascaris female can lay 200,000 eggs/day. Most eggs die in the external environment; high output compensates.
- Resistant eggs and cysts. Tough shells survive desiccation, gut transit and even disinfection; cysts can wait years for a new host.
- Multiple hosts in life cycle. Plasmodium alternates between mosquito and human; Taenia alternates between pig (cyst) and human (adult worm).
- Physiological/biochemical adaptations.
- Resistance to host immune attack - surface antigen switching (Trypanosoma, Plasmodium), molecular mimicry of host molecules.
- Secretion of anti-coagulants by blood feeders (e.g. leeches secrete hirudin).
- Take-away. Parasitic life is paradoxical: it involves both extreme simplification (loss of unused organs) and extreme specialisation (attachment, immune evasion, multi-host cycles).
Loss of sense organs and gut; attachment organs (suckers, hooks); thick cuticle; anaerobic respiration; high fecundity; hermaphroditism; resistant eggs/cysts; multiple hosts in life cycle; immune evasion.
Strategic angle. Group adaptations under three headings - morphological, reproductive, physiological - and give one or two named examples in each.
- Morphological - what is lost and what is gained.
- Lost: eyes, locomotory organs, gut (in tapeworms), nervous system simplification.
- Gained: suckers, hooks, anchors (scolex of tapeworm); barbed mouthparts (ticks); thick cuticle (Ascaris).
- Why lose structures? Inside a host's gut there is nothing to see, no need to swim, and digestion is already done. Selection favours individuals that don't waste energy building useless organs.
- Reproductive adaptations driven by transmission
bottleneck.
- Few offspring reach a new host. Compensate by producing many - Ascaris female lays 200,000 eggs/day.
- Self-fertilising hermaphroditism guarantees fertilisation even when only one parasite is present in a host (most parasitic flatworms).
- Resistant cysts and eggs survive months outside a host.
- Physiological adaptations.
- Anaerobic metabolism in the low-O2 gut.
- Surface coats that switch antigens to evade immunity (Trypanosoma's VSG coat).
- Anti-coagulants in blood feeders (leech hirudin).
- Worked example - Taenia solium.
- No mouth or gut - absorbs nutrients across the tegument.
- Scolex has four suckers and a rostellum with hooks to anchor in the intestinal wall.
- Hermaphrodite proglottids - self-fertilises.
- Multi-host cycle: pig (cysticercus) → human (adult tapeworm).
- Worked example - Pediculus humanus (head
louse, ectoparasite).
- Claws grasp hair shafts.
- Mouthparts pierce skin and suck blood.
- Reduced wings - flightless.
Why this matters. The same suite of adaptations recurs in unrelated parasite lineages - convergent evolution. Recognising the pattern lets you predict parasite biology even from species you've never studied.
Loss of sense organs and gut; attachment hooks/suckers; thick cuticle; anaerobic metabolism; hermaphroditism + high fecundity; resistant cysts/eggs; immune evasion. Examples: Taenia (endo), Pediculus (ecto).
Do you agree that regional and local variations exist within each biome? Substantiate your answer with suitable example.
Concept used. A biome is a large climatic–vegetation zone defined by mean annual temperature and precipitation (rainforest, savanna, desert, temperate forest, taiga, tundra). Within any biome, however, fine variations in topography, soil type, altitude, latitude and human history create regional (landscape-scale) and local (micro-habitat-scale) differences in species and community structure. So yes - regional and local variation are universal inside every biome.
- Why variation arises.
- Topography. Slope, aspect (north-facing vs south-facing), drainage and altitude alter temperature, moisture and light at sub-biome scale.
- Soil. Sandy, clayey, lateritic, alluvial, alkaline soils differ within a biome. Plants tuned to each soil type form different communities.
- Latitude inside the biome. The same biome at its equatorward edge differs from the same biome at its poleward edge.
- Disturbance history. Fire, flood, grazing and human cultivation create patchy successional stages.
- Example 1 - tropical rainforest biome.
- Amazon basin (South America): dominated by Bertholletia (Brazil nut), Hevea (rubber); home to jaguars and harpy eagles.
- Congo basin (central Africa): dominated by different tree species (Aucoumea, Khaya mahogany); home to forest elephants and gorillas.
- Western Ghats of India: smaller-scale wet evergreen forest with Dipterocarpus, Hopea; lion-tailed macaque, Nilgiri tahr.
- Borneo and New Guinea: dipterocarp giants with orangutans and birds of paradise.
- Example 2 - desert biome.
- Sahara (Africa): sand desert; succulents are rare; fennec fox, dromedary camel.
- Thar (India–Pakistan): more shrubby; Acacia tortilis, Calotropis; chinkara, blackbuck.
- Sonoran (USA–Mexico): true cactus desert; iconic saguaro cactus; roadrunner, rattlesnake.
- Example 3 - local variation inside one Indian forest. Within the Sundarbans mangrove ecosystem, the seaward edge has Avicennia (high salt tolerance), the mid-tide zone has Rhizophora, and the landward edge merges into Heritiera (Sundari) - three distinct community zones within 200 m of coast, all inside one mangrove biome.
- Conclusion. Biomes are useful generalisations but gloss over enormous internal heterogeneity. Conservation planning must work at the regional and local scale, not just the biome scale.
Yes - regional (Amazon vs Congo vs Western Ghats) and local (mangrove tidal zones) variations exist inside every biome because topography, soil, latitude and disturbance vary at sub-biome scale.
Strategic angle. Start with a clear ``yes''. Then give two examples - one showing inter-continental regional variation in the same biome (rainforest in Amazon vs Congo) and one showing local variation inside an Indian biome (Sundarbans tidal zones).
- Yes, variation is universal. Biomes are climate- defined; species composition responds to many other factors on top of climate.
- Regional example. The tropical rainforest biome
looks the same on a climate map but its species composition
differs across continents:
- Amazon: Brazil nut tree, jaguar, three-toed sloth.
- Congo: forest elephant, gorilla, okapi.
- Indo-Malayan (Borneo): orangutan, dipterocarp giants.
- Local example. Within Indian forests, walk 500 m from a hilltop to a streamside in the same district: the tree species, undergrowth, butterflies and birds all shift. Soil moisture and slope changes drive this.
- Mechanisms.
- Soil: laterite vs alluvium vs sand.
- Drainage: dry ridge vs wet hollow.
- Aspect: north-facing (cooler) vs south-facing (warmer).
- Fire history: recently burnt patches harbour pioneer species; long-unburnt patches reach climax.
- Conservation implication. Saving only one tract of ``tropical rainforest'' does not save all rainforest species - each region has unique endemics. Hence India's protected- area network covers multiple geographic units, not just one biome.
- Reading the textbook map. The chapter's biome map shows broad colour bands; do not be misled into thinking all of one colour is biologically identical.
Why this matters. Biome thinking is useful for global climate modelling; species-level conservation needs sub-biome resolution. The two scales complement each other.
Yes - every biome shows regional variation (Amazon vs Congo rainforest) and local variation (Sundarbans tidal zones).
Which element is responsible for causing soil salinity? At what concentration does the soil become saline?
Concept used. Soil salinity is the build-up of soluble salts (chiefly sodium chloride, NaCl, plus sulphates and carbonates of Na, Mg, Ca) in the upper soil profile. The principal culprit ion is sodium (Na+), usually paired with chloride. A soil is classified as saline once its electrical conductivity (EC) of the saturation extract exceeds 4 dS/m at 25 C, corresponding to a soluble-salt content of roughly 0.1% (1 g salt per 100 g dry soil).
- Element responsible. Sodium (Na+), typically deposited as NaCl. Other contributors: Mg2+, Ca2+, Cl-, SO42-, HCO3-. Sodium is highlighted because it also damages soil structure (deflocculation of clay).
- Threshold concentration.
- Conductivity criterion: EC > 4 dS/m (4 mmhos/cm).
- Salt-mass criterion: total soluble salts > 0.1% (≥ 1 g salt/100 g soil).
- Plant-physiology criterion: above this, most crop species (wheat, paddy, tomato) suffer yield loss from osmotic stress and Na toxicity.
- Sources of salinity in Indian context.
- Coastal inundation (Sundarbans, Gulf of Kutch).
- Excessive irrigation followed by evaporation leaves salt deposits at the surface - a major problem in canal-irrigated Punjab and Haryana.
- Capillary rise of saline groundwater in arid zones.
- Plant response. Only halophytes can tolerate > 0.1% salt (Salicornia, Atriplex, Suaeda, mangroves). Most crops are glycophytes and suffer beyond this threshold.
Sodium (chiefly as NaCl) is the responsible element. Soil is classified saline when EC > 4 dS/m, i.e. total salts above ∼ 0.1%.
Strategic angle. Two sub-questions: (i) the element, (ii) the threshold. Answer both crisply with numbers.
- Element. Sodium, deposited as NaCl (sometimes with sulphates).
- Threshold (two equivalent statements).
- Electrical conductivity (EC) of the saturation extract > 4 dS/m.
- Soluble-salt mass > 0.1% of dry soil mass.
- Why it matters. Above this, crops suffer osmotic stress (water cannot enter roots) and ion toxicity (excess Na inside cells disrupts enzyme function).
- Conversions. 1 dS/m ≈ 640 ppm dissolved salt ≈ 0.064%. So 4 dS/m≈ 2560 ppm ≈ 0.256% in solution but ≈ 0.1% on dry-soil basis (because the extract is more concentrated than the bulk soil water).
- Remediation. Saline soils are reclaimed by leaching with good-quality irrigation water (washes salts down the profile) and gypsum addition (Ca2+ displaces adsorbed Na+, then leaches away).
- India-specific. Reh (a powdery white salt efflorescence on Indo-Gangetic plains) is a classic visible sign of Na-dominated salinity, common in Uttar Pradesh, Punjab and Haryana under canal irrigation.
Sodium (as NaCl); soil is saline above EC 4 dS/m, i.e. > 0.1% salt by dry mass.
Connection to wider chapter. The point this question makes is reinforced elsewhere in the chapter: the same prefix and sign- table logic recurs in the MCQ block, the SA block on inter-specific interactions, and the LA discussion of population growth. Building this vocabulary once and reapplying it across question types is the fastest way to clear an Exemplar chapter at speed.
Practice cue. If a similar question appears in the board paper or NEET, restate the definition in one sentence, anchor it with one named Indian-context example, then commit to the option. Avoid second-guessing once the prefix or sign-table has been decoded - the chapter is designed so that a single decoding step selects the answer.
Does light factor affect the distribution of organisms? Write a brief note giving suitable examples of either plants or animals.
Concept used. Light is a fundamental abiotic factor: plants need it for photosynthesis; animals use it to time daily and seasonal activity (photoperiodism), to find food and mates, and to navigate. The intensity, duration and spectral quality of available light vary with latitude, altitude, depth (in water), tree canopy and time of day. Each of these gradients filters the species that can live there.
- Light affects plant distribution.
- Heliophytes vs sciophytes. Sun-loving plants (sunflower, Tridax) need full sunlight and cannot survive under dense canopy. Shade-loving plants (ferns, Begonia, Oxalis, money plant) need diffuse light and wilt in direct sun.
- Vertical stratification in forests. Tall trees control canopy light; smaller trees, shrubs and herbs adapt to progressively dimmer light below. Each layer holds a different assemblage.
- Underwater stratification. Red light is absorbed first; blue penetrates deepest. Deep-water algae (red algae like Polysiphonia, Gelidium) have accessory pigments (phycoerythrin) that capture blue light. Shallow- water algae (Ulva, green algae) work fine with red.
- Photoperiodism in flowering. Some plants require short days to flower (Chrysanthemum, rice, cotton - short-day plants); others need long days (spinach, lettuce - long-day plants). Daylength varies with latitude and season, restricting where each species can flower successfully.
- Light affects animal distribution and behaviour.
- Diurnal vs nocturnal niches. Light splits the 24-hour cycle into two niches: diurnal (eagles, butterflies, humans) hunt by day; nocturnal (owls, bats, leopards) hunt by night. Cave-dwelling animals (Proteus salamander) have lost eyes altogether.
- Bioluminescence in the deep sea. Below ∼ 1000 m no sunlight penetrates; many deep-sea fish produce their own light (anglerfish, lanternfish) to attract prey or mates. These species are strictly limited to the dark zone.
- Migration cued by photoperiod. Many birds (Siberian crane, Arctic tern) time their migration by daylength. Distribution shifts seasonally between breeding and wintering grounds.
- Reproductive timing. Many fish, frogs and insects synchronise spawning to photoperiod cues - populations breed only where the right daylength pattern occurs.
- Conclusion. Light intensity, daylength and spectral quality each impose distinct distribution limits. No major group of organisms is independent of light.
Yes - light intensity (heliophytes vs sciophytes; canopy stratification; deep-sea algae), photoperiod (flowering time, bird migration) and spectral quality (red vs blue underwater) all shape distribution of plants and animals.
Strategic angle. Three dimensions of light - intensity, duration, quality - each map onto distinct distribution patterns. Cover at least two with one named example each.
- Intensity.
- Helio/scio split among plants.
- Canopy stratification: tall trees dominate the light supply; shrubs and herbs adjust.
- Underwater: red-algae versus green-algae depth zonation.
- Duration (photoperiod).
- Short-day plants (rice, Chrysanthemum) only flower where autumn daylengths are short.
- Long-day plants (spinach) only flower where summer daylengths are long.
- Bird migration timed by daylength.
- Quality (spectral composition).
- Phycoerythrin in red algae captures the blue/green light that reaches 30–100 m underwater.
- Bioluminescence in deep-sea fish.
- Examples mixed. Tridax (heliophyte weed), Pteris fern (sciophyte indoor), Polysiphonia (deep red alga), Siberian crane (photoperiod-cued migrant).
- Conclusion. Yes, light is a major distribution filter at every scale from a single forest to the entire ocean column.
- Cross-link. See SA Q4 for heliophyte/sciophyte and SA Q5 for underwater light attenuation.
Why this matters. Designing a botanic garden or an aquarium requires matching plants to the local light environment. The same logic explains why deforestation collapses understorey species first - once the canopy goes, the shade vanishes.
Yes - light intensity, photoperiod and spectral quality each shape distribution; examples include heliophyte/sciophyte split, canopy stratification, and Siberian crane migration.
Cross-reference within the chapter. The principle invoked here is also used in the long-answer questions on community interactions and on growth curves. Recognising the same idea recycled across question types saves time on the Exemplar paper.
Take-away for revision. Note the named example used above in your formula sheet under ``Organisms and Populations''. The chapter's MCQs, VSAs and SAs repeatedly draw from a small canonical list of Indian-context examples - committing those to memory pays back across every section.
Where this fits in the chapter map. This idea sits at the intersection of the ``abiotic factors → organismic responses'' and ``population attributes → growth models'' threads. The sign-table for interactions, the four response modes (regulate, conform, migrate, suspend) and the two growth-curve shapes (J and S) are the chapter's three pillars; every Exemplar question is a variation on one of them.
Speed tactic. When a similar Exemplar question appears, identify which pillar it belongs to first - that immediately narrows the vocabulary and the canonical example set you need to draw on. The actual answer then falls out in a single line of reasoning.
Give one example for each of the following:
(i) Eurythermal plant species (ii) A hot water spring organism (iii) An organism seen in deep ocean trenches
(iv) An organism seen in compost pit (v) A parasitic angiosperm (vi) A stenothermal plant species
(vii) Soil organism (viii) A benthic animal (ix) Antifreeze compound seen in antarctic fish (x) An organism which can conform
Concept used. Each sub-question names an ecological category or adaptation; one named organism (or compound) per item is enough. Use the chapter's terminology for stenothermal/eurythermal, extremophile and benthos.
- (i) Eurythermal plant species. Tolerates a wide temperature range. Example: Zea mays (maize) - grown from tropical India to temperate Canada. Alternative: sunflower, eucalyptus.
- (ii) Hot water spring organism. Lives at > 70 C. Example: Thermus aquaticus (the bacterium that gave us Taq polymerase, from Yellowstone hot springs). Indian analogue: cyanobacteria of Tatapani springs. Pyrococcus and Sulfolobus archaea are also acceptable.
- (iii) Organism in deep-ocean trenches. Lives at > 6000 m, in cold high pressure. Example: deep-sea anglerfish (Melanocetus), giant tube worms (Riftia pachyptila) at hydrothermal vents, or the snailfish Pseudoliparis swirei from the Mariana Trench.
- (iv) Organism in compost pit. Decomposes organic matter. Examples: Earthworms (Eisenia foetida in vermicomposting), Aspergillus fungi, actinomycetes, bacteria of genus Bacillus.
- (v) Parasitic angiosperm. A flowering plant that parasitises another plant. Example: Cuscuta (dodder) - total stem parasite; Rafflesia - total root parasite with the largest flowers in the plant kingdom; Orobanche - total root parasite; Viscum (mistletoe) - partial stem parasite.
- (vi) Stenothermal plant species. Tolerates only a narrow temperature range. Example: orchids of cloud forests (Dendrobium of Himalayan slopes), coffee plant (Coffea arabica - narrow 18–24 C optimum), apple, cardamom.
- (vii) Soil organism. Lives in soil. Example: earthworm (Pheretima posthuma), springtails (Collembola), mites (Acari), nematodes (Caenorhabditis), soil bacteria (Nitrosomonas).
- (viii) Benthic animal. Lives on or in the sea floor. Example: Starfish (Asterias), sea cucumber (Holothuria), oyster (Crassostrea), crab.
- (ix) Antifreeze compound in Antarctic fish. Glycoproteins called antifreeze glycoproteins (AFGPs) - discovered in Trematomus and Dissostichus Antarctic icefishes. They bind to nascent ice crystals and prevent them from growing, keeping blood liquid below the normal freezing point.
- (x) Conformer. An organism whose internal state tracks the external environment instead of regulating. Example: Frog (body temperature varies with surroundings - ectotherm + osmoconformer in fresh water); most marine invertebrates (sponges, jellyfish, marine worms, sea anemones) are osmoconformers.
(i) Maize (ii) Thermus aquaticus (iii) Giant tube worm Riftia or deep-sea anglerfish (iv) Earthworm / Aspergillus (v) Cuscuta / Rafflesia (vi) Coffee plant / orchid (vii) Earthworm Pheretima (viii) Starfish (ix) Antifreeze glycoproteins (AFGPs) (x) Frog (ectothermic) / most marine invertebrates.
Strategic angle. For a ``give one example'' question, the safest pick is the textbook's canonical example. List one and move on; multiple synonyms (where given above) are bonus.
- Eurythermal plant - maize (Zea mays); grows 10–35 C.
- Hot-spring - Thermus aquaticus; lives at 70–80 C.
- Deep trench - Riftia tube worms at hydrothermal vents; live by sulphur-chemosynthetic symbionts.
- Compost - earthworm + Aspergillus.
- Parasitic angiosperm - Cuscuta (no chlorophyll, twines around hosts).
- Stenothermal plant - coffee (narrow 18–24 C).
- Soil - earthworm Pheretima.
- Benthic - starfish.
- Antifreeze - antifreeze glycoproteins in Antarctic icefish.
- Conformer - frog (body temperature conforms to environment).
Why this matters. Each example is a representative of a broader category. Knowing the canonical pick for each one lets you answer ``name an organism that lives in X'' without re-thinking.
See worked list above.
Linking to the rest of the syllabus. The same logic applies in Ecosystem (Chapter 12 in the 2026-27 syllabus) where energy flow and nutrient cycling depend on the species-level interactions discussed here, and in Biodiversity & Conservation (Chapter 13) where the conservation of mutualisms and pollinators is a recurring theme.
Recommended practice. Re-read the chapter table of positive interactions and run through one named Indian-context example for each. The Exemplar deliberately tests examples (not just definitions), so a handful of well-chosen examples per category is the most efficient revision strategy.
Why the chapter keeps returning to this idea. The Exemplar is structured so that each MCQ, VSA, SA and LA tests the same small set of core ideas at increasing depth. This question is one such variant; mastering the underlying principle once unlocks several other questions in the chapter.
Revision tip. Pair every definition you encounter in this chapter with one named Indian example (e.g. Sundarbans for mangroves, Western Ghats for biodiversity hotspot, Cuscuta for a parasitic angiosperm). The Exemplar examiners reward example- backed answers over bare definitions.
NCERT Exemplar Solutions for Class 12 Biology: All Chapters
| Chapter | Exemplar Solutions Link |
|---|---|
| Chapter 1 | Sexual Reproduction in Flowering Plants Exemplar Solutions |
| Chapter 2 | Human Reproduction Exemplar Solutions |
| Chapter 3 | Reproductive Health Exemplar Solutions |
| Chapter 4 | Principles of Inheritance and Variation Exemplar Solutions |
| Chapter 5 | Molecular Basis of Inheritance Exemplar Solutions |
| Chapter 6 | Evolution Exemplar Solutions |
| Chapter 7 | Human Health and Disease Exemplar Solutions |
| Chapter 8 | Microbes in Human Welfare Exemplar Solutions |
| Chapter 9 | Biotechnology Principles and Processes Exemplar Solutions |
| Chapter 10 | Biotechnology and Its Applications Exemplar Solutions |
| Chapter 11 | Organisms and Populations Exemplar Solutions |
| Chapter 12 | Ecosystem Exemplar Solutions |
| Chapter 13 | Biodiversity and Conservation Exemplar Solutions |
Student Feedback on Chapter 11 Organisms and Populations from a Class 12 Biology Survey
In an independent survey of 11,300 Class 12 Biology students, the logistic-growth equation came out as the hardest part of the chapter. Use this quick read to plan where your revision time should go.
Student Feedback
- 70% of students marked the logistic-growth equation derivation as the hardest sub-topic.
- 59% lost 1-2 marks classifying mutualism, commensalism, predation and parasitism examples.
- 4 out of 5 students said the age-pyramid figure was the one they skipped most in answer sheets.
- Only 39% attempted all 16 NCERT exercise questions; toppers reported solving every one and revisiting wrong attempts within 24 hours.
Source: Class 12 Biology student survey, 11,300 students from CBSE-affiliated schools across 18 states.
Frequently Asked Questions on Organisms and Populations Class 12 Biology Exemplar Solutions
How many problems does the NCERT Exemplar Class 12 Biology Chapter 11 contain?
The Exemplar carries 51 problems split across 17 MCQ items, 18 Very Short Answer (VSA), 11 Short Answer (SA), and 5 Long Answer (LA) questions, every one of them answered in this Collegedunia PDF with full reasoning and an Expert's Solution.
Are the Class 12 Biology Chapter 11 Exemplar Solutions enough for NEET?
Yes for sign-pair recall and growth-curve numericals, which is where 70% of the chapter's NEET MCQs come from. The Exemplar locks the six sign-pairs and the logistic equation. Pair it with the last five years of NEET papers for assertion-reason items.
Is Organisms and Populations still part of the 2026-27 NCERT syllabus?
Yes. The 2026-27 NCERT retains the chapter in full as Chapter 11 (renumbered from old Chapter 13). All seven sub-topics on abiotic factors, organismic responses, adaptations, population attributes, growth models and interspecific interactions are examinable, so every Exemplar problem on this page is in scope.
Which is the most asked Exemplar question type in Organisms and Populations?
Very Short Answer (VSA) items dominate at 18 of 51 problems, mapping directly onto the 1-mark and 2-mark CBSE patterns. Within VSA, sign-pair recall and Allen's rule / Gause's principle are the two highest-frequency topics.
How is the Exemplar harder than the NCERT textbook for this chapter?
The textbook asks "define commensalism", the Exemplar asks "why is the orchid on the mango not parasitic" (mechanism). For population growth: NCERT asks to write the logistic equation, Exemplar asks to interpret the (K-N)/K bracket. The step-up is from recall to reasoning, the same step-up NEET expects.
Can I download the Organisms and Populations Exemplar Solutions PDF for free?
Yes, the full PDF is free to download from the card above. It covers all 51 problems, includes the Expert's Solution after every question, and is mapped to the 2026-27 NCERT chapter for Class 12 Biology Chapter 11.
What is the difference between mutualism and commensalism, asked in the Exemplar?
Mutualism is +/+: both species benefit (lichen, mycorrhiza, Ficus-fig wasp). Commensalism is +/0: one species benefits while the other is unaffected (cattle egret + cattle, orchid on mango). NEET sets one MCQ on this distinction every cycle, and the Exemplar trains the sign-pair recall directly.


Comments