


Stanford University acceptance rate is quite competitive. Each year, the university receives a huge number of applications. There are a total of 7 schools at Stanford University namely Business, Doerr School of Sustainability, Education, Engineering, Humanities and Sciences, Law and Medicine. Let's explore the acceptance rates of the schools at Stanford University. Below is an overview of the total applications received each year by these schools and the percentage of admitted students.
|
Table of Contents |
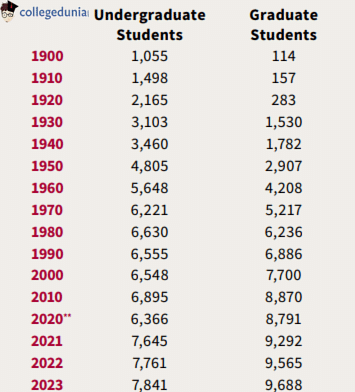
Stanford University Student Enrollment
This table showcases the facts on the student body at Stanford University.
| Undergraduate students | 7,841 |
| Graduate students | 9,688 |
| Countries represented | 76 countries + 49 states |
| International students | 15% |
Source: Stanford-FactBook2024
Stanford University Acceptance Rate: MBA
The MBA Class of 2025 originates from various corners of the globe. With 36% of the class comprising international students, they come from 55 diverse countries worldwide. The acceptance rate for Stanford University's MBA program is approximately 6.97% for the class of 2025. Out of a total of 6,190 applicants, 431 were admitted.
Class Profile 2025
| International students | 36% |
| Women | 46% |
| Average GPA | 3.77 |
| Average Work Experience | 5 years |
| Average TOEFL | 113 |
| Average GMAT | 738 |
| Average GRE | Verbal: 164 | Quantitative: 164 |
Note: There is no preference between GMAT and GRE at Stanford University. 61% of the students submitted GMAT scores and 39% submitted GRE scores. However, some preferred submitting scores from both tests. There is no minimum GMAT or GRE score requirement.
Stanford University Acceptance Rate: Law
Stanford Law School receives approximately 4,500 total applications every year, from all over the world. The acceptance rate for Stanford University's law program is approximately 6.88% for the class of 2025.
Class Profile 2025
| GPA Range | 3.19 to 4.16 |
| LSAT Range | 161 to 180 |
Stanford University Acceptance Rate for Masters of Science
The admission statistics for the Master of Science (MS) program at Stanford University demonstrate the competitive nature of the admissions process over the past three years. The acceptance rates from 2022 to 2024, indicate variations in the competitiveness of the application pool and the evolving standards of selection.
Here is the presentation of the MS admission statistics for the years 2022, 2023, and 2024:
| Criteria | 2024 | 2023 | 2022 |
|---|---|---|---|
| MS applicants admitted | 5.5% | 8.5% | 8% |
The acceptance rate for Stanford University's MS program is approximately 5.5% for the class of 2024.
Stanford University Acceptance Rate: Medicine
Medicine is one of the popular programs at Stanford University. The total number of applications received last year was 8,837, out of which 498 students got the chance to sit for interviews.
Here is the class profile of last year's entering class for MD:
| Class Size | 89 |
| MCAT 25th to 75th Percentile Range | 516-522 |
| Median MCAT | 519 |
| International Students | 9% |
| Women | 50.6% |
| Percentage of MD Students Receiving Financial Aid | 85.9% |
Stanford University Admission Decision
This table outlines the key events and deadlines for the application process at Stanford University for first-year applicants.
| Event | Early Action | Regular Decision |
|---|---|---|
| Standard Application Deadline | November 1 | January 5 |
| Notification of Missing Documents | Mid-November | Mid-February |
| Decision Released By | Mid-December | Early April |
| Student Reply Date | May 1 | May 1 |
It is important to note that the admission decision dates vary for the graduate program you applied to. The university will communicate the admission decision to the students according to each program’s notification timeline.
Stanford University Acceptance Rate vs Harvard University Acceptance Rate
The acceptance rate at Stanford University ranges from 5.5% to 7%, varying according to the program. In contrast, Harvard University acceptance rate for the class of 2027 is 3.45%. Out of a total of 56,937 applicants for the class of 2027, only 1,966 students were admitted.
To secure a seat at Stanford University, international students are required to submit all the documents necessary for admission. Always keep a check on the application deadline and perform well in the interview. The university accepts students from all over the world, encompassing all ethnicities. For the class of 2027, there is a total of 50% women and 50% men at Stanford University, showcasing gender balance.
FAQs
Ques. Is it hard to get accepted to Stanford?
Ans. Yes, It is challenging to get accepted into Stanford University. The acceptance rate of Stanford by programmes is as follows:
- The MBA program at Stanford University has an acceptance rate of roughly 6.97% for the class of 2025.
- For the class of 2025, Stanford University's law program has an acceptance rate of 6.88%.
- For the class of 2024, Stanford University's MS program acceptance rate is 5.5%.
Ques. Is Stanford harder than Harvard?
Ans. Stanford University acceptance rate ranges from 5.5% to 7% for very competitive programs. Acceptance rates at Stanford differ based on the program. However, Harvard University acceptance rate for the class of 2027 is 3.45%. A total of 56,937 applications were made for the class of 2027, out of which only 1,966 students were admitted.
Ques. What GPA is required for Stanford?
Ans. A cumulative 3.5 GPA (90%) is necessary to be considered for Stanford University's master's programmes. Stanford's GPA requirements for law range from 3.19 to 4.16. However, the GPA requirement for MBA programs is 3.77.
Ques. When are the admission decision dates for Stanford University?
Ans. The admission decision dates vary depending on the program and application type. For Early Action applicants, decisions are released by mid-December, while for Regular Decision applicants, decisions are released by early April.
Ques. How diverse is the student body at Stanford University?
Ans. Stanford University embraces diversity, with students representing 76 countries and 49 states. For the class of 2027, there is a gender balance of 50% women and 50% men.
| Undergraduate students | 7,841 |
| Graduate students | 9,688 |
| Countries represented | 76 countries + 49 states |
| International students | 15% |


Comments