
.jpeg?h=300&w=1440&mode=stretch)


MIT acceptance rate varies significantly across program levels, reflecting the institute's selectivity at each stage. The MIT undergraduate acceptance rate stands at 4.6% for the Class of 2029. However, graduate and MBA programs have different acceptance rates: 10% for graduate programs overall, approximately 4% for PhD programs, 12–15% for master's programs, and 14.8% for the MBA program at MIT Sloan. Understanding these distinctions for Massachussets Institute of Technology is crucial for prospective applicants, as each pathway presents unique competition levels and admission criteria.
Check Out: Acceptance Rate of US Universities
- MIT Undergraduate Acceptance Rate
- MIT Graduate Acceptance Rate
- MIT PhD Acceptance Rate
- MIT Master's Degree Acceptance Rate
- MIT Sloan MBA Acceptance Rate
- MIT Acceptance Rate: Undergraduate vs. Graduate vs. MBA Comparison
- MIT Undergraduate Acceptance Rate: Historical Trends
- SAT and ACT Score Ranges for MIT Admitted Students
- FAQs About MIT Acceptance Rate
MIT Undergraduate Acceptance Rate
MIT admitted 1,334 students from 29,281 undergraduate applications for the Class of 2029, resulting in a 4.6% acceptance rate. This represents one of the lowest acceptance rates in the world, reflecting MIT's position as a top-tier research institution. According to MIT Admissions, this rate is the result of a holistic admissions process that considers not just numbers, but the overall fit between applicants and the institute.
The undergraduate acceptance rate has remained consistently low over the past decade, declining from 17.7% in 2013 to 4.6% in 2029 - a 74% decrease in acceptance rate over 16 years. This trend reflects increasing global competition and MIT's growing reputation.
Check MIT Admissions Process & Eligibility
Early Action vs. Regular Decision Acceptance Rates
MIT offers Early Action (non-binding) for undergraduate applicants, which has a significantly higher acceptance rate than Regular Decision:
| Decision Plan | Applicants | Admitted | Acceptance Rate |
|---|---|---|---|
| Early Action | 12,052 | 721 | 5.98% |
| Regular Decision | 17,229 | 603 | 3.7% |
| Overall | 29,281 | 1,334 | 4.6% |
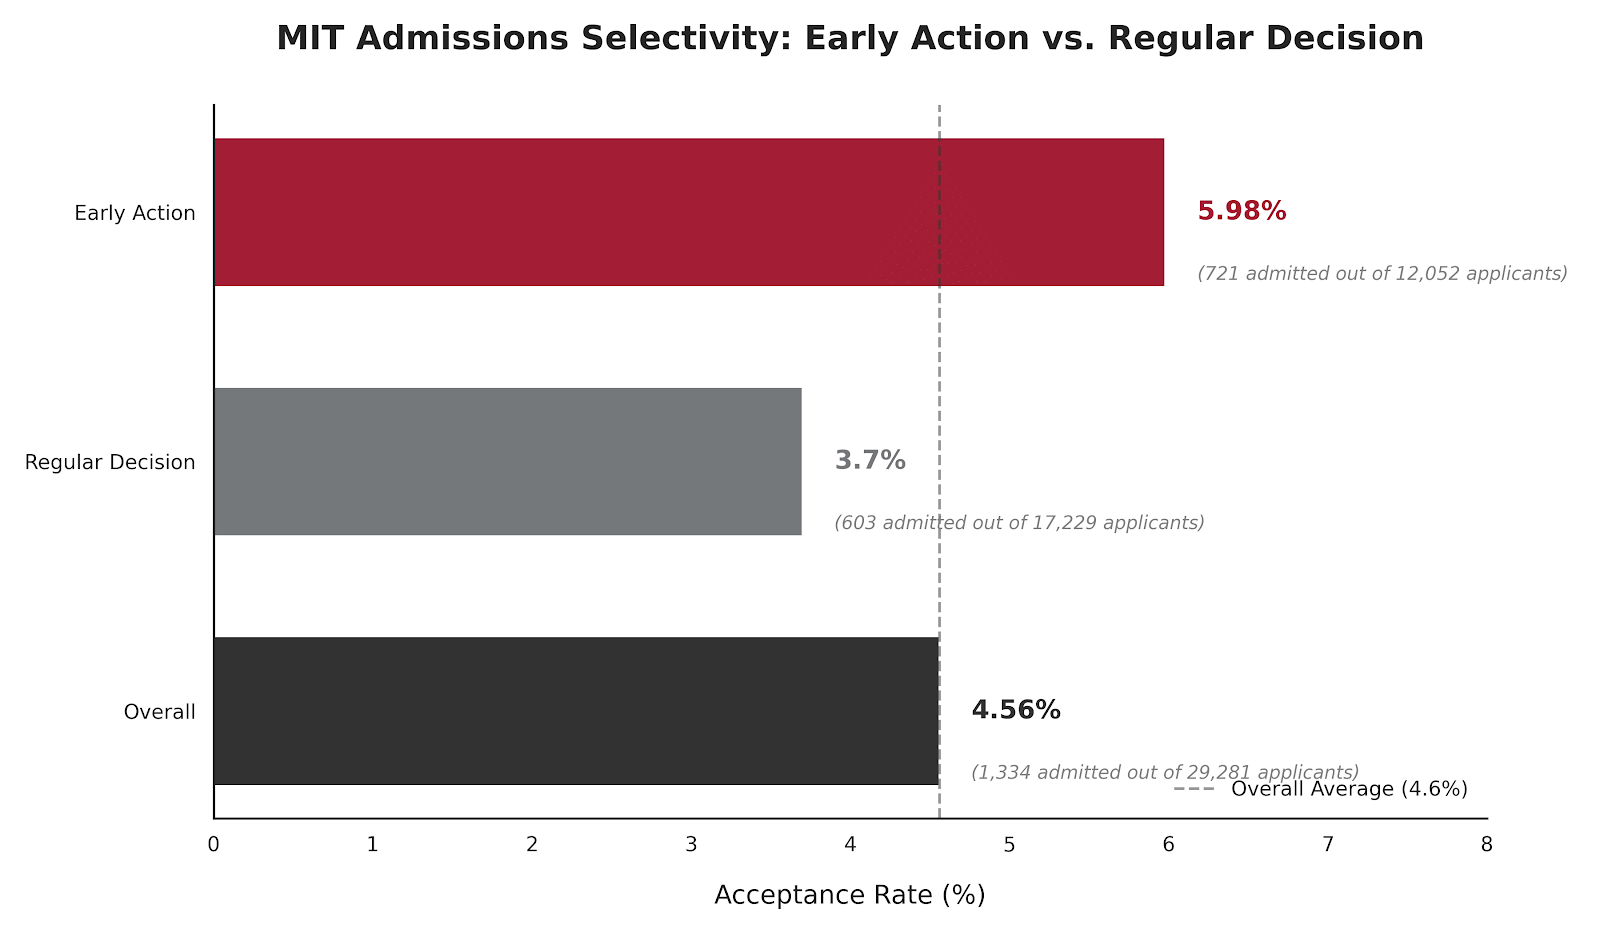
Early Action acceptance rate (5.98%) is approximately 1.6 times higher than Regular Decision (3.7%). However, 7,486 Early Action applicants were deferred to Regular Decision, and only 175 of these deferred applicants were ultimately admitted during the Regular Decision round.
MIT Undergraduate Acceptance Rate by Applicant Type
MIT's acceptance rates differ significantly based on applicant citizenship and demographics:
| Applicant Type | Applications | Admitted | Acceptance Rate |
|---|---|---|---|
| U.S. Citizens/Permanent Residents | 22,355 | 1,198 | 5.4% |
| International Students | 6,926 | 136 | 1.96% |
International students face a significantly more competitive admissions process, with an acceptance rate of just 1.96% - less than one-third the rate for U.S. citizens.
According to Reddit estimates, gender-based acceptance rates vary within these categories, with female Early Action applicants estimated at 9.7% and male Regular Decision applicants at approximately 1.4%.
MIT Undergraduate Waitlist Acceptance Rate
MIT offered 561 applicants a place on the waitlist for the Class of 2029. Of these, only 10 were ultimately admitted, resulting in a waitlist acceptance rate of 1.8%. MIT's waitlist is not ranked; instead, the admissions office reviews waitlisted applicants after May 1 to determine how many additional seats are available.
MIT Graduate Acceptance Rate
MIT graduate acceptance rate is significantly higher than its undergraduate rate. According to MIT Facts, the institute received 37,409 graduate applications for Fall 2024 and admitted 3,894 students, resulting in a 10% overall acceptance rate. Of these admitted students, 2,439 (63%) enrolled as first-year graduate students.
Graduate admissions at MIT are department-specific and highly variable. Each department evaluates applicants based on previous performance, research potential, and fit with the program. Unlike undergraduate admissions, graduate admissions emphasize research experience, academic credentials, and professional promise.
Graduate Student Demographics
| Metric | Percentage |
|---|---|
| Women | 43% |
| International Citizens | 43% |
| Countries Represented | 86 |
The graduate student body is significantly more international than the undergraduate population, with 43% of graduate students coming from 86 different countries. This reflects MIT's global reputation and the international nature of advanced research.
MIT PhD Acceptance Rate
MIT's PhD programs are among the most selective in the world, with an overall acceptance rate of approximately 4%. This rate varies significantly by department and field of study. According to academic sources, MIT PhD programs are more selective than many master's programs, reflecting the institute's emphasis on doctoral research excellence.
PhD Acceptance Rate by Department
| Department/Field | Estimated Acceptance Rate |
|---|---|
| MIT Biology | ~20% (interviewed), 80% (of interviewed) |
| Engineering PhD Programs | 3–5% |
| Science PhD Programs | 4–6% |
| Humanities/Social Sciences PhD | 5–8% |
Important Note: MIT Biology's statistics reflect a two-stage process: approximately 20% of applicants are invited for interviews, and 80% of interviewed candidates are admitted. This means the overall acceptance rate is approximately 16% (20% × 80%), but the interview stage serves as a significant filter.
PhD admissions emphasize research fit, academic preparation, and potential for original research contributions. GRE scores, academic transcripts, and letters of recommendation are critical components of PhD applications.
MIT Master's Degree Acceptance Rate
MIT's master's programs have higher acceptance rates than PhD programs, typically ranging from 12–15% depending on the specific program. Master's programs are designed for students seeking advanced technical knowledge and professional development, rather than a focus on original research.
Master's Acceptance Rate by Program
| Program | Estimated Acceptance Rate |
|---|---|
| MIT Sloan Master's Programs | ~20% |
| Engineering Master's Programs | 10–12% |
| Science Master's Programs | 8–10% |
| Architecture Master's Programs | 12–15% |
Master's programs are generally more accessible than PhD programs but remain highly selective. Admission criteria include academic credentials, professional experience, standardized test scores (GRE or GMAT), and demonstrated interest in the specific field.
MIT Sloan MBA Acceptance Rate
MIT Sloan's MBA program is one of the most selective business schools in the world. For the Class of 2027, MIT Sloan received 5,349 applications and admitted 792 candidates, resulting in a 14.8% acceptance rate. The MBA class size is approximately 450 students (including LGO—Leaders for Global Operations—students).
| Metric | Value |
|---|---|
| Total Applications | 5,349 |
| Total Admits | 792 |
| Acceptance Rate | 14.8% |
| Class Size | ~450 |
| Yield Rate | 77% |
MIT Sloan MBA Profile
Admitted MBA students typically have:
- Average GMAT Score: 720+
- Average GPA: 3.6+
- Average Work Experience: 5+ years
- Diversity: 43% international students
The MBA acceptance rate (14.8%) is higher than undergraduate (4.6%) and PhD (4%) rates but lower than master's programs (12–15%). This reflects the MBA's position as a professional degree with different admission criteria than research-focused programs.
MIT Acceptance Rate: Undergraduate vs. Graduate vs. MBA Comparison
| Program Level | Acceptance Rate | Total Applications | Total Admits |
|---|---|---|---|
| Undergraduate | 4.6% | 29,281 | 1,334 |
| Graduate (Overall) | 10% | 37,409 | 3,894 |
| PhD Programs | ~4% | Varies | Varies |
| Master's Programs | 12–15% | Varies | Varies |
| MBA (Sloan) | 14.8% | 5,349 | 792 |
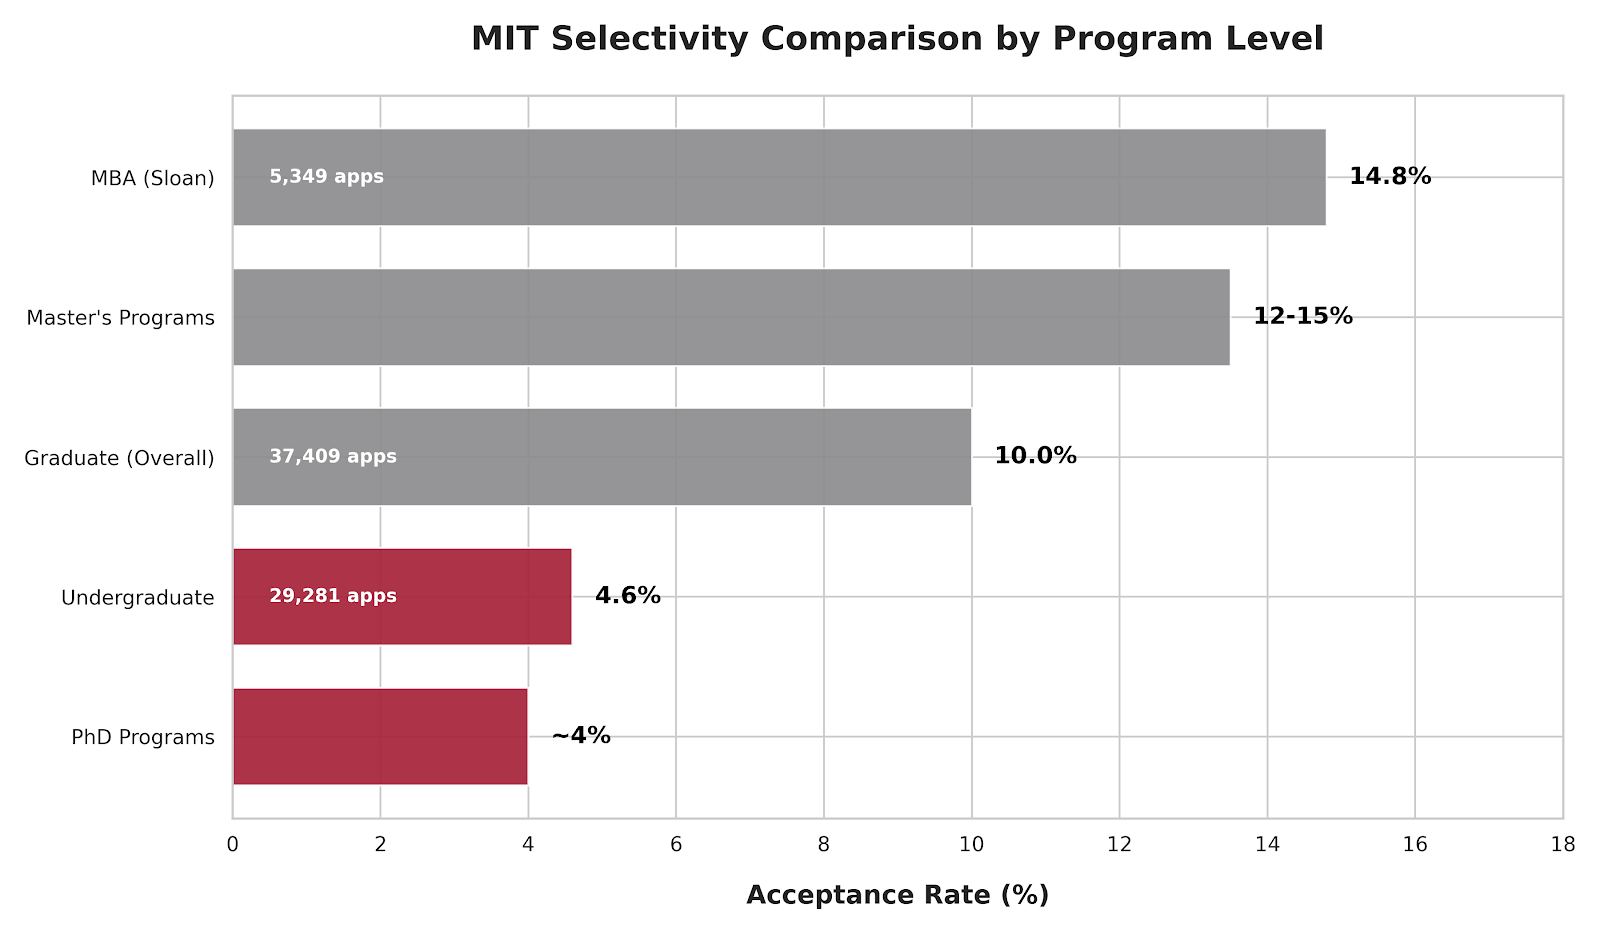
Key Insight: MIT's undergraduate program is the most selective, followed by PhD programs. Master's programs and the MBA are more accessible, though still highly competitive by global standards.
MIT Undergraduate Acceptance Rate: Historical Trends
| Class | Applications | Admits | Acceptance Rate |
|---|---|---|---|
| 2029 | 29,281 | 1,334 | 4.6% |
| 2028 | 28,500 | 1,340 | 4.5% |
| 2027 | 27,000 | 1,270 | 4.7% |
| 2026 | 26,000 | 1,480 | 5.7% |
| 2025 | 24,000 | 1,400 | 5.8% |
| 2024 | 22,000 | 1,450 | 6.6% |
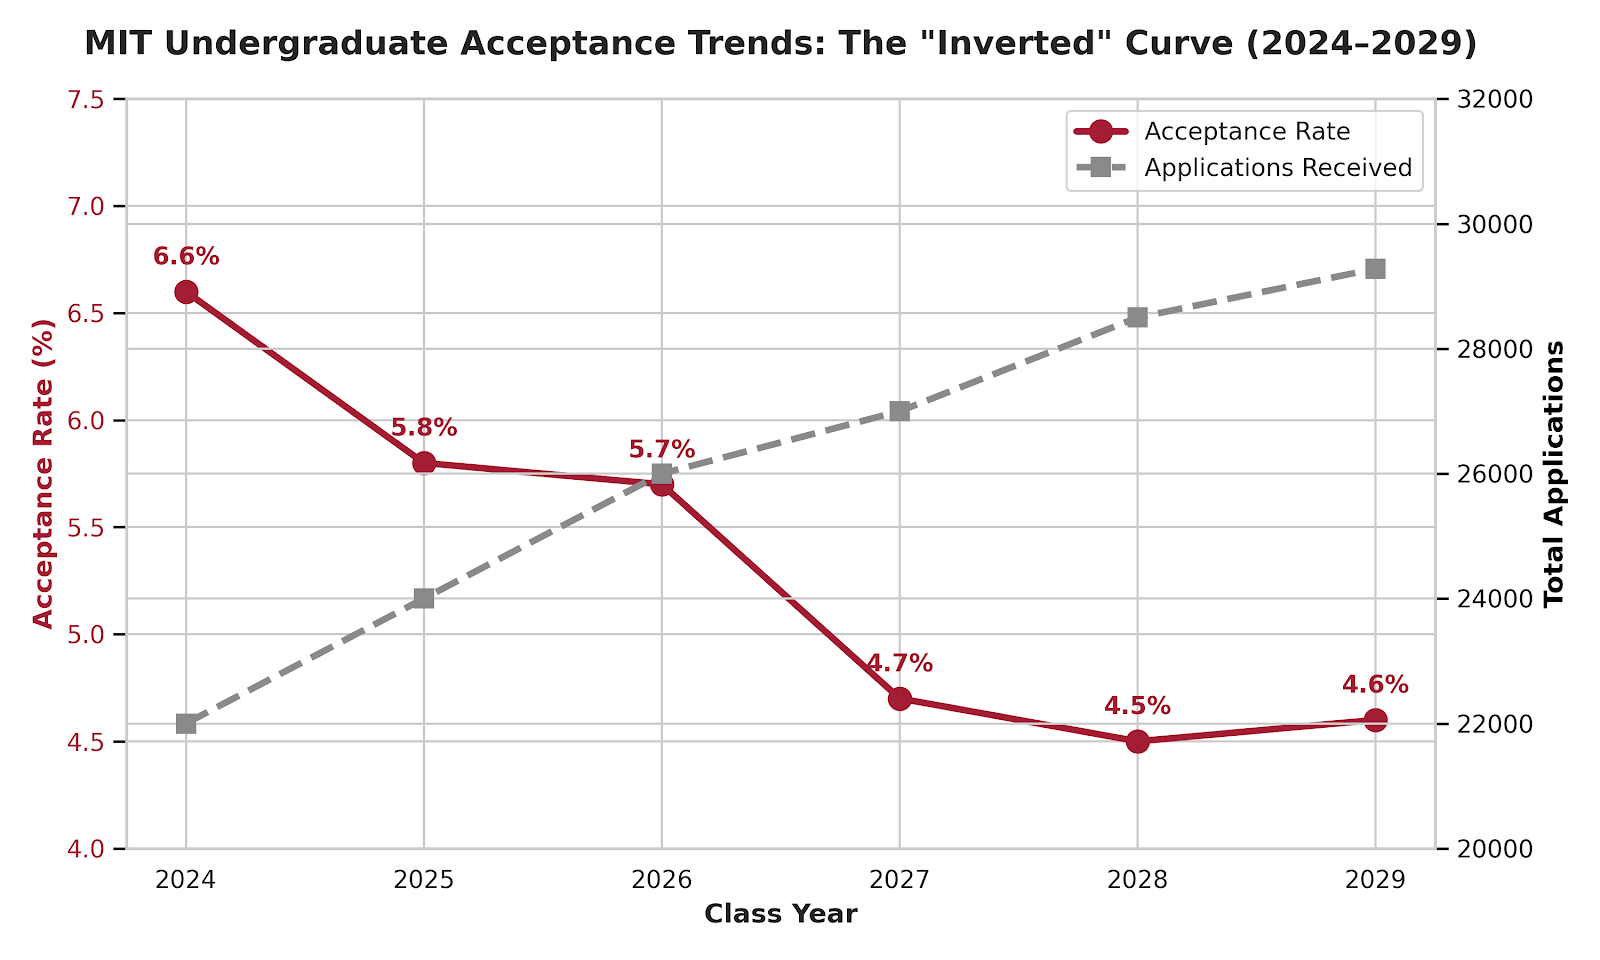
MIT's undergraduate acceptance rate has declined by approximately 20% over the past five years, reflecting increased global applications and the institute's consistent selectivity. The number of applications has grown 33% since 2019, while the number of admitted students has remained relatively stable.
SAT and ACT Score Ranges for MIT Admitted Students
| Test | Section | Range |
|---|---|---|
| SAT | Math | 780–800 |
| SAT | Evidence-Based Reading & Writing | 740–780 |
| SAT | Composite | 1520–1580 |
| ACT | Composite | 34–36 |
| ACT | Math | 34–36 |
| ACT | Reading | 33–36 |
| ACT | English | 34–36 |
99% of admitted undergraduate students scored 1400–1600 on the SAT. This indicates that standardized test scores are a critical component of MIT's undergraduate admissions process, despite the institute's holistic review approach.
Graduate and MBA Score Ranges
- PhD Programs: GRE scores typically 160+ (Quantitative), 155+ (Verbal)
- Master's Programs: GRE scores typically 155–165 (Quantitative), 150–160 (Verbal)
- MBA Program: GMAT scores typically 720+ (out of 800)
MIT emphasizes that acceptance rates do not determine individual chances. According to MIT Admissions, "We admit people, not numbers." The institute's holistic admissions process considers:
- Academic Excellence: GPA, test scores, course rigor
- Research Potential: For graduate programs, demonstrated research interest
- Fit with MIT: Alignment with the institute's mission and culture
- Extracurricular Achievements: Leadership, innovation, impact
- Personal Qualities: Resilience, curiosity, collaboration
The 4.6% undergraduate acceptance rate reflects the highly competitive applicant pool, but it does not mean that only perfect scores guarantee admission. MIT seeks students who demonstrate intellectual curiosity, problem-solving ability, and potential to contribute to the MIT community.
FAQs About MIT Acceptance Rate
Ques. What is MIT's current undergraduate acceptance rate?
Ans. MIT's undergraduate acceptance rate for the Class of 2029 is 4.6%, with 1,334 students admitted from 29,281 applications. This is one of the lowest acceptance rates globally.
Ques. What is MIT's graduate acceptance rate?
Ans. MIT's overall graduate acceptance rate is 10% (Fall 2024), with 3,894 students admitted from 37,409 applications. However, rates vary significantly by department and program type.
Ques. What is MIT's PhD acceptance rate?
Ans. MIT's PhD acceptance rate is approximately 4%, making it as selective as the undergraduate program. PhD admissions are department-specific and emphasize research potential.
Ques. What is MIT Sloan's MBA acceptance rate?
Ans. MIT Sloan's MBA acceptance rate is 14.8% for the Class of 2027, with 792 students admitted from 5,349 applications. The MBA is more accessible than undergraduate or PhD programs but remains highly selective.
Ques. Is MIT's acceptance rate higher for Early Action?
Ans. Yes. MIT's Early Action acceptance rate is 5.98%, compared to 3.7% for Regular Decision. However, Early Action is non-binding, and many applicants are deferred to Regular Decision.
Ques. What is the acceptance rate for international students at MIT?
Ans. International students face a 1.96% undergraduate acceptance rate, compared to 5.4% for U.S. citizens. International acceptance rates for graduate programs are higher, at approximately 43% of the graduate student body.
Ques. How does MIT's acceptance rate compare to other Ivy League schools?
Ans. MIT's 4.6% undergraduate acceptance rate is comparable to Harvard (3%), Yale (3.7%), and Princeton (3.1%). MIT is slightly more accessible than these peers but remains among the most selective universities globally.
Ques. Has MIT's acceptance rate changed over time?
Ans. Yes. MIT's undergraduate acceptance rate has declined from 17.7% in 2013 to 4.6% in 2029—a 74% decrease. This reflects increased global applications and MIT's consistent selectivity.


Comments