


The Data Interpretation (DI) section of the ICFAI Business School Aptitude Test (IBSAT) evaluates a candidate’s ability to analyze and interpret complex data sets presented in tables, charts, and graphs. This section tests logical reasoning, numerical ability, and decision-making skills essential for management studies.
IBSAT Data Interpretation (DI) Question Paper with Answer Key PDF
| IBSAT Data Interpretation (DI) Question Paper PDF | Download PDF | Check Solutions |
IBSAT Data Interpretation (DI) Question Paper with Solutions

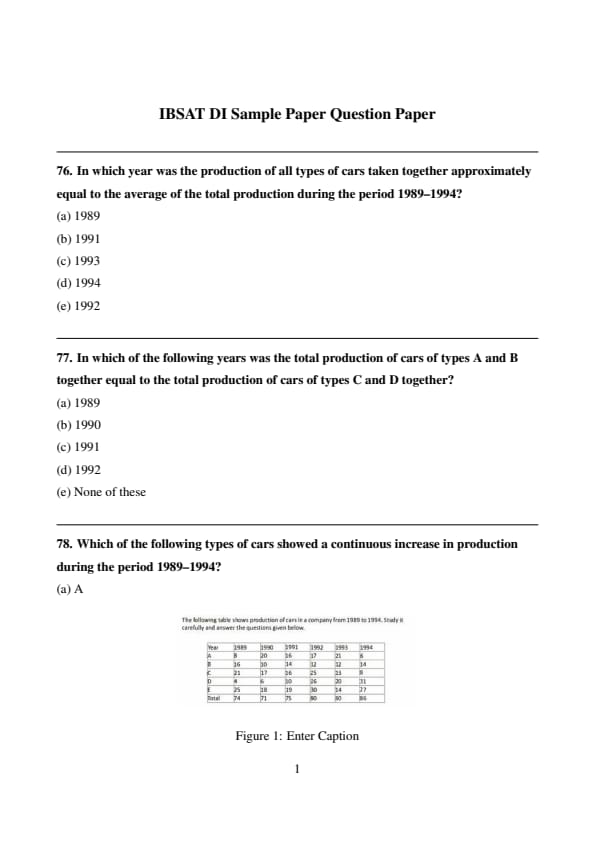
In which year was the production of all types of cars taken together approximately equal to the average of the total production during the period 1989–1994?
In which of the following years was the total production of cars of types A and B together equal to the total production of cars of types C and D together?
Which of the following types of cars showed a continuous increase in production during the period 1989–1994?
The production of which of the following types of cars was 25% of the total production of all the types produced during the year 1993?
Find the percentage increase in the total production of all the types of cars in 1992 compared to that of 1991.

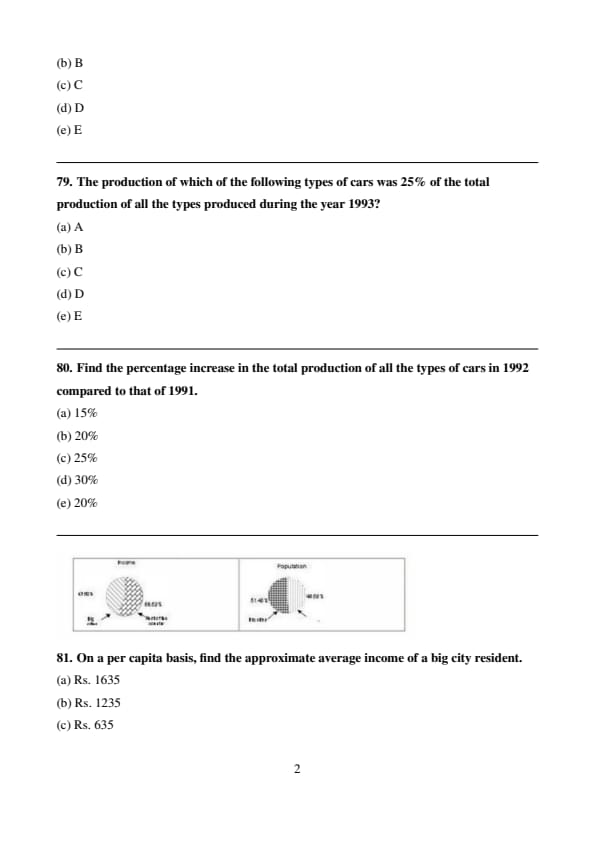
On a per capita basis, find the approximate average income of a big city resident.
On a per capita basis, find the approximate average income of the rest of the country.
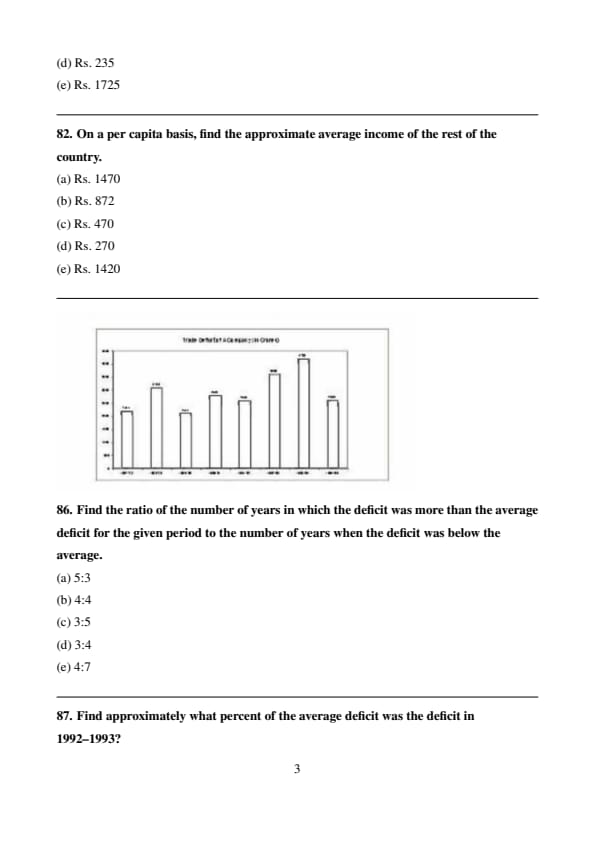
Find the ratio of the number of years in which the deficit was more than the average deficit for the given period to the number of years when the deficit was below the average.
Find approximately what percent of the average deficit was the deficit in 1992–1993?
Find approximately how many times the deficit in 1990–1991 was the deficit in 1993–94?

By what percent did the deficit in 1993–1994 increase over the deficit in 1989–1990?
In which of the following years was the percentage increase of deficit the highest over its preceding year?

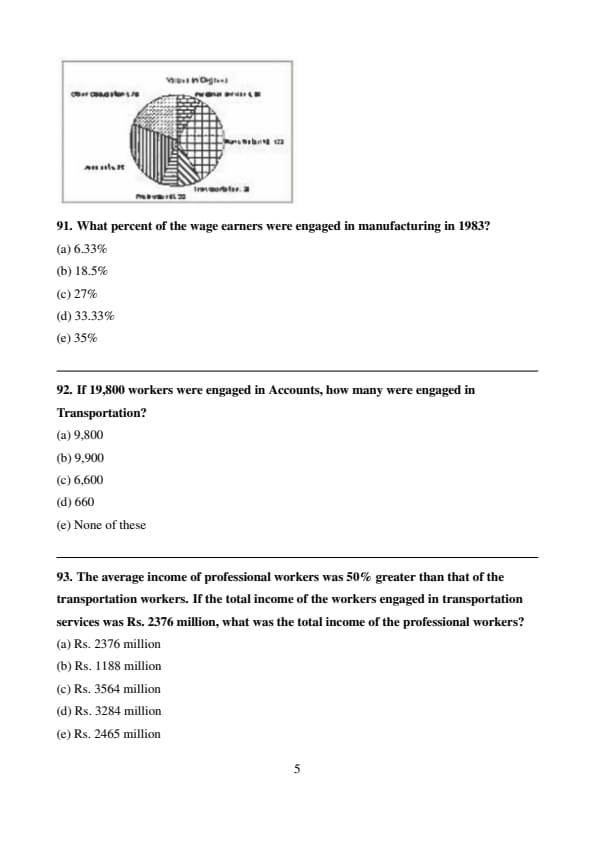
If 19,800 workers were engaged in Accounts, how many were engaged in Transportation?
The average income of professional workers was 50% greater than that of the transportation workers. If the total income of the workers engaged in transportation services was Rs.~2376 million, what was the total income of the professional workers?

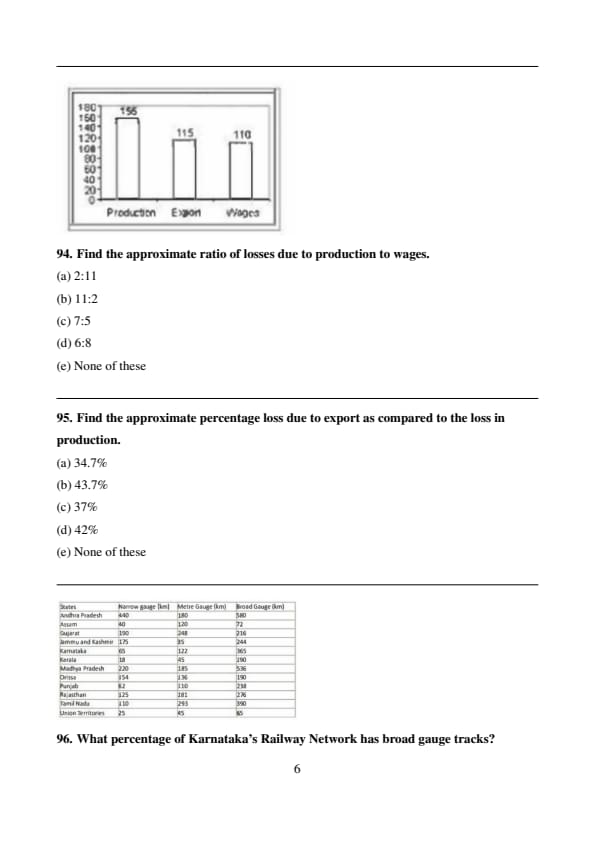
Find the approximate percentage loss due to export as compared to the loss in production.

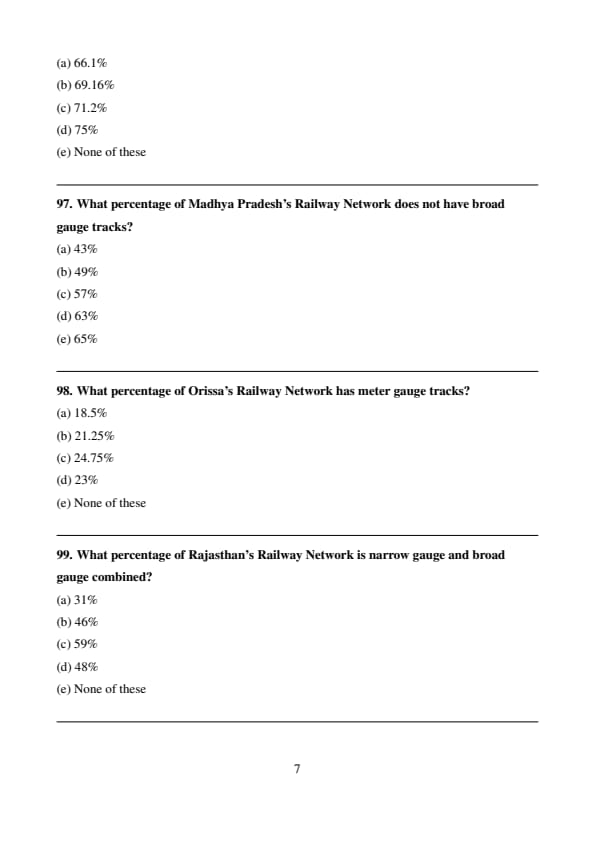
What percentage of Madhya Pradesh's Railway Network does not have broad gauge tracks?
What percentage of Orissa's Railway Network has meter gauge tracks?
What percentage of Rajasthan's Railway Network is narrow gauge and broad gauge combined?
If Delhi accounts for 35% of the total length of Railway tracks within union territories, then what is the length of Railway tracks within the capital?

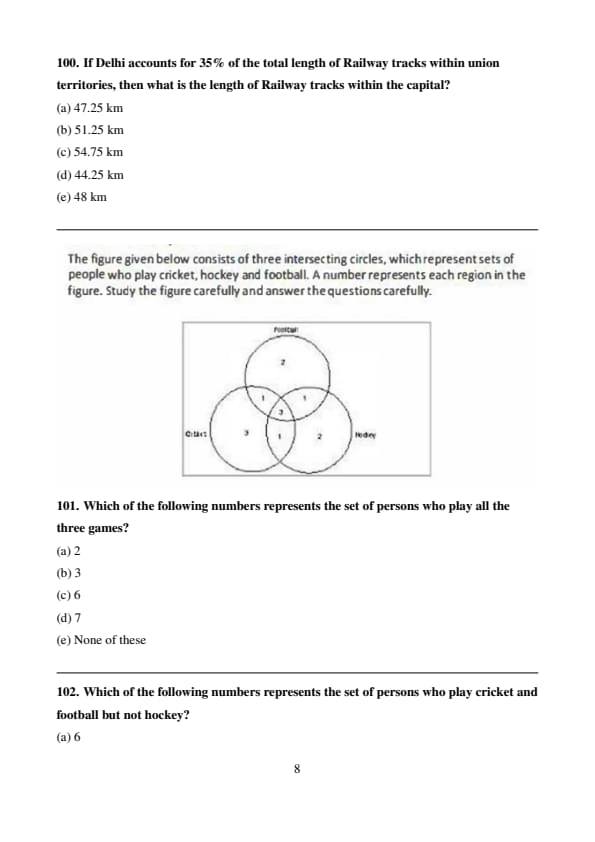
Which of the following numbers represents the set of persons who play all the three games?
Which of the following numbers represents the set of persons who play cricket and football but not hockey?
Which of the following numbers represents the set of people who play cricket but neither hockey nor football?
Which of the following numbers represents the set of persons who play cricket and hockey but not football?

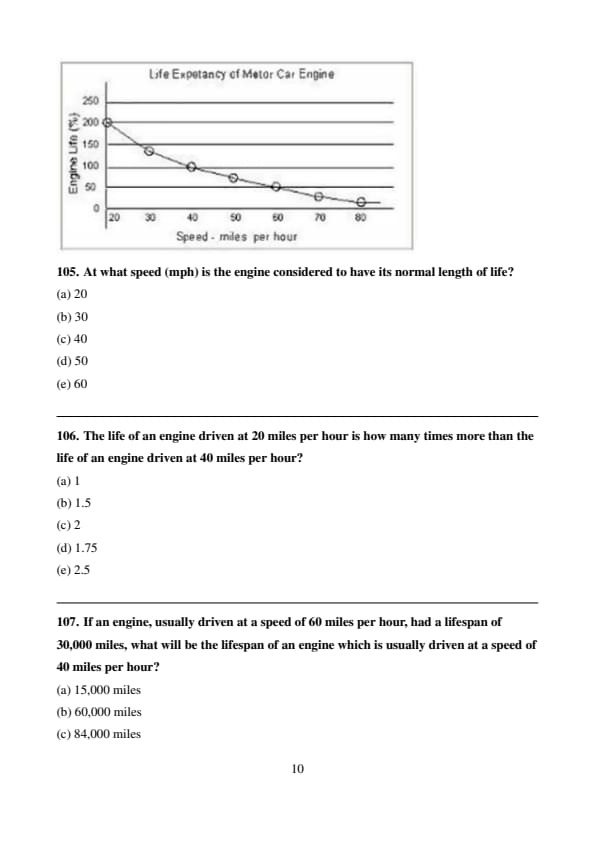
At what speed (mph) is the engine considered to have its normal length of life?
The life of an engine driven at 20 miles per hour is how many times more than the life of an engine driven at 40 miles per hour?
If an engine, usually driven at a speed of 60 miles per hour, had a lifespan of 30,000 miles, what will be the lifespan of an engine which is usually driven at a speed of 40 miles per hour?
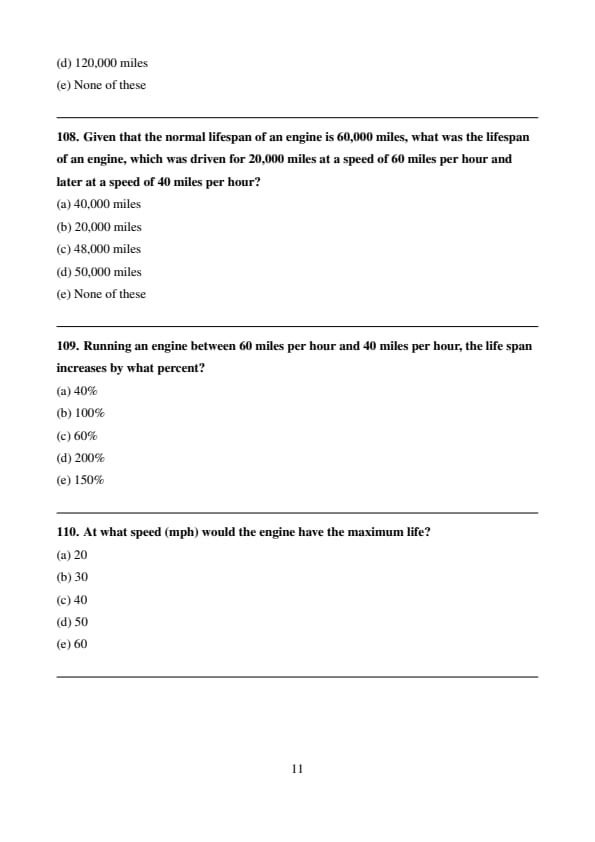
Given that the normal lifespan of an engine is 60,000 miles, what was the lifespan of an engine, which was driven for 20,000 miles at a speed of 60 miles per hour and later at a speed of 40 miles per hour?
Running an engine between 60 miles per hour and 40 miles per hour, the life span increases by what percent?
At what speed (mph) would the engine have the maximum life?

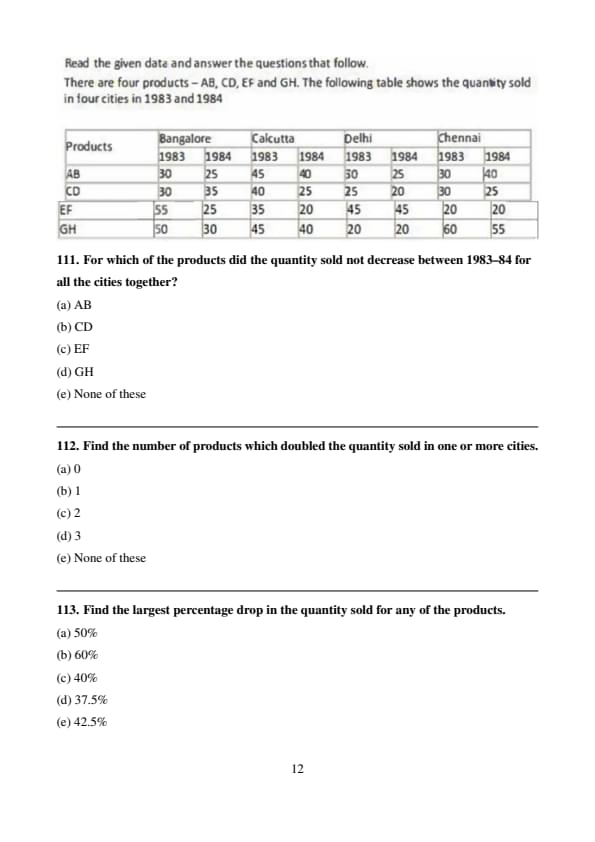
For which of the products did the quantity sold not decrease between 1983–84 for all the cities together?
Find the number of products which doubled the quantity sold in one or more cities.
Find the largest percentage drop in the quantity sold for any of the products.
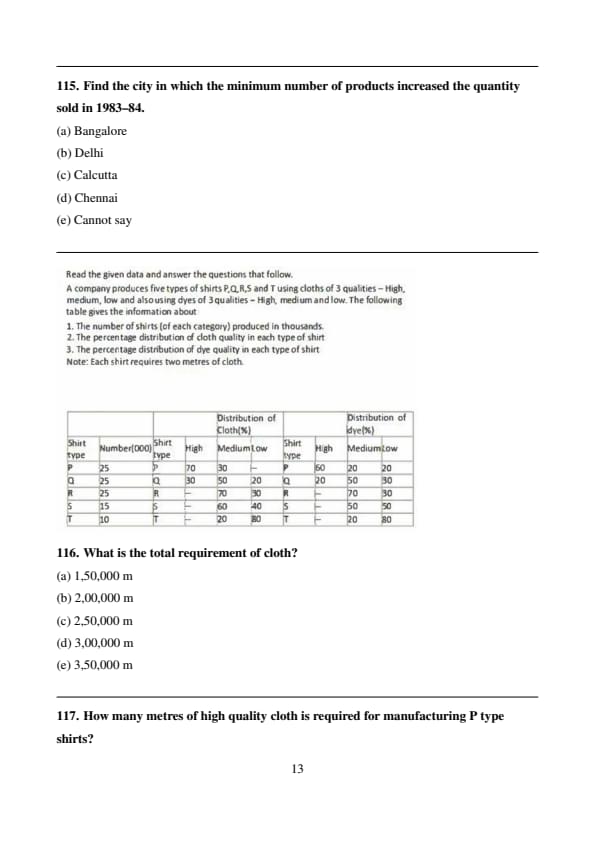
Find the city in which the minimum number of products increased the quantity sold in 1983–84.

How many metres of high quality cloth is required for manufacturing P type shirts?
What is the ratio of the low quality dye used for R type shirts to that used for S type shirts?
What is the ratio of the 3 qualities of dye in high quality cloth?
How many metres of low quality cloth is required for manufacturing R type shirts?
Comments