Highlights:
- Admissions Update: Applications for undergraduate admissions at Princeton will open from mid-August.
- Upcoming Deadlines: November 1, 2024 for Early Action Program. Deadlines for most graduate courses is December 1 – December 15, 2024.
- Decisions Period: mid-December for Early Action Program and mid-March for Regular Decision. Decision for most graduate programs are announced by February end.
Princeton University acceptance rate is typically seen below 5% for undergraduate admissions and below 15% for graduate admissions. According to the undergraduate class of 2027, a total of 39,644 applications were received and only 1,782 of could secure a place at Princeton University. The overall acceptance rate for undergraduate admissions was 4.49%, which indicates highly competitive admissions.
For graduate admissions, Princeton University received a total of 14,577 applications. Of those, 3,057 applicants applied for master’s degrees while the rest 11,520 were PhD applicants. Out of the total applications, around only 1,369 or 9.39% were accepted for admissions at Princeton University. This shows graduate admissions are highly competitive, but comparatively less competitive than undergraduate admissions.
|
Table of Contents |
Princeton University Acceptance Rate for UG
For the fall admissions 2023, a total of 39,644 applicants applied for undergraduate admissions at Princeton University, including 9,402 international students. The further details Princeton University UG acceptance rate is tabulated below:
Undergraduate Acceptance Rate
| Particulars | Applications Received | Applications Accepted | Acceptance Rate | Applicants Enrolled |
|---|---|---|---|---|
| Total Applications | 14,577 | 1,782 | 4.49% | 1,366 |
| International Students Applications | 9,402 | 226 | 2.4% | 185 |
Undergraduate Class Profile 2027
| Particulars | Applications Received |
|---|---|
| Applicants Enrolled | 1,366 |
| Male to Female Ratio | 51 : 41 |
| Percentage of Students Qualifying for Financial Aid | 66% |
| Percentage of Eligible Students for Need based Federal Pell Grants | 22% |
| Middle SAT score | 780-800 [Maths] | 760-780 [Evidence Based Reading and Writing] |
| Middle ACT score | 34-35 |
Princeton University Acceptance Rate for PG
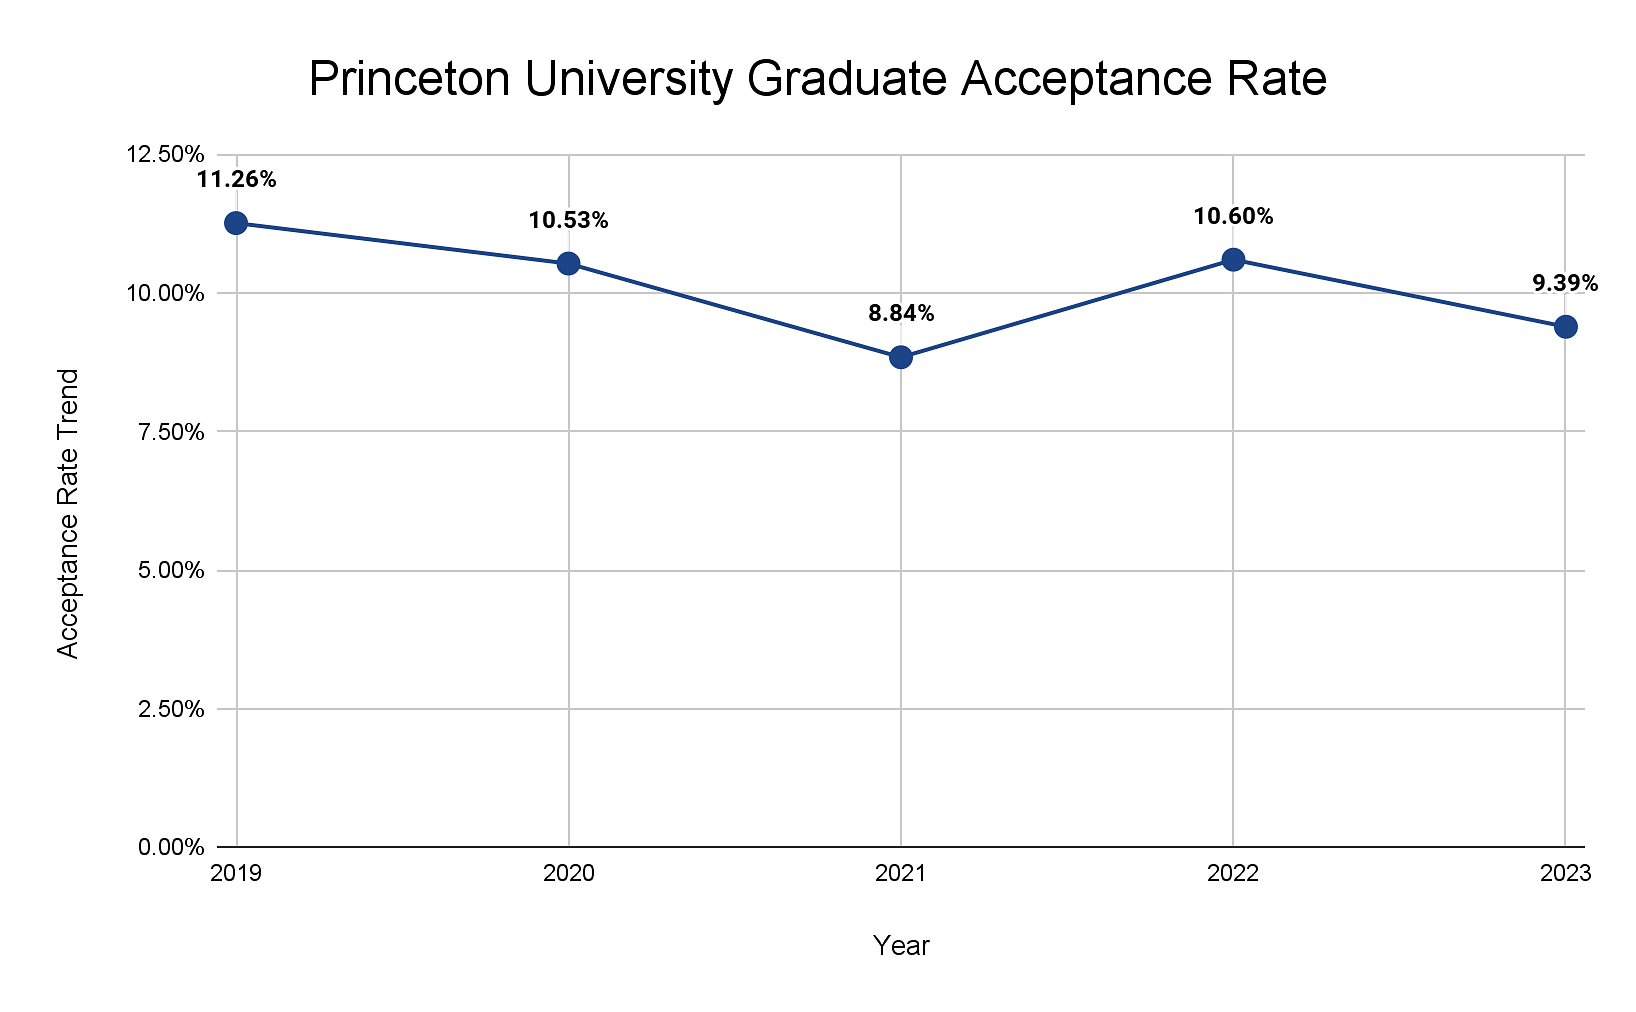
The below graph displays acceptance rate trend for Princeton University graduate admissions:

The acceptance rate for graduate programs has dropped by 1.21% compared to the previous year, from 10.60% in 2022 to 9.39% in 2023. Princeton University acceptance rate keep every year for graduate admissions. With growing competition level, the acceptance rate of Princeton University is likely to decrease or will remain the same range for 2024.
Graduate School Admissions and Acceptance Rate
| Particulars | Applications Received | Applications Accepted | Acceptance Rate | Applicants Enrolled |
|---|---|---|---|---|
| Total Applications | 39,644 | 1,369 | 9.39% | 742 |
| International Students Applications | 8,521 | 608 | 7% | 348 |
| Master’s Applications | 3,057 | 295 | 9.64% | 210 |
| PhD Applications | 11,520 | 1,074 | 9.32% | 532 |
The Princeton University acceptance rate for international students is slightly low as compared to overall acceptance rate. Out of the 8,521 international applicants, only 608 were accepted for admissions at Princeton University and only 348 of them were enrolled.
Engineering
| Particulars | Applications Received | Applications Accepted | Acceptance Rate | Applicants Enrolled |
|---|---|---|---|---|
| Total Applications | 4,473 | 450 | 10.06% | 212 |
| Master’s Applications | 1,353 | 70 | 5.17% | 49 |
| PhD Applications | 3,120 | 380 | 12.17% | 163 |
Humanities
| Particulars | Applications Received | Applications Accepted | Acceptance Rate | Applicants Enrolled |
|---|---|---|---|---|
| Total Applications | 2,217 | 187 | 8.43% | 115 |
| Master’s Applications | 390 | 61 | 15.54% | 31 |
| PhD Applications | 1,827 | 126 | 6.89% | 84 |
Social Sciences
| Particulars | Applications Received | Applications Accepted | Acceptance Rate | Applicants Enrolled |
|---|---|---|---|---|
| Total Applications | 3,739 | 350 | 9.36% | 226 |
| Master’s Applications | 1,313 | 164 | 12.49% | 130 |
| PhD Applications | 2,426 | 186 | 7.6% | 96 |
Natural Sciences
| Particulars | Applications Received | Applications Accepted | Acceptance Rate | Applicants Enrolled |
|---|---|---|---|---|
| Total Applications | 4,148 | 382 | 9.2% | 189 |
| Master’s Applications | 1 | - | - | - |
| PhD Applications | 4,147 | 382 | 9.2% | 189 |
Being an Ivy League institute, Princeton University is one of the most competitive universities in USA. The overall acceptance rate of Princeton University is typically below 5% for UG and below 15% for almost all graduate programs. Acceptance rate for some graduate programs at Princeton is even lower than 10%.


Comments