


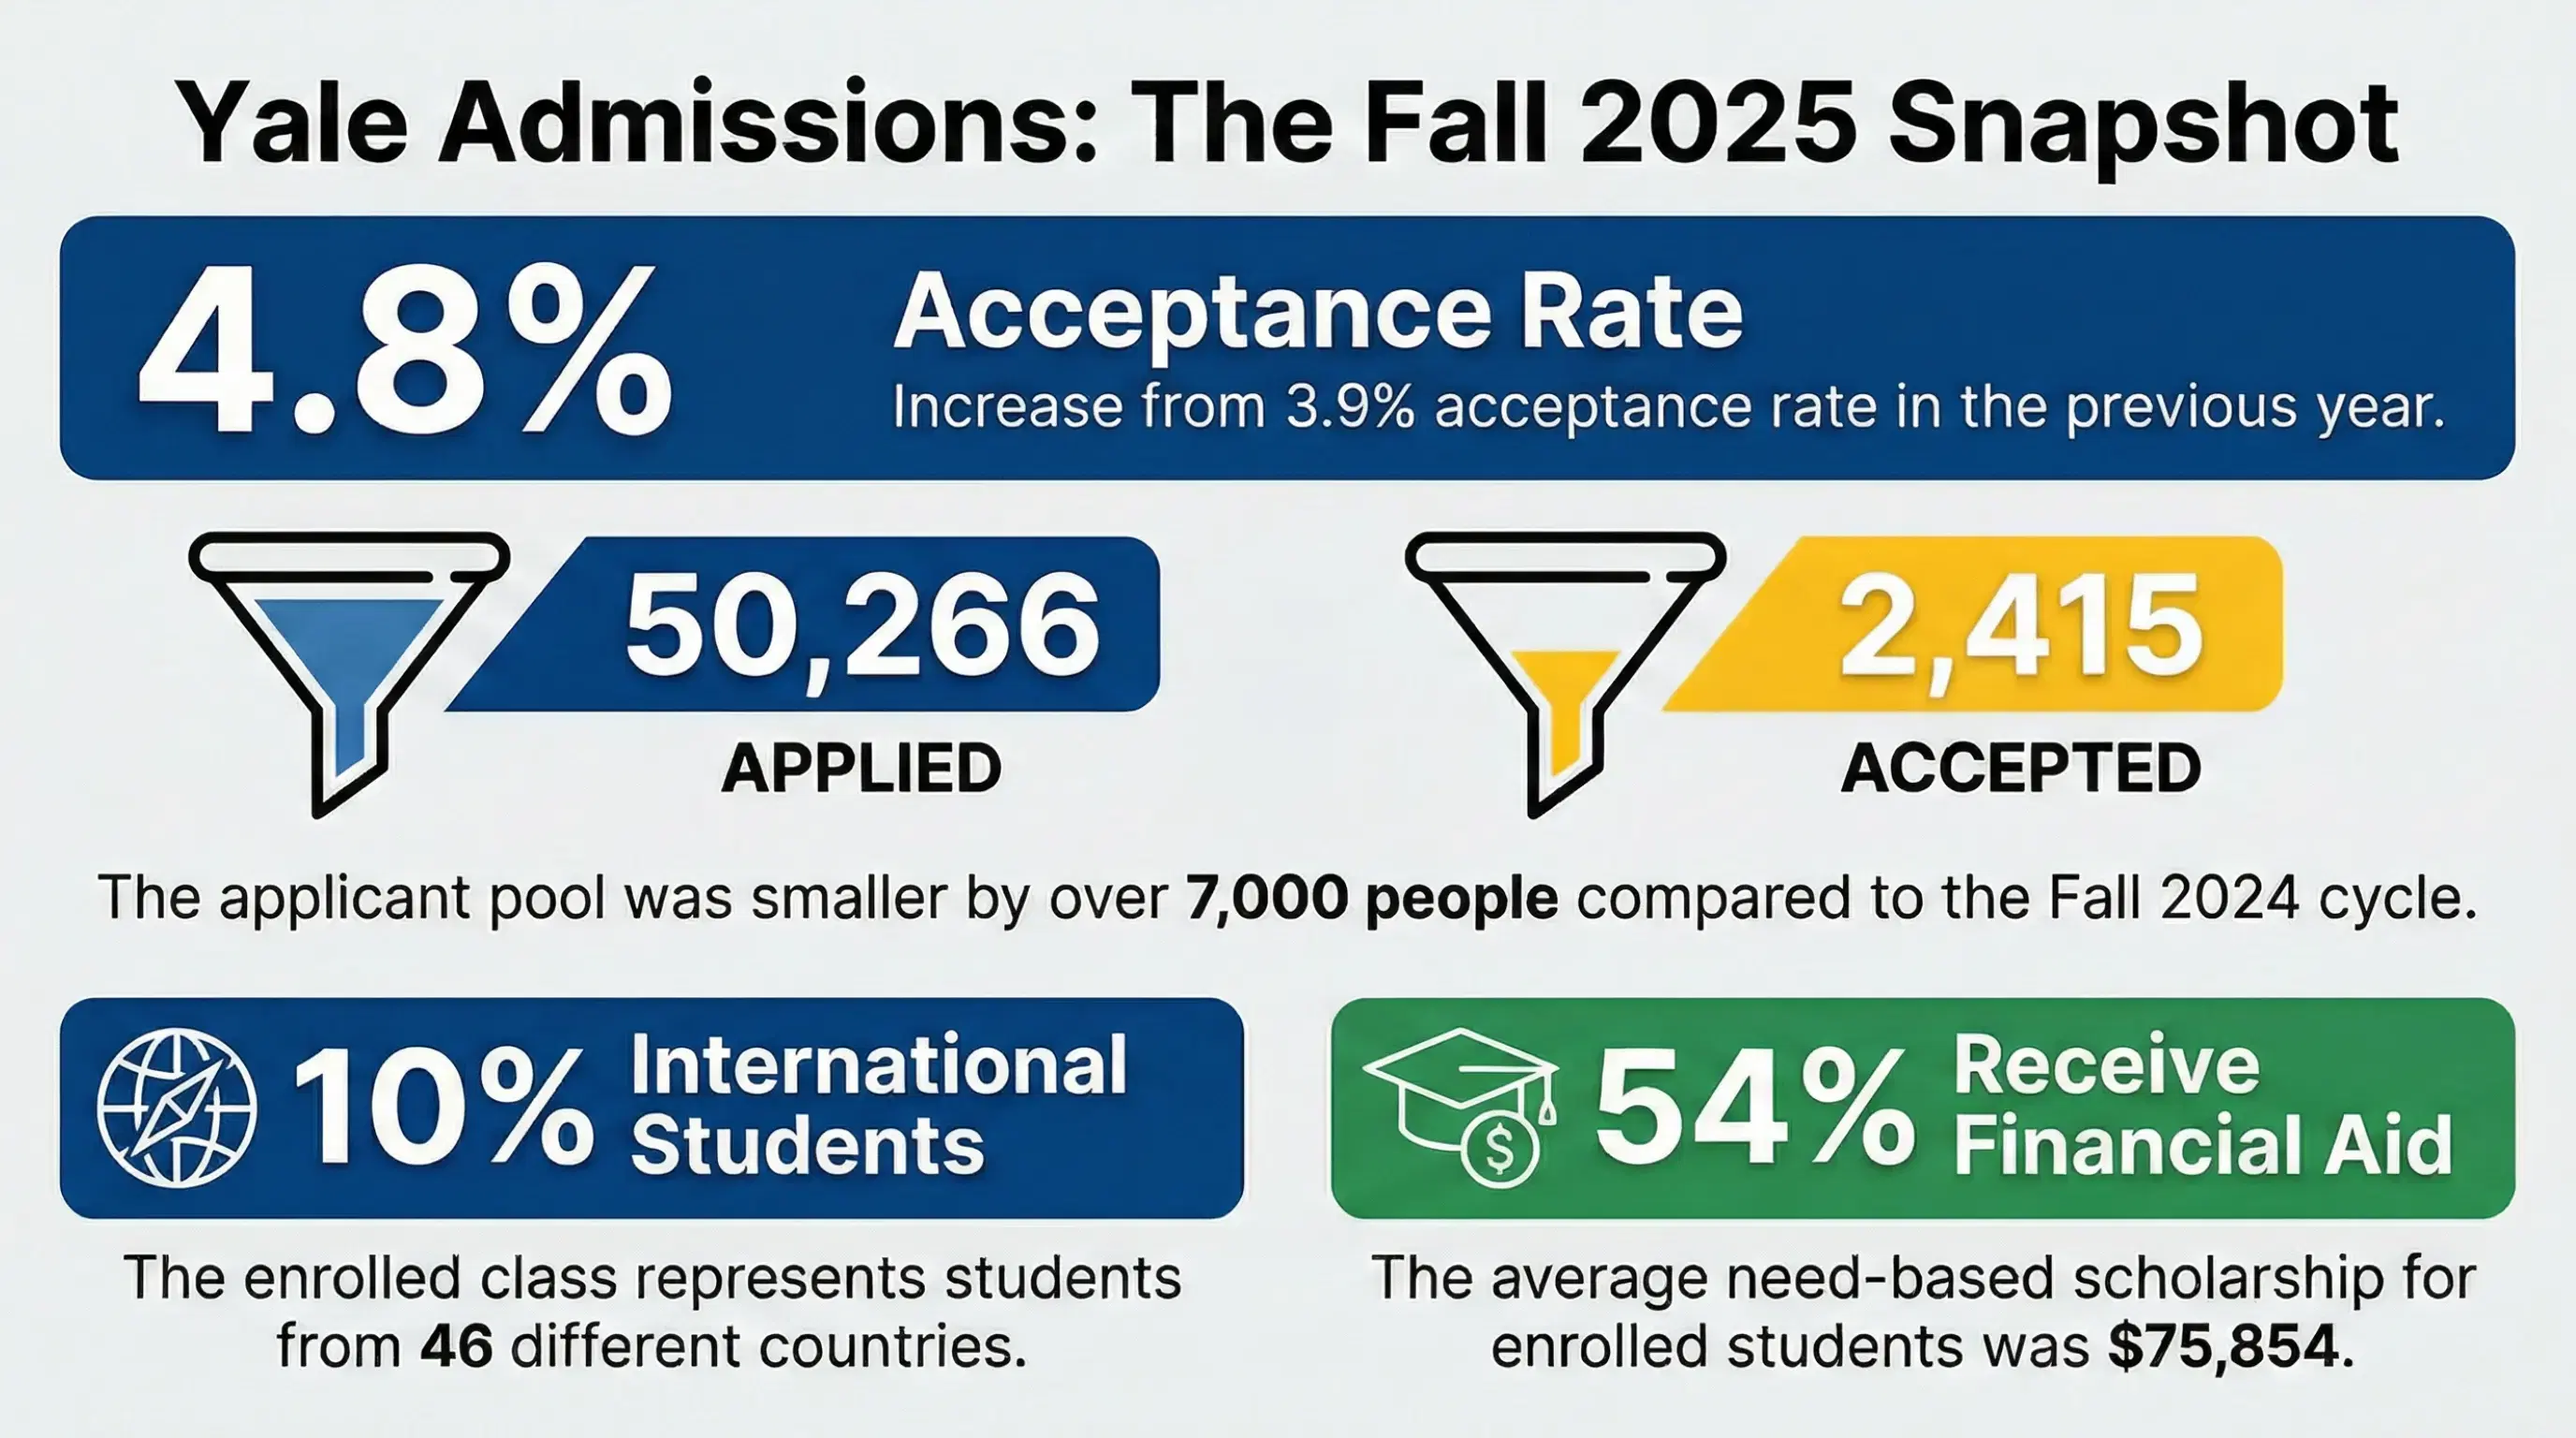
Yale University acceptance rate is 4.8% for the fall 2025 session. Yale received a total of 50,266 first-year undergraduate applications for the fall 2025 intake. Of these, Yale accepted only 2,415. Among the accepted applicants, 1,640 finally enrolled in their desired programs at Yale University.
In comparison, Yale accepted 2,244 applicants out of 57,517 in the fall 2024 cycle. Resulting in an acceptance rate of just 3.9%. Hence, the undergraduate acceptance rate at Yale University has increased by 0.9% since last year.
Students applying for admission to Yale University are assessed holistically, but there are many things to consider. Academic excellence, strong grades, meaningful extracurriculars, compelling essays, and excellent recommendations are the parameters that Yale prioritizes the most. Only students covering all these aspects get a chance to study at this top-notch Ivy League University.
Class profile of accepted students in Fall 2025 is as follows:
| Particulars | Details |
|---|---|
| Total applicants | 50,266 |
| Acceptance rate | 4.8% |
| Enrolled | 1,640 |
| Standardized test scores* |
Median 50% SAT score: Median 50% ACT score: |
| Female-male student ratio | 51%-49% |
| Countries represented | 46 |
| International students | 10% |
| Students receiving need-based financial aid | 54% |
| Average scholarship amount | $75,854 |
*Note: All first-year UG applicants are required to submit standardized test scores as per Yale’s test-flexible policy requirement. Applicants can apply with any standardized test (SAT/ ACT/ AP or IB) scores. Till 2024, Yale was test-optional, giving applicants the flexibility to apply without standardized test scores.
Yale Early Action Acceptance Rate for Fall 2026)
According to details reported by Yale Daily News, Yale College has admitted 779 students through its non-binding Single Choice Early Action (SCEA) application round for the Class of 2030 (students entering in Fall 2026). The SCEA is one of the application rounds at Yale through which students can apply early to get an admission decision by mid-December. Other details of the application cycle are:
- The Early Action acceptance rate was 10.9%, slightly higher than the ~10.8% last year.
- About 7,140 students applied in this early cycle; roughly 18% were deferred, ~70% denied, and the rest withdrew or were incomplete.
- With 118 additional admissions through QuestBridge National College Match, the total early admits reached 897 for Yale’s Class of 2030.
- Early Action remains non-binding, and students have until May 1 to decide on enrollment.
Note: Statistics for the regular decision admission cycle are about to be released in March-April 2026.
To know more about SCEA, QuestBridge National College Match, visit Yale University application deadlines.
What is Class of 2030?
Class of 2030 refers to students who start their first year of a UG degree at Yale in Fall 2026 and are expected to graduate in 2030. Since a Yale undergraduate degree takes 4 years, the “class of” label matches the year students finish their studies.
Yale University Acceptance Rate Trends
Yale University is one of the most competitive Ivy League Universities, often surpassing Harvard. The last 3-year statistics of Yale’s acceptance rate are presented below:
| Particulars | Fall 2025 | Fall 2024 | Fall 2023 |
|---|---|---|---|
| Total applicants | 50,266 | 57,517 | 52,303 |
| Acceptance rate | 4.8% | 3.9% | 4.5% |
| Enrolled students | 1,640 | 1,554 | 1,647 |
| Female-male ratio | 51%-49% | 49%-50%-1% others | 51%-48%-1% others |
| Countries represented | 46 | 55 | 68 |
| International students | 10% | 11% | 12% |
Trends:
- Total applicants fell sharply from 2024 → 2025
- 57,517 → 50,266 (~12.6% drop)
- Acceptance rate rose again in 2025, reversing the previous year’s dip
- 4.5% → 3.9% → 4.8%
- Fewer applications led to a slightly easier, but still highly selective entry in 2025.
- Yale is keeping first-year intake steady despite application fluctuations. Enrolled students remained somewhat consistent:
- 1,647 → 1,554 → 1,640
- Yale is enrolling fewer international students from fewer countries than before.
- Country representation decreased: 68 → 55 → 46
- International student share also declined: 12% → 11% → 10%
Despite the drop in first-year international students, India remains the 2nd largest international student population (after China) at Yale in terms of overall enrollment. However, there is no official data on how many Indian students are currently enrolled; some websites cite that around 200 Indian students are currently present at Yale.
Know more about the latest rankings of Yale University.
Yale University School of Management (SOM) Acceptance Rate
The Yale SOM shows a sharp contrast between its flagship MBA and the Master of Advanced Management (MAM) class. The full-time MBA enrolls a large and academically competitive group of 367 students, with 41% being international. Meanwhile, the MAM program remains small at 51 students, coming from 24 countries and 21 global MBA schools.
Yale SOM MBA Class of 2027
| Particulars | Details |
|---|---|
| Total enrollment | 367 |
| International | 41% from 47 countries |
| Female students | 44% |
| UG background | - 32% from STEM - 29% from Business - 20% for Humanities and Social Science - 18% from Economics |
| Average work experience | 5 years |
| Median GMAT (80% score range) | 740 |
| Median GMAT Focus (80% score range) | 675 |
| Median GRE (80% score range) | 163 verbal | 166 quant |
| GRE score submitted | 47% students |
These statistics give a clear picture of what Yale SOM looks for in MBA candidates. Prospective Indian students can consider these statistics as benchmarks to get into the Yale MBA.
Yale University Master of Advanced Management Class of 2026
Class and Demographics:
- Total Students: 51 enrolled in the MAM Class of 2026.
- Citizenships represented: 24 countries.
- Women: 43% of the class.
- MBA Schools Represented: Students come from 21 global MBA schools, including institutions across Asia, Europe, North America, and Africa.
Age and Experience:
- Average Age: 32 years.
- Global Work Experience: 51% of students have worked in more than one country, showing high international professional experience.
Check the full details of Yale’s Master of Advanced Management program.
Yale University School of Medicine (YSM) Acceptance Rate
Yale University’s School of Medicine (YSM) MD class of 2028 reported an acceptance rate of 4.9%. Key metrics of Yale’s MD program include:
| Particulars | Details |
|---|---|
| Total applicants | 5,669 |
| Acceptance rate | 4.9% |
| Enrolled students | 104 |
| Female- male students | 54 females and 50 males |
| Median CGPA | 3.94 |
| Median MCAT score | 521 |
| Faculty-to-student ratio | 4.4 to 1 |
Yale University remains equally competitive for the 2026 admission cycle. Though the early action acceptance rate slightly increased, the regular decision cycle is expected to receive over 50,000 applications (based on previous year trends). Visit this page regularly, as more details are yet to be published by Yale in March regarding their regular decision application statistics.


Comments