


Content Curator
Venn Diagrams are diagrams used for the pictorial representation of sets, the relation between the sets, and the operation performed on them. Venn diagrams were introduced by John Venn (1834-1883).
- They are used to depict different set operations such as intersection of sets, union of sets, and difference of sets.
- Venn Diagrams are also known as ‘Set Diagrams’ or ‘Logic Diagrams’.
- Overlapping, intersecting, and non-intersecting circles are used in Venn Diagrams to denote the relationship between sets.
- They are also used to depict subsets of a set.
Venn Diagrams are widely used in set theory, mathematics, logic, businesses, computer science, and statistics.
Read More: NCERT Solutions for Class 11 Maths Sets
| Table of Content |
Key Terms: Venn Diagrams, Sets, Set Operations, Union of Sets, Intersection of Sets, Complement of Set, Venn Diagram Formula
What are Venn Diagrams?
[Click Here for Sample Questions]
Venn Diagrams are the pictorial representation of all possible relations of different sets.
- Venn diagrams are used to represent sets, relationships between sets, and set operations.
- They can be represented by any closed figure such as a circle or a polygon like a square, hexagon, etc.
- Generally, intersecting and non-intersecting circles are used to represent each set in Venn Diagrams.
Important Terms Related to Venn Diagrams
[Click Here for Sample Questions]
In order to understand the concept of Venn Diagrams, one must understand the meaning of the given terms:
Universal Set
Universal Set is the larger set that contains all of the elements in all of the sets. When a Venn diagram is drawn for two or more sets,
- A large rectangle is used to represent the universal set.
- It is denoted by the symbol E or U.
- The other sets are represented by circles or polygons within the larger rectangle.
- Thus, every set is a subset of the universal set U.
Subset
A subset is defined as the set that is contained within another set. For instance, in the given Venn diagram of two sets A and B, A is a subset of B. Here, circle A is contained within circle B which means all the elements of A are elements of set B.
Read More:
Venn Diagram Example
[Click Here for Sample Questions]
Given below is a Venn diagram, where U represents the universal set as a closed rectangle consisting of two independent sets, X and Y. Thus, X and Y are disjoint sets represented in a circular shape.
For instance,
- Universal Set, U = {Set of Natural Numbers}
- Set X = {Set of Even Numbers}
- Set Y = {Set of Odd Numbers}
From the given Venn diagram, we can claim that the set X and set Y have no relation with each other, but they are a part of a universal set. It means even and odd numbers are both natural numbers, however, there is no common number in between them.
Venn Diagram Symbols
[Click Here for Sample Questions]
Venn Diagrams use more than 30 symbols, however, the three majorly used symbols in Venn diagrams are as follows:
| Set Operation | Venn Diagram Symbol | Explanation |
|---|---|---|
| Union of Sets | ∪ | A ∪ B is read like ‘A union B’. It means the elements that belong to either set A or set B or both sets. |
| Intersection of Sets | ∩ | A ∩ B is read like ‘A intersection B’. It means the elements that belong to both sets A and B. |
| Complement of Set | Ac or A' | A' is read like ‘A complement’. It means the elements that do not belong to set A. |
How to Draw a Venn Diagram?
[Click Here for Sample Questions]
In order to draw a Venn diagram, first the universal set should be known. Every set is a subset of the universal set, meaning that every other set will be inside the rectangle that represents the universal set. All the elements of the set should be inside the circle. Also, they are part of a bigger rectangle, making them the elements of the universal set.
Here are the steps to draw a Venn Diagram:
- Step 1: First, categorize all the elements into sets.
- Step 2: Now, draw a rectangle and mark it as per the correlation between the sets.
- Step 3: Next step is to draw the circles according to the categories.
- Step 4: Lastly, put all the elements in the relevant circles.
Example: Given below is a Venn diagram for the Indoor and Outdoor Animals.
- Indoor Animals: Cats, Hamsters, and, Parrots
- Outdoor Animals: Horses, Tortoises, and Goats
- Both Outdoor and Indoor: Rabbits and Fish
Here, the rectangle shows the universal set, i.e. Pets. The first circle represents the Indoor Animals, the second circle denotes the Outdoor animals and the common part shows both Outdoor and Indoor animals.
Venn Diagram for Sets Operations
[Click Here for Sample Questions]
In the set theory, there are various operations performed on sets which are described as follows:
- Union of Sets
- Intersection of Sets
- Complement of Set
- Difference of Set
The representation of the following operations on sets using Venn Diagrams are as follows:
Union of Sets Venn Diagram
The union of two sets A and B is given by A ∪ B = {x | x ∈A or x ∈B}. It can be represented using a Venn diagram with two circles. In this, the total region of both the circles combined gives the union of sets A and B.

The properties of the union of sets operation are:
- A ∪ B = B ∪ A
- (A ∪ B) ∪ C = A ∪ (B ∪ C)
- A ∪ φ = A
- A ∪ A = A
- U ∪ A = U
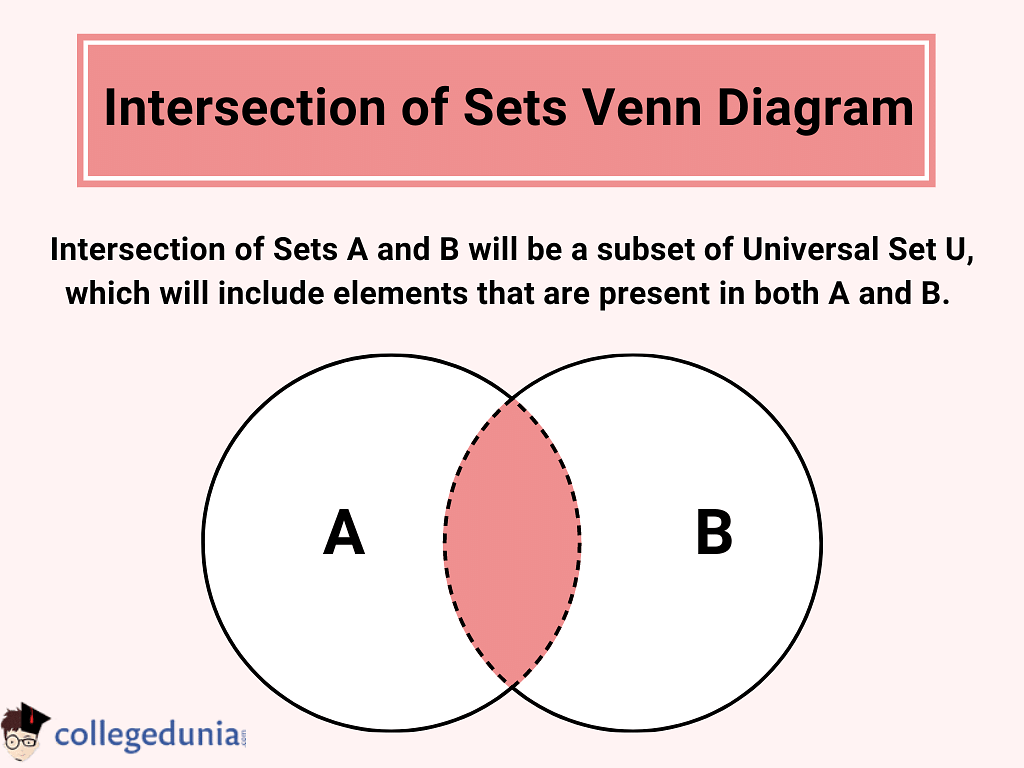
Intersection of Set Venn Diagram
The intersection of sets, A and B is given by A ∩ B = {x : x ∈ A and x ∈ B}. The intersection of sets is represented using a Venn diagram with two intersecting circles. The region that is common to both circles denotes the intersection of Set A and Set B.
The properties of the intersection of sets are as follows:
- A ∩ B = B ∩ A
- (A ∩ B) ∩ C = A ∩ (B ∩ C)
- φ ∩ A = φ ; U ∩ A = A
- A ∩ A = A
- A ∩ (B ∪ C) = (A ∩ B) ∪ (A ∩ C)
- A ∪ (B ∩ C) = (A ∪ B) ∩ (A ∪ C)
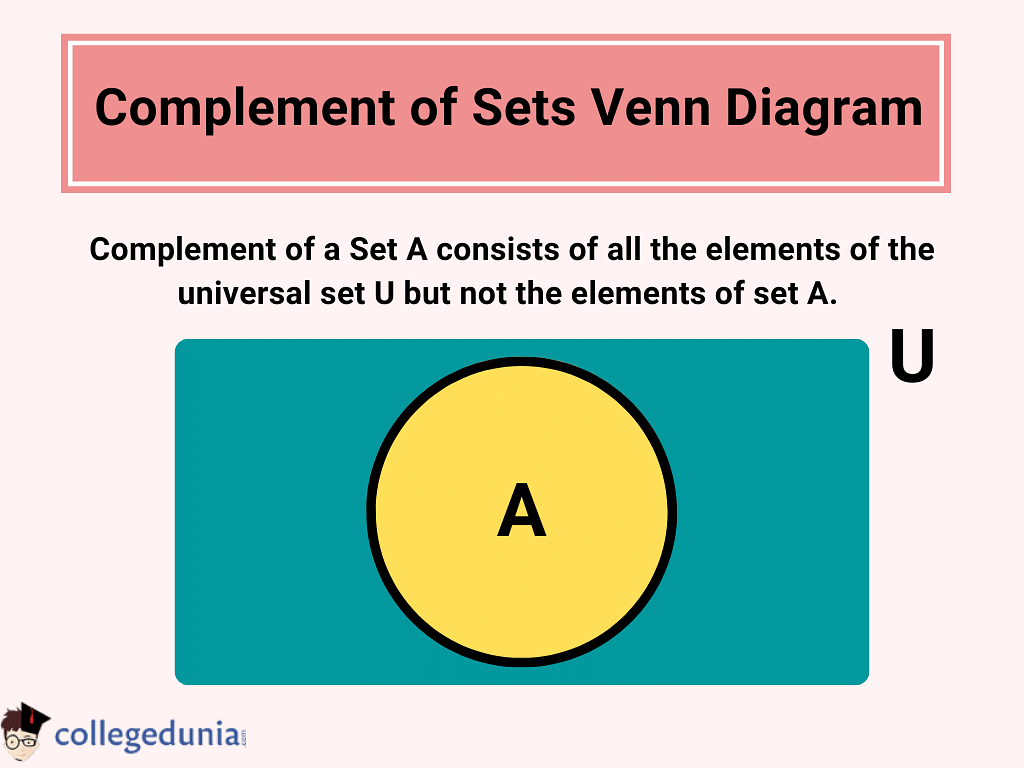
Complement of Set Venn Diagram
A' is the complement of set A. This set has all the elements that are absent in set A. The region covered in the universal set, excluding the region covered by set A, will give the complement of A.
The properties of the complement of the set are as follows:
- A ∪ A′ = U
- A ∩ A′ = φ
- (A ∪ B)′ = A′ ∩ B′
- (A ∩ B)′ = A′ ∪ B′
- U′ = φ
- φ′ = U
Complement of Union of Sets
(A ∪ B)’ is read as the complement of A union B. This represents elements that are neither in set A nor in set B.
Complement of Intersection of Sets
(A ∩ B)’ is read as the complement of set A intersecting set B. This represents elements of the universal set that are not common between sets A and B.
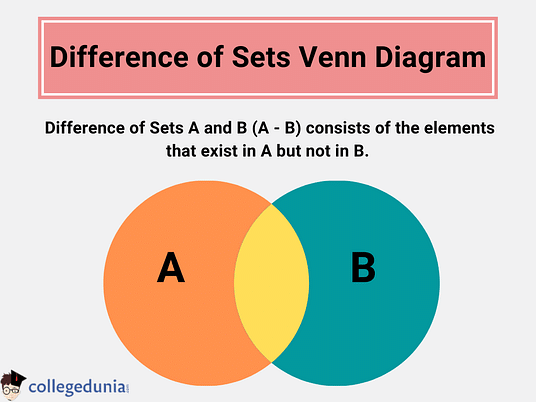
Difference of Set Venn Diagram
The difference of sets is given as A-B. Sometimes, it is referred to as a relative complement. It represents elements of set A which are not there in set B. The region covered by set A, excluding the region that is common to set B, is the difference between sets A and B.
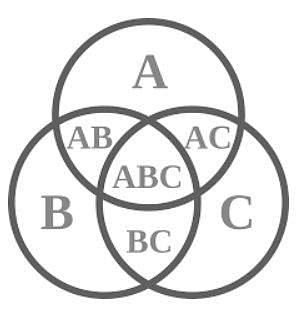
Venn Diagram for Three Sets
[Click Here for Sample Questions]
Venn Diagrams for three sets are made up of three overlapping circles in which the three circles show how the elements of the three sets are related. Venn Diagram for three sets is also called a 3-circle Venn diagram. When all three circles overlap, the overlapping parts show the elements that are either common to any two circles or they are common to all three circles.
Given below is a Venn Diagram for three sets:
In order to solve the problems on Venn diagrams with three sets, the formula is as follows:
n(A ⋃ B ⋃ C) = n(A) + n(B) + n(C) – n(A ⋂ B) – n(B ⋂ C) – n(A ⋂ C) + n(A ⋂ B ⋂ C)
Check More:
Venn Diagram Formula
[Click Here for Sample Questions]
For two sets A and B, Venn Diagram Formula is used to find the number of elements of A, B, A U B, or A ⋂ B.
| n(A U B) = n(A) + n(B) – n (A ⋂ B) |
Where
- n(A) and n(B) refer to the number of elements in A and B respectively.
- n(A U B) and n(A ⋂ B) refer to the number of elements in A U B and A ⋂ B respectively.
Venn Diagram Formula can be further extended for three sets as follows:
| n (A U B U C) = n(A) + n(B) + n(C) - n(A ⋂ B) - n(B ⋂ C) - n(C ⋂ A) + n(A ⋂ B ⋂ C) |
Thus, the Venn diagram formula is used to find the specific values involved in operations on sets.
Venn Diagram ExampleExample: There are 500 people in a Language Class. Out of them, 350 people can speak English, and 400 people can speak Hindi. How many people can speak both languages? Solution: Let us assume H is the set of people who can speak Hindi and E be the set of people who can speak English.
Using the Venn Diagram Formula, n(A U B) = n(A) + n(B) – n (A ⋂ B) n(H ∪ E) = n(H) + n(E) – n(H ∩ E) 500 = 400 + 350 – n(H ∩ E) n(H ∩ E) = 750 – 500 = 250. Thus, 250 people can speak both Hindi and English. |
Applications of Venn Diagrams
[Click Here for Sample Questions]
Venn Diagrams are widely used in several concepts in statistics, linguistics, logic, computer science, etc. Here are some important applications of Venn Diagrams:
- They help to organize the information visually to depict the relationship between sets and their operations.
- They are used to compare two or more subjects clearly and see the common and different elements between them.
- Venn diagrams are used by mathematicians in maths to solve complex equations.
- They are used to compare data sets and to find correlations.
- They are also used to reason through the logic behind certain statements or equations.
Things to Remember
- Venn Diagrams are diagrams used to depict sets, relationships between sets, and operations on sets.
- They use intersecting and non-intersecting circles to denote the relationship between sets.
- The universal set is represented by a closed rectangle that consists of all the sets represented by circles.
- Venn diagrams are used to depict the union, intersection, difference, and complement of sets.
- Venn Diagram Formula for two sets is given as n(A U B) = n(A) + n(B) – n (A ⋂ B).
- Venn Diagram Formula for three sets is n (A U B U C) = n(A) + n(B) + n(C) - n(A ⋂ B) - n(B ⋂ C) - n(C ⋂ A) + n(A ⋂ B ⋂ C).
- Venn diagrams are used in mathematics, statistics, logic, linguistics, computer science, and business.
Sample Questions
Ques. In a class of 50 students, 10 take Guitar lessons and 20 take singing classes, and 4 take both. Find the number of students who don’t take either Guitar or singing lessons. (3 Marks)
Ans. Let A = no. of students who take guitar lessons = 10.
Let B = no. of students who take singing lessons = 20.
Let C = no. of students who take both = 4.
We would subtract the value of C from A and B and the new values would be stored in D and E.
Therefore,
D = 10 – 4 = 6
E = 20 – 4 = 16
Now if we add the values of C, D, E and the unknown quantity “X”, we should be getting a total of 50.
So the final answer is X = 50 – C – D – E
X = 50 – 4 – 6 – 16
X = 24 [ Answer]
Venn’s diagrams are particularly helpful in solving word problems on number operations that involve counting. Once it is drawn for a given problem, the rest should be a piece of cake.
Ques. What are the different types of Venn Diagrams? (2 Marks)
Ans. The types of Venn diagrams are based on the number of sets or circles involved in the universal set or the rectangular space, namely:
- Two set Venn diagram
- Three see Venn diagram
- Four set Venn diagram
- Five set Venn diagram
Ques. Out of 120 students in a school, 5% can play Cricket, Chess and Carroms. If so, the number of players who can play any and only two games is 30. The number of students who can play Cricket alone is 40. What is the total number of those who can play Chess alone or Carroms alone? (3 Marks)
Ans.

We have U = 120
5% of 120 = 6
Therefore 6 students can play all three games.
Hence students who can play chess or carrom alone are = 120 - (30+40+6) = 44
Ques. At an overpriced department store, there are 112 customers. If 43 have purchased shirts, 57 have purchased pants, and 38 have purchased neither, how many purchased both shirts and pants? (2 Marks)
Ans. The total number of customers = 112
Ones who purchased shirts = 43
Ones who purchased pants = 57
Ones who didn't purchase anything = 38
The ones who purchased something = 112 - 38 = 74
The ones who purchased both shirt and pants = 43+57-74 = 26
Ques. In a group, 25 people like tea or coffee; of these, 15 like tea, and 6 like coffee and tea. How many like coffee? (2 Marks)
Ans. People like tea = 15
People like tea and coffee = 6
People who like either tea or coffee = 25
People who like only coffee = 25 - (15+6) = 4
Ques. In the Venn Diagram given below, A represents the total number of people in a town who like cricket = 1300. B represents the total number of people who like badminton = 500 and C represents the total number of people who like Tennis = 100. If AB = 9, BC = 12, AC = 13 and ABC = 2, how many people like only one game? (3 Marks)
Ans. People who play cricket A = 1300
People who like badminton B = 500
People who like Tennis C = 100
AB = 9
BC = 12
AC = 13
ABC = 2
People who like only one game = (A+B+C) - 2(AB+BC) - 2(AC+BC) - 2(AB+AC) - 3(ABC)
⇒ (1300 + 500+100) - 2(9+12) - 2(13+12) - 2(9+13) - 3(2)
⇒ 1900 - 42 - 50 - 44 - 6
⇒ 1900 - 142
⇒ 1758
Check-Out:


Comments